

Abstract
We have previously shown that deficiency of the methyl binding domain protein Mbd2 dramatically reduces adenoma burden on an ApcMin/+ background. To investigate the mechanism underlying this phenomenon, we have determined the effect of Mbd2 deficiency upon the phenotypes imposed by the conditional deletion of Apc in the small intestine. Microarray analysis demonstrated a partial suppression of the Wnt pathway in the absence of Mbd2. Mbd2 deficiency also influenced one immediate cellular consequence of Apc loss, with normalization of Paneth cell positioning. From a mechanistic perspective, we show that deficiency of Mbd2 elevates levels of the known Wnt target Lect2, and we confirm here that Mbd2 binds the Lect2 promoter in association with NuRD. Furthermore, we show that Lect2 is capable of functioning as a Wnt pathway repressor. These results therefore provide a mechanistic basis for the epigenetic control of adenoma formation mediated through Mbd2.
The mouse small intestine (SI) is covered by a simple epithelium composed of invaginations known as crypts of Lieberkühn and finger-like projections that extend into the lumen of the gut known as villi. The self-renewal of the intestinal epithelium is a continuous process in which stem cells located near the base of the crypt give rise to a population of rapidly dividing progenitor cells. There is also a continuous migration of cells from the crypt to the tip of the villus, and as cells move up the villus they stop dividing and differentiate into one of four different cell types (7).
Wnt signaling plays a key role in the development and homeostasis of the murine SI (12, 13, 23). In the absence of Wnt ligand, the cytoplasmic concentration of β-catenin is regulated by a complex of molecules which phosphorylate β-catenin, triggering ubiquitination by βTrCP and degradation in proteasomes. The degradation complex regulating β-catenin turnover contains the tumor suppressor protein APC (adenomatous polyposis coli), the scaffold protein Axin, and the serine/threonine kinase glycogen synthase kinase 3β. The pathway is activated upon Wnt ligand binding to a receptor complex composed of the frizzled receptor and a coreceptor of the low-density lipoprotein receptor-related protein family LRP5/6. The activated receptor then interacts with a cytoplasmic molecule called Dishevelled, which inhibits the activity of the destruction complex. Consequently, β-catenin is able to translocate into the nucleus and regulate transcription by associating with transcription factors of the TCF/LEF family (reviewed in reference 10).
The presence of nuclear β-catenin at the base of the crypt, adjacent to the presumptive stem cell niche, has suggested a critical role for Wnt signaling in intestinal homeostasis and stem cell maintenance (27). We have previously used conditional strategies to establish a clear requirement for functional Wnt signaling in the small intestinal crypt. Thus, deficiency of either c-Myc (18) or β-catenin (11) leads to the loss of the mutant cells and their replacement by wild-type crypts. The loss of Apc results in the nuclear relocalization of β-catenin, the rapid entry into S phase, and the formation of enlarged aberrant crypts (27). These structures are characterized by enhanced apoptosis, failed migration, and perturbed differentiation. The loss of Apc therefore immediately confers virtually all of the phenotypes associated with the very early stages of intestinal neoplasia. These phenotypes are in turn c-Myc dependent, as a combined deficiency of Apc and c-Myc results in a near-normal phenotype (26).
Deregulated Wnt signaling is a key event in intestinal cancer (12, 17, 24). Mice which are heterozygous for a mutation in Apc (ApcMin/+) develop multiple intestinal neoplasia (29). In humans, constitutive heterozygosity for Apc underlies familial adenomatous polyposis. Several groups have shown that tumorigenesis in this model is modified by DNA methylation status. For example, polyps developing in ApcMin/+ mice have been shown to be relatively hypermethylated at CpG islands compared to normal intestine, suggesting that DNA methylation is required for polyp formation (14). Furthermore, mice hypomorphic for the maintenance methylase DNMT1 show reduced adenoma burden (6). The methyl binding domain proteins, which can recognize methylated CpGs and recruit transcriptional repressors, have also been shown to influence tumorigenesis. Previously we have shown that the loss of function of one member of this family, Mbd2, strongly suppresses adenoma formation in ApcMin/+ mice (25).
In ApcMin/+ mice, the loss of heterozygosity leads to the inactivation of both alleles of Apc. Therefore, our conditional deletion of Apc in the intestine (induced Cre+ Apoflox/flox [hereinafter referred to as Apcfl/fl] mice) mimics the early events of tumorigenesis in this tissue. To further investigate the role of Mbd2 in intestinal cancer, we have now generated Cre+ Apcfl/fl Mbd2−/− mice. This strain has permitted us to analyze the consequences of Mbd2 deficiency upon the immediate effects of Apc loss. We report that the loss of Mbd2 attenuates Wnt signaling in the SI and that this is associated with a dramatic upregulation of Lect2, which we demonstrate for the first time as an in vivo Wnt target in the SI and a novel Wnt inhibitor.
MATERIALS AND METHODS
Mouse colony.
All experiments were performed according to United Kingdom Home Office regulations. AhCre+ Apcfl/fl mice were crossed with Mbd2−/− mice (9). Mice from this breeding were intercrossed to derive a colony on an outbred background.
Microarray gene chip analysis.
Eight-week-old male mice were used for the array analysis. Three mice for each of the desired genotypes in the following list were used: AhCre+ Apcfl/fl Mbd2+/+ mice, AhCre+ Apcfl/fl Mbd2−/− mice, AhCre+ Apc+/+ Mbd2−/− mice, and AhCre+ Apc+/+ Mbd2+/+ (wild-type) mice. Mice were given three injections of β-napthoflavone at 80 mg/kg of body weight to induce Cre recombination and harvested 5 days later. Three-centimeter portions of the SIs located 7 cm from the stomachs were placed in RNAlater (after removing any mesentery and ensuring that no Peyer's patches were present). The tissue was then homogenized in Trizol reagent and RNA extracted using standard phenol-chloroform methodologies. Biotinylated target cRNA was generated according to the recommended protocol supplied by the Cancer Research United Kingdom facility at the Paterson Institute for Cancer Research (http://bioinformatics.picr.man.ac.uk/mbcf/downloads/_LABELLING_PROTOCOLS). Affymetrix gene arrays using the MOE430_2 array set were run at the Cancer Research United Kingdom facility at the Paterson Institute for Cancer Research. Raw signal intensities were initially screened using the MaxD/View program (http://www.bioinf.man.ac.uk/microarray/maxd/index.html) to remove false-positive and false-negative signals (using a cutoff of at least one P value of <0.2 for each transcript). The data were then normalized by global normalization, again using the MaxD/View program. The principle of the method for the significance analysis of microarrays (30) was applied to determine the significant changes between induced AhCre+ Apcfl/fl Mbd2+/+ and induced AhCre+ Apcfl/fl Mbd2−/− samples. A δ value that produced a false-discovery rate of 20% was used to define the candidate genes. Change level analysis and rank product analysis (3) were also used to analyze the data. The raw data from this microarray are available at http://bioinf.picr.man.ac.uk/mbcf/miamevice.jsp.
Immunohistochemistry.
Tissues were fixed in 10% formalin, paraffin embedded, and sectioned into 3- to 6-μm sections for hematoxylin and eosin staining or immunohistochemistry as described previously (27). Three slides of each genotype were stained, and a negative control was performed using no primary antibody. Briefly, antigen retrieval was performed by boiling slides for 15 min in citrate buffer (Lab Vision) followed by blocking in 1.5% hydrogen peroxide for 20 min and 10% goat serum for 1 h. Slides were then incubated in the indicated primary antibodies overnight at the following dilutions: for rabbit antilysosyme, 1:500 (Dako); for mouse antibromodeoxyuridine (anti-BrdU), 1:500 (Becton Dickinson); and for mouse anti-Lect2, 1:450 (32). The peroxidase-conjugated secondary antibodies used were mouse or rabbit Envision+ (Dako). Detection was enhanced using an ABC kit (Vectastain) and visualized with 3,3′-diaminobenzidine (DAB)-positive substrate chromogen (DakoCytomation) for 5 min. All immunohistochemistry was performed on three mice of each genotype.
RT-Q-PCR.
Three mice of each genotype were harvested 5 days after exposure to β-napthoflavone and RNA was extracted from the SIs as described above. The samples used for quantitative PCR (Q-PCR) were taken from mice (three of each genotype) that differed from those used for the microarray to verify that the three samples used for the array were accurate. The concentration of RNA was measured using a nanodrop spectrometer, and 10 μg was treated with RQ DNase (Promega). Two micrograms of each DNase-treated RNA was then reverse transcribed using random hexamers (Promega) and Superscript II reverse transcriptase (RT; Invitrogen), following the manufacturers' instructions, in a final volume of 25 μl after the addition of stop solution. The cDNA was then stored at 4°C and diluted 1 in 10 with water before RT-Q-PCR amplification. For RT-Q-PCR, master mixes were prepared using Finnzymes' Sybr green, following the manufacturer's instructions, in final volumes of 25 μl in duplicates. β-Actin primers were used to equalize the data; for threshold cycle (CT) values, the 2−ΔΔCT method (15) was used to calculate the change; and Mann-Whitney U tests were performed on the ΔCT values to determine significant differences between genotypes. The following primers were used (forward primers are listed first in each pair, with reverse primers second): for Axin2, 5′-GCTCCAGAAGATCACAAAGAGC-3′ and 5′-AGCTTTGAGCCTTCAGCATC-3′; for Cited1, 5′-GATGCCAACCAGGAGATGAA-3′ and 5′-AAGGGGTGGCAGTAGGAGAG-3′; for CD44, 5′-GGCAGAAGAAAAAGCTGGTG-3′ and 5′-TCTGGGGTCTCTGATGGTTC-3′; for EphB2, 5′-AGAATGGTGCCATCTTCCAG-3′ and 5′-GCACATCCACTTCTTCAGCA-3′; for EphB3, 5′-CGTGAAAGTGGACACCATTG-3′ and 5′-CCAAGTAGAAGCCAGCCTTG-3′; for EphB4, 5′-CCTACATCAAGGTGGACACAG-3′ and 5′-CATGCAGGCTCCTTGGTC-3′; for Lect2, 5′-GCCCACTATCTTCCCAGTGA-3′ and 5′-CTGCTCAAAGAACCCAAAGG-3′; for c-Myc, 5′-TGAGCCCCTAGTGCTGCAT-3′ and 5′-AGCCCGACTCCGACCTCTT-3′; for Tiam1, 5′-CACACAATCTCTTGCCTCCA-3′ and 5′-TGCAGTTCCCCAGAGAGC-3′; and for Troy, 5′-ATCAGGTGAACAGGCCCATA-3′ and 5′-AAACCCAGCTGGTCTCTGC-3′.
Scoring apoptosis and mitosis.
Apoptosis and mitotic index were scored from hematoxylin-and-eosin-stained sections as previously described (16). For BrdU labeling, mice were injected with 0.25 ml of BrdU (Amersham) and killed after 2 or 30 h.
Paneth cell location.
Scoring of the lysozyme-positive cell position was performed on a minimum of three induced mice of each genotype (AhCre+ Apc+/+, Mbd2−/−, AhCre+ Apcfl/fl Mbd2+/+, and AhCre+ Apcfl/fl Mbd2−/−), and 25 full crypts were scored for each mouse. The numbers were then averaged for each genotype and plotted as the percentage of cells at that position that were positive for lysozyme.
Methylation-specific PCR.
Genomic DNA was prepared using the QIAamp DNA minikit (Qiagen, United Kingdom) according to the manufacturer's protocol. Bisulfite conversion of 2 μg of genomic DNA was performed using the EpiTect bisulfite kit (Qiagen) according to the manufacturer's protocol. Primers for amplifying methylated Lect2 promoter templates were LP2_143 (5′-TTTATGTATATAGGGTTATTTTCGG-3′) and LP2_144 (5′-AATAAAATCAAACAACTCTCCACG-3′). Primers for amplifying unmethylated templates were LP2_145 (5′-TTTTATGTATATAGGGTTATTTTTGG-3′) and LP2_146 (5′-CAATAAAATCAAACAACTCTCCACA-3′). PCR was performed with Platinum Taq as per the manufacturer's protocol by using a hot start at 95°C (3 min) and the following cycling parameters: 32 cycles of 95°C (30 s), 60°C (30 s), and 72°C (1 min) and 4°C to cool. PCR products (20 μl of a 50-μl total reaction mixture) were resolved on 2% agarose gels stained with ethidium bromide. UV-illuminated images were photographed with digital documentation software. For each result, the experiment was replicated twice for separate SI DNA preparations.
ChIP.
Chromatin was prepared using a mouse embryonic fibroblast cell line (Imamura, 2006). Chromatin immunoprecipitation (ChIP) was performed using the Active Motif Chip-IT express kit (Active Motif, Belgium) according to the manufacturer's instructions with the following modifications. Each ChIP reaction was performed in a total reaction mixture of 600 μl, containing 500 μl of sheared chromatin and 30 μl of ChIP buffer 1; all other components and procedures remained the same. Chromatin was immunoprecipitated using the mouse control immunoglobulin G (IgG) antibody (2 μg; Active Motif) as the negative control antibody, anti-acetylated histone H3 antibody (2 μg; Abcam, United Kingdom) as the positive control antibody, a ChIP-grade MBD2 antibody (4 μg; Abcam, United Kingdom), and antibodies against retinoblastoma-binding proteins 46 and 48 (RbAp46/RbAp48) (4 μg; Abcam, United Kingdom). All samples were amplified with the ChIP Express positive control primers and Lect2 promoter primers Lect2-400F (5′-AGTTCGACTATAATTTCATCTACCG-3′) and Lect2-400R (5′-GATAACACTGCCAGTTCCATAAA-3′), which were 400 bp upstream from the ATG site of Lect2. PCR was performed with Platinum Taq (Invitrogen, United Kingdom) as per the manufacturer's protocol by use of a hot start at 95°C (3 min) and the following cycling parameters: 36 cycles of 95°C (30 s), 60°C (30 s), and 72°C (1 min) and 4°C to cool. Each experiment was replicated three times on separate chromatin preparations.
Luciferase assays.
HEK293 cells were cultured in a 96-well plate until they were 60 to 80% confluent, and then they were transfected with 0.1 μg (100 ng) total DNA per well (n = 6). The amounts of plasmids transfected were 0.025 μg/well for Topflash, 0.025 μg/well for pcDNA-lacZ (transfection control), 0.025 μg/well for FlagAx2, and 0.025 μg/well for Lect2 vector or pcDNA3.1. The ratios were as follows: 1 part Topflash to 1 part pcDNA-lacZ and 1 part FlagAx2 to 1 part Lect2 or pcDNA3.1. The Topflash control was 0.025 μg/well Topflash, 0.025 μg/well pcDNA-lacZ, and 0.05 μg/well pcDNA3.1. Transfectin (Bio-Rad) was used according to the manufacturer's instructions. After 48 h, cells were lysed in GLO-lysis buffer (Promega) for 30 min at room temperature. One-half of the lysate of each well was mixed with an equal volume of BrightGLO substrate (Promega) for the quantitation of luciferase activity in a BMG Fluostar multiplatform plate reader using the luminescence mode, and the remainder was mixed with an equal volume of BetaGLO substrate (Promega) for the quantitation of LacZ activity, also with the luminescence mode. LacZ activity was used to normalize luciferase values.
RESULTS
The microscopic phenotype of Apc deficiency in the SI is unchanged in the absence of Mbd2.
In ApcMin/+ mice, adenomas that develop in the absence of Mbd2 are significantly smaller and are far less abundant than those seen when Mbd2 is present (25), suggesting a suppression of the deregulated Wnt signaling associated with ApcMin/+ tumorigenesis. To investigate the direct effects of Mbd2 status upon Wnt signaling, we therefore analyzed the phenotype of a conditional deletion of Apc in the context of Mbd2 deficiency. To achieve this, mice bearing a lox-flanked Apc allele were crossed onto an inducible cre transgenic background (AhCre), which uses the cytochrome p450 1A1 (CYP1A1) promoter to deliver inducible cre expression in the SI (27). AhCre+ Apcfl/fl mice were then crossed onto an Mbd2−/− background. AhCre+, AhCre+ Mbd2−/−, AhCre+ Apcfl/fl, and AhCre+ Apcfl/fl Mbd2−/− progeny were identified and subjected to three injections of β-napthoflavone within a single day at 8 to 10 weeks of age (three mice of each genotype were induced). This protocol results in virtually 100% intestinal recombination as scored by use of the Rosa26R reporter allele (27). On day 5 after induction, AhCre+ Apcfl/fl Mbd2−/− and AhCre+ Apcfl/fl mice became visibly ill and were killed. In contrast, AhCre+ mice showed no symptoms of illness.
At day 5, induced AhCre+ Apcfl/fl mice were characterized by enlarged, aberrant crypts (Fig. 1C), and most aspects of this phenotype were retained in induced AhCre+ Apcfl/fl Mbd2−/− mice (Fig. 1D). To examine cell division and migration, mice were killed 2 h or 30 h after injection with BrdU. BrdU is incorporated into the DNA of cells at S phase and is bioavailable for less than 2 h. Therefore, by killing mice at 2 h and 30 h after exposure, we were able to track the movement of BrdU-positive cells from the proliferation zone in the crypt on to the villus by immunohistochemistry (Fig. 1E and F). The position of BrdU-positive cells was also plotted as the cumulative frequency of cells 2 h and 30 h after labeling (Fig. 1I to K). As observed previously (27), migration of cells along the crypt-villus axis is perturbed in induced AhCre+ Apcfl/fl mice and cell proliferation occurs independently of position (Fig. 1J). These phenotypes are also observed in the induced AhCre+ Apcfl/fl Mbd2−/− mice (Fig. 1G, H, and K).
FIG. 1.

The microscopic phenotypes observed for the SIs of induced AhCre+ Apcfl/fl mice are still present with the additional absence of Mbd2. Hematoxylin and eosin staining showing no gross microscopic histological differences between wild-type (induced AhCre+ Apc+/+ Mbd2+/+ [wt]) (A) and Mbd2-deficient (induced AhCre+ Apc+/+ Mbd2−/−) (B) intestines or between Apcfl/fl (induced AhCre+ Apcfl/fl Mbd2+/+) (C) and Apcfl/fl Mbd2−/− (induced AhCre+ Apcfl/fl Mbd2−/−) (D) SIs. Note the enlarged crypts in the Apc-deficient mice (C), which are still observed for the double mutant (D). (E to H) Mice were injected with BrdU to mark cells in S phase and track migration. BrdU-positive cells were located in the proliferation zones of induced AhCre+ mice 2 h after injection (E) and had migrated onto the villi 30 h later (F). These data were plotted as the position of BrdU-positive cells (with 0 being the base of the crypt) 2 h (bold line) and 30 h (thin line) after labeling (I to K). (J) BrdU-positive cells are found throughout the aberrant crypts of induced AhCre+ Apcfl/fl mice 2 h after injection (solid line), and they fail to migrate on the villi when observed 30 h after injection (dotted line). (G, H, and K) Migration is still absent from induced AhCre+ Apcfl/fl Mbd2−/−. (L) The number of apoptotic figures per crypt was significantly increased (P = 0.04; Mann-Whitney U test; n = 3) upon the loss of Apc (induced AhCre+ Apcfl/fl), and this phenotype is still observed with the additional loss of Mbd2. (M) The number of mitotic figures per crypt was also significantly increased (P = 0.04; Mann-Whitney U test; n = 3) upon the loss of Apc (induced AhCre+ Apcfl/fl), and again this phenotype is still observed with the additional loss of Mbd2.
Both apoptosis and mitosis are significantly increased in the SIs of induced AhCre+ Apcfl/fl mice compared to what is seen for induced AhCre+ mice, and this phenotype was also retained in induced AhCre+ Apcfl/fl Mbd2−/− mice (Fig. 1L and M).
The absence of Mbd2 reduces the expression of Wnt targets when Apc is deleted in the SI.
Microarray analysis was used to determine if deficiency of Mbd2 altered the expression of Wnt target genes upon the conditional loss of Apc in the SI, and a number of these were validated by RT-Q-PCR (Fig. 2; also see Table S1 in the supplemental material). RNA samples were derived from induced mice (three of each genotype) 5 days after exposure to β-napthoflavone, and microarray data were analyzed using change level, rank product (3), and significance analysis of microarrays (30). As previously observed, the loss of Apc in the SI results in the upregulation of many previously identified Wnt target genes (27), including Axin2, Musashi, and c-Myc (Fig. 2; also see Table S1 in the supplemental material). However, the expression of 21.5% (14/65) of these Wnt targets was reduced with the additional absence of Mbd2 (see Table S1 in the supplemental material). Twelve of the 14 Wnt target genes (85.7%) were further analyzed by Q-PCR, and 11 of these 12 displayed the same trend in expression as the array, although the changes in expression were more marked in the microarray (Fig. 2; also see Table S1 in the supplemental material). The samples used for Q-PCR were taken from mice (three of each genotype) different from those used for the microarray to verify that the three samples used for the array were accurate. The Mbd2-mediated attenuation of the Wnt pathway appears specific to a subset of genes deregulated following Apc loss, as the expression levels of some Wnt target genes, including Tiam1 and Troy, are unchanged upon the additional absence of Mbd2 (Fig. 2).
FIG. 2.

RT-Q-PCR analysis of Wnt targets in the SI. The expression of Wnt target genes is significantly increased (P = 0.04; Mann-Whitney U test; n = 3) when Apc is removed from the SI (induced AhCre+ Apcfl/fl [black bars]), and the levels of expression of some of these genes are reduced with the additional absence of Mbd2 (induced AhCre+ Apcfl/fl Mbd2−/− [hatched bars]). There is no change in Wnt target expression between induced AhCre+ and induced Mbd2−/− mice (white bars). Asterisks mark a significant difference between induced AhCre+ Apcfl/fl and induced AhCre+ Apcfl/fl Mbd2−/− mice (P = 0.04; Mann-Whitney U test; n = 3).
Of particular interest is the expression of the Eph receptors, which have been implicated as key determinants of Paneth cell location along the crypt-villus axis (1). The expression of EphB2, EphB3, and EphB4 is immediately increased following the loss of Apc, confirming them as Wnt target genes in the SI (Fig. 2). In the additional absence of Mbd2, these receptors are not elevated to the same extent, and they are significantly reduced in the case of EphB3 and EphB4 (Fig. 2) (P = 0.04; Mann-Whitney U test; n = 3).
The mislocalization of Paneth cells following the loss of Apc is rescued by a deficiency of Mbd2.
Given the observed attenuation of EphB receptor expression in the absence of Mbd2, we performed lysozyme staining to investigate Paneth cell localization. Paneth cells are normally located at the base of the crypt in the SIs of wild-type mice but are mislocalized throughout the aberrant crypt of induced AhCre+ Apcfl/f mice (Fig. 3).
FIG. 3.

Paneth cells are not mislocalized in induced AhCre Apcfl/fl Mbd2−/− intestine. (A and B) Lysozyme-positive cells are located at the base of the crypt in induced AhCre+ mice (A) and mislocalized throughout the aberrant crypts of induced AhCre+ Apcfl/fl mice (B). (C) With the additional loss of Mbd2 (induced AhCre+ Apcfl/fl Mbd2−/−), Paneth cells are not mislocalized to the same extent. (D) Lysozyme-positive cells were counted and plotted as a percentage of positive cells at that position, with position 1 indicating the base of the crypt. The red line represents induced AhCre+ Apcfl/fl mice (n = 6), and the light blue line represents the induced AhCre+ Apcfl/fl Mbd2−/− mice (n = 3). There are significantly fewer mislocalized cells in the induced AhCre+ Apcfl/fl Mbd2−/− mice than in the induced AhCre+ Apcfl/fl mice (P = 0.01; Kolmogorov-Smirnov test). The gap between these lines demonstrates the significant increase in the number of Paneth cells found away from the base of the crypt in the induced AhCre+ Apcfl/fl mice compared to what was seen for the induced AhCre+ Apcfl/fl Mbd2−/− mice (P = 0.01; Kolmogorov-Smirnov test). There is no significant difference (P = 0.001; Kolmogorov-Smirnov test; n = 3) in Paneth cell location between induced AhCre+ mice (navy blue line) Mbd2−/− mice (pink line).
The position of Paneth cells along the crypt-villus axis was plotted as the percentage of cells at that position that were positive for lysozyme (Fig. 3D). In induced AhCre+ mice, 94% of the cells at the base of the crypt were positive for lysozyme, as were 80.7% of the cells at position 2 relative to the crypt base (Fig. 3A and D). Lysozyme positivity was infrequently observed above position 5. Almost identical data were obtained for induced AhCre+ Mbd2−/− SIs, demonstrating that a deficiency of Mbd2 alone does not alter Paneth cell localization (Fig. 3D). In induced AhCre+ Apcfl/fl intestines, only 62% of the cells at the base of the crypt were positive for lysozyme, and 44% were so at position 2. Furthermore, lysozyme-positive cells were frequently observed along the length of the aberrant crypt-villus axis (Fig. 3B and D).
An additional absence of Mbd2 (induced AhCre+ Apcfl/fl Mbd2−/− mice) significantly reduced the distribution of Paneth cells that were mislocalized along the crypt-villus (Kolmogorov-Smirnov test; P = 0.001), with the percentages of Paneth cells at positions 1 and 2 rising to 83% and 57%, respectively. This normalization of Paneth cell positioning in the absence of Mbd2 is consistent with the reduced deregulation of the Eph receptor transcript levels—a phenotype we have also observed previously with the conditional loss of c-Myc (26).
Deficiency of Mbd2 elevates the levels of Lect2 when Apc is removed in the SI.
As Mbd2 mediates transcriptional repression (20), the loss of repressor activity would be predicted to result in an increase in gene transcription. However, we observe a reduction in the expression of a number of Wnt target genes (Fig. 2). This suggests that Mbd2 may normally repress an inhibitor of Wnt signaling, such that a deficiency of Mbd2 derepresses the inhibitor and so reduces the activity of the Wnt pathway. Analysis of the gene chip array suggested that the gene for leukocyte cell-derived chemotaxin 2 (Lect2) might be a good candidate for such a repressor, as it showed one of the highest increases in expression between induced AhCre+ Apcfl/fl and induced AhCre+ Apcfl/fl Mbd2−/− mice (see Table S1 in the supplemental material). Lect2 homologues are found throughout the vertebrate subphylum and Lect2 was originally identified in a screen for novel chemokines (33). However, relatively little is known about its function except for its role in the liver as a regulator of NK T-cell homeostasis (33).
To functionally confirm that Mbd2 was acting to repress the Lect2 promoter in vivo, we examined the expression of Lect2 in wild-type and Mbd2-deficient mice via RT-Q-PCR and immunohistochemistry (Fig. 4). Lect2 has previously been identified as a Wnt target in the liver (22), and here we have confirmed it as a Wnt target in the murine SI for the first time by use of microarray analysis (see Table S1 in the supplemental material) and RT-Q-PCR (Fig. 4A). These indicated a 25-fold increase in Lect2 expression following Apc loss, which was significantly increased with the additional absence of Mbd2 (Fig. 4A). A deficiency of Mbd2 alone did not increase Lect2 expression levels, and no differences between control and induced AhCre+ Mbd2−/− mice were observed. This indicates that the Mbd2 status becomes relevant to Lect2 transcriptional activity only in the context of activated Wnt signaling. We next confirmed these changes at the protein level using immunohistochemistry. Compared to what was seen for wild-type intestinal tissue (Fig. 4B), levels of Lect2 were elevated in Apc-deficient tissues (Fig. 4D) and were further increased with the additional absence of Mbd2 (Fig. 4E).
FIG. 4.

Lect2 is upregulated after the loss of Apc, and its expression is increased upon the additional loss of Mbd2. (A) Lect2 is significantly upregulated (P = 0.01; Mann-Whitney U test; n = 3) in the SI after the loss of Apc (induced AhCre+ Apcfl/fl [black bar]) and significantly increased further (P = 0.01; Mann-Whitney U test; n = 3) with the additional loss of Mbd2 (induced AhCre+ Apcfl/fl Mbd2−/− [hatched bar]). There is no significant change in the expression levels of Lect2 in Mbd2−/− mice (induced AhCre+ Apc+/+ Mbd2−/− [white bar]) and wild-type (Wt) mice (induced AhCre+ Apc+/+ Mbd2+/+). (B and C) Immunohistochemistry demonstrates that Lect2 protein is expressed at very low levels in the cytoplasms of induced AhCre+ (B) and induced AhCre+ Mbd2−/− (C) SIs. (D and E) Lect2 is upregulated in induced AhCre+ Apcfl/fl SI but only in recombinant cells thereof (D), and expression is elevated with the additional absence of Mbd2 (induced AhCre+ Apcfl/fl Mbd2−/−) (E).
The Lect2 promoter region is methylated.
Mbd2 recognizes and binds to methylated CpG islands (8). Therefore, if Mbd2 is inhibiting the expression of Lect2, then the promoter region of Lect2 would be predicted to be methylated. To investigate this, we performed methylation-specific PCR. Methylated and unmethylated specific primers were used to amplify a region of the Lect2 promoter immediately upstream of the ATG codon. A product was obtained only for the methylation-specific primer set (Fig. 5A), indicating that the two CpG dinucleotides present in the primer binding region, and potentially the two within the amplified product, are methylated. Further sequencing of bisulfite conversion of the 1-kb upstream region of the Lect2 promoter revealed that there are 13 CpGs. Of the 10 CpGs analyzed for methylation, 8 were methylated and the other 2 were partially methylated (Fig. 5B).
FIG. 5.

Lect2 is a Wnt inhibitor, and its promoter region is methylated and binds Mbd2 and RbAp46/48. (A) Methylation-specific PCR. Lanes 1 to 10 contained bisulfite-converted DNA prepared from the SIs of six individual wild-type mice; lane 11 contained water. Paired methylation-sensitive PCR was performed on all samples by use of either methylated (M) or unmethylated (U) specific primers. For all six mice, products were amplified by use of the methylation-specific primers for the Lect2 promoter region, and no products were amplified using the unmethylated primers. (B) Sequence analysis of a bisulfide-converted region of the Lect2 promoter region revealed that it contained 13 CpGs, 8 of which were methylated (black circles) and 2 of which were partially methylated (open circles). The remaining three were not analyzed (no circles). (C) PCR was performed using primers for the Lect2 promoter on DNA immunoprecipitated using antibodies (Ab) specific for RbAp46/48 and Mbd2. The Lect2 promoter was associated with Mbd2 and RbAp46/48 in cultured HCT116 cells, and this binding was absent for HCT116 cells stably transfected with shMbd2. Positive control primers for Kiaso were able to amplify products in both cell lines. (D) RT-Q-PCR was performed using human Mbd2-specific primers on HCT116 cells and HCT116 cells stably transfected with siRNA toward Mbd2. Mbd2 transcripts were significantly reduced (P = 0.01; Mann-Whitney U test; n = 3) in cells transfected with Mbd2 siRNA. (E) PCR was performed on ChIP DNA with either positive control primers for EF1α (233 bp) (lanes 1 to 5) or primers specific for a methylated region of the Lect2 promoter (120 bp) (lanes 6 to 10). Lanes 1 and 6 contained input DNA, and both sets of primers were able to amplify a product. Lanes 2 and 7 were negative controls with ChIP DNA pulled down using an IgG antibody. Lanes 3 and 8 contained ChIP DNA pulled down with a histone antibody as a positive control, and both sets of primers amplified a product. Lanes 4 and 9 contained ChIP DNA with an Mbd2 antibody, and only the Lect2 promoter primers amplified a product, demonstrating that Mbd2 was bound to this region of the Lect2 promoter but not to EF1α. (F) Topflash was activated by transfection of ΔNLRP, FlagAx2, ΔNβ-catenin, or VP16-TCF4 in 293 cells (white bars). Black bars represent cotransfections of Topflash activators with Lect2 (plotted as percentages of the control value), all of which were significantly reduced (t test; n = 6; the ΔNLRP P value was 0.0038; the FlagAx2 P value was 0.0002; the ΔNβ-catenin P value was 0.0194; the VP16-TCF4 P value was 0.0055). (G) Wnt activators are unable to induce luciferase transcription from the mutated TCF sites in FOPLASH. Topflash (black bars) was activated by transfection of ΔNLRP, FlagAx2, ΔNβ-catenin, or VP16-TCF4 in 293 cells, but these constructs were unable to activate FOPLASH (white bars), demonstrating that the luciferase activity observed for Topflash is TCF site (WCAAWGG) specific. human Mbd2-specific primers on HCT116 cells and HCT116 cells stably transfected with siRNA toward Mbd2. Mbd2 transcripts were significantly reduced (P = 0.01; Mann-Whitney U test; n = 3) in cells transfected with Mbd2 siRNA. (E) PCR was performed on ChIP DNA with either positive control primers for EF1α (233 bp) (lanes 1 to 5) or primers specific for a methylated region of the Lect2 promoter (120 bp) (lanes 6 to 10). Lanes 1 and 6 contained input DNA, and both sets of primers were able to amplify a product. Lanes 2 and 7 were negative controls with ChIP DNA pulled down using an IgG antibody. Lanes 3 and 8 contained ChIP DNA pulled down with a histone antibody as a positive control, and both sets of primers amplified a product. Lanes 4 and 9 contained ChIP DNA with an Mbd2 antibody, and only the Lect2 promoter primers amplified a product, demonstrating that Mbd2 was bound to this region of the Lect2 promoter but not to EF1α. (F) Topflash was activated by transfection of ΔNLRP, FlagAx2, ΔNβ-catenin, or VP16-TCF4 in 293 cells (white bars). Black bars represent cotransfections of Topflash activators with Lect2 (plotted as percentages of the control value), all of which were significantly reduced (t test; n = 6; the ΔNLRP P value was 0.0038; the FlagAx2 P value was 0.0002; the ΔNβ-catenin P value was 0.0194; the VP16-TCF4 P value was 0.0055). (G) Wnt activators are unable to induce luciferase transcription from the mutated TCF sites in FOPLASH. Topflash (black bars) was activated by transfection of ΔNLRP, FlagAx2, ΔNβ-catenin, or VP16-TCF4 in 293 cells, but these constructs were unable to activate FOPLASH (white bars), demonstrating that the luciferase activity observed for Topflash is TCF site (WCAAWGG) specific.
To demonstrate that Mbd2 was capable of binding to the methylated CpG dinucleotides within the Lect2 promoter in vivo, we performed ChIP using DNA isolated from mouse SI. The positive control primers (EF1α) and Lect2 primers (400 bp upstream from the ATG of the Lect2 gene) were both able to amplify products from the input chromatin (Fig. 5C, lanes 1 and 5), and both were unable to amplify a product in the negative control chromatin pulled down using an IgG antibody (Fig. 5C, lanes 2 and 6). The positive control ChIP using the H3 antibody gave products with both primer sets, indicating that both regions were bound to the H3 histone as expected (Fig. 5C, lanes 3 and 7). ChIP performed using the Mbd2 antibody was amplified only by the Lect2 primers (Fig. 5C, lanes 4 and 8), demonstrating that Mbd2 binds to the Lect2 promoter and suggesting that Lect2 is repressed by Mbd2 in vivo. A region 1 kb upstream of the Lect2 gene was also analyzed and showed a similar pattern (data not shown).
The Lect2 promoter binds Mbd2 and NuRD to inhibit Lect2 expression.
Upon binding to methylated DNA, Mbd2 facilitates the binding of transcriptional repression complexes such as Sin3A/histone deacetylase or nucleosome remodeling and deacetylase (NuRD) to form the MeCP1 complex (20, 34). To determine if Mbd2 recruits transcriptional repression complexes to the Lect2 promoter, we performed ChIP with human colorectal cells (HCT116) by use of RbAp46 and RbAp48 antibodies, which recognize integral components of NuRD and the corepressor Sin3a (34). We also performed ChIP with Mbd2-depleted HCT116 cells which were stably transfected with small interfering RNA (siRNA) against Mbd2 (2). These Mbd2-depleted cells displayed a 4.5-fold reduction in Mbd2 transcript levels compared to what was seen for HCT116 cells (Fig. 5D). ChIP for the input chromatin and positive control both bound to the Lect2 promoter in the wild-type HCT116 cells (Fig. 5E, lanes 1 and 4) and the Mbd2-depleted cells (Fig. 5E, lanes 5 and 8). Mbd2, RbAp46, and RbAp48 were associated with the Lect2 promoter in HCT116 cells (Fig. 5E, lanes 2 and 3) but did not bind the Lect2 promoter in Mbd2-depleted cells (Fig. 5E, lanes 6 and 7). Thus, Mbd2 facilitates the binding of the transcriptional repressor complexes to the Lect2 promoter.
Lect2 is a Wnt inhibitor.
To determine if Lect2 was able to inhibit Wnt signaling, luciferase assays were performed in 293 cells by use of the Wnt-responsive Topflash system. Topflash was cotransfected with one of four known Wnt pathway transducers, namely, ΔNLRP6 (constitutively active LRP6 receptor [4]), FlagAx2 (which prevents glycogen synthase kinase 3β binding to Axin, therefore preventing the phosphorylation of β-catenin [28]), ΔN β-catenin (constitutively active form of β-catenin [19]), and TCF4-VP16 (constitutively active form of TCF4 [31]), resulting in luciferase transcription from Topflash (Fig. 5F). The same cotransfections were performed in the presence of Lect2, resulting in a reduction in Wnt-induced Topflash activation from all four of the Wnt pathway activators (Fig. 5F). The activation of Topflash by the Wnt transducers was confirmed to be via the Wnt-responsive TCF sites by using FOPLASH, a mutated version of Topflash. All four Wnt transducers were unable to activate FOPLASH when cotransfected, demonstrating that the activity of Topflash is via the TCF sites mutated in FOPLASH (Fig. 5G). The four Wnt transducers used represented the Wnt pathway from the receptor (LRP) through to the degradation complex (Axin2), β-catenin, and finally transcription factor TCF4 (full-length TCF4 fused to VP16). As Lect2 is able to inhibit the action of the Wnt pathway at the level of the transcription factor TCF4, it seems likely that the repression observed by the remaining three Wnt pathway activators occurs due to the repression of TCF4, which they all eventually require to activate Topflash.
DISCUSSION
Mbd2 deficiency attenuates Wnt signaling following the loss of Apc.
Taken together, these data allow us to build a model of how Mbd2 deficiency may repress tumorigenesis in ApcMin/+ mice (25). We show that Mbd2 deficiency attenuates the expression of a set of Wnt target genes immediately following Apc loss in the SIs of induced AhCre+ Apcfl/fl mice (Fig. 2; also see Table S1 in the supplemental material). These observations argue that functional Mbd2 is required to mediate the full effects of Wnt activation in the absence of Apc and therefore provides a possible explanation for the attenuated tumorigenesis seen in the absence of Mbd2.
Given that the loss of Mbd2 is able to significantly increase the life span of ApcMin/+ mice (25), it was somewhat surprising that we observed only one change in the induced AhCre+ Apcfl/fl phenotype when Mbd2 was absent, i.e., the relocalization of Paneth cells to the base of the crypt (Fig. 3). We speculate that this phenotype is associated with a reduction in the transcription of Paneth cell determinants EphB3/B4 (Fig. 2). The location of Paneth cells can be used as a phenotypic assay of Wnt signaling in the murine SI. Eph receptors have been strongly implicated in Paneth cell positioning, with Paneth cells mislocalized in EphB3 null mutant mice (1). The expression of Eph receptor transcripts in the intestine is dependent on Wnt/c-Myc signaling (26), which is consistent with the reduced expression of Wnt targets we observed for induced AhCre Apcfl/fl Mbd2−/− mice (Fig. 2; also see Table S1 in the supplemental material). Thus, in our model activated Wnt signaling (induced AhCre+ Apcfl/fl) results in the mislocalization of Paneth cells, and the additional loss of Mbd2 (induced AhCre Apcfl/fl Mbd2−/−) results in the partial inhibition of the Wnt pathway, as observed by the rescue of the mislocalized Paneth cell phenotype (Fig. 3) in association with a reduction in EphB3 transcription (Fig. 2).
It has been suggested that the high levels of Eph receptor in the initial polyp-forming cells at the crypt-villus junction encounter high levels of ephrin expression, therefore causing them to invaginate and form a polyp (1, 5, 21). We speculate that the reduction in Eph transcription observed for induced AhCre Apcfl/fl Mbd2−/− intestine may be critical for this interaction with the ephrins, as the repulsion between the Ephs and ephrins may not be sufficient to cause the initial invagination required for polyp formation. This provides a direct potential mechanism for reduced adenoma formation in an Mbd2-deficient environment of attenuated Eph activation.
Lect2 is upregulated when Apc is removed in the absence of Mbd2 and is a novel Wnt inhibitor.
Mbd2 binds to methylated CpG islands and mediates transcriptional repression (8, 20). However, the loss of Mbd2 in induced AhCre+ Apcfl/fl mice leads to a decrease in the expression of Wnt target genes (Fig. 2; also see Table S1 in the supplemental material). We hypothesize that this is due to deregulation of a Wnt repressor, but all the reported Wnt repressors either show no change or, in the case of Axin2 and Wif1, are downregulated in induced AhCre+ Apcfl/fl Mbd2−/− tissues (see Table S1 in the supplemental material). One of the few genes upregulated when Apc was removed in the absence of Mbd2 was Lect2 (Fig. 4). This deregulation is a direct result of loss of Mbd2, as analysis of the Lect2 promoter demonstrated that it was methylated (Fig. 5A) and binds Mbd2 (Fig. 5C) and the transcriptional repressor NuRD (Fig. 5E). Thus, when Mbd2 is absent in the presence of active Wnt signaling (induced AhCre+ Apcfl/fl Mbd2−/−), Lect2 is deregulated and its expression levels increase (Fig. 4).
To determine if Lect2 functions as a Wnt repressor, we performed luciferase assays using Topflash by cotransfecting Lect2 with four different activators of the Wnt pathway (Fig. 5F). Using this technique, we were able to demonstrate for the first time that Lect2 was indeed a Wnt inhibitor that was able to significantly reduce Wnt signaling via all four activators, namely, ΔNLRP6, FlagAx2, ΔN β-catenin, and TCF4-VP16. The observation of activity against all these activators indicates that Lect2 is working at (or below) the level of the TCF4 transcription factor. This is consistent with the accepted hierarchy within the Wnt pathway and with the observed effect of Mbd2 deficiency upon a subset of Wnt targets. Given that we were activating the Wnt pathway by conditional deletion of Apc, our assay would have been unlikely to identify any inhibitory effect of Lect2 operating at either the receptor level or the level of the β-catenin degradation/phosphorylation complex. Furthermore, an inhibitory effect of Lect2 at the level of β-catenin would have been predicted to yield effects upon Wnt targets that are more widespread than those we observed. β-Catenin associates with members of the TCF/LEF family of transcription factors, one of which, TCF4, was used in our luciferase assay. If Lect2 perturbs Wnt signaling at (or below) the level of TCF4, β-catenin can still associate with other transcription factors to activate target genes. In this way, only a partial inhibition of Wnt targets would occur, as we observed for the absence of Mbd2.
In summary, we have sought to elucidate the molecular mechanisms by which Mbd2 deficiency attenuates adenoma formation in the intestine. Microarray analysis of whole intestines immediately following the loss of Apc reveals a signature of reduced Wnt signaling in the absence of Mbd2. Most notably, we observed reduced expression of the Eph Wnt target genes and phenotypes consistent with attenuated Eph expression. Given that Mbd2 binds to methylated CpG regions of DNA (20) and functions as a transcriptional repressor, we have identified those genes which show upregulation in the absence of Mbd2. Key among these is Lect2, the promoter of which we now show to be a direct binding target of Mbd2 and the NuRD complex. Furthermore, we also establish Lect2 as a negative regulator of the Wnt pathway, thereby establishing a direct mechanism for the suppression of adenoma formation in the absence of Mbd2 (Fig. 6).
FIG. 6.
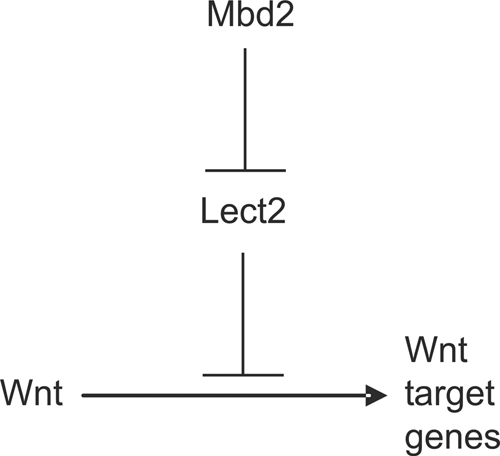
Mbd2 protein, in association with the transcriptional repressor NuRD, binds to the promoter of the Wnt inhibitor Lect2 to regulate its expression. Subsequently, the loss of Mbd2 deregulates the expression of Lect2, resulting in a reduction in the expression levels of Wnt target genes.
Supplementary Material
Acknowledgments
Many thanks are given to Satoshi Yamagoe for kindly supplying the Lect2 antibody and the Lect2 cDNA and also to Adrian Bird for the HCT116 cells stably transfected with Mbd2 siRNA.
This work was funded by the BBSRC and CRUK.
Footnotes
Published ahead of print on 21 July 2008.
Supplemental material for this article may be found at http://mcb.asm.org/.
REFERENCES
- 1.Batlle, E., J. T. Henderson, H. Beghtel, M. M. van den Born, E. Sancho, G. Huls, J. Meeldijk, J. Robertson, M. van de Wetering, T. Pawson, and H. Clevers. 2002. Beta-catenin and TCF mediate cell positioning in the intestinal epithelium by controlling the expression of EphB/ephrinB. Cell 111251-263. [DOI] [PubMed] [Google Scholar]
- 2.Berger, J., O. Sansom, A. Clarke, and A. Bird. 2007. MBD2 is required for correct spatial gene expression in the gut. Mol. Cell. Biol. 274049-4057. [DOI] [PMC free article] [PubMed] [Google Scholar]
- 3.Breitling, R., P. Armengaud, A. Amtmann, and P. Herzyk. 2004. Rank products: a simple, yet powerful, new method to detect differentially regulated genes in replicated microarray experiments. FEBS Lett. 57383-92. [DOI] [PubMed] [Google Scholar]
- 4.Brennan, K., J. M. Gonzalez-Sancho, L. A. Castelo-Soccio, L. R. Howe, and A. M. Brown. 2004. Truncated mutants of the putative Wnt receptor LRP6/Arrow can stabilize beta-catenin independently of Frizzled proteins. Oncogene 234873-4884. [DOI] [PMC free article] [PubMed] [Google Scholar]
- 5.Chang, W. W. 1982. Morphological basis of multistep process in experimental colonic carcinogenesis. Virchows Arch. B 4117-37. [DOI] [PubMed] [Google Scholar]
- 6.Eads, C. A., A. E. Nickel, and P. W. Laird. 2002. Complete genetic suppression of polyp formation and reduction of CpG-island hypermethylation in Apc(Min/+) Dnmt1-hypomorphic mice. Cancer Res. 621296-1299. [PubMed] [Google Scholar]
- 7.Heath, J. P. 1996. Epithelial cell migration in the intestine. Cell Biol. Int. 20139-146. [DOI] [PubMed] [Google Scholar]
- 8.Hendrich, B., and A. Bird. 1998. Identification and characterization of a family of mammalian methyl-CpG binding proteins. Mol. Cell. Biol. 186538-6547. [DOI] [PMC free article] [PubMed] [Google Scholar]
- 9.Hendrich, B., J. Guy, B. Ramsahoye, V. A. Wilson, and A. Bird. 2001. Closely related proteins MBD2 and MBD3 play distinctive but interacting roles in mouse development. Genes Dev. 15710-723. [DOI] [PMC free article] [PubMed] [Google Scholar]
- 10.Hoppler, S., and C. L. Kavanagh. 2007. Wnt signalling: variety at the core. J. Cell Sci. 120385-393. [DOI] [PubMed] [Google Scholar]
- 11.Ireland, H., R. Kemp, C. Houghton, L. Howard, A. R. Clarke, O. J. Sansom, and D. J. Winton. 2004. Inducible Cre-mediated control of gene expression in the murine gastrointestinal tract: effect of loss of beta-catenin. Gastroenterology 1261236-1246. [DOI] [PubMed] [Google Scholar]
- 12.Korinek, V., N. Barker, P. Moerer, E. van Donselaar, G. Huls, P. J. Peters, and H. Clevers. 1998. Depletion of epithelial stem-cell compartments in the small intestine of mice lacking Tcf-4. Nat. Genet. 19379-383. [DOI] [PubMed] [Google Scholar]
- 13.Kuhnert, F., C. R. Davis, H. T. Wang, P. Chu, M. Lee, J. Yuan, R. Nusse, and C. J. Kuo. 2004. Essential requirement for Wnt signaling in proliferation of adult small intestine and colon revealed by adenoviral expression of Dickkopf-1. Proc. Natl. Acad. Sci. USA 101266-271. [DOI] [PMC free article] [PubMed] [Google Scholar]
- 14.Laird, P. W., L. Jackson-Grusby, A. Fazeli, S. L. Dickinson, W. E. Jung, E. Li, R. A. Weinberg, and R. Jaenisch. 1995. Suppression of intestinal neoplasia by DNA hypomethylation. Cell 81197-205. [DOI] [PubMed] [Google Scholar]
- 15.Livak, K. J., and T. D. Schmittgen. 2001. Analysis of relative gene expression data using real-time quantitative PCR and the 2(-delta delta C(T)) method. Methods 25402-408. [DOI] [PubMed] [Google Scholar]
- 16.Merritt, A. J., T. D. Allen, C. S. Potten, and J. A. Hickman. 1997. Apoptosis in small intestinal epithelial from p53-null mice: evidence for a delayed, p53-independent G2/M-associated cell death after gamma-irradiation. Oncogene 142759-2766. [DOI] [PubMed] [Google Scholar]
- 17.Morin, P. J., A. B. Sparks, V. Korinek, N. Barker, H. Clevers, B. Vogelstein, and K. W. Kinzler. 1997. Activation of beta-catenin-Tcf signaling in colon cancer by mutations in beta-catenin or APC. Science 2751787-1790. [DOI] [PubMed] [Google Scholar]
- 18.Muncan, V., O. J. Sansom, L. Tertoolen, T. J. Phesse, H. Begthel, E. Sancho, A. M. Cole, A. Gregorieff, I. M. de Alboran, H. Clevers, and A. R. Clarke. 2006. Rapid loss of intestinal crypts upon conditional deletion of the Wnt/Tcf-4 target gene c-Myc. Mol. Cell. Biol. 268418-8426. [DOI] [PMC free article] [PubMed] [Google Scholar]
- 19.Munemitsu, S., I. Albert, B. Rubinfeld, and P. Polakis. 1996. Deletion of an amino-terminal sequence beta-catenin in vivo and promotes hyperphosporylation of the adenomatous polyposis coli tumor suppressor protein. Mol. Cell. Biol. 164088-4094. [DOI] [PMC free article] [PubMed] [Google Scholar]
- 20.Ng, H. H., Y. Zhang, B. Hendrich, C. A. Johnson, B. M. Turner, H. Erdjument-Bromage, P. Tempst, D. Reinberg, and A. Bird. 1999. MBD2 is a transcriptional repressor belonging to the MeCP1 histone deacetylase complex. Nat. Genet. 2358-61. [DOI] [PubMed] [Google Scholar]
- 21.Oshima, H., M. Oshima, M. Kobayashi, M. Tsutsumi, and M. M. Taketo. 1997. Morphological and molecular processes of polyp formation in Apc(delta716) knockout mice. Cancer Res. 571644-1649. [PubMed] [Google Scholar]
- 22.Ovejero, C., C. Cavard, A. Perianin, T. Hakvoort, J. Vermeulen, C. Godard, M. Fabre, P. Chafey, K. Suzuki, B. Romagnolo, S. Yamagoe, and C. Perret. 2004. Identification of the leukocyte cell-derived chemotaxin 2 as a direct target gene of beta-catenin in the liver. Hepatology 40167-176. [DOI] [PubMed] [Google Scholar]
- 23.Pinto, D., A. Gregorieff, H. Begthel, and H. Clevers. 2003. Canonical Wnt signals are essential for homeostasis of the intestinal epithelium. Genes Dev. 171709-1713. [DOI] [PMC free article] [PubMed] [Google Scholar]
- 24.Polakis, P. 1999. The oncogenic activation of beta-catenin. Curr. Opin. Genet. Dev. 915-21. [DOI] [PubMed] [Google Scholar]
- 25.Sansom, O. J., J. Berger, S. M. Bishop, B. Hendrich, A. Bird, and A. R. Clarke. 2003. Deficiency of Mbd2 suppresses intestinal tumorigenesis. Nat. Genet. 34145-147. [DOI] [PubMed] [Google Scholar]
- 26.Sansom, O. J., V. S. Meniel, V. Muncan, T. J. Phesse, J. A. Wilkins, K. R. Reed, J. K. Vass, D. Athineos, H. Clevers, and A. R. Clarke. 2007. Myc deletion rescues Apc deficiency in the small intestine. Nature 446676-679. [DOI] [PubMed] [Google Scholar]
- 27.Sansom, O. J., K. R. Reed, A. J. Hayes, H. Ireland, H. Brinkmann, I. P. Newton, E. Batlle, P. Simon-Assmann, H. Clevers, I. S. Nathke, A. R. Clarke, and D. J. Winton. 2004. Loss of Apc in vivo immediately perturbs Wnt signaling, differentiation, and migration. Genes Dev. 181385-1390. [DOI] [PMC free article] [PubMed] [Google Scholar]
- 28.Smalley, M. J., E. Sara, H. Paterson, S. Naylor, D. Cook, H. Jayatilake, L. G. Fryer, L. Hutchinson, M. J. Fry, and T. C. Dale. 1999. Interaction of axin and Dvl-2 proteins regulates Dvl-2-stimulated TCF-dependent transcription. EMBO J. 182823-2835. [DOI] [PMC free article] [PubMed] [Google Scholar]
- 29.Su, L. K., K. W. Kinzler, B. Vogelstein, A. C. Preisinger, A. R. Moser, C. Luongo, K. A. Gould, and W. F. Dove. 1992. Multiple intestinal neoplasia caused by a mutation in the murine homolog of the APC gene. Science 256668-670. [DOI] [PubMed] [Google Scholar]
- 30.Tusher, V. G., R. Tibshirani, and G. Chu. 2001. Significance analysis of microarrays applied to the ionizing radiation response. Proc. Natl. Acad. Sci. USA 985116-5121. [DOI] [PMC free article] [PubMed] [Google Scholar]
- 31.Wakita, K., O. Tetsu, and F. McCormick. 2001. A mammalian two-hybrid system for adenomatous polyposis coli-mutated colon cancer therapeutics. Cancer Res. 61854-858. [PubMed] [Google Scholar]
- 32.Yamagoe, S., T. Akasaka, T. Uchida, T. Hachiya, T. Okabe, Y. Yamakawa, T. Arai, S. Mizuno, and K. Suzuki. 1997. Expression of a neutrophil chemotactic protein LECT2 in human hepatocytes revealed by immunochemical studies using polyclonal and monoclonal antibodies to a recombinant LECT2. Biochem. Biophys. Res. Commun. 237116-120. [DOI] [PubMed] [Google Scholar]
- 33.Yamagoe, S., Y. Yamakawa, Y. Matsuo, J. Minowada, S. Mizuno, and K. Suzuki. 1996. Purification and primary amino acid sequence of a novel neutrophil chemotactic factor LECT2. Immunol. Lett. 529-13. [DOI] [PubMed] [Google Scholar]
- 34.Zhang, Y., H. H. Ng, H. Erdjument-Bromage, P. Tempst, A. Bird, and D. Reinberg. 1999. Analysis of the NuRD subunits reveals a histone deacetylase core complex and a connection with DNA methylation. Genes Dev. 131924-1935. [DOI] [PMC free article] [PubMed] [Google Scholar]
Associated Data
This section collects any data citations, data availability statements, or supplementary materials included in this article.