

Abstract
To better understand the molecular basis for recognition of the DNA minor groove by heterocyclic cations, a series of “reversed amidine” substituted heterocycles has been prepared. Amidine derivatives for targeting the minor groove have the amidine carbon linked to a central heterocyclic system while in the reverse orientation, an amidine nitrogen provides the link. The reverse system has a larger dihedral angle as well as a modified spatial relationship with the groove relative to amidines. Because of the large dihedral, the reversed amidines should have reduced binding to DNA relative to similar amidines. Such a reduction is observed in footprinting, circular dichroism (CD), biosensor-surface plasmon resonance (SPR) and isothermal titration calorimetric (ITC) experiments with DB613, which has a central phenyl-furan-phenyl heterocyclic system. The reduction is not seen when a pyrrole (DB884) is substituted for the furan. Analysis of a number of derivatives defines the pyrrole and a terminal phenyl substituent on the reversed amidine groups as critical components in the strong binding of DB884. ITC and SPR comparisons showed that the better binding of DB884 was due to a more favorable binding enthalpy and that it had exceptionally slow dissociation from DNA. Crystallographic analysis of DB884 bound to an AATT site show that the compound was bound in the minor groove in a 1:1 complex as suggested by CD solution studies. Surprisingly, unlike the amidine derivative, the pyrrole -NH of DB884 formed an H-bond with a central T of the AATT site and this accounts for the enthalpy driven strong binding. The structural results and molecular modeling studies provide an explanation for the differences in binding affinities for related amidine and reversed amidine analogs.
Introduction
Study of heterocyclic diamidines, such as those in Figure 1, has significantly increased our understanding of the molecular basis for sequence specific recognition of the DNA minor groove and some of the compounds are clinically useful agents.1,2 The DNA recognition modes are important for biological activities and involve a variety of contacts and interactions that lead to some rather large differences in the structures and thermodynamics of recognition by the dications. DB75 (Figure 1) binds to AT sequences in DNA with an equilibrium constant that is approximately 100-fold larger than to GC sequences.3 It was one of the first heterocyclic diamidines studied in detail and the compound was crystallized as a minor groove complex with the DNA duplex dodecamer sequence d(CGCGAATTCGCG)2.4 In this complex, DB75 forms cross strand H-bonds with thymine keto groups at the floor of the groove and generally fits to the shape of the groove at the AATT site in the self-complementary duplex. The complex structure is similar to that for netropsin bound to the same DNA sequence5 but netropsin forms more H-bonds and the binding is enthalpy driven, contrasting with the entropy driven binding for DB75.6,7
Figure 1.

DNA oligomer sequences used in this study and representative diamidines.
Structural evaluation of the DB75 complex, however, indicates that the compound has slightly too large a molecular curvature for optimum fit to the minor groove when both amidine groups are H-bonded to AT base pair edges at the floor of the groove. The furan ring of DB75 is pushed slightly away from the floor of the groove but fits well between the walls of the groove that are formed largely by deoxyribose groups from the DNA backbone. The observation that the phenyl-furan system is too curved for optimal match to the groove is supported by results with the related phenyl-furan-benzimidazole derivative, DB293 (Figure 1), which has a similar binding constant as DB75.8 We infer from this that the benzimidazole -NH is not close enough to the floor of the minor groove to form an H-bond with DNA bases in the DB293 complex. In contrast, DB818 (Figure 1), the thiophene analog of DB293, has a slightly lower radius of curvature and is a better match for the minor groove shape.9 Structural analysis of the DB818-AATT complex indicates that both amidines as well as the benzimidazole -NH of DB818 can form H-bonds to DNA bases at the floor of the minor groove. The compound binds to AT sites of four or more base pairs with an equilibrium constant that is over ten times greater than for DB293. Thus DB818 is one of the strongest binding compounds in its size range yet discovered. The binding enhancement is entirely due to the more favorable binding enthalpy for DB818 relative to DB293 or DB75.8,9
These and other similar results highlight the importance of compound shape and substituent position, particularly those that affect compound curvature and interaction with bases at the floor of the minor groove, in DNA molecular recognition. Similar observations on the importance of curvature in minor groove interactions have been made with polyamides10 and with alkyl linked diamidines related to pentamidine.11 It was thus surprising to find that the relatively linear compound DB921 (Figure 1) binds to DNA AT sites over ten times more strongly than the curved isomer DB911.12 DB911 has an affinity for AT sites that is similar to that for DB293, as would be expected from its shape and substituents. X-ray structural studies clearly show however, that DB921 incorporates a water molecule into its complex with DNA to give a ternary complex with the correct curvature, excellent H-bonding and a very high affinity.12 All of these results show that small compound structural changes, at positions throughout the molecular structure of the parent compound, DB75, can have profound effects on DNA recognition in ways that we are just beginning to understand. In order to extend this molecular recognition understanding we are making a wide range of rational and systematic synthetic modifications in DB75 and conducting detailed structural and thermodynamic studies on the new compounds in complex with DNA.
A very important additional incentive for continued investigation and development in the DB75 series is the fact that a prodrug of DB75 is in Phase III clinical trials against the trypanosomal disease, sleeping sickness.1,2,13 Analogs of DB75 have shown significant activity against other eukaryotic parasitic diseases and animal studies are in progress. In organisms with mitochondrial kinetoplasts, there is strong evidence that the mechanism of action of the diamidines involves specific targeting of AT rich sequences in kinetoplast DNA minicircles with disruption of kinetoplast replication and cell death.1,2,14 Important goals of the research described in this paper are to better understand the interactions of diamidines of varied structure with AT DNA sequences such as those found in kinetoplast minicircles. As described above, the diamidines are attractive for development due to their demonstrated low toxicity in humans, extensive clinical testing and cell uptake properties.1,2,14,15
In order to accomplish the drug development and molecular recognition goals, a variety of dications, such as those shown in Figure 1, are being designed and prepared. The synthetic compounds are screened by footprinting and Tm methods to select for structures that can selectively target DNA with high affinity. The most interesting compounds, based either on their unique targeting or binding ability, are then studied in detail by structural, spectroscopic and thermodynamic methods. Although amidine derivatives have been the core of the analogs prepared to this time, our goal is to incorporate structural diversity into each component of the DB75 molecule. Based on the results described above with DB921 and DB818, it is clearly very important to design new derivatives that change the way that the compounds interact with the bases at the floor of the minor groove. The “reversed amidines” of Figure 1 and Table 1, such as DB884, with one amidine nitrogen linked to a phenyl ring in the central core of the molecules, were designed to test the DNA molecular recognition potential of structures of this type. As described below, this change in amidine-phenyl linkage significantly increases the dihedral angle between the two planar units in solution and significantly changes the spatial relationship between the phenyl-amidine unit and the minor groove. We report here the first detailed study of the interaction of the reversed amidine type compounds with DNA. Perhaps not surprisingly for the more highly twisted system, furan based reversed amidines bind to AT sites more weakly than DB75. Surprisingly, however, DB884, with a central pyrrole ring was found to have unexpectedly strong binding to AT DNA sequences by both biosensor and calorimetric methods. Structural studies have revealed the details of the binding, and in particular have identified an unusual H-bond between the pyrrole and DNA that can account for the enhanced binding of DB884 relative to other very similar amidine and reversed amidine analogs.
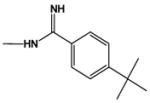
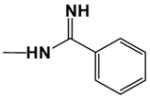
Table 1.
Comparison of Tm of DB884 and its analogues with polydA.polydT and d(GCGAATTCGC)2.
| Cmpd | Structure | R | ΔTm (°C) AATT | ΔTm (°C) Poly(dA) poly(dT) |
|---|---|---|---|---|
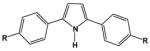
| DB884 |
|
|
18.0 | 24.1 |
| DB613 |
|
|
11.0 | 20.0 |
| DB1393 |
|
|
18.0 | 24.0 |
| DB1419 |
|
|
20.0 | 25.0 |
| DB1215 |
|
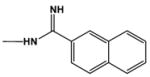
|
15.0 | 22.0 |
| DB1480 |
|
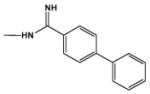
|
8.0 | 11.0 |
| DB890 |
|
|
10.0 | 14.0 |
| DB1390 |
|
|
8.0 | 12.0 |
| DB903 |
|
|
6.0 | 12.0 |
| DB262 |
|
10.0 | 18.8 | |
| DB75 |
|
11.4 | 24.8 |
MATERIALS AND METHODS
Compounds, DNAs, and Buffers
The syntheses of the compounds in the paper has been published16 or are described below. Purity of all compounds was verified by NMR and elemental analysis. Poly(dA)poly(dT) from Pharmacia Co. was used for Tm experiments and the d(GCGAATTCGC)2 oligomer DNA from IDT was used for Tm and CD studies. Calorimetric experiments were performed with d(GCCGCAATTCGC/iSp18)2 (iSp18 stands for internal spacer 18 which is the haxaethylene glycol linkage) hairpin duplex DNA (Figure 1). Solutions were prepared in degassed cacodylic acid buffer containing 0.01M cacodylic acid, 0.001M EDTA, 0.1 M NaCl adjusted to pH 6.25. The concentration of the DNA solutions was determined spectrophotometrically at 260 nm using extinction coefficients per nucleotide of AATT duplex DNA. The extinction coefficients were calculated on a per strand basis by the nearest-neighbor method and divided by the number of nucleotides per strand.17
Preparation of Reversed Amidines
General Procedure
The new compounds in this report were prepared following the general method previously developed by us.16 The general procedure used follows along with characterization data for DB1215 (structure in Table 1). The reaction Scheme employed and the data for all the new compounds may be found in the Supplemental Information.
Free base preparation
A chilled solution of the diamine (1.28 mmol) in dry MeCN (10 mL) and dry EtOH (15 mL) was treated with S-(2-naphthylmethyl) thiobenzimidate hydrobromide (2.69 mmol). After stirring at rt for 24 h, the solvent was evaporated to dryness leaving an oily residue. Treatment with ether gave the reversed amidine as the hydrobromide salt, which was dissolved in EtOH, basified with 1N NaOH, extracted with EtOAc, dried over Na2SO4 and finally the solvent was evaporated to dryness giving the free base of the reversed amidine in an analytically pure form.
Hydrochloride salt
An ice-bath cold solution of the free base in dry EtOH was treated with HCl gas for 5–10 min, and the reaction mixture was kept stirring for 5 h. Later, the solvent was concentrated to near dryness, and then mixture between the reaction was diluted with ether.
DB1215
2,5-Bis[4-(2-naphthylimino)amino)phenyl]pyrrole
Yield 61%, mp 275-7 °C; 1H-NMR (DMSO-d6) δ 6.52 (s, 2H), 6.72 (br s, 4H), 6.96 (d, J = 8.1 Hz, 4H), 7.57–7.61 (m, 4H), 7.75 (d, J = 8.1 Hz, 4H), 6.96–6.98 (m, 6H), 8.12 (d, J = 8.1 Hz, 2H), 8.54 (s, 2H), 11.08 (br s, 1H). 13C-NMR δ 154.3, 147.3, 133.7, 132.8, 132.7, 132.2, 128.6, 127.5, 127.3, 127.0, 126.7, 126.4, 124.7, 121.9, 106.4.
Salt: mp 247-9 °C; 1H-NMR (DMSO-d6) δ 6.79 (s, 2H), 7.53 (d, J = 8.1 Hz, 4H), 7.69–7.78 (m, 4H), 7.95 (d, J = 8.1 Hz, 2H), 8.06–8.16 (m, 8H), 8.20 (d, J = 8.1 Hz, 2H), 8.64 (s, 2H), 9.18 (br s, 2H), 10.01 (br s, 2H), 11.65 (br s, 1H), 11.71 (br s, 2H). HRMS Calc. for C38H30N5 ms 556.2501; observed 556.2498. Anal. Calcd. for C38H29N5-2HCl-2.5H2O: C % 67.75, H % 5.38, N % 10.39. Found: C % 67.68, H % 5.24, N % 10.39.
Purification and radiolabeling of DNA restriction fragments and DNase I footprinting
The plasmid was isolated from E. coli by standard sodium dodecyl sulfate-sodium hydroxide lysis and purified by banding in CsCl-ethidium bromide gradients. The 265 bp DNA fragment was prepared by 3′-[32P]-end labeling of the EcoRI-PVuII double digest of the pBS plasmid (Stratagene) using R-[32P]-dATP and AMV reverse transcriptase. The products were separated on a 6% polyacrylamide gel under non-denaturing conditions in TBE buffer (89 mM Tris-borate pH 8.3, 1 mM EDTA). After autoradiography, the requisite band of DNA was excised, crushed and soaked in water overnight at 37°C. This suspension was filtered through a Millipore 0.22 mm filter and the DNA was precipitated with ethanol. Following washing with 70% ethanol and vacuum drying of the precipitate, the labeled DNA was resuspended in 10 mM Tris adjusted to pH 7.0 containing 10 mM NaCl. DNase I footprinting experiments were performed essentially as previously described.18 Briefly, reactions were conducted in a total volume of 10 ul. Samples (3 ul) of the labeled DNA fragments were incubated with 5 ul of compound solution for 30 min of incubation. Digestion was initiated by the addition of 2 ul of a DNase I solution whose concentration was adjusted to yield a final enzyme concentration of ~0.01 U/ml in the reaction mixture. After 3 min, the reaction was stopped by freeze-drying. Samples were lyophilized and resuspended in 5 ml of an 80% formamide solution containing tracking dyes. The DNA samples were then heated at 90°C for 4 min and chilled in ice for 4 min prior to electrophoresis.
Thermal Melting (Tm)
Tm experiments were conducted with a Cary 300 UV-Visible spectrophotometer in 1-cm quartz cuvettes. The absorbance of the DNA-compound complex was monitored at 260 nm as a function of temperature and DNA without compound was used as a control. Cuvettes were mounted in a thermal block and the solution temperatures were monitored by a thermistor in a reference cuvette with a computer controlled heating rate of 0.5 °C/min. Experiments were generally conducted at a concentration of 2×10⁻⁵ M base pair for polydA.polydT and 3 × 10⁻⁵ M duplex for d(GCGAATTCGC)2. For experiments with complexes a ratio of 0.3 compound per base pair for polydA.polydT and ratio of one compound per oligomer duplex for d(GCGAATTCGC)2 was generally used.
Circular Dichroism (CD)
CD spectra were obtained on a computer controlled Jasco J-710 spectrometer in 1cm quartz cell. The DNA was added to cacodylate buffer in a 1-cm quartz cuvette and scanned over a selected wavelength range. The desired ratios of compound to DNA were obtained by adding compound to the cell containing a constant amount of DNA at 25 °C. The compounds at increasing ratios were then titrated into DNA and the complexes were rescanned under same conditions.
SPR-Biosensor Binding Determinations
SPR (Surface plasmon resonance) measurements were performed with a four-channel BIAcore 2000 optical biosensor system (BIAcore Inc.). 5′-biotin labeled DNA samples (Figure 1) were immobilized onto streptavidin-coated sensor chips (BIAcore SA) as previously described.19 Three flow cells were used to immobilize the DNA oligomer samples, while a fourth cell was left blank as a control. The SPR experiments were performed at 25°C in filtered, degassed, 10 mM cacodylic acid buffer (pH 6.25) containing 100 mM NaCl, 1mM EDTA. Steady state binding analysis was performed with multiple injections of different compound concentrations over the immobilized DNA surface at a flow rate of 25μl/min and 25°C. Solutions of known ligand concentration were injected through the flow cells until a constant steady-state response was obtained. Compound solution flow was then replaced by buffer flow resulting in dissociation of the complex. The reference response from the blank cell was subtracted from the response in each cell containing DNA to give a signal (RU, response units) that is directly proportional to the amount of bound compound. The predicted maximum response per bound compound in the steady-state region (RUmax) was determined from the DNA molecular weight, the amount of DNA on the flow cell, the compound molecular weight, and the refractive index gradient ratio of the compound and DNA, as previously described.20 The number of binding sites and the equilibrium constant were obtained from fitting plots of RU versus Cfree. Binding results from the SPR experiments were fit with either a single site model (K2 = 0) or with a two site model:
| (1) |
where r represents the moles of bound compound per mole of DNA hairpin duplex, K1 and K2 are macroscopic binding constants, and Cfree is the free compound concentration in equilibrium with the complex.
Isothermal Titration Calorimetry (ITC)
ITC experiments were performed with a MicroCal VP-ITC (MicroCal Inc., Northampton, MA, USA) interfaced with a computer equipped with VP-2000 viewer instrument control software. ITC data were analyzed with Origin 7.0 software. In ITC experiments 10 μl of 0.1 mM compound solution was injected every 300 s to a total of 29 injections into a d(GCCGCAATTCGC/iSp18)2 in the calorimeter cell at 0.01 mM duplex concentration. The observed heat for each injection was obtained by area integration of the power peak with respect to time. Blank titrations were conducted by injecting the compound into the cell containing only buffer under the same conditions. The corrected interaction heat was determined by subtracting the blank heat from that for the compound/DNA titration. Finally, binding enthalpies were obtained by fitting the corrected data to an appropriate binding model as described below.
X-ray crystallography
The HPLC-purified oligonucleotide d(CGCGAATTCGCG) (Eurogentec) at 6 mM single-stranded DNA solution in 30 mM sodium cacodylate buffer at pH 7.0 was annealed into a duplex before use by incubation in a heating block at 85 °C for 15 min and then left to cool gradually at room temperature for about 1 hour. The complex was crystallised as elongated rods by the sitting-drop vapor diffusion method as rods after a month at 20 °C from a 24 μl drop containing 31.25 mM MgCl2, 1.0417% v/v (±)-2-methyl-2,4-pentanediol (MPD), 0.125 mM double-stranded DNA, 0.167 mM compound DB 884, and 5.0 mM sodium cacodylate buffer at pH 7.0 after one month at 20 °C. The DNA:DB884 ratio was 3:4. The drop was equilibrated against a reservoir of 0.5 ml of 50% v/v MPD solution in water.
X-ray diffraction data were collected at −168 °C on a Rigaku R-AXIS IV image plate detector with CuKα radiation emitted from a Rigaku RU200 rotating anode generator and an Osmic focusing mirror system (Rigaku/MSC). The crystal-to-detector distance was set at 90 mm. Each frame was exposed for 30 min with the crystal oscillating at a range of 2°. Data was collected to a maximum resolution of 1.86 Å. Indexing and data processing were carried out using XdisplayF, DENZO and SCALEPACK of the HKL package v.1.97.2 (HKL Research, Inc).21
The structure was solved by molecular replacement using the isomorphous DNA structure from the berenil-d(CGCGAATTCGCG)2 complex22 (PDB id 2DBE). Unambiguous electron density for the DB884 molecule was seen in 2Fo - Fc and Fo - Fc maps. The structure was refined to final R and Rfree values of 21.9% 31.0% respectively. Atomic coordinates and structure factors have been deposited in the RCSB Protein Data Bank with entry code 2GYX. Crystallographic data are given in Supporting Information Table 1.
RESULTS
Thermal melting: Relative Binding Affinity
Thermal melting experiments enable a rapid qualitative evaluation of the relative binding affinities of compounds to DNA.23,24 ΔTm values for DB884 and its analogues with polydA.polydT were compared to that for the diamidine reference compound, DB262 under the same conditions (Table 1). The binding of DB884 (Supporting Material, Figure S1A) is strong and the complex with polydA.polydT DNA unfolds around 94 °C, which is significantly higher than the related furan derivative, DB613. Replacement of the phenyl in the reversed amidine group of DB884 with a methyl in DB1390 resulted in a large decrease in Tm. Conversion of the pyrrole to an N-methyl pyrrole in DB890 had the same effect.
Thermal melting results with an AATT DNA duplex (Figure S1B), provide information about compound binding in mixed sequence regions. Results at a 1:1 and 2:1 ratio of compound to DNA duplex suggest that DB884 binds to the AATT DNA sequence with 1:1 stoichiometry since the Tm does not significantly increase at ratios above 1:1 (Table 1). ΔTm values for all compounds without either the pyrrole or terminal phenyl groups are much lower than with DB884 and indicate that both the pyrrole and terminal phenyls are required for the large increase in DNA binding affinity.
DNaseI Footprinting
Identify the Binding Sites
Footprinting is the method of choice for defining binding site sequence specificity in a broad DNA length and sequence context for compounds that bind to DNA.18 Footprinting results for selected reversed amidine compounds from Table 1 are shown in Figure 2 with an experimental gel and the results are compared to those for the well characterized minor groove binding diamidine, furamidine, DB75.3 All of the compounds give footprints only in AT sequences as might be expected from their shape and expected minor groove binding mode. In agreement with the Tm studies, DB884 gives much stronger footprints than any of the other compounds.
Figure 2.

DNase I footprinting titration experiments. The 117-bp EcoRI-PVuII restriction fragment from plasmid pBS was 3′-end-labeled at the EcoRI site with [a-32P]dATP in the presence of AMV reverse transcriptase. The products of the DNase I digestion were resolved on an 8% polyacrylamide gel containing 8 M urea. Drug concentrations are at the top of the lanes. Tracks labeled G represent dimethylsulfate piperidine markers specific for guanines. Sequences at the footprinting sites are indicated to the right of the gel.
Circular Dichroism
Binding Modes
CD spectra of DB884, DB613 and DB890 (Figure 3) with the AATT duplex oligomer used in Tm studies were monitored to evaluate the binding mode. The free compounds do not exhibit CD signals; however, upon addition of the compounds to DNA, substantial positive CD signals are induced at the absorption maximum near 340 nm. Strong positive induced CD signals on compound binding to AT DNA sequences are a characteristic of binding in the minor groove of DNA.25 Interestingly, the induced CD signals of DB884 and DB613 are larger than for DB890 as generally expected for stronger binding in the minor groove in AT sequences. The CD results as a function of ratio indicate that DB884 and analogues bind in the DNA minor groove in AATT sequences with 1:1 stoichiometry, as observed for Tm results.
Figure 3.

CD spectra of DB884, DB613 and DB890 with d(GCGAATTCGC)2. (A) In DB884 the ratios of the compound to DNA from the bottom to the top at 375 nm 0, 0.25, 0.5, 0.75, 1.0 and 1.2. (B) In DB613 the ratios of compound to DNA are 0, 0.25, 0.5, 0.75, 1.0 and 1.2. (C) In DB890 the ratios of compound to DNA are 0.5, 0.75, 1.0, 1.25, 1.75, 2.75. The experiments were conducted in cacodylic acid buffer at 25 °C.
Biosensor-SPR
Binding Affinity and Kinetics
In order to quantitatively evaluate the interactions of DB884 and selected analogs with DNA, biosensor- SPR experiments were conducted with a DNA hairpin duplex containing the sequence, AATT, which has been used in studies of many minor groove binding compounds.19 Binding to alternating AT and GC hairpin duplexes was also compared to evaluate sequence specificity. The SPR method is an excellent way to quantitatively evaluate the interaction of strong binding small molecules with DNA and other biomolecules.19,26,27 Because the SPR approach responds to mass, it can be used in comparative studies for dications that have very large differences in properties and equilibrium binding constants, K. In many cases rates for the binding can be observed in real time for complex formation and dissociation.26,27
In agreement with the results described above, the binding of all compounds to AT sequences was stronger than to GC sequences (data not shown). No significant binding of DB884, for example, could be detected with the GC sequence hairpin at concentrations that saturated the AT binding sites. Sensorgrams for DB884 (Figure 4A) and the analogous furan derivative, DB613, (4B) binding to the AATT hairpin (Figure 1) are compared over the same concentration range. The differences in binding affinity and kinetics for two compounds that differ by a single atom could hardly be more striking. DB884 is approaching saturation of the AATT binding sites at 0.1 uM, the top concentration in the Figure, while DB613 is just beginning to bind at that point. In addition, both the observed association and dissociation rates of DB884 are slower than with DB613. Plots of RU at steady state versus the free compound concentration (Cf), the concentration in the flow solution, are shown in Figure 4C over a broader concentration range to allow determination of the compound binding equilibrium constants. The results for DB884 have a larger error range than usual in SPR experiments because of two factors: (i) with the slow kinetics for binding of DB884, it is not possible to reach a steady state plateau in the experimental time range, which is limited by the injection volume, and (ii) DB884 sticks extensively to the injection needle and tubing of the instrument and in the initial injection time range the flow solution is depleted in DB884 concentration. After deletion of approximately 20 seconds of the initial range, it is possible to fit the curves with a 1:1 binding model to determine the predicted steady state RU values for DB884 for use in figure 4C. In the higher concentration points, the steady state is reached (Figure 4A) and these values can be used directly in the RU versus Cf plots along with predicted values. The binding constants determined in this manner are 2.5 × 10⁷ M−1 for DB884 and 9.8 × 10⁵ M−1 for DB613 (Table 2). Sensorgrams for the diamidine pyrrole, DB262, show that compound has much faster on and off rates compared to DB884 and similar binding constant to DB884 (Supporting Material Figure S2). Clearly, the features of the DB884 molecule allow it to recover the binding affinity of similar diamidines but with much slower binding kinetics. The furan reversed amidine, DB613, can not achieve a similar binding affinity.
Figure 4.

SPR sensograms for (A) DB884 with AATT hairpin. The compound concentrations were 0.0, 0.01, 0.02, 0.06, 0.065, 0.07, 0.75, 0.08, 0.09, 0.1 uM from bottom to top. (B) DB613 with AATT hairpin DNA. The compound concentrations were 0.05, 0.1 uM from bottom to top. (C) RU values are plotted against the unbound compound concentration, Cf (flow solution) for DB884 (closed circles) and DB613 (closed squares) binding to AATT DNA hairpin. The data was fitted to one site model using equation 1.
Table 2.
Thermodynamic results at 25° C.
| Cmpd | Ka (M−1) | ΔH (kcal/mol) | TΔS(kcal/mol) | ΔG(kcal/mol) |
|---|---|---|---|---|
| DB884 | 2.5×10⁷ | −5.6 ± 0.6 | 4.3 | −9.9 |
| DB262 | 1.0×10⁷ | −3.7 ± 0.5 | 5.8 | −9.5 |
| DB613 | 9.8×10⁵ | −2.1 ± 0.3 | 6.0 | −8.1 |
Isothermal titration calorimetry (ITC)
Thermodynamics of Binding
ITC experiments with an AATT hairpin DNA (Figure 1) were conducted to help understand in more detail the energetic basis for the strong binding of DB884 to DNA. ITC experiments provide the observed binding enthalpy, ΔH and allow calculation of the entropy of binding (from ΔG = ΔH − TΔS).28–31 Titration of DB884 into buffer and into a DNA solution provided plots of heat versus molar ratio (Figure 5A). The titration with the compound was continued until all the DNA in the calorimeter cell was saturated. The titration plot supports strong binding of DB884 to DNA and shows that the DNA is completely saturated at a 1:1 stoichiometry, in agreement with the results described above. Due to the strong binding of DB884, only H and not the ΔG for binding could be obtained from the ITC experiments. The observed binding H for DB884 at 25°C is −5.6 kcal/mol and is larger than values for related diamidines.9 Interestingly, the H values for the analogous furan compound, DB613 (−2.1 kcal/mol) and DB262 (Table 2), the reference diamidine compound (−3.7 kcal/mol) are significantly lower. The TΔS term for DB884 binding to the minor groove of the AATT sequence is actually less favorable than that for DB613 and DB262 while the ΔH for binding is more favorable by 2–3 kcal/mol.
Figure 5.

ITC experimental curves at 25 °C for titration of 0.01 mM (A) DB884 and (B) DB613 into 0.001 mM d(GCGAATTCGC)2 duplex. Results were converted to molar heats and plotted against the compound/DNA molar ratio. The line shows the fit to the results and gives best fit ΔH values for binding.
X-ray crystallography
The Structure of The Complex
In order to evaluate the structural basis of the observed strong binding of DB884, crystals of the complex of the compound with the duplex oligomer used in the studies described above were grown and the structure was solved by x-ray crystallography. The DB884 molecule is bound as a monomer in the central -GAATTC- site of the minor groove of the d(CGCGAATTCGCG)2 duplex (Figures 6, 7), and covers almost six base pairs. The two phenyl rings and the pyrrole group are oriented parallel to the groove walls and are embedded deep into the groove, whereas the two terminal phenyl rings are perpendicular to the mean plane of these three central rings and are close to the mouth of the groove. Both of these terminal phenyl rings are highly mobile, as indicated by their large temperature factors (<B> of 68 Å2 compared to a <B> of 42 Å2) for the atoms in the inner two phenyl rings (Figure 7), and thus their incomplete location in discrete electron density. The presence of the hydrophobic terminal phenyl rings appears to displace much of the more tightly-bound water structure often observed in this vicinity of the groove in other ligand complexes.
Figure 6.

A 2Fo - Fc electron density map with contours drawn at the 1.3σ level, viwed down onto the DB 884 molecule in the DNA minor groove, and showing some of the neighbouring nucleotides and water molecules. Drawn with the Turbo-Frodo program33.
Figure 7.
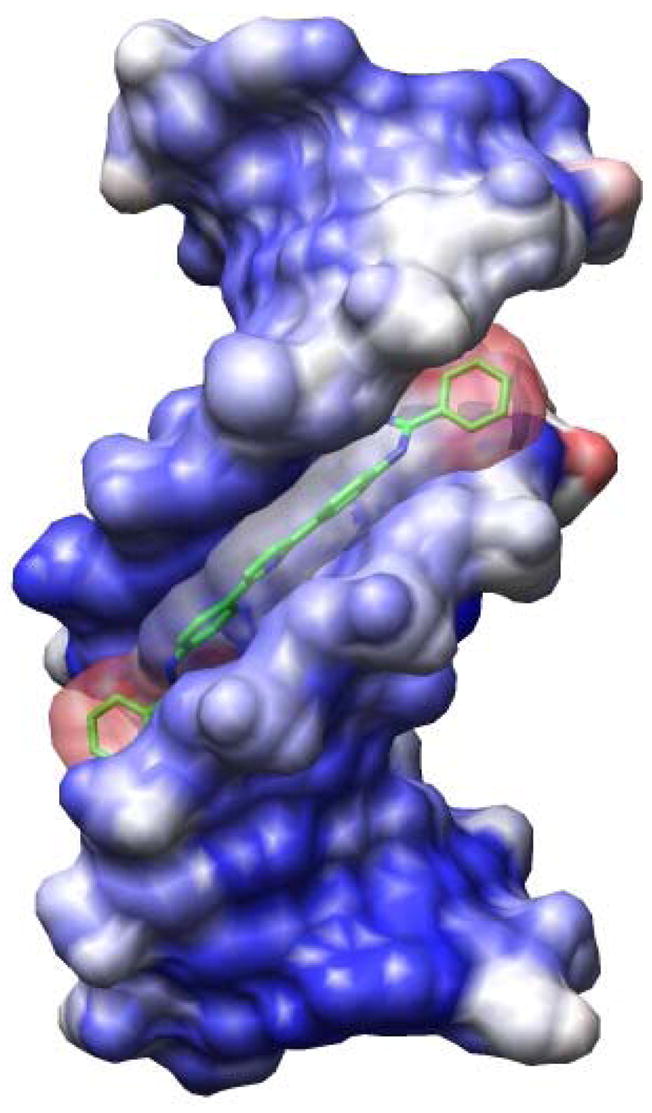
Structure of the DB884-DNA complex, showing the solvent-accessible surface coloured according to crystallographic temperature factors (B values), with red indicating the highest values. The bonds of the DB884 molecule are drawn in green, and its solvent-accessible surface is shown with 50% transparency to heighten clarity. Note close contact of the surfaces of the two terminal phenyl groups of the ligand with the minor groove wall surfaces. Figure has been drawn with the Chimera program34.
The inner-facing amidinium nitrogen atoms at the ends of the DB884 molecule are involved in hydrogen-bonding to acceptor atoms at the base and wall of the groove (Figure 8a, c). There are four hydrogen bonds to pyrimidine O2 atoms, one to a sugar O4′ atom and one to a phosphate oxygen atom. The pyrrole nitrogen atom makes one hydrogen-bond contact with the thymine-19 O2 atom (3.1 Å) and is near to the cross-strand thymine-7 O2 atom (3.5 Å) at the center of the DNA sequence (Figure 8b). One of the outward-facing amidinium nitrogen atoms (N18) is involved in a tight hydrogen-bonded bridge arrangement with two water molecules, which terminates at a phosphate oxygen atom (Figure 8a). All of the hydrogen-bond distances in this bridge are short, especially that to the phosphate oxygen atom.
Figure 8.
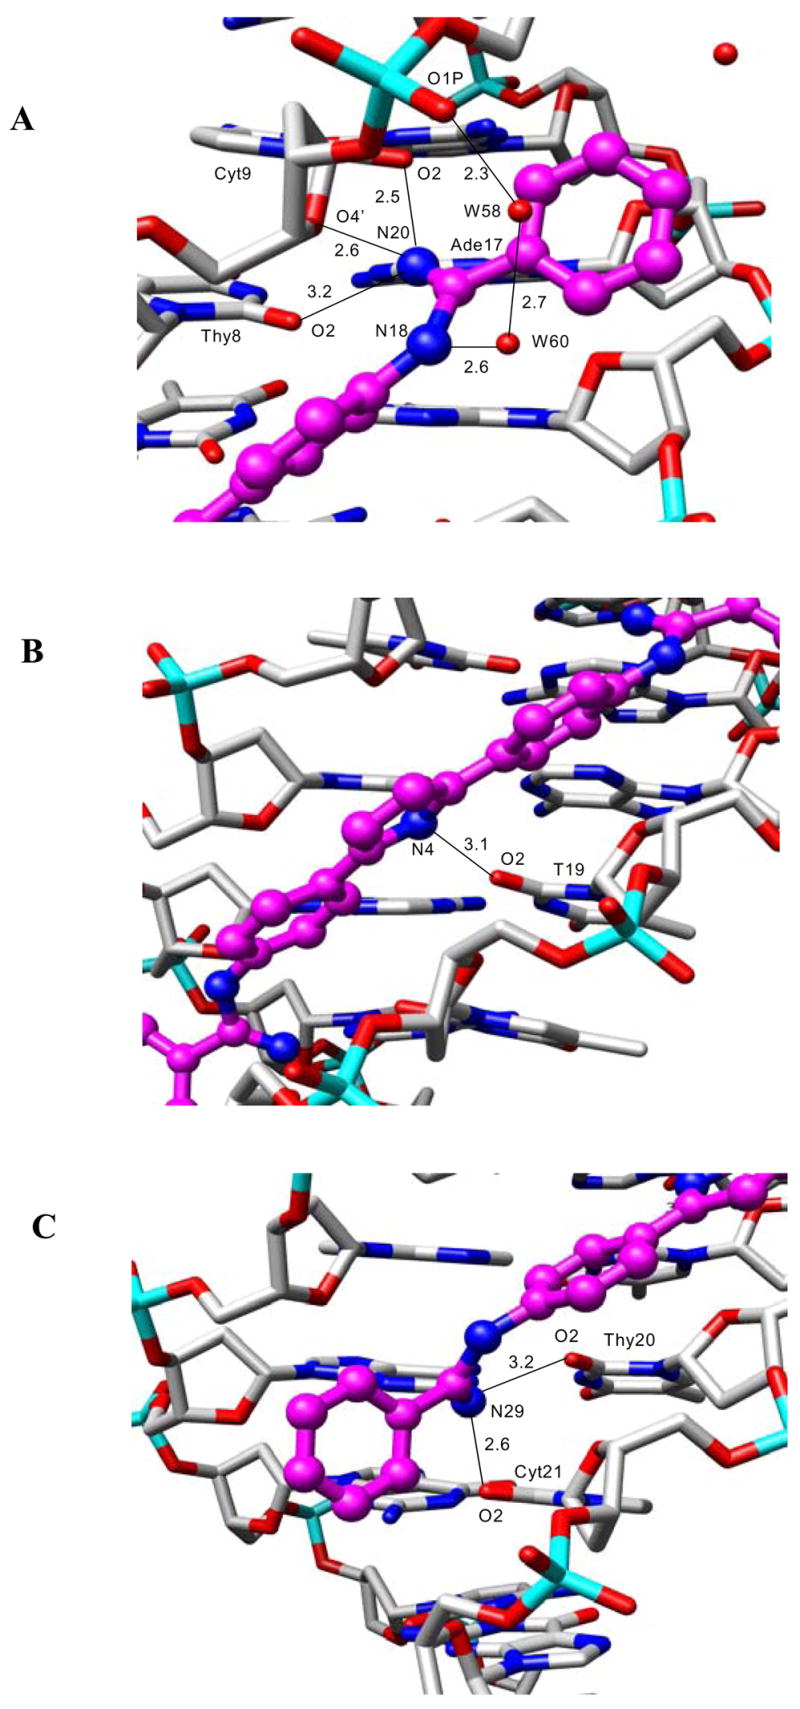
Detailed views of the hydrogen-bond interactions between the DB884 ligand (drawn in mauve) and the DNA. Distances are in Å. Figures have been drawn with the Chimera program34. (A) showing the three hydrogen bonds between amidinium nitrogen atom N20 and acceptor atoms O2, O4′ and a phosphate oxygen atom. Also shown is the network of hydrogen bonds bridging the two water molecules W59 and W60 with the outer-facing amidinium nitrogen atom N18 and N2 of Gua18. (B) Showing the hydrogen bond between the central pyrrole ring nitrogen atom of DB884, and the O2 atom of Thy19. (C) Showing the hydrogen bonds between the amidinium nitrogen atom N28 and the O2 atoms of Thy20 and Cyt21.
Bound versus Free Structures
Induced Fit Binding
Density Functional Theory (DFT) calculations for optimizing geometry at the 631G (p,d) approximation level show that the dihedral angles between the amidine and phenyl planes are approximately 40° while the equivalent dihedral angles in DB884 and DB613 are near 70°. Hartree-Fock ab initio calculations at a similar level gave slightly larger predicted angles. In the DB75 complex structure, the amidine-phenyl dihedrals are reduced to 24 and 19° and the amidines make H-bonds with the last T of AATT site on opposite strands. Calculations of relative energy versus the phenyl-amidine dihedral angles indicate that relatively small energies are required to reduce the amidine-phenyl angles from the free to the bound conformation.35,36 The reversed amidine geometry of DB613 and DB884 complicates their interaction with the minor groove. Figure 9 illustrates the free versus complex conformations of DB884 as well as the electrostatic potential maps of the two conformations. Both the central tricyclic system of DB884 and the terminal reversed amidines have decreased twist in the bound conformation. The inner surface of the bound molecule has an excess of positive charge and H-bond donor groups in position to form H-bonds with base pairs at the floor of the groove.
Figure 9.

DFT ab initio calculations at the 631G (p,d) approximation level for DB884 in the free (top) and bound (bottom) form with their respective electrostatic potential maps.
The energy required to reduce the phenyl-reversed amidine dihedral angle to allow the compound to fit into the minor groove is larger than for the amidine and the twist angle of the bound reversed amidine compounds is greater. The final angles for the reversed amidines in the DB884 crystal structure are 40 and 55° (Figure 7), and this angle is significantly larger than for the amidines. A decreased binding constant is thus expected for reverse-amidine compounds relative to the related amidine derivatives, as observed in all cases except with DB884.
DISCUSSION
As described in the Introduction, rational, systematic modifications of the parent heterocyclic diamidine compound, DB75, followed by biophysical analysis of the interactions of the new derivatives with different sequences of DNA is a powerful method to improve our understanding of molecular recognition of DNA. In addition, since the parent compound is biologically active against eukaryotic parasitic organisms, with low human toxicity, additional compounds in this series provide an opportunity to explore possible mechanisms of biological activity and to search for compounds that are active against additional organisms and/or diseases.1,2 In the design efforts to modify each molecular unit of DB75, “reversed amidine” derivatives (Figure 1 and Table 1) were prepared16 (Supporting Material). DB613 is the furan analog of DB75 while DB884 has a pyrrole in place of the furan ring and as a result, has additional H-bonding potential. Footprinting results clearly show that all of the new compounds are AT specific binding agents as with DB75 (Figure 2). An indication of the strong binding of DB884 to AT DNA sequences is suggested by its strong footprint (Figure 2).
In agreement with the footprinting results, DB884 has a significantly larger increase in Tm with AT DNA sequences than the closely related furan reversed amidine, DB613 or than the pyrrole diamidine, DB262 (Table 1). Addition of an ethyl or t-butyl substituent to the terminal phenyl of DB884 has little effect on the ΔTm while a phenyl to naphthyl change slightly decreases ΔTm and a phenyl to biphenyl change causes a large decrease in ΔTm. Replacement of the phenyl with a methyl results in a large loss in complex stability. Clearly, the terminal aromatic groups of DB884 play a major role in the enhanced interaction with the minor groove and the crystal structure shows that both terminal rings are involved in extensive hydrophobic contacts with the walls of the groove (Figure 8). There is some flexibility in the acceptable size of the terminal aromatic group but, as demonstrated by the biphenyl substitution (DB1480), there are limits. Moving one terminal reversed amidine to a meta position (DB903) results in a dramatic decrease in complex stability as has been observed for amidine derivatives32 and is expected for compounds that must conform to the shape of the minor groove. Finally, conversion of the pyrrole to an N-CH3 pyrrole (DB890) also results in a large decrease in ΔTm and confirms that the pyrrole -NH of DB884 makes a strong contribution to complex formation as observed in the x-ray structure (Figure 8B).
In order to probe the molecular basis for the very significant interaction differences between the closely related furan (DB613) and pyrrole (DB884) reversed amidine compounds, biosensor-SPR and ITC methods were used to establish a full thermodynamic profile for their binding to an AATT site. The difference between these two compounds is especially interesting since the related diamidines, DB75 and DB262, interact in a very similar manner with AT base pair sequences. The sensorgrams from SPR binding experiments support a significant difference between the affinities of DB884 and DB613 for the AATT sequence (Figure 4). Relative to DB884, results with DB613 show fast kinetics of dissociation from the complex and require a significantly higher concentration to reach saturation of the AATT binding sites. DB884 clearly binds more strongly and the slower observed dissociation rate from the complex demonstrates the stronger molecular interactions with the binding site (Figure 4A). DB884 appears to associate more slowly from the AATT site than both the furan reversed amidine as well as the similar pyrrole diamidine, DB262. It is clearly more difficult to form the complex with DB884 than with any of the other related compounds but once formed, the complex is quite stable and dissociates more slowly than the other related dications. This results in an equilibrium constant for DB884 that is approximately ten times greater than for the furan reversed amidine and is slightly greater than for similar diamidine derivatives.
ITC experiments provide a direct method to obtain the binding enthalpy and, with SPR binding equilibrium constants and ΔG values, allow a full thermodynamic characterization of DNA complexes. Such a full thermodynamic picture provides a complement to the structural perspective from x-ray crystallography. ITC comparison of the interactions of the reversed amidine, DB884 and DB613 and the diamidine analogue DB262 with an AATT DNA sequence indicates that the better binding of DB884 to the DNA minor groove is enthalpic in origin (Table 2). The TΔS term for DB884 binding to the minor groove of the AATT sequence is actually less favorable than that for DB262 despite their similar binding constants. The primary contribution for the net binding of many diamidines, including DB75,7,8 is a binding entropy. In contrast, the molecular basis for the large binding constant for DB884 is the binding enthalpy (Table 2) which can be directly related to extra hydrogen bond between the pyrrole –NH and minor groove base in the center of the AATT sequence, as seen in the x-ray structure (Figure 8B).
CD spectra of DB884 and DB613 bound to AT DNA sequences display strong positive signals in the compound absorption regions and such signals are characteristic of minor groove complex formation at AT sites.25 The minor groove binding mode is confirmed by the x-ray structural results with DB884 (Figures 7–9) and these results also provide a clear explanation for the enthalpy-based increase in affinity of DB884 relative to DB613. An x-ray structure is also available for DB754 and this provides a good model for DB262 binding to the AATT site for comparison with DB884. From ab initio calculations the amidine-phenyl dihedral angle in DB75 and DB262 is 40–45° but the reversed amidine-phenyl angle is increased to near 90°in DB884 and DB613. In the DB75 crystal structure, the amidine-phenyl dihedrals are reduced to 24 and 19° and Hartree-Fock calculations indicate that relatively small energies are required to reduce the amidine-phenyl angles by this amount (Figure 9).
In the DB75-AATT complex the tricyclic aromatic system sits between the walls of the minor groove and the amidines contact the bases at the floor of the groove. Because of the bond angle between the furan and phenyl groups and the constraint of the amidine H-bonds, the furan is pushed too far away from the bases at the floor of the groove to make any direct contacts with the floor. Docking of DB262, based on the furan structure, also suggests that the pyrrole is too far from the groove floor for H-bond interactions. Based on this similarity, it is not surprising that DB75 and DB262 have quite similar binding equilibrium constants, near 1 × 10⁷ M−1. Specificity for the AT sequences arise primarily from the amidine H-bonds, stacking, steric constraints and electrostatic interactions with DNA while the favorable binding entropy must come from dehydration of the groove and compounds.37
The twist of the reversed amidine geometry of DB613 and DB884 in their unbound conformation will not allow them to have favorable interactions with the minor groove (Figure 9). The energy required to reduce the phenyl-reversed amidine dihedral angle to allow the compound to fit into the minor groove is larger than for the phenyl-amidine and the twist angle of the reversed amidine compounds is greater. As a result of the energy cost for the large decrease in dihedral angle and the reversed amidine geometry, DB613 binds approximately ten times more weakly to the AATT site than the related diamidine, DB75. Why then is DB884 able to regain a similar binding affinity to that of the amidines? Interestingly, the different geometry, length and larger twist of the reversed amidines actually allows the central five-member ring of the central heterocyclic system to approach the floor of the groove more closely than with the amidines due to the larger twist at the phenyl-reversed amidine planes. As a result, the pyrrole -NH of DB884 can H-bond with bases in the center of the AATT site. Clearly, this is not possible for the furan ring in DB613. The extra H-bond then contributes to the additional enthalpy observed in ITC experiments and accounts for the stronger binding of DB884 relative to other similar reversed amidines. This observation raises the question, why not twist the amidines of DB262 by a larger amount to allow the pyrrole to H-bond? Twisting the amidines a larger amount, however, costs binding energy and weakens the amidine-base H-bonds. A resulting H-bond from the pyrrole to the central bases of AATT would make up some of the lost binding energy but no advantage is obtained, and it appears that binding would actually be slightly weaker in the more highly twisted state.
From these models most of the comparative results in Tables 1 and 2 can be understood. Converting the pyrrole -NH of DB884 to an -NMe costs an H-bond and significantly weakens binding. The x-ray structure suggests that the addition of an ethyl or t-butyl group to the reversed amidine phenyl (DB1393 and DB1419) will have little effect on the structure or DNA interactions, as observed. The size of the napthyl in DB1215 and the size and twist of the biphenyl in DB1480 reduce binding. It is somewhat surprising that the phenyl to –CH3 change in DB884 to DB1390 causes such a large reduction in K. The result suggests that the reversed amidine phenyl is playing a large role in stabilizing the DB884 complex. The phenyl may be necessary to help place and hold the reversed amidine in an appropriate position and with the correct twist to allow H-bonds to form. Such a placement at the correct angle is essential for the pyrrole-base H-bonds in the center of the binding site. It appears that the substituted reversed amidine and the pyrrole of DB884, and closely related derivatives, are optimally designed to bind strongly to AT base pair sites in the DNA minor groove. The DB884 system provides a new model for strong binding and recognition of the minor groove at AT sequences. The central pyrrole to base H-bonding interactions in DB884 is unprecedented and suggest a new way to enhance DNA affinity and specificity through binding enthalpy.
Supplementary Material
Scheme 1 and synthetic details; Tm figures for comparison of DB884, DB613 and DB890; binding plot for DB262 and crystallographic data for DB884. This material is available free of charge via the Internet at http://pubs.acs.org.
Acknowledgments
This work was supported by grants (to W. D. W. and D. W. B.) from the National Institutes of Health (AI064200), (to S. N.) from Cancer Research UK., and (to C.B) from the Ligue Nationale Francaise Contre le Cancer. C. B. thanks William Laine for expert technical assistance in the footprinting studies.
References
- 1.Tidwell RR, Boykin DW. In: Dicationic DNA minor-groove binders as antimicrobial agents. In DNA and RNA Binders: From Small Molecules to Drugs. Demeunynck M, Bailly C, Wilson WD, editors. Vol. 2. WILEY-VCH; Weinheim: 2003. pp. 414–460. [Google Scholar]
- 2.Wilson WD, Nguyen B, Tanious FA, Mathis A, Hall JE, Stephens CE, Boykin DW. Curr Med Chem Anti-Canc Agents. 2005;5:389–408. doi: 10.2174/1568011054222319. [DOI] [PubMed] [Google Scholar]
- 3.Wilson WD, Tanious FA, Ding D, Kumar A, Boykin DW, Colson P, Houssier C, Bailly C. J Am Chem Soc. 1998;120:10310–10321. [Google Scholar]
- 4.Laughton CA, Tanious F, Nunn CM, Boykin DW, Wilson WD, Neidle S. Biochemistry. 1996;35:5655–61. doi: 10.1021/bi952162r. [DOI] [PubMed] [Google Scholar]
- 5.Kopka ML, Yoon C, Goodsell D, Pjura P, Dickerson RE. Proc Natl Acad Sci U S A. 1985;82:1376–1380. doi: 10.1073/pnas.82.5.1376. [DOI] [PMC free article] [PubMed] [Google Scholar]
- 6.Marky LA, Breslauer KJ. Proc Natl Acad Sci U S A. 1987;84:4359–4363. doi: 10.1073/pnas.84.13.4359. [DOI] [PMC free article] [PubMed] [Google Scholar]
- 7.Mazur S, Tanious FA, Ding D, Kumar A, Boykin DW, Simpson IJ, Neidle S, Wilson WD. J Mol Biol. 2000;300:321–337. doi: 10.1006/jmbi.2000.3869. [DOI] [PubMed] [Google Scholar]
- 8.a) Wang L, Bailly C, Kumar A, Ding D, Bajic M, Boykin DW, Wilson WD. Proc Natl Acad Sci U S A. 2000;97:12–6. doi: 10.1073/pnas.97.1.12. [DOI] [PMC free article] [PubMed] [Google Scholar]; b) Wang L, Kumar A, Boykin DW, Bailly C, Wilson WD. J Mol Biol. 2002;317:361–74. doi: 10.1006/jmbi.2002.5433. [DOI] [PubMed] [Google Scholar]
- 9.Mallena S, Lee MP, Bailly C, Neidle S, Kumar A, Boykin DW, Wilson WD. J Am Chem Soc. 2004;126:13659–69. doi: 10.1021/ja048175m. [DOI] [PubMed] [Google Scholar]
- 10.Dervan PB. Bioorg Med Chem. 2001;9:2215–35. doi: 10.1016/s0968-0896(01)00262-0. [DOI] [PubMed] [Google Scholar]
- 11.Cory M, Tidwell RR, Fairley TA. J Med Chem. 1992;35:431–438. doi: 10.1021/jm00081a003. [DOI] [PubMed] [Google Scholar]
- 12.Miao Y, Lee MP, Parkinson GN, Batista-Parra A, Ismail MA, Neidle S, Boykin DW, Wilson WD. Biochemistry. 2005;44:14701–8. doi: 10.1021/bi051791q. [DOI] [PubMed] [Google Scholar]
- 13.Boykin DW, Hall JE, Bender BC, Tidwell RR. Biorg Med Chem Lett. 1996;6:3017–20. [Google Scholar]
- 14.Mathis AM, Holman JL, Sturk LM, Ismail MA, Boykin DW, Tidwell RR, Hall JE. Antimicrob Agents Chemother. 2006;50:2185–91. doi: 10.1128/AAC.00192-06. [DOI] [PMC free article] [PubMed] [Google Scholar]
- 15.Lanteri CA, Stewart ML, Brock JM, Alibu VP, Meshnick SR, Tidwell RR, Barrett MP. Roles for the Trypanosoma brucei P2 Transporter in DB75 Uptake and Resistance. Vol. 70. 2006. pp. 1585–1592. [DOI] [PubMed] [Google Scholar]
- 16.a) Arafa RK, Brun R, Wenzler T, Tanious FA, Wilson WD, Stephens CE, Boykin DW. J Med Chem. 2005;48:5480–5488. doi: 10.1021/jm058190h. [DOI] [PubMed] [Google Scholar]; b) Arafa RK, Brun R, Werbovetz KA, Wilson WD, Boykin DW. Heterocyclic Comm. 2004;10:423–428. [Google Scholar]; c) Stephens CE, Tanious F, Kim S, Wilson WD, Schell WA, Perfect JR, Franzblau SG, Boykin DW. J Med Chem. 2001;44:1741–1748. doi: 10.1021/jm000413a. [DOI] [PubMed] [Google Scholar]
- 17.Fasman GD. Handbook of Biochemistry and Molecular Biology, Nucleic Acids. Vol. 3. CRC Press; Cleveland, OH: 1975. pp. 1–589. [Google Scholar]
- 18.Bailly C, Kluza J, Martin C, Ellis T, Waring MJ. Methods Mol Biol. 288;2004:319–342. doi: 10.1385/1-59259-823-4:319. [DOI] [PubMed] [Google Scholar]
- 19.Nguyen B, Tanious FA, Wilson WD. Methods. 2006 in press. [Google Scholar]
- 20.Davis TM, Wilson WD. Methods Enzymol. 2001;340:22–51. doi: 10.1016/s0076-6879(01)40416-2. [DOI] [PubMed] [Google Scholar]
- 21.Otwinowski ZM, Minor W. Methods Enzymol. 1997;276:307–326. doi: 10.1016/S0076-6879(97)76066-X. [DOI] [PubMed] [Google Scholar]
- 22.Brown DG, Sanderson MR, Skelly JV, Jenkins TC, Brown T, Garman E, Stuart DI, Neidle S. EMBO J. 1990;9:1329–1334. doi: 10.1002/j.1460-2075.1990.tb08242.x. [DOI] [PMC free article] [PubMed] [Google Scholar]
- 23.Wilson WD, Tanious FA, Fernandez-Saiz M, Rigl CT. Methods Mol Biol. 1997;90:219–240. doi: 10.1385/0-89603-447-X:219. [DOI] [PubMed] [Google Scholar]
- 24.Xiaochun Shi, Chaires Jonathan B. Nucleic Acids Res. 2006;34:e14. doi: 10.1093/nar/gnj012. [DOI] [PMC free article] [PubMed] [Google Scholar]
- 25.Rodger A, Nordén B. Circular Dichroism and Linear Dichroism. Oxford University Press; New York: 1997. [Google Scholar]
- 26.Day YS, Baird CL, Rich RL, Myszka DG. Protein Sci. 2002;11:1017–1025. doi: 10.1110/ps.4330102. [DOI] [PMC free article] [PubMed] [Google Scholar]
- 27.Myszka DG. Methods Enzymol. 2000;323:325–340. doi: 10.1016/s0076-6879(00)23372-7. [DOI] [PubMed] [Google Scholar]
- 28.Ladbury John E, Chowdhry Babur. Chemistry & Biology. 1996;3:791–801. doi: 10.1016/s1074-5521(96)90063-0. [DOI] [PubMed] [Google Scholar]
- 29.Ladbury John E. Biotechniques. 2004;37:885–887. doi: 10.2144/04376TE01. [DOI] [PubMed] [Google Scholar]
- 30.Haq I. Arch Biochem Biophys. 2002;403:1–15. doi: 10.1016/S0003-9861(02)00202-3. [DOI] [PubMed] [Google Scholar]
- 31.Kaul M, Pilch DS. Biochemistry. 2002;41:7695–7706. doi: 10.1021/bi020130f. [DOI] [PubMed] [Google Scholar]
- 32.Nguyen B, Tardy C, Bailly C, Colson P, Houssier C, Kumar A, Boykin DW, Wilson WD. Biopolymers. 2002;63:281–97. doi: 10.1002/bip.10073. [DOI] [PubMed] [Google Scholar]
- 33.Roussel A, Cambillau C. Turbo Frodo, in Silicon Graphics Geometry Partners Directory. Vol. 86. Silicon Graphics; Mountain View, CA: 1991. [Google Scholar]
- 34.Pettersen EF, Goddard TD, Huang CC, Couch GS, Greenblatt DM, Meng EC, Ferrin TE. J Comput Chem. 2004;25:1605–1612. doi: 10.1002/jcc.20084. [DOI] [PubMed] [Google Scholar]
- 35.Grein F. J Phy Chem. 2002;106:3823–3827. [Google Scholar]
- 36.Goller A, Grummt U. Chemical Physics Letters. 2000;321:399–405. [Google Scholar]
- 37.Neidle S. Nat Prod Rep. 2001;18:291–309. doi: 10.1039/a705982e. [DOI] [PubMed] [Google Scholar]
Associated Data
This section collects any data citations, data availability statements, or supplementary materials included in this article.
Supplementary Materials
Scheme 1 and synthetic details; Tm figures for comparison of DB884, DB613 and DB890; binding plot for DB262 and crystallographic data for DB884. This material is available free of charge via the Internet at http://pubs.acs.org.