Abstract
Polyamine analogues show antitumor activity in experimental models and their ability to alter activity of cytotoxic chemotherapeutic agents in breast cancer is well documented. Association of polyamines with nucleic acids and protein is included in their mechanism of action. The aim of this study was to examine the interaction of human serum albumin (HSA) with several polyamine analogues such as 1,11-diamino-4,8-diazaundecane (333), 3,7,11,15-tetrazaheptadecane.4HCl (BE-333) and 3,7,11,15,19-pentazahenicosane.5HCl (BE-3333) in aqueous solution at physiological conditions, using a constant protein concentration and various polyamine contents (μM to mM). FTIR, UV-visible and CD spectroscopic methods were used to determine the polyamine binding mode and the effects of polyamine complexation on protein stability and secondary structure.
Structural analysis showed that polyamines bind non-specifically (H-bonding) via polypeptide polar groups with binding constants of K333 = 9.30 × 10³ M−1, KBE-333 = 5.63 × 10² M−1 and KBE-3333 = 3.66 × 10² M−1. The protein secondary structure showed major alterations with reduction of α-helix from 55% (free protein) to 43–50% and increase of β-sheet from 17% (free protein) to 29–36% in the 333-, BE-333- and BE-3333 complexes, indicating a partial protein unfolding upon polyamine interaction. HSA structure was less perturbed by polyamine analogues than those of the biogenic polyamines.
Keywords: polyamine analogues, protein, HSA, binding mode, secondary structure, FTIR, CD spectroscopy
Introduction
Polyamines are essential for cell growth and differentiation.1 It has been shown that polyamine levels are increased in malignant tissues and this indicated that polyamine metabolic pathway is a target for antineoplastic therapy.2–5 Structural polyamine analogues (Scheme 1) can mimic the natural polyamines in their self-regulatory role but are unable to substitute for biogenic polyamines in terms of supporting cell growth and differentiation.6–8 The analogues have shown major antitumor activity in multiple experimental model systems including breast cancer.9–13 The growth of several breast cancer cell lines is inhibited by synthetic polyamine analogues in vitro.5,14 New synthetic polyamines were also found to be effective against AIDS-associated infection.15 Interactions of biogenic polyamine and polyamine analogues with DNA and RNA are extensively investigated.16–18 Complexation of biogenic polyamines, e.g., spermine, spermidine and putrescine with human serum albumin has been studied and the effect of polyamine-HSA complexation on protein secondary structure was recently reported.19
Scheme 1.
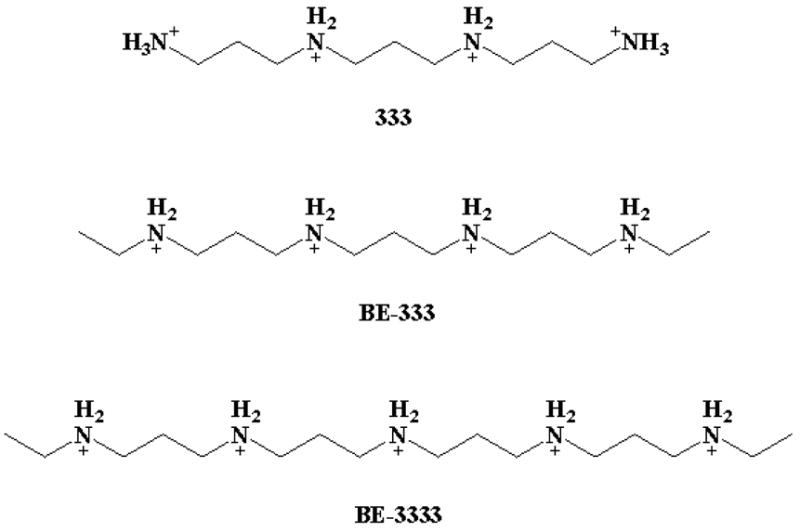
Polyamine analogues
Human serum albumin (Scheme 2)20 is a transport protein and the principal extracellular protein with a high concentration in blood plasma.21, 22 HSA is a globular protein composed of three structurally similar domains (I, II and III), each containing two subdomains (A and B) and stabilized by 17 disulphide bridges.21–27 Aromatic and heterocyclic ligands were found to bind within two hydrophobic pockets in subdomains IIA and IIIA, namely site I and site II.21–27 Seven binding sites are localized for fatty acids in subdomains IB, IIIA, IIIB and on the subdomain interfaces.20 HSA has also a high affinity metal binding site at the N-terminus.21 These multiple binding sites underlie the exceptional ability of HSA to interact with many organic and inorganic molecules and make this protein an important regulator of intercellular fluxes, as well as the pharmacokinetic behavior of many drugs.21–28 Therefore, it was of interest to study the interaction of polyamine analogues with HSA in aqueous solution and to examine the effects of polyamine complexation on protein stability and secondary structure.
Scheme 2.
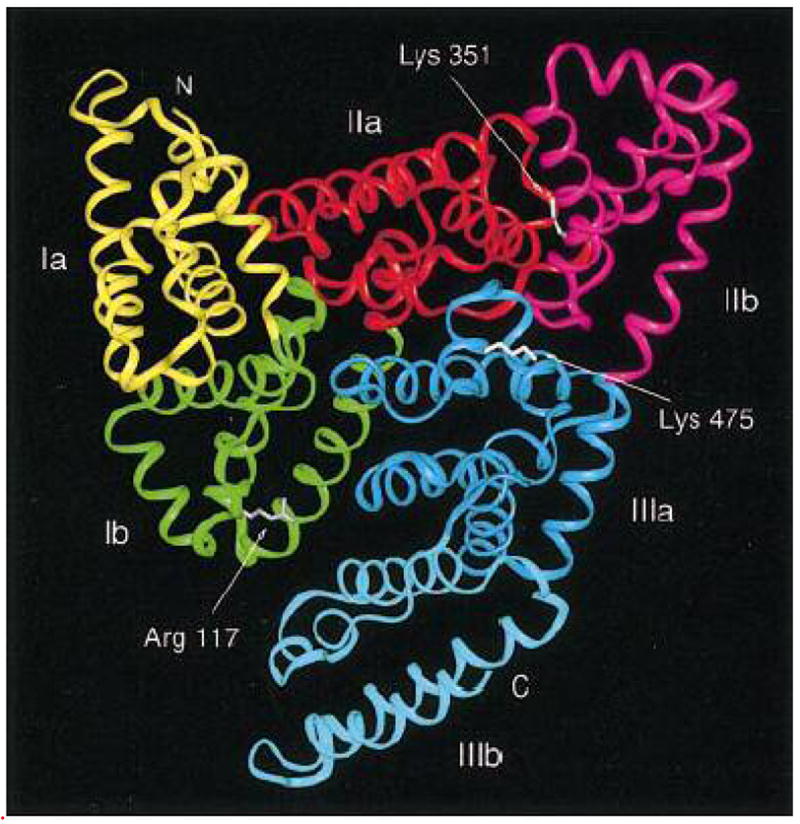
Chemical structure of human serum albumin
In this report we present FTIR, CD and UV-visible spectroscopic results on the interaction of HSA with synthetic polyamine analogues 333, BE-333 and BE-3333 in aqueous solution at physiological conditions using constant protein concentration and various drug contents. Structural information regarding the polyamine binding mode and the effects of polyamine-HSA complexation on the protein stability and secondary structure are provided. Furthermore, we compared polyamine analogue-HSA adducts with those of the corresponding biogenic polyamine-protein complexes.
Experimental Section
Materials
Human serum albumin fraction V was purchased from Sigma Chemical Company and used as supplied. Polyamine analogues, 333, BE-333 and BE-3333 were synthesized in the laboratory of Dr. Akira Shirahata (Josai University, Saitama, Japan). Other chemicals were of reagent grade and used without further purification.
Preparation of Stock Solutions
Human serum albumin was dissolved in aqueous solution (40 mg/ml or 0.5 mM) containing Tris-HCl buffer (pH 7.2). The protein concentration was determined spectrophotometrically using the extinction coefficient of 36 500 M−1 cm−1 at 280 nm.29 In this study, HSA did not have its fatty acids removed, thus being in a situation closer to that which occurs in vivo. Under normal physiological conditions, between 0.1 to 2 fatty acid molecules are bound to albumin.21,25 The polyamine solutions (1 μM to 2 mM) were prepared in distilled water.
Absorption Spectroscopy
The absorption spectra were recorded on a Perkin Elmer Lambda 40 Spectrophotometer. Quartz cuvettes of 1 cm were used. The absorption spectra were recorded for free HSA (12.5 μM) and for its complexes with each polyamine analogue (1 μM to 1 mM).
To calculate the polyamine-protein binding constant, the data are treated according to the following equations:
| Eq. 1 |
| Eq. 2 |
The values of the binding constants K were obtained from the protein absorption at 280 nm according to the methods published in the literature,30, 31 where the bindings of various ligands to hemoglobin were described. For weak binding affinities the data were treated using linear reciprocal plots based on the following equation:
| Eq. 3 |
where, A0 is the absorbance of protein at 280 nm in the absence of ligand, A∞ is the final absorbance of the ligated-protein and A is the recorded absorbance at different ligand concentrations. The double reciprocal plot of 1/(A-A0) vs. 1/Cligand is linear and the binding constant (K) can be estimated from the ratio of the intercept to the slope.30, 31
CD Spectroscopy
Spectra of HSA and its polyamine complexes were recorded with a Jasco J-720 spectropolarimeter. For measurements in the far-UV region (178–260 nm), a quartz cell with a path length of 0.01 cm was used in nitrogen atmosphere. HSA concentration was kept constant (12.5 μM) while varying each polyamine analogue concentration (0.25, 0.5 and 1 mM). Five scans were accumulated at a scan speed of 50 nm per minute, with data being collected at every nm from 178 to 260 nm. Sample temperature was maintained at 25 °C using a Neslab RTE-111 circulating water bath connected to the water-jacketed quartz cuvettes. Spectra were corrected for buffer signal and conversion to the Mol CD (Δε) was performed with the Jasco Standard Analysis software. The protein secondary structure was calculated using which predicts the different assignments of secondary structures by comparison with different ranges of proteins from high quality X-ray diffraction data.32, 33 The program CDSSTR is provided in CDPro software package which is available at the website: http://lamar.colostate.edu/~sreeram/CDPro.
FTIR Spectroscopic Measurements
Infrared spectra were recorded on a FTIR spectrometer (Impact 420 model), equipped with DTGS (deuterated triglycine sulfate) detector and KBr beam splitter, using AgBr windows. Solution of polyamine was added dropwise to the protein solution with constant stirring to ensure the formation of homogeneous solution and to attain the desired polyamine concentrations of 0.125, 0.25, 0.5 and 1 mM with a final protein concentration of 0.25 mM (20 mg/ml). Spectra were collected after 2h incubation of HSA with polyamine solution at room temperature, using the hydrated films of samples containing various concentrations of polyamine with the same protein content. Interferograms were accumulated over the spectral range 4000-600 cm−1 with a nominal resolution of 4 cm−1 and a minimum of 100 scans. The difference spectra [(protein solution + polyamine solution) − (protein solution)] were generated using the polypeptide antisymmetric and symmetric C-H stretching bands,34 located at 2900-2800 cm−1, as internal standard. These bands, which are due to C-H stretching vibrations, do not undergo any spectral changes (shifting or intensity variation) upon complexation, and therefore, are commonly used as internal standard. When producing difference spectra these bands are adjusted to the baseline level in order to normalize difference spectra. Details regarding infrared spectral treatment are given in our recent publication.19
Analysis of Protein Secondary Structure
Analysis of the secondary structure of HSA and its polyamine analogue complexes was carried out on the basis of the procedure already reported.35 The protein secondary structure is determined from the shape of the amide I band, located at 1650–1660 cm−1. Fourier self-deconvolution and second derivative resolution enhancement were applied to increase the spectral resolution in the region of 1700-1600 cm−1. The second derivatives were obtained using a point convolution 11 or 13. The resolution enhancement resulting from self-deconvolution and the second derivative is such that the number and the position of the bands to be fitted are determined. In order to quantify the area of the different components of amide I contour, revealed by self-deconvolution and second derivative, a least-square iterative curve fitting was used to fit the Gaussian line shapes to the spectra between 1700-1600 cm−1. The details of spectral manipulation regarding curve-fitting are previously reported.19,36,37 The curve-fitting analysis was performed using the GRAMS/AI Version 7.01 software of the Galactic Industries Corporation.
Results and Discussion
FTIR Spectra of Polyamine-HSA Adducts
Evidence regarding polyamine-HSA complexes comes from infrared spectroscopic results. Since there was no major spectral shifting for the protein amide I band at 1656 cm−1 (mainly C=O stretch) and amide II band at 1543 cm−1 (C-N stretching coupled with N-H bending modes),34,35 upon polyamine interaction, the difference spectra [(protein solution + polyamine solution) –(protein solution)] were obtained in order to monitor the intensity variations of these vibrations and the results are shown in Figures 1, 2 and 3. Similarly, the infrared self-deconvolution with second derivative resolution enhancement and curve-fitting procedures35 were used to determine the protein secondary structures in the presence of polyamine analogues (Figure 4 and Table 1). CD spectroscopy was also used to obtain additional information on protein conformational changes and the results are shown in Figure 5 and Table 2.
Figure 1.
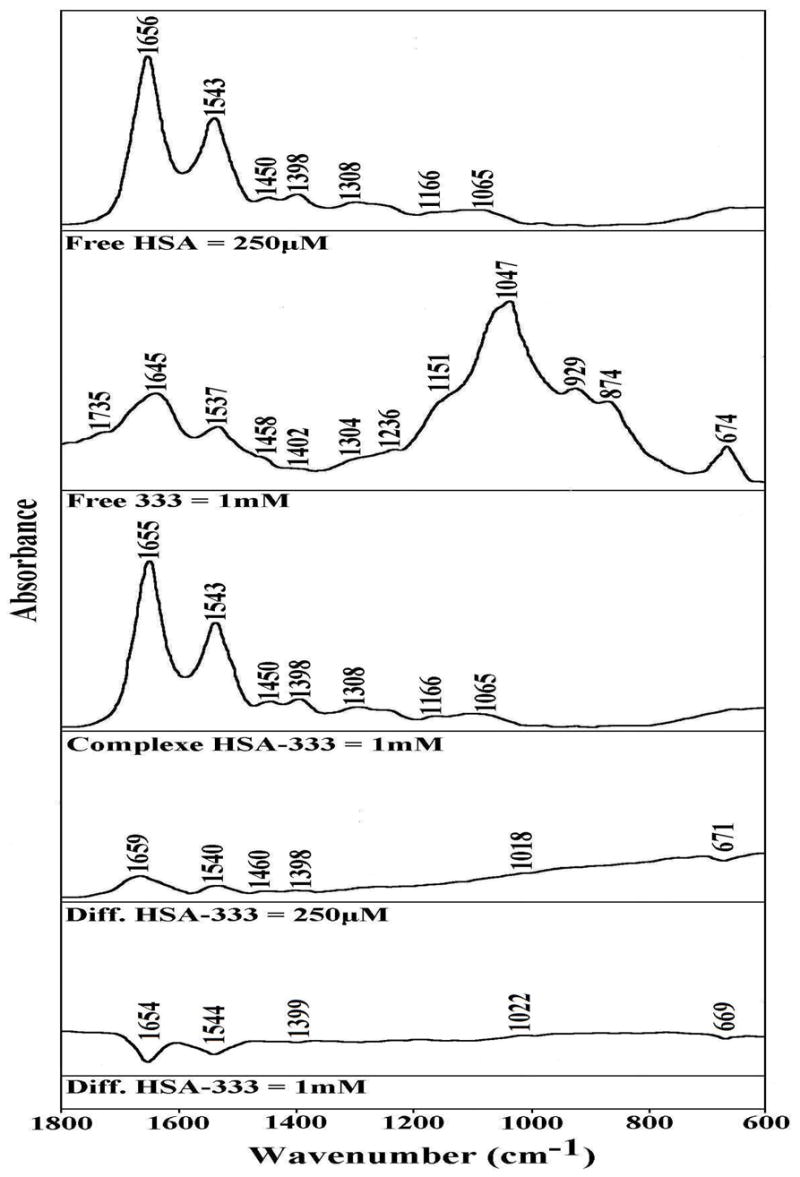
FTIR spectra in the region of 1800-600 cm−1 of hydrated films (pH 7.2) for free HSA (0.25 mM) and 333-HSA adducts (top three curves) and difference spectra (diff.) of polyamine-HSA complexes (bottom two curves) obtained at different polyamine concentrations (indicated on the figure).
Figure 2.
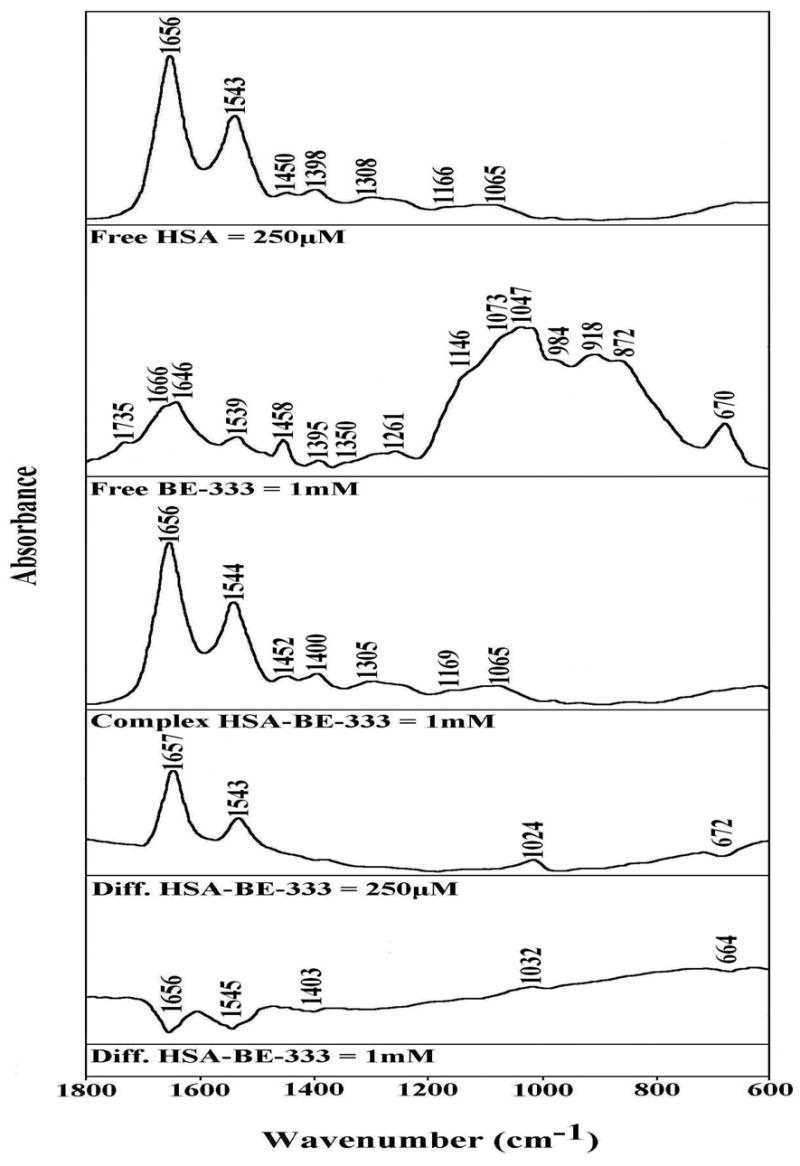
FTIR spectra in the region of 1800-600 cm−1 of hydrated films (pH 7.2) for free HSA (0.25 mM) and BE-333-HSA adducts (top three curves) and difference spectra (diff.) of polyamine-HSA complexes (bottom two curves) obtained at different polyamine concentrations (indicated on figure).
Figure 3.
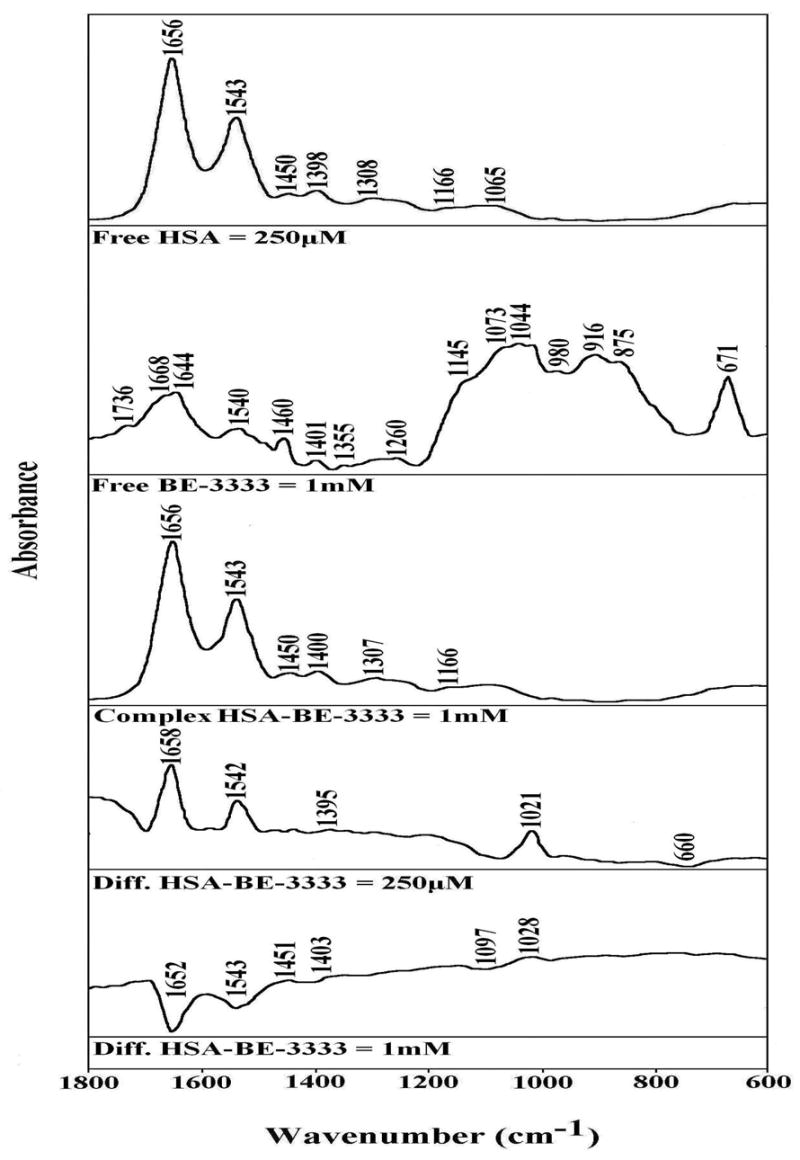
FTIR spectra in the region of 1800-600 cm−1 of hydrated films (pH 7.2) for free HSA (0.25 mM) and BE-3333-HSA adducts (top three curves) and difference spectra (diff.) of polyamine-HSA complexes (bottom two curves) obtained at different polyamine concentrations (indicated on figure).
Figure 4.
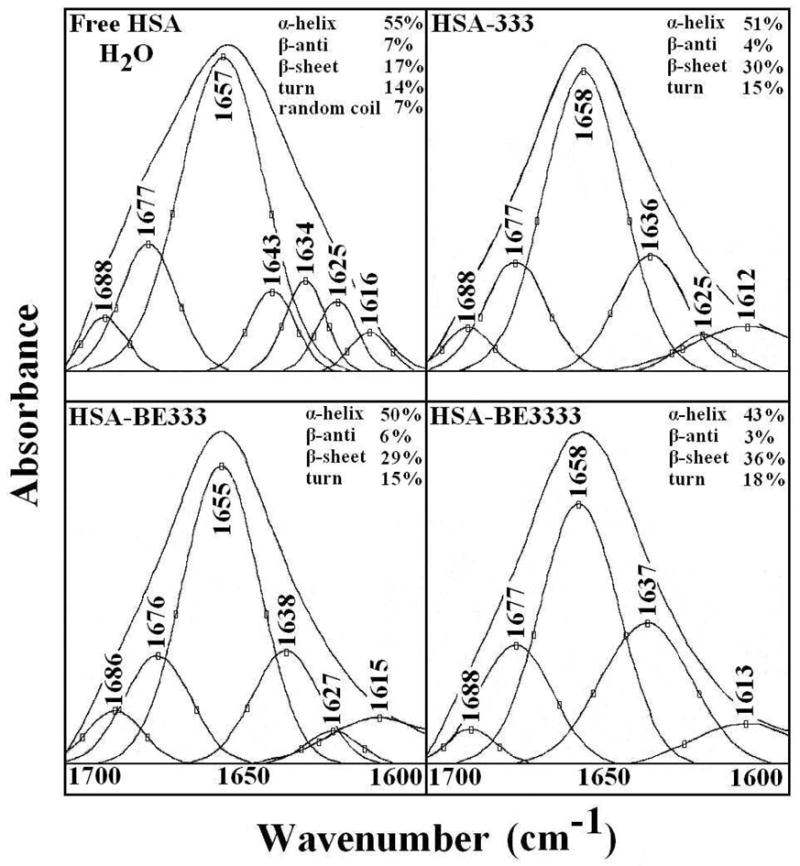
Second derivative resolution enhancement and curve-fitted amide I region (1700-1612 cm−1) for free HSA and its polyamine adducts in aqueous solution with 1 mM polyamine and 1.5 mM protein concentrations.
Table 1.
Secondary structure analysis (infrared) for the free HSA and its polyamine analogue complexes in H20 at pH 7.2 (the mean deviation was ± 1.0 % to ± 2.0 % for the free protein and its polyamine complexes).
| Amide I components (cm−1) | Free HSA (%) 0.25 mM | HSA-333 (%) 1 mM | HSA-BE333 (%) 1 mM | HSA-BE3333 (%) 1 mM |
|---|---|---|---|---|
| 1692-1680 β-anti | 7 ± 1 | 4 ± 1 | 6 ± 1 | 3 ± 1 |
| 1680-1660 turn | 14 ± 1 | 15 ± 2 | 15 ± 2 | 18 ± 1 |
| 1660-1650 α-helix | 55 ± 1 | 51 ± 1 | 50 ± 1 | 43± 1 |
| 1648-1641 random coil | 7 ± 1 | - | - | - |
| 1640-1610 β-sheet | 17 ± 1 | 30 ± 1 | 29 ± 1 | 36 ± 1 |
Figure 5.
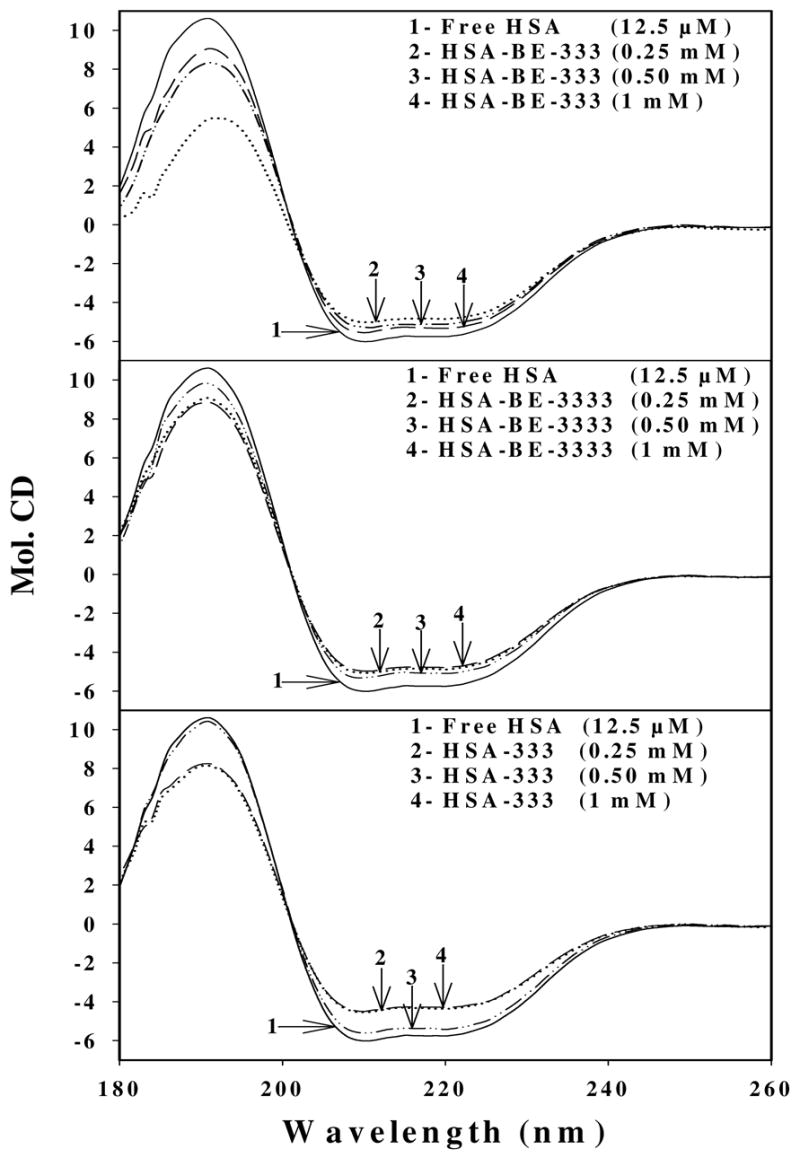
Circular dichroism of the free HSA and its polyamine analogue complexes in aqueous solution with protein concentration of 12.5 μM and polyamine concentrations of 0.25, 0.5 and 1 mM.
Table 2.
Secondary structure of HSA complexes with polyamine analogues calculated by CDSSTR software (CD spectra). HSA concentration in free and in complexes was 12.5 μM
| Polyamine concentration (mM) | α-helix (± 3 %) | β-strand (± 2 %) | β-turn (± 2 %) | Others (± 2 %) |
|---|---|---|---|---|
| (Free HSA) | 54 | 11 | 14 | 21 |
| 333-HSA (1 mM) | 48 | 12 | 16 | 24 |
| BE-333-HSA (1 mM) | 49 | 10 | 18 | 23 |
| BE-3333-HSA (1 mM) | 49 | 10 | 15 | 26 |
At low polyamine concentration (250 μM), major intensity changes were observed for the protein amide I and amide II bands at 1656 and 1543 cm−1, respectively, in difference spectra Figs 1, 2 and 3: diff.). The positive features at 1659 and 1540 cm−1 (Fig. 1, diff. HSA-333), 1657 and 1543 cm−1 (Fig. 2, diff. HSA-BE-333), and 1658 and 1542 cm−1 (Fig. 3, diff. HSA-BE-3333) in the difference spectra of polyamine-protein complexes are related to increase in intensity of the amide I and amide II bands at 1656 and 1543 cm−1, upon polyamine analogue interaction (Figs, 1, 2 and 3, diff. 250 μM). The increase in intensity of the amide I and Amide II bands is due to polyamine binding to protein C=O and C=N groups. As analogue concentration increased to 1 mM, strong negative features were observed at 1654 and at 1544 cm−1 (HSA-333), at 1656 and 1545 cm−1 (HSA-BE-333) and at 1652 and 1543 cm−1 (HSA-BE-3333), upon polyamine-protein interaction (Figs 1, 2 and 3, diff. 1 mM). The observed decrease in intensities of the amide I and amide II bands are due to alteration of protein conformation (reduction of α-helix) at high polyamine concentration.
A quantitative analysis of the protein secondary structure for the free HSA and its polyamine analogue adducts in hydrated films has been carried out and the results are shown in Figure 4 and Table 1. The free protein contained major α-helix 55 % (1657 cm−1), β-sheet 17 % (1616, 1625 and 1634 cm−1), turn structure 14 % (1677 cm−1), β-antiparallel 7 % (1688 cm−1) and random coil 7 % (1643 cm−1) (Fig. 4 and Table 1). The β-sheet structure is composed of three components at 1616 (inter β-strand), 1625 (intra β-strand) and 1634 cm−1 (hydrated) that are consistent with the spectroscopic studies of human serum albumin.38,39 At low polyamine analogue concentration, no major alterations of protein conformation were observed. Consistent with the decrease of intensity in the difference spectra mentioned above around 1654 and 1544 cm−1, at high drug content, the α-helix structure was reduced from 55 % to 51 % (HSA-333), 50 % (HSA-BE-333) and to 43 % (HSA-BE-3333), while the β-sheet structure increased from 17 % to 30 % (HSA-333), to 29 % (HSA-BE-333) and to 36 % (HSA-BE-3333), upon polyamine analogue interaction (Fig. 4 and Table 1). The decrease in α-helix and increase in β-sheet structure are evidence for some degree of protein unfolding at high polyamine concentration (1 mM).
CD Spectra
The CD spectroscopic results shown in Figure 5 and Table 2 exhibit marked similarities with those of infrared data. Major reduction of α-helix from 54 % (free HSA) to 48 % (HSA-BE-333), 49 % (HSA-BE-3333) and to 49 % (HSA-333) with increase in β-turn from 14 % (free HSA) to 15–18 % (complexes) and other components from 21 % (free HSA) to 23–26 % (complexes) were observed (Fig. 5 and Table 2). The CD data related to conformational changes are consistent with the infrared results that show major reduction of α-helix and increase of β-structure, upon polyamine-protein interaction (Fig. 4 and Table 1). The conformational changes observed in CD and IR results are indicative of a partial protein unfolding upon polyamine analogue-HSA complexation. It should be noted that there are some minor differences between IR vs CD results regarding protein conformation (Tables 1 and 2). The reason for the differences is due to the sample preparation since IR measurements were performed in hydrated films whereas CD were conducted in aqueous solutions. Similarly, polyamines to HSA concentration ratios were different in the two cases. Similar differences were also observed between IR and CD measurements for several proteins where sample preparations were different for IR and CD measurements.40
Stability of Polyamine Analogue-HSA Complexes
The polyamine-HSA binding constants were determined using UV-visible spectroscopic method (described in Materials and Methods). The double reciprocal plot of 1/(A-A0) vs. 1/(polyamine concentration) is linear and the binding constant (K) can be estimated from the ratio of the intercept to the slope (Fig. 6). A0 is the initial absorbance of the free HSA at 280 nm and A is the recorded absorbance at different polyamine concentrations. One binding site was observed for each polyamine-protein complex and the overall binding constants estimated were K333 = 9.30 × 10³ M−1, KBE-333 = 5.63 × 10² M−1 and KBE-3333 = 3.66 × 10² M−1 (Fig. 6). The association constants calculated for the polyamine-HSA adducts show non-specific analogue-protein interaction with respect to the other strong ligand-protein complexes with binding constants ranging from 106 M−1 to 108 M−1.41–45
Figure 6.
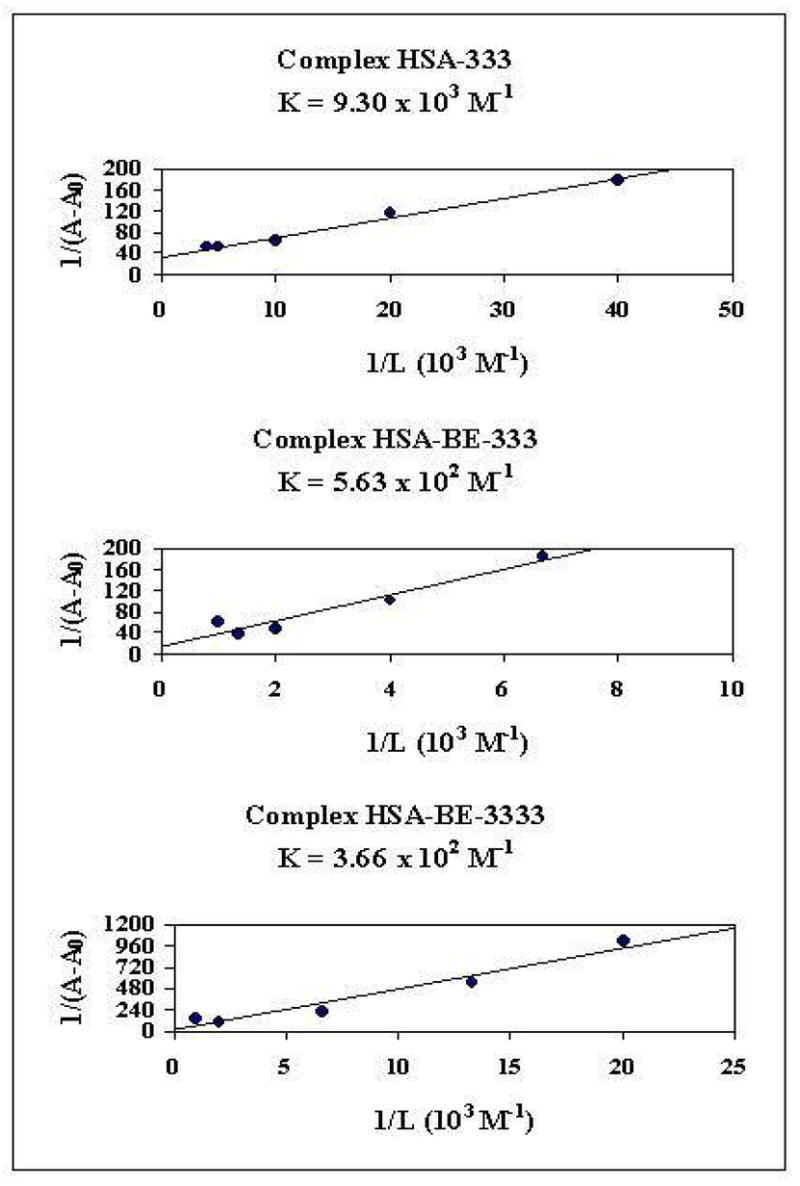
The plot of 1/(A-A0) vs (1/L) and the binding constant K for polyamine-HSA complexes, where A0 is the initial absorbance of HSA (280 nm) and A is the recorded absorbance at different polyamine concentrations (L).
Comparison Between Polyamine Analogue-HSA and Biogenic Polyamine-HSA Interactions
The polyamine-HSA binding generally occurred at protein surface via H-bonding interactions. However, in our previous paper19, using UV-visible absorption spectroscopy, stronger affinity was observed for biogenic polyamine-HSA with binding constants of Kspermine = 1.7 × 10⁴ M−1, Kspermidine = 5.4 × 10³ M−1 and Kputrescine = 3.9 × 10³ M−1 with respect to those of the polyamine analogue-HSA complexes K333 = 9.30 × 10³ M−1, KBE-333 = 5.63 × 10² M−1 and KBE-3333 = 3.66 × 10² M−1. The number of positive charges associated with biogenic polyamine contributed to the stability of the complexes formed in the order spermine > spermidine > putrescine, while it did not play a similar role for polyamine analogue-protein complexation with order of 333 > BE-333 > BE-3333. In general, different perturbations of protein secondary structure were observed for biogenic polyamine compared with polyamine analogues: 1) major reduction of α-helix from 55 % (free HSA) to 40 % (spermine), 43 % (spermidine) and 40 % (putrescine) (Table 3) than those of the polyamine analogues with reduced α-helix 51 % (333), 50 % (BE-333) and 43 % (BE-3333) (Table 1); 2) bigger increase of β-structure induced by polyamine analogues than by biogenic polyamines (Table 1 vs Table 3); 3) random coil disappears with polyamine analogues and seems to be converted to β-sheet structure. The observed structural changes could be indicative of a larger protein unfolding induced by biogenic polyamine than by polyamine analogues.
Table 3.
Secondary structure analysis (infrared) for the free HSA and its biogenic polyamine complexes in H20 at pH 7.2 (the mean deviation was ± 1.0 % to ± 2.0 % for the free protein and its polyamine complexes) (19).
| Amide I components (cm−1) | Free HSA (%) | HSA-spermine (%) 1 mM | HSA-spermidine (%) 1 mM | HSA-putrescine (%) 1 mM |
|---|---|---|---|---|
| 1692-1680 β-anti | 7 ± 2 | 10 ± 1 | 3 ± 1 | 5 ± 1 |
| 1680-1660 turn | 14 ± 1 | 20 ± 2 | 23 ± 2 | 22 ± 1 |
| 1660-1650 α-helix | 55 ± 1 | 40 ± 1 | 43 ± 1 | 40 ± 1 |
| 1648-1641 random coil | 7 ± 1 | 7 ± 1 | 7 ± 1 | - |
| 1640-1610 β-sheet | 17 ± 1 | 23 ± 1 | 24± 1 | 33 ± 1 |
In conclusion, as could be noticed from preceding results, the binding constants of natural polyamines (spermine, spermidine and putrescine) remains in the millimolar to micromolar range, in spite of the decrease in the number of positive charges. However, binding constants decrease more drastically when the spacing of positive charges (as in 333) and end groups (as in BE-333) change, compared to the value of spermine. The conformational changes induced by 1 mM spermine, spermidine and putrescine seem to be in the comparable range. This is reminiscent of the well-known ability of polyamines to compensate for each other when one of them is in short supply, when an inhibitor is used to selectively decrease one of the natural polyamines. However, the polyamine analogues, 333 and BE-333 have lost the ability to influence conformation as compared to spermine at 1 mM concentration. In addition, BE-3333 was as effective as spermine, probably because part of the interaction sites lost by the occupation of end groups is compensated by the presence of additional positive charge as a pentamine. Interestingly, this effect was not reflected in the binding constant, which remained low compared to that of spermine, suggesting that even with low affinity interactions, there could be significant conformational changes. HSA-polyamine/polyamine analogue interactions thus provide a model for learning about the influence of polyamines on protein structure and conformation.
Acknowledgments
This work was supported by grants from Natural Sciences and Engineering Research Council of Canada (NSERC) and the National Institute of Health (CA080163) of USA. We highly appreciate the help of Dr. C. D. Kanakis from Agricultural University of Athens for curve-fitting analysis.
Abbreviations
- HSA
human serum albumin
- 333
1,1-diamino-4,8-diazaundecane.4HCl
- BE-333
3,7,11,15-tetrazaheptadecane. 4HCl
- BE-3333
3,7,11,15,19-pentazahenicosane.5HCl
- FTIR
Fourier transform infrared spectroscopy
- CD
circular dichroism
References
- 1.Tabor CW, Tabor H. Annu Rev Biochem. 1984;53:749. doi: 10.1146/annurev.bi.53.070184.003533. [DOI] [PubMed] [Google Scholar]
- 2.Pegg AE. Cancer Res. 1988;48:759. [PubMed] [Google Scholar]
- 3.Thomas T, Thomas TJ. Cell Mol Life Sci. 2001;58:244. doi: 10.1007/PL00000852. [DOI] [PMC free article] [PubMed] [Google Scholar]
- 4.Childs AC, Mehta DJ, Gerner EW. Cell Mol Life Sci. 2003;60:1394. doi: 10.1007/s00018-003-2332-4. [DOI] [PMC free article] [PubMed] [Google Scholar]
- 5.Hahm HA, Dunn VR, Butash KA, Deveraux WL, Woster PM, Casero RA, Jr, Davidson NE. Clin Cancer Res. 2001;7:391. [PubMed] [Google Scholar]
- 6.Bergeron RJ, Neims AJ, McManis JS, Hawthorne TR, Vinson JRT, Bortell R, Ingeno MJ. J Med Chem. 1988;31:1183. doi: 10.1021/jm00401a019. [DOI] [PubMed] [Google Scholar]
- 7.Bergeron RJ, McMains JS, Liu CZ, Frng Y, Weimar WR, Luchetta GR, Wu Q, Ortiz-Ocasio J, Vinson JRT, Kramer D, Porter CW. J Med Chem. 1994;37:3464. doi: 10.1021/jm00047a004. [DOI] [PubMed] [Google Scholar]
- 8.Davidson NE, Mank AR, Prestigiacomo LJ, Bergeron JR, Casero RA., Jr Cancer Res. 1993;53:2071. [PubMed] [Google Scholar]
- 9.McCloskey DE, Yang J, Woster PA, Davidson NE, Casero RA., Jr Clin Cancer Res. 1996;55:441. [PubMed] [Google Scholar]
- 10.McCloskey DE, Casero RA, Jr, Woster PA, Davidson NE. Cancer Res. 1995;55:3233. [PubMed] [Google Scholar]
- 11.Shah N, Thomas T, Shirahata A, Sigal LH, Thomas TJ. Biochemistry. 1999;38:14763. doi: 10.1021/bi991291v. [DOI] [PubMed] [Google Scholar]
- 12.Thomas T, Thomas TJ. J Cell Mol Med. 2003;7:113. doi: 10.1111/j.1582-4934.2003.tb00210.x. [DOI] [PMC free article] [PubMed] [Google Scholar]
- 13.McCloskey DE, Pegg AE. J Biol Chem. 2003;278:13881. doi: 10.1074/jbc.M205689200. [DOI] [PubMed] [Google Scholar]
- 14.Ha HC, Woster PA, Yager JD, Casero RA., Jr Proc Natl Acad Sci, USA. 1997;94:11557. doi: 10.1073/pnas.94.21.11557. [DOI] [PMC free article] [PubMed] [Google Scholar]
- 15.Bacchi CJ, Weiss LM, Lane S, Frydman B, Valasinas A, Reddy V, Sun JS, Marton LJ, Khan IA, Moretto M, Yarlett N, Wittner M. Agents and Chemother. 2002;46:55. doi: 10.1128/AAC.46.1.55-61.2002. [DOI] [PMC free article] [PubMed] [Google Scholar]
- 16.Ahmed Ouameur A, Tajmir-Riahi HA. J Biol Chem. 2004;279:42041. doi: 10.1074/jbc.M406053200. [DOI] [PubMed] [Google Scholar]
- 17.D’Agostino L, Di Pietro M, Di Luccia A. FEBS J. 2005;272:3777. doi: 10.1111/j.1742-4658.2005.04782.x. [DOI] [PubMed] [Google Scholar]
- 18.Venkiteswaran S, Vijayanathan V, Shirahata A, Thomas T, Thomas TJ. Biochemistry. 2005;44:303. doi: 10.1021/bi0485272. [DOI] [PubMed] [Google Scholar]
- 19.Ahmed Ouameur A, Mangier E, Diamantoglou S, Rouillon R, Carpentier R, Tajmir-Riahi HA. Biopolymers. 2004;73:503. doi: 10.1002/bip.10557. [DOI] [PubMed] [Google Scholar]
- 20.Sugio S, Kashima A, Mochizuki S, Noda M, Kobayashi K. Protein Eng. 1999;12:439. doi: 10.1093/protein/12.6.439. [DOI] [PubMed] [Google Scholar]
- 21.Carter DC, Ho JX. Adv Protein Chem. 1994;45:153. doi: 10.1016/s0065-3233(08)60640-3. [DOI] [PubMed] [Google Scholar]
- 22.Peters T. All about albumin. Biochemistry, Genetics and Medical Applications. Academic Press; San Diego: 1996. [Google Scholar]
- 23.He HM, Carter DC. Nature. 1992;358:209. doi: 10.1038/358209a0. [DOI] [PubMed] [Google Scholar]
- 24.Peters T. Adv Protein Chem. 1985;37:161. doi: 10.1016/s0065-3233(08)60065-0. [DOI] [PubMed] [Google Scholar]
- 25.Curry S, Brick P, Frank NP. Biochim Biophys Acta. 1999;1441:131. doi: 10.1016/s1388-1981(99)00148-1. [DOI] [PubMed] [Google Scholar]
- 26.Petitpas I, Grune T, Battacharya AA, Curry S. J Mol Biol. 2001;314:955. doi: 10.1006/jmbi.2000.5208. [DOI] [PubMed] [Google Scholar]
- 27.Grelamo EL, Silva CHTP, Imasato H, Tabak M. Biochim Biophys Acta. 2002;1594:84. doi: 10.1016/s0167-4838(01)00287-4. [DOI] [PubMed] [Google Scholar]
- 28.Chuang VTG, Otagiri M. Biochim Biophys Acta. 2001;1546:337. doi: 10.1016/s0167-4838(01)00151-0. [DOI] [PubMed] [Google Scholar]
- 29.Painter L, Harding MM, Beeby PJ. J Chem Soc, Perkin Trans. 1998;18:3041. [Google Scholar]
- 30.Stephanos JJ. J Inorg Biochem. 1996;62:155. doi: 10.1016/0162-0134(95)00144-1. [DOI] [PubMed] [Google Scholar]
- 31.Stephanos JJ, Farina SA, Addison AW. Biochim Biophys Acta. 1996;1295:209. doi: 10.1016/0167-4838(96)00041-6. [DOI] [PubMed] [Google Scholar]
- 32.Johnson WC. Struct Funct Genet. 1999;35:307. [Google Scholar]
- 33.Sreerama N, Woddy RW. Anal Biochem. 2000;287:252. doi: 10.1006/abio.2000.4880. [DOI] [PubMed] [Google Scholar]
- 34.Krimm S, Bandekar J. Adv Protein Chem. 1986;38:181. doi: 10.1016/s0065-3233(08)60528-8. [DOI] [PubMed] [Google Scholar]
- 35.Byler DM, Susi H. Biopolymers. 1986;25:469. doi: 10.1002/bip.360250307. [DOI] [PubMed] [Google Scholar]
- 36.Ahmed A, Tajmir-Riahi HA, Carpentier R. FEBS Lett. 1995;363:65. doi: 10.1016/0014-5793(95)00282-e. [DOI] [PubMed] [Google Scholar]
- 37.Beauchemin R, Harnois J, Rouillon R, Tajmir-Riahi HA, Carpentier R. J Mol Struct. 2007;833:169. [Google Scholar]
- 38.Boulkanz L, Balcarand N, Baron MH. Appl Spectrosc. 1995;49:1737. [Google Scholar]
- 39.Bramanti E, Benedetti E. Biopolymers. 1996;38:639. doi: 10.1002/(sici)1097-0282(199605)38:5<639::aid-bip8>3.0.co;2-t. [DOI] [PubMed] [Google Scholar]
- 40.Goormaghtigh E, Cabiaux V, Ruysschaert JM. Eur J Biochem. 1990;193:409. doi: 10.1111/j.1432-1033.1990.tb19354.x. [DOI] [PubMed] [Google Scholar]
- 41.Gaudreau S, Neault JF, Tajmir-Riahi HA. J Biomol Struct Dyn. 2002;19:1007. doi: 10.1080/07391102.2002.10506804. [DOI] [PubMed] [Google Scholar]
- 42.Neault JF, Novetta_Delen A, Arakawa H, Malonga H, Tajmir-Riahi HA. Can J Chem. 2000;78:291. [Google Scholar]
- 43.Sulkowska A. J Mol Struct. 2002;614:227. [Google Scholar]
- 44.Liu J, Tian J, Hu Z, Chen X. Biopolymers. 2004;73:443. doi: 10.1002/bip.20000. [DOI] [PubMed] [Google Scholar]
- 45.Kragh-Hansen U. Dan Med Bull. 1990;37:57. [PubMed] [Google Scholar]


