Abstract

A new method was developed to purify membrane bound species within a supported lipid bilayer (SLB) environment. SLBs consisting of phosphatidylcholine lipids and cholesterol were employed as the separation matrix. Cholesterol was used to reduce the diffusion of lipids within the bilayer and, therefore, substantially reduce mixing of the dye-conjugated lipids to be separated. These molecules were introduced into an SLB adjacent to the separations SLB and electrophoresis was employed to move these species through it. The method was powerful enough to completely resolve two isomers of Texas Red DHPE from each other. Moreover, these isomers could be separated from a BODIPY-conjugated lipid as well. Such procedures could be extended to the purification of peripheral and transmembrane proteins.
Separation, purification, and detection of biomembrane species such as lipids and transmembrane proteins are difficult tasks. The processing conditions are often harsh, which can result in alteration of native structures or complete loss of material.1,2 Furthermore, it is difficult to detect subtle post-translational changes in these molecules that occur on the cell surface.3–5 Typical purification procedures often require one to dissolve the membrane in detergent, sonicate, filter through chromatographic columns, and separation into bands using gel electrophoresis. Procedures that circumvent such drawbacks would represent an attractive alternative and could significantly impact transmembrane proteomics.
Herein, we describe a new method to rapidly separate membrane components without exposing the molecules to harsh environments. We employ a solid supported lipid bilayer (SLB) made of POPC6 and cholesterol as the separation medium to laterally separate membrane-bound species. This procedure is somewhat analogous to gel electrophoresis, except that the SLB replaces the gel. It is well documented that membrane components can be manipulated in SLBs using electrophoresis, including lipids,7–11 vesicles tethered to the bilayer using DNA hybridization,12,13 and GPI-linked proteins.14 To conduct separations, however, it is necessary to tune the bilayer chemistry to attenuate the diffusion coefficient of the lipids and, therefore, reduce the diffusive mixing. Cholesterol significantly decreases the lipid diffusion coefficient15,16 and increases the band resolution one can obtain. As will be shown, this analytical-scale separation technique is powerful enough to separate isomers of fluorescently-labeled lipids.
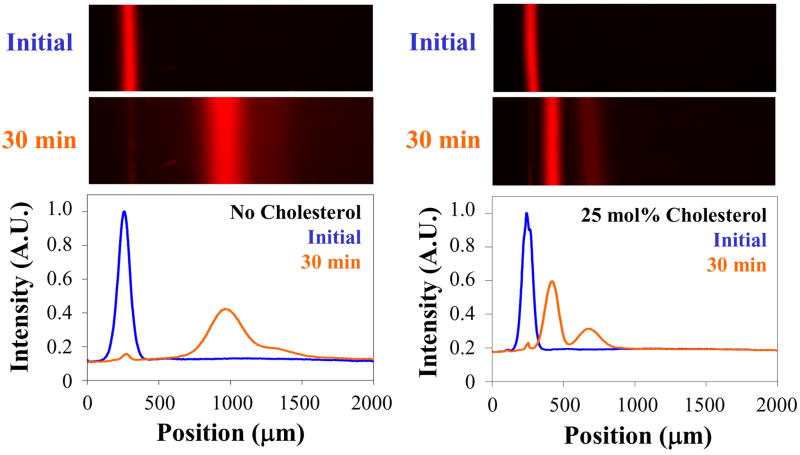
In a first set of experiments, we demonstrate the ability of cholesterol to decrease band broadening during the separation process. We compared the behavior of a band of 1 mol% Texas Red DHPE17 lipids migrating in a plain POPC bilayer and in a POPC bilayer with 25 mol% cholesterol. To begin an experiment, supported bilayers were formed on a planar glass substrate by the vesicle fusion method.18 Next, a thin line of bilayer (~80 μm width) was removed using a sharp piece of glass coated with Teflon (see supplemental materials). Vesicles containing POPC and 1 mol% Texas Red DHPE were then introduced into the aqueous phase above the surface. The vesicles fused to the bare portion of the substrate, creating a thin bilayer strip with Texas Red DHPE in it. A 100 V potential (DC) was applied parallel to the plane of the bilayer. Because the fluorophores were negatively charged, they migrated toward the positive electrode. We monitored the lateral movement and band broadening of the Texas Red bands as a function of time using an inverted epifluorescence microscope (Figure 1).
Figure 1.
Comparison of the band broadening of Texas Red-labeled lipids migrating in either pure POPC (left) or POPC doped with 25 mol% cholesterol (right). The upper two images are epifluorescence micrographs of the systems immediately after formation of the Texas Red-containing strips. The lower two images show band migration after applying 100 V across the sample for 30 minutes. The positive and negative electrodes were located on the right and left sides of the frame, respectively. The faint line to the left in the bottom panels represents a 2% immobile fraction of lipids. The plots below the images show the corresponding linescans initially and after 30 minutes. The linescans have been corrected for vignetting and normalized to the fluorescence level of the initial image to account for photobleaching. The length of the images matches the scale of the x-axis in the plots.
The bilayer without cholesterol showed substantial band broadening after 30 minutes of applied voltage (left images). By contrast, the band in the bilayer containing 25 mol% cholesterol (right images) remained much more compact. Moreover, this band resolved into two distinct chromatographic features with a area ratio of ~ 70:30.
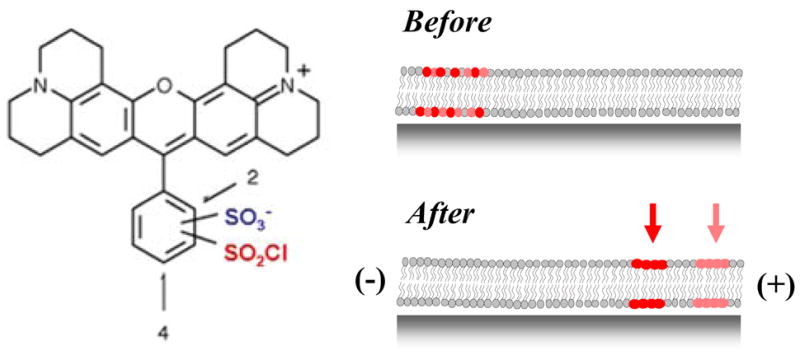
Mass spectral analysis showed that Texas Red DHPE had a molecular weight of 1381.85 Da and was relatively pure (supplementary materials). It is well known, however, that the sample should consist of an isomeric mixture19 (Figure 2, left side). Indeed, phosphatidylethanolamine lipids can conjugate to Texas Red sulfonyl chloride at either the ortho or para positions of the lower aromatic ring. This accounts for the presence of two bands in Figure 1 and is illustrated schematically in Figure 2 (right side).
Figure 2.

Left: Chemical structure of Texas Red sulfonyl chloride.22 The lower ring contains the reactive sulfonyl chloride group (red), which can reside at either the 2 (ortho) or 4 (para) position. Right: Illustration of the separation of a mixture of Texas Red DHPE lipid isomers into distinct bands in a supported bilayer.
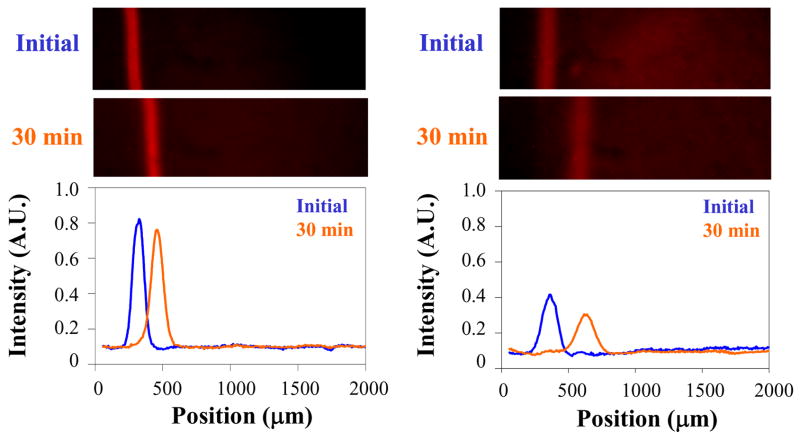
Two other possible origins for the band splitting need to be considered. First, a difference in the mobilities of the lipids in the upper and lower leaflets might lead to band separation. Also, it is conceivable that that the separated bands represent species in different microdomains or lipid rafts.20,21 We ruled out both these possibilities by purifying the Texas DHPE using thin layer chromatography (see supplemental materials). Each pure lipid isomer was separately mixed into POPC vesicles and fused into supported bilayer strips adjacent to a separation matrix consisting of a bilayer made from 75 mol% POPC and 25 mol% cholesterol. As expected, 30 min. of electrophoresis gave rise to only one band in each case (Figure 3). As a control, UV-Vis spectroscopy was performed on the isolated compounds as well. These experiments confirmed that the isomers existed in an approximately 70:30 mole ratio (supplemental materials).
Figure 3.
Images of Texas Red DHPE migrating through a 75 mol% POPC/25 mol% cholesterol bilayer after TLC purification. Left: Texas Red from the large mol. fraction isomer after TLC purification, initially (top) and after 30 min of 100 V applied potential (middle). Right: the corresponding images for the other isomer. The plots below the images show the associated linescans, initially and after 30 minutes, corrected for vignetting.
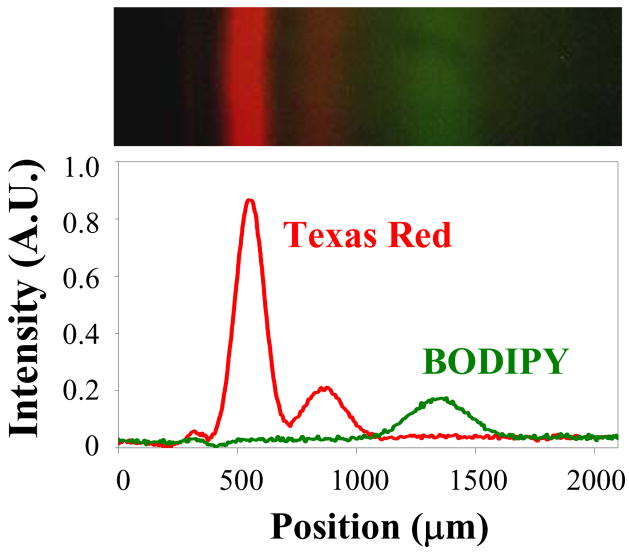
In a final set of experiments, we demonstrated that a more complex mixture can be separated. For this purpose, we fused POPC vesicles containing 1 mol% Texas Red DHPE and 1 mol% BODIPY DHPE23 into a bilayer strip as performed above. Figure 4 (top) shows the three bands that were resolved after 30 min. of electrophoresis at 100 V. As can be seen, the Texas Red lipid bands move more slowly that the single green BODIPY band. The linescan (bottom) shows that the bands are resolved.
Figure 4.
Top: Composite image of the separation of TR DHPE and BODIPY DHPE in a POPC bilayer containing 25 mol% cholesterol after 35 minutes of applying a 100 V potential. Bottom: corresponding linescan of the image, corrected for vignetting. The small peak at ~300μm represents an approximately 2% immobile fraction of total dye-labeled molecules. The areas of the large and small peaks of Texas Red are ~ 75% to 25%, which is slightly different than the areas in Figure 1 and probably represents a small amount of batch-to-batch variability in the dye formulation of the manufacturer.
The methods described herein could be extended to the purification and separation of membrane proteins by incorporating an appropriate polymer cushion24 into our supported bilayer system to ensure two-dimensional mobility of the transmembrane species. Protein bands in the bilayers could be detected by Western blotting with appropriate protein-specific antibodies or the bilayers could be freeze-dried and imaged via mass spectrometry for label-free detection.25 Such an advance might even have impact in the analysis of whole cell membranes. In fact, cell membranes could be analyzed to follow protein expression or post-translational modifications.
Supplementary Material
Experimental procedures and analysis. This material is available free of charge via the Internet at http://pubs.acs.org.
Acknowledgments
We thank the NIH (R01 GM070622-01), the ARO (W911NF-05-1-0494) and DARPA (FA9550-06-C-0006) for support. Discussions with Professors David H. Russell and Daniel A. Singleton were also greatly appreciated.
References
- 1.Zheng H, Zhao J, Sheng W, Xie XQ. Biopolymers. 2006;83:46–61. doi: 10.1002/bip.20526. [DOI] [PubMed] [Google Scholar]
- 2.Lundstrom K. Cell Mol Life Sci. 2006;63:2597–2607. doi: 10.1007/s00018-006-6252-y. [DOI] [PMC free article] [PubMed] [Google Scholar]
- 3.Zhu H, Bilgin M, Bangham R, Hall D, Casamayor A, Bertone P, Lan N, Jansen R, Bidlingmaier S, Houfek T, Mitchell T, Miller P, Dean RA, Gerstein M, Snyder M. Science. 2001;293:2101–2105. doi: 10.1126/science.1062191. [DOI] [PubMed] [Google Scholar]
- 4.Cristea IM, Gaskell SJ, Whetton AD. Blood. 2004;103:3624–3634. doi: 10.1182/blood-2003-09-3295. [DOI] [PubMed] [Google Scholar]
- 5.Phizicky E, Bastiaens PI, Zhu H, Snyder M, Fields S. Nature. 2003;422:208–215. doi: 10.1038/nature01512. [DOI] [PubMed] [Google Scholar]
- 6.1-palmitoyl-2-oleoyl-sn-glycero-3-phosphocholine (POPC)
- 7.Stelzle M, Miehlich R, Sackmann E. Biophys J. 1992;63:1346–1354. doi: 10.1016/S0006-3495(92)81712-5. [DOI] [PMC free article] [PubMed] [Google Scholar]
- 8.Groves JT, Boxer SG. Biophys J. 1995;69:1972–1975. doi: 10.1016/S0006-3495(95)80067-6. [DOI] [PMC free article] [PubMed] [Google Scholar]
- 9.Groves JT, Boxer SG, McConnell HM. Proc Nat Acad Sci. 1997;94:13390–13395. doi: 10.1073/pnas.94.25.13390. [DOI] [PMC free article] [PubMed] [Google Scholar]
- 10.Cremer PS, Groves JT, Kung LA, Boxer SG. Langmuir. 1999;15:3893–3896. [Google Scholar]
- 11.van Oudenaarden A, Boxer SG. Science. 1999;285:1046–1048. doi: 10.1126/science.285.5430.1046. [DOI] [PubMed] [Google Scholar]
- 12.Yoshina-Ishii C, Boxer SG. J Am Chem Soc. 2003;125:3696–3697. doi: 10.1021/ja029783+. [DOI] [PubMed] [Google Scholar]
- 13.Yoshina-Ishii C, Boxer SG. Langmuir. 2006;22:2384–2391. doi: 10.1021/la0526277. [DOI] [PMC free article] [PubMed] [Google Scholar]
- 14.Groves JT, Wulfing C, Boxer SG. Biophys J. 1996;71:2716–2723. doi: 10.1016/S0006-3495(96)79462-6. [DOI] [PMC free article] [PubMed] [Google Scholar]
- 15.Filippov A, Oradd G, Lindblom G. Langmuir. 2003;19:6397–6400. [Google Scholar]
- 16.Filippov A, Oradd G, Lindblom G. Biophys J. 2003;84:3079–3086. doi: 10.1016/S0006-3495(03)70033-2. [DOI] [PMC free article] [PubMed] [Google Scholar]
- 17.Texas Red 1,2-dihexadecanoyl-sn-glycero-3-phosphoethanolamine, triethylammonium salt (Texas Red DHPE)
- 18.Brian AA, McConnell HM. Proc Nat Acad Sci. 1984;81:6159–6163. doi: 10.1073/pnas.81.19.6159. [DOI] [PMC free article] [PubMed] [Google Scholar]
- 19.Titus JA, Haugland RP, Sharrow SO, Segal DM. J Immunological Methods. 1982;50:193–204. doi: 10.1016/0022-1759(82)90225-3. [DOI] [PubMed] [Google Scholar]
- 20.Dietrich C, Bagatolli LA, Volovyk ZN, Thompson NL, Levi M, Jacobson K, Gratton E. Biophys J. 2001;80:1417–1428. doi: 10.1016/S0006-3495(01)76114-0. [DOI] [PMC free article] [PubMed] [Google Scholar]
- 21.Simons K, Vaz WLC. Annu Rev Biophys Biomol Struct. 2004;33:269–295. doi: 10.1146/annurev.biophys.32.110601.141803. [DOI] [PubMed] [Google Scholar]
- 22.Adapted from Haugland RP. The Handbook. 10. Invitrogen Corp; 2005.
- 23.N-(4,4-difluoro-5,7-dimethyl-4-bora-3a,4a-diaza-s-indacene-3-propionyl)-1,2-dihexadecanoyl-sn-glycero-3-phosphoethanolamine, triethylammonium salt (BODIPY® FL DHPE)
- 24.Tanaka M, Sackmann E. Nature. 2005;437:656–663. doi: 10.1038/nature04164. [DOI] [PubMed] [Google Scholar]
- 25.Kraft ML, Weber PK, Longo ML, Hutcheon ID, Boxer SG. Science. 2006;313:1948–1951. doi: 10.1126/science.1130279. [DOI] [PubMed] [Google Scholar]
Associated Data
This section collects any data citations, data availability statements, or supplementary materials included in this article.
Supplementary Materials
Experimental procedures and analysis. This material is available free of charge via the Internet at http://pubs.acs.org.


