Abstract
The effect of a series of sodium salts on the lower critical solution temperature (LCST) of poly(N-isopropylacrylamide), PNIPAM, was investigated as a function of molecular weight and polymer concentration with a temperature gradient microfluidic device under a dark-field microscope. In solutions containing sufficient concentrations of kosmotropic anions, the phase transition of PNIPAM was resolved into two separate steps for higher molecular weight samples. The first step of this two step transition was found to be sensitive to the polymer’s molecular weight and solution concentration, while the second step was not. Moreover, the binding of chaotropic anions to the polymer was also influenced by molecular weight. Both sets of results could be explained by the formation of intramolecular and intermolecular hydrogen-bonding between polymer chains. By contrast, the hydrophobic hydration of the isopropyl moieties and polymer backbone was found to be unaffected by either the polymer’s molecular weight or solution concentration.
Introduction
Protein stability, enzyme activity, macromolecule crystallization, as well as protein and polymer folding can be strongly influenced by the type of salts present in the aqueous solution.1–7 In fact, the ability of ions to influence a broad range of physical properties typically follows a recurring trend called the Hofmeister series.8–16 The typical order of the series for anions is:
The ions on the left are strongly hydrated and referred to as kosmotropes, while the species on the right are more weakly hydrated and called chaotropes. Recently, considerable effort has gone into understanding the ordering of this series and its underlying meaning.5,14,17–20 Although it was originally suspected that the series had to do with the ordering of bulk water, this turns out not to be the case. Therefore, mechanisms to explain the behavior of specific systems need to take into account the direct interactions of the ions with the macromolecule and its first hydration shell.
In water, PNIPAM behaves as a thermoresponsive polymer which aggregates and falls out of solution above its lower critical solution temperature (LCST).21,22 This behavior follows the Hofmeister series.23–25 Our laboratory has recently elucidated the mechanism of the phase transition for PNIPAM in the presence of salts.5 This was made possible by the development of a temperature gradient microfluidic apparatus5,26–30 in combination with dark field microscopy, which allowed the LCST of PNIPAM to be determined with extremely high temperature precision. The experiments were conducted on PNIPAM samples with a relatively narrow molecular weight distribution (polydispersity index = 1.40). The number average molecular weight, Mn, of these samples was 121,000 Da. It was found that three basic interactions were involved depending upon the specific conditions: a surface tension effect, direct anion binding, and the polarization of water molecules directly hydrating the amide moieties of the polymer (Figure 1). Sodium salts of the chaotropic anions were found to depress the LCST by increasing the surface tension between the hydrophobic portions of the polymer (isopropyl group and hydrocarbon backbone) and adjacent hydration waters. There was also a modest salting-in effect caused by the binding of chaotropic anions. These two mechanisms could account for the behavior of the ions from Cl− to SCN−. On the other hand, the kosmotropes (CO32−, SO4−, H2PO4−, and F−) behaved differently. In this case, no salting-in effects were observed. Rather, the anions were found to weaken the hydrogen bonding between the pendant amide groups and the bound hydration waters via a polarization effect. In the presence of a sufficient concentration of a kosmotropic salt, the dehydration of the hydrophilic amide groups would actually occur separately from the removal of hydrophobic hydration waters from the rest of the polymer. In fact, the phase transition was resolved into two distinct steps. The first step was correlated with the dehydration of the amide, while the second involved the loss of water molecules which were hydrophobically hydrating the polymer.
Figure 1.
Three basic interactions amongst anions, PNIPAM, and hydration waters are involved in the Hofmeister effect: (a) The hydrophobic hydration of the molecule is associated with surface tension and can be modulated by salt; (b) Direct binding of the anion to the amide group of PNIPAM; (c) Hydrogen bonding of the amide and its destabilization through polarization by the anion, X−.
It is known that changing the molecular weight of PNIPAM does not strongly affect its LCST unless the degree of polymerization is low enough that the end group structure becomes significant.31,32 We wondered, however, if changes in the molecular weight would affect the salt dependence. Four samples were prepared with number average molecular weights ranging from 6,980 to 360,000 Da. The results showed that the molecular weight of PNIPAM does influence salt effects. Specifically, it was found that the concentration of kosmotropic ions required to resolve the phase transition into two distinct steps increased with decreasing molecular weight. In fact, it was not possible to decouple the amide and hydrophobic dehydration steps at any salt concentration for the lowest molecular weight sample we investigated. Moreover, molecular weight also influenced the behavior of PNIPAM in the presence of chaotropic anions. In this case, it was found that the binding constant of the anions increased with increasing molecular weight and polymer concentration, while the salting-in effect decreased with increasing molecular weight and polymer concentration. By contrast, neither the molecular weight of the polymer nor its solution concentration affected the phase transition when triggered by the loss of water molecules involved in hydrophobic hydration.
Experimental
Preparation and fractionation of PNIPAM
PNIPAM was obtained by free-radical polymerization of its monomer using 2,2′-azoisobutylnitrile (AIBN) as an initiator in methanol at 70 °C under a positive pressure of N2. The purified PNIPAM was fractionated by redissolving it in acetone (10 g/L) and stepwise precipitation by the addition of hexanes.31,33 This gave rise to four polymer fractions with weight average molecular weights (Mw) of 4.75 × 10⁵, 1.70 × 10⁵, 5.58 × 10⁴, and 1.78 × 10⁴ g/mol as determined by static light scattering in methanol. Light scattering experiments were carried out using a Brookhaven Instruments BI-200SM goniometer, a BI-9000AT digital correlator, and a Melles Griot helium neon laser. Molecular weight analysis of light scattering data was performed using Brookhaven Instruments’ Zimm Plot Software. The fractionated samples described above were analyzed by gel permeation chromatography in tetrahydrofuran. This analysis was carried out with a Viscotek I-MBMMW-3078 mixed bed column using a Viscotek gel permeation chromatography instrument. The instrument was equipped with multiple detectors including a Model VE 3580 RI detector and OmniSEC software. The results indicated that the polydispersity index (PDI) of the four fractions used in these studies were 1.32, 1.40, 1.82, and 2.55, respectively, based upon polystyrene reference standards. The Mn values for these four fractions were determined to be 3.60 × 10⁵, 1.21 × 10⁵, 3.07 104, and 6.98 × 10³ Da, respectively. It should be noted that Mn = Mw/PDI.
Preparation of polymer solutions
All inorganic salts used in these experiments were purchased from Aldrich. Low-conductivity H2O, produced from a NANOpure Ultrapure Water System (Barnstead, Dubuque, IA) with a minimum resistivity of 18 MΩ··cm, was used to prepare the polymer and salt solutions. Stock solutions of PNIPAM were prepared by allowing the polymer to dissolve overnight in H2O at 4 °C. Aliquots of these solutions were added to water or inorganic salt solutions at the desired concentration. The final polymer concentration for all experiments was 10 mg/mL except for the concentration dependence experiments. In that case, the concentration of the Mn 121,000 sample was set to 2, 5, 10, and 15 mg/mL to study the effect of polymer concentration on the LCST behavior.
Fabrication of a temperature gradient device and measurement of LCSTs
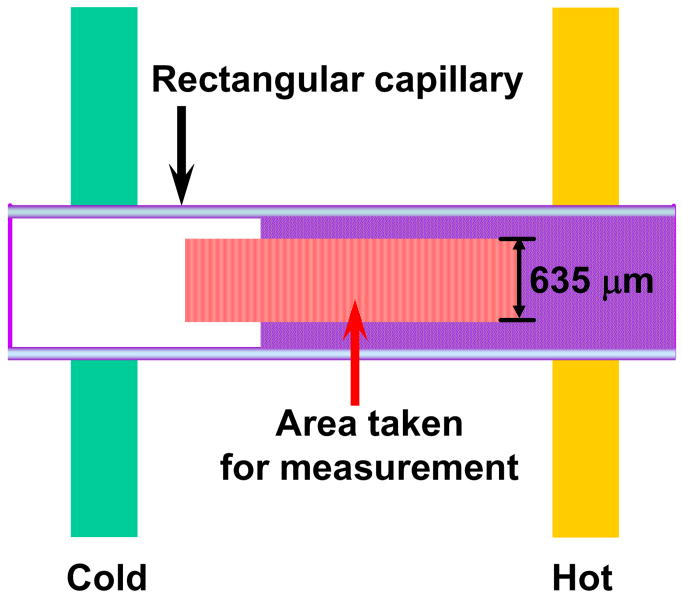
Fabrication of our temperature gradient device has been described previously.5,27–30 Briefly, a cover glass acting as both the sample stage and heat conductor was mounted on top of two parallel brass tubes (1/8 in. wide, K&S Engineering, Chicago, IL) through which hot and cold antifreeze solutions could be individually flowed using standard water bath circulators (Fisher Scientific, Pittsburgh, PA). Rectangular borosilicate capillary tubes (VitroCom, Inc.) with dimensions of 2 cm × 1 mm × 100 μm (length × width × height) were used as sample containers and placed parallel to the temperature gradient. Light scattering from polymer solutions was monitored via a CCD camera (Micromax 1024, Princeton Instruments) using dark-field optics under an inverted microscope (Nikon, TE2000-U). Two different polymer solutions with previously measured LCSTs served to calibrate the slope of the gradient in each experiment.5,27–30 The first control solution was a 10 mg/mL sample of Mw 500,000 Da PNIPAM in H2O with a known LCST of 30.98 ± 0.05 °C and the second was a 10 mg/mL sample of Mw 500,000 Da PNIPAM in 0.7 M KCl with a known LCST of 22.61 ± 0.05 °C.34 Six rectangular capillary tubes could be fit side-by-side under a ×2 objective. The temperature along the capillary tubes was determined by counting pixels in a linescan drawn along the direction of the gradient in the corresponding CCD images. The scattering intensity at each temperature was determined by averaging data from a 635 μm long slice (50 pixels) perpendicular to the linear temperature gradient (Figure 2). LCST values were taken as the initial break points23 of these light scattering intensity versus temperature curves. The measurement of the LCST at each salt concentration was repeated at least 8 times and the mean value was taken. The measurements had a typical standard error of ± 0.05 °C. It should be noted that the phase transition of PNIPAM was completely reversible under all conditions which were explored.
Figure 2.
Schematic diagram of the linear temperature gradient used to obtain light scattering curves. The PNIPAM solution inside the capillary tube shows no light scattering at low temperature (white region inside the tube), but scatters light strongly above the lower critical solution temperature (purple region inside the tube). Data were taken in slices (red vertical lines) from the middle of each tube and the scattering intensity was averaged over a 635 μm line at each temperature.
Results
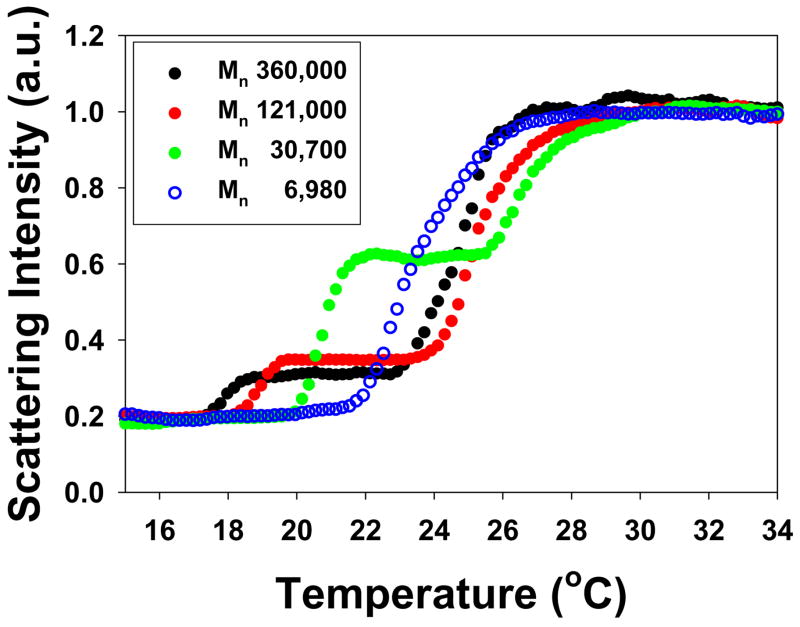
Sodium salts of CO32−, SO42−, H2PO4−, F−, Cl−, Br−, NO3−, I−, ClO4−, and SCN− were employed to investigate specific ion effects on the LCST of PNIPAM because they are representative of the entire Hofmeister series. For CO32−, SO42−, H2PO4−, and F−, the phase transition of PNIPAM was resolved into two distinct steps in the presence of sufficient concentrations of the respective sodium salts. The first step was the salting-out of the amide group and the second involved the dehydration of the hydrophobic portions of the polymer.5 Representative data in Figure 3 at 0.3 M Na2SO4 clearly reveal that the presence of a two-step LCST is dependent on the chain length of the polymer. In fact, the two-step transition only occurred at sufficiently high molecular weight of the PNIPAM.
Figure 3.
Light scattering curves for PNIPAM with different molecular weights in 0.3 M Na2SO4 solutions. The two-step phase transition can be visualized for PNIPAM with Mn of 360,000 Da, 121,000 Da, and 30,700 Da.
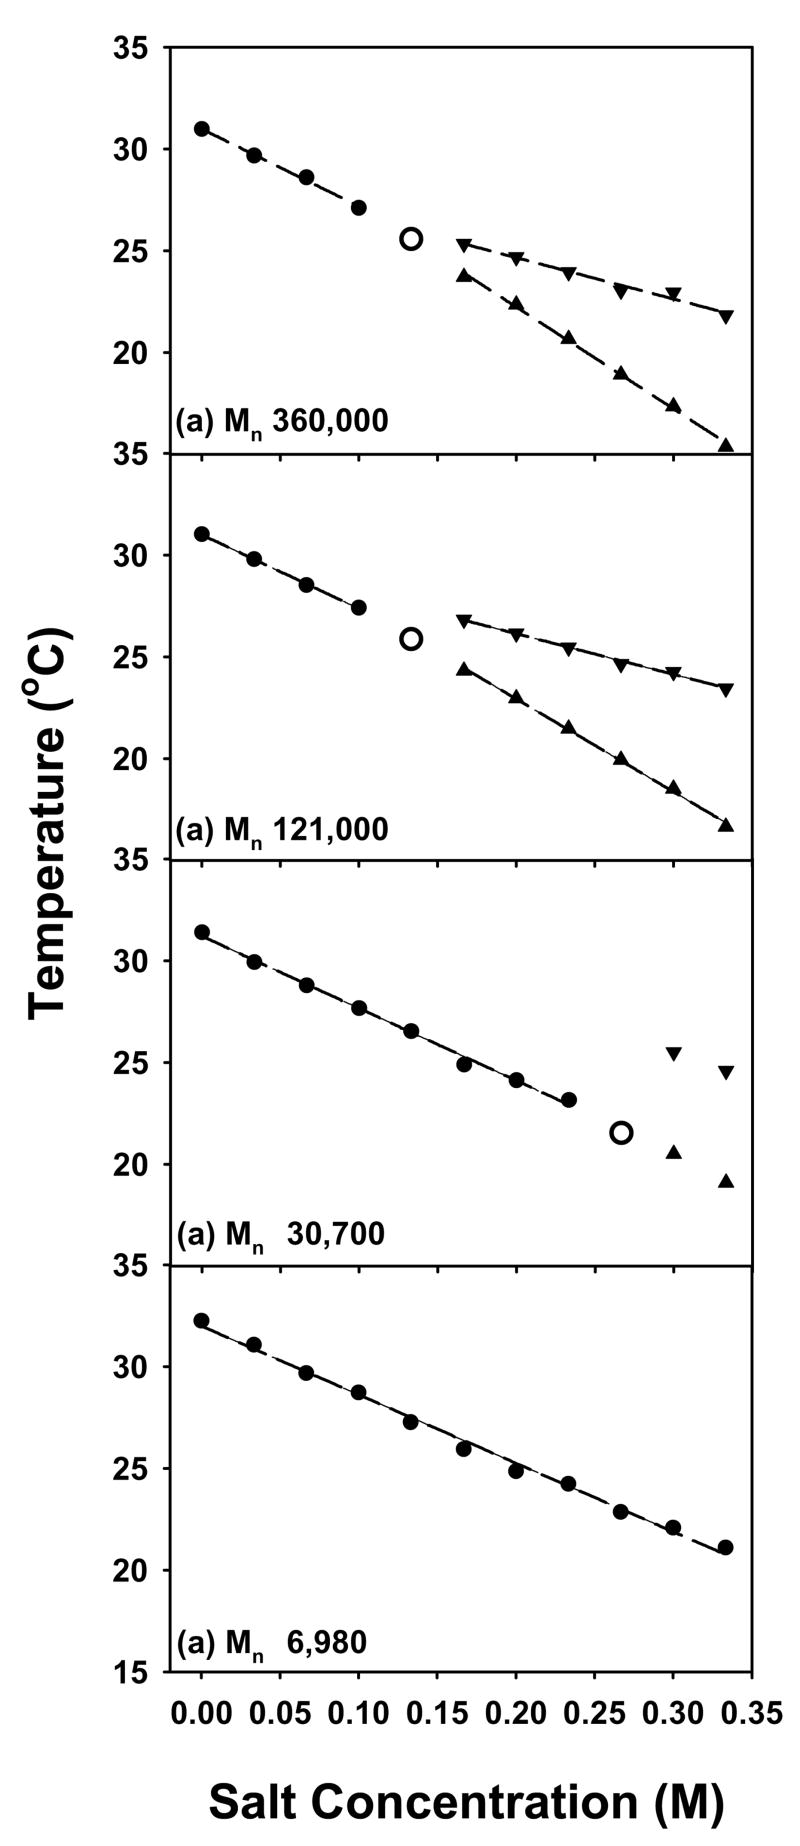
Plots of the temperature for the onset of the lower and higher phase transition steps vs. Na2SO4 concentration are shown in Figure 4 for the four PNIPAM samples. At low salt concentration only a single LCST was observed and is designated by a filled circle in the plots (●). As the salt concentration was raised, the phase transition was resolved into two separate steps for all but the lowest molecular weight sample. The appearance of the lower step, ▲, and upper step, ▼, of the two-step transition required higher salt concentrations as the molecular weight was decreased. An open circle, ○, is used to denote the concentration where the transition first begins to resolve into two distinct steps. At the lowest molecular weight employed, 6,980 Da, only a single phase transition could be found over the entire concentration range investigated.
Figure 4.
LCSTs of 10 mg/mL PNIPAM with different molecular weights in Na2SO4: (a) Mn 360,000 Da; (b) Mn 121,000 Da; (c) Mn 30,700 Da; (d) Mn 6,980 Da. The dots (●) represent the initial slope, the upward pointing triangles (▲) designate the lower temperature step in the two-step phase transition, and the downward pointing triangles (▼) are for the higher temperature transition. The unfilled larger circles are used for the point where the phase transition widens without explicitly splitting into two separate steps. This designates the crossover of the transition from a single step to a two-step process.
The LCST vs. salt concentration data for each step of the two step transition can be fit by a simple linear equation:
| [1] |
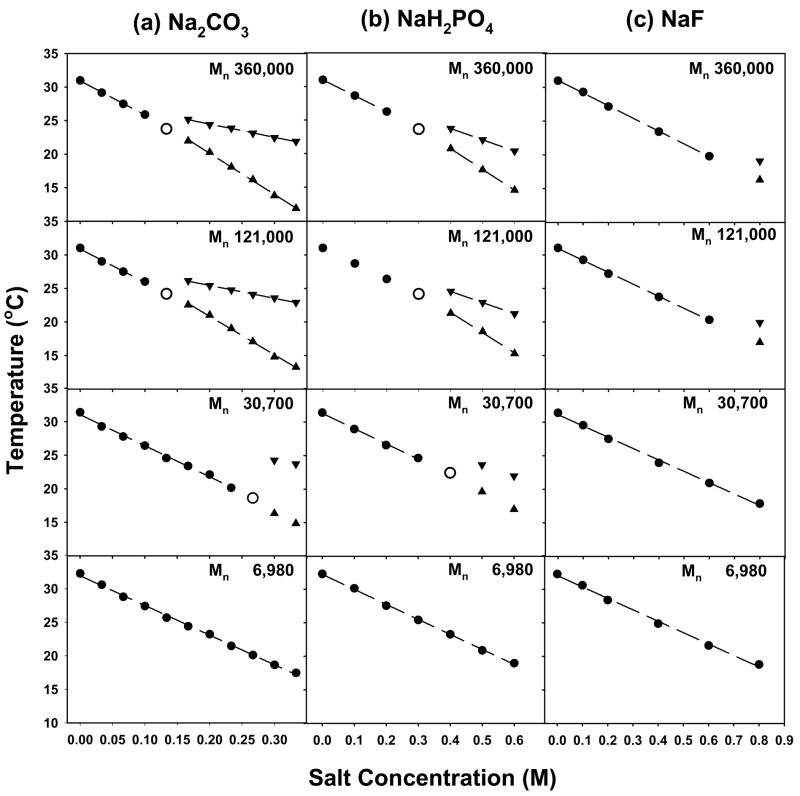
where T0 is the LCST of PNIPAM in the absence of salt and [M] is the molar concentration of the kosmotropic salt. The constant, c, has units of temperature/molarity and the individual steps are associated with distinct slopes. In all cases it was found that the lower step, ▲, of a given two-step transition displayed steeper salt concentration dependence than its corresponding single step transition, ●, seen at lower Na2SO4 concentrations. On the other hand, the higher temperature phase transition step, ▼, showed shallower salt dependence than the initial transition. The other kosmotropic anions, CO32−, H2PO4− and F−, behaved similarly with molecular weight. Their LCST values as a function of salt concentration are provided in Figure 5. The abstracted c values for all the kosmotropes are given in Table 1.
Figure 5.
LCSTs of 10 mg/mL PNIPAM with different molecular weights in (a) Na2CO3, (b) NaH2PO4, and (c) NaF. The molecular weight is labeled on each figure. The symbols have the same meaning as in Figure 4.
Table 1.
Fitted c values from the LCST vs. salt concentration curves of PNIPAM with different molecular weights for the kosmotropic anions.
| Anion | Mn (g/mol) |
c (°C/mol) | ||
|---|---|---|---|---|
| initial | 1st step |
2nd step |
||
| CO32− | 6,980 | −44.3 | ||
| 30,700 | −46.3 | - | - | |
| 121,000 | −49.7 | −57.4 | −19.2 | |
| 360,000 | −50.8 | −61.3 | −19.7 | |
| SO42− | 6,980 | −33.7 | ||
| 30,700 | −35.5 | - | - | |
| 121,000 | −36.2 | −45.6 | −20.0 | |
| 360,000 | −38.0 | −50.0 | −20.3 | |
| H2PO4− | 6,980 | −22.4 | ||
| 30,700 | −22.7 | - | - | |
| 121,000 | −23.1 | −30.1 | −16.6 | |
| 360,000 | −23.6 | −30.9 | −16.8 | |
| F− | 6,980 | −17.0 | ||
| 30,700 | −16.9 | |||
| 121,000 | −17.9 | - | - | |
| 360,000 | −18.8 | - | - | |
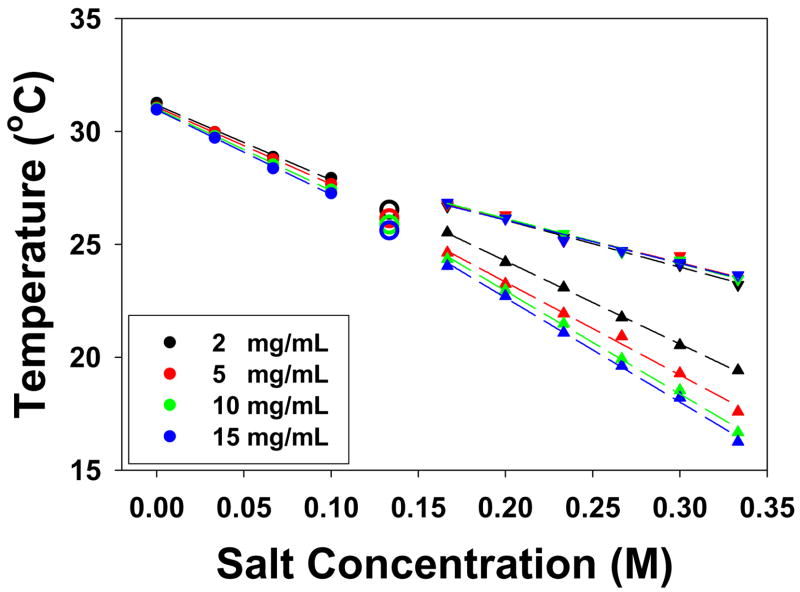
To investigate the polymer concentration effect in the presence of kosmotropic anions, the 121,000 Da sample was investigated at 2, 5, 10, and 15 mg/mL in the presence of Na2SO4 and the data are plotted in Figure 6. Again, the LCST vs. salt concentration data for each step of the two-step phase transition were fit to equation [1]. For the lower temperature step, the slope of the salt concentration dependence became progressively steeper at higher polymer concentration, while the upper step was found to be insensitive to the polymer concentration. The abstracted c values for each step are provided in Table 2.
Figure 6.
LCSTs of Mn 121,000 Da PNIPAM with polymer concentrations of 2, 5, 10, and 15 mg/mL in Na2SO4. The symbols have the same meaning as in Figure 4.
Table 2.
Fitted c values from the LCST vs. Na2SO4 concentration curves for a Mn 121,000 sample of PNIPAM at different polymer concentrations.
| Anion | Mn (g/mol) |
Conc.
(mg/mL) |
c (°C/mol) | ||
|---|---|---|---|---|---|
| initial | 1st step |
2nd step |
|||
| SO42− | 121,000 | 2 | −33.2 | −36.8 | −20.7 |
| 5 | −34.2 | −41.2 | −19.2 | ||
| 10 | −36.2 | −45.6 | −20.0 | ||
| 15 | −37.5 | −46.2 | −19.2 | ||
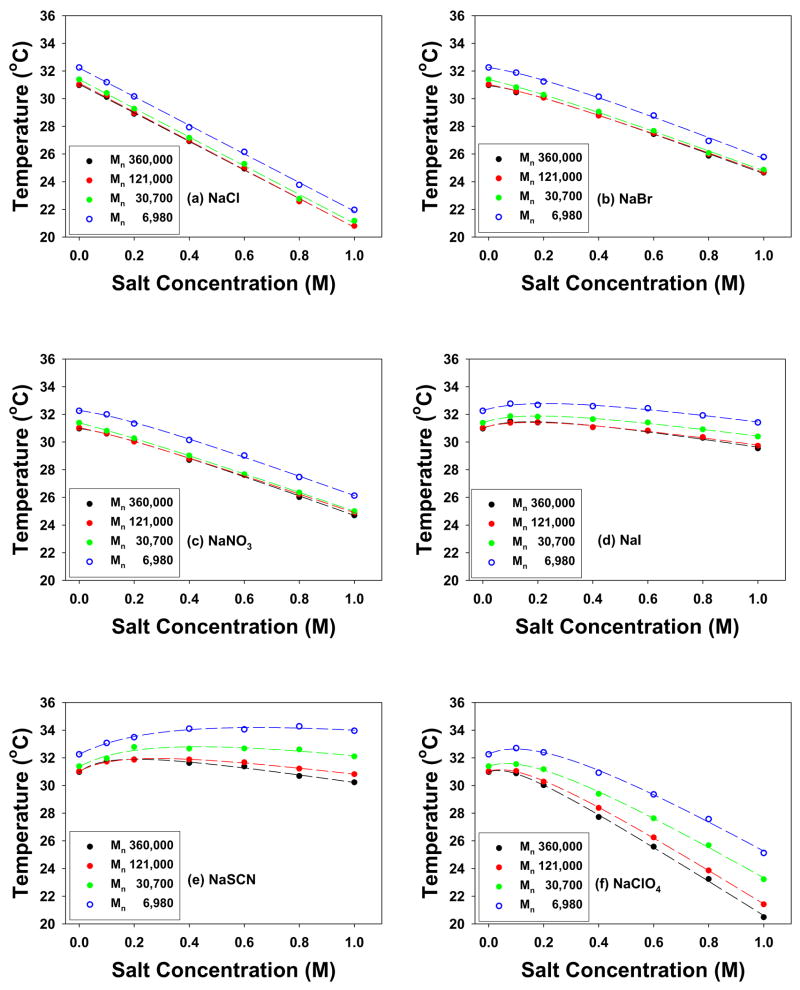
For the chaotropic anions (Cl−, Br−, NO3−, I−, SCN−, and ClO4−), only a single LCST was observed independent of the polymer’s molecular weight or the salt concentration employed. Figure 7 shows the LCST values of PNIPAM for all four molecular weights as a function of salt concentration. The data in Figure 7 can be modeled by equation [2] which includes a constant, a linear term, and a Langmuir isotherm:5
Figure 7.
LCSTs of 10 mg/mL PNIPAM with different molecular weights in salt solution with chaotropic anions at concentrations from 0 to 1.0 M: (a) NaCl, (b) NaBr, (c) NaNO3, (d) NaI, (e) NaSCN, and (f) NaClO4. The curves were fit to eq 2.
| [2] |
T0 is again the LCST of PNIPAM in the absence of salt and [M] is the molar concentration of the salt. KA is the apparent equilibrium association constant of the chaotropic anion with the polymer. Bmax is the increase in the phase transition temperature due to direct ion binding at saturation. The abstracted values for c, KA, and Bmax for the chaotropic anions are listed in Table 3.
Table 3.
Fitted values of KA, Bmax, and c abstracted from the LCST vs. salt concentration curves of PNIPAM at different molecular weights in the presence of chaotropic anions.
| Anion | Mn (g/mol) | Bmax (°C) |
KA (M−1) |
c
(°C/mol) |
|---|---|---|---|---|
| Cl− | 6,980 | - | - | −10.3 |
| 30,700 | - | - | −10.4 | |
| 121,000 | - | - | −10.4 | |
| 360,000 | - | - | −10.3 | |
| Br− | 6,980 | 2.1 | 2.5 | −8.1 |
| 30,700 | 1.3 | 2.3 | −7.5 | |
| 121,000 | 1.4 | 2.6 | −7.4 | |
| 360,000 | 1.5 | 3.4 | −7.5 | |
| NO3− | 6,980 | 1.7 | 2.8 | −7.4 |
| 30,700 | 1.0 | 2.0 | −7.0 | |
| 121,000 | 1.1 | 2.9 | −6.9 | |
| 360,000 | 1.4 | 3.1 | −7.4 | |
| I− | 6,980 | 2.7 | 3.3 | −2.9 |
| 30,700 | 2.3 | 4.3 | −2.8 | |
| 121,000 | 2.1 | 4.3 | −2.9 | |
| 360,000 | 2.2 | 5.1 | −3.2 | |
| ClO4− | 6,980 | 6.2 | 3.3 | −11.8 |
| 30,700 | 4.8 | 3.9 | −11.9 | |
| 121,000 | 3.6 | 5.1 | −12.6 | |
| 360,000 | 2.6 | 7.7 | −12.7 | |
| SCN− | 6,980 | 6.0 | 2.0 | −2.3 |
| 30,700 | 4.8 | 2.8 | −2.7 | |
| 121,000 | 3.1 | 4.3 | −2.7 | |
| 360,000 | 2.6 | 6.9 | −3.1 |
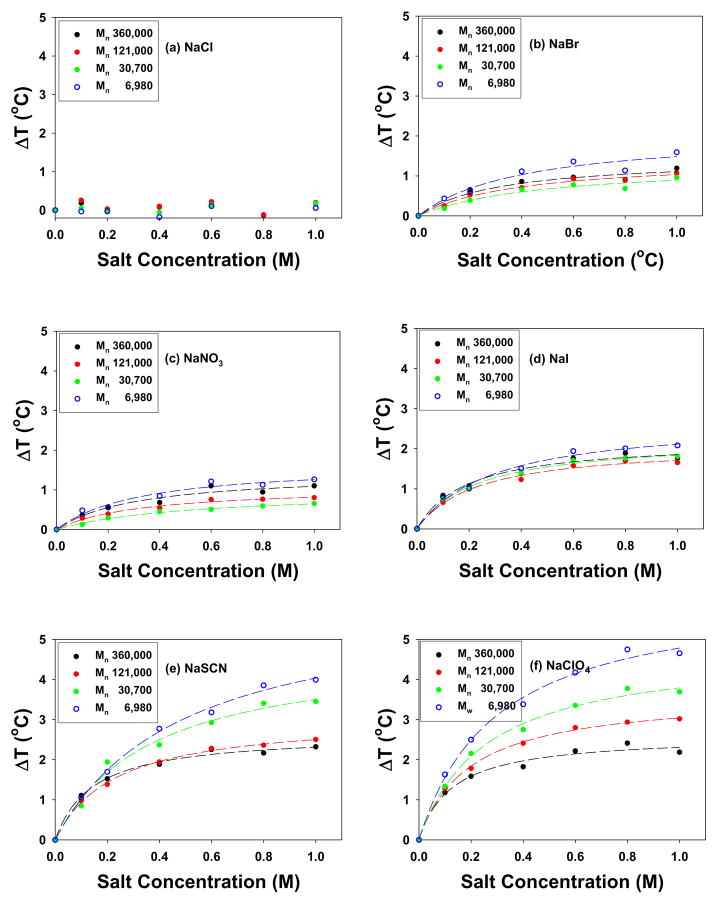
Subtracting the linear contribution (T0 + c[M]) from the concentration vs. LCST curves in Figure 7 and replotting the residual data revealed Langmuir-like binding isotherms for the chaotropes (Figure 8). From this figure, the molecular weight dependence of the binding of the anions can be readily observed. It should be noted that Cl− bound weakly enough that deviation from linear LCST vs. concentration behavior was not observed. Br−, NO3−, and I− binding to PNIPAM showed relatively weak molecular weight dependence. On the other hand, SCN− and ClO4−, which bound most tightly to the polymer, showed the most significant dependence on molecular weight. Specifically, KA increased with increasing molecular weight, while Bmax was attenuated with increasing molecular weight (Table 3).
Figure 8.
The residual LCST data for the chaotropic anions from Figure 7 after removing the linear portion of the LCST vs. concentration curves. The lines represent Langmuir isotherm fits to the data points.
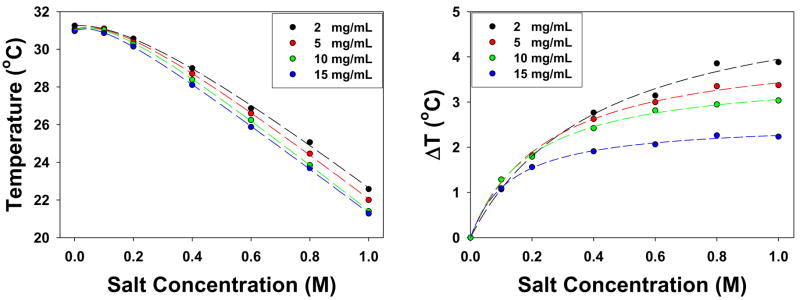
The polymer concentration’s effect on the LCST behavior of PNIPAM in the presence of NaClO4 was investigated with the Mn 121,000 sample at 2, 5, 10, and 15 mg/mL. The results are shown in Figure 9a. The data were fit to eqn. 2. After subtraction of the linear contribution to the curves, the data were replotted to reveal the shapes of the binding isotherms (Figure 9b). The abstracted c, KA, and Bmax values as a function of polymer concentration are listed in Table 4. Significantly, the binding constant, KA, increased with increasing polymer concentration, while Bmax decreased with increasing polymer concentration.
Figure 9.
(a) LCSTs of Mn 121,000 Da PNIPAM with the polymer concentrations of 2, 5, 10, and 15 mg/mL in NaClO4. The curves were fit to eq 2. (b) The residual LCST data after removing the linear portion of the LCST vs. concentration curves from Figure 9a. The lines represent Langmuir isotherm fits to the data points.
Table 4.
Fitted values of KA, Bmax, and c abstracted from the LCST vs. NaClO4 concentration curves for a Mn 121,000 sample of PNIPAM at different polymer concentrations.
| Anion | Mn (g/mol) |
Conc.
(mg/mL) |
Bmax (°C) |
KA (M−1) |
c
(°C/mol) |
|---|---|---|---|---|---|
| ClO4− | 121,000 | 2 | 5.6 | 2.4 | −12.6 |
| 5 | 4.3 | 3.9 | −12.4 | ||
| 10 | 3.6 | 5.1 | −12.6 | ||
| 15 | 2.6 | 7.5 | −11.9 |
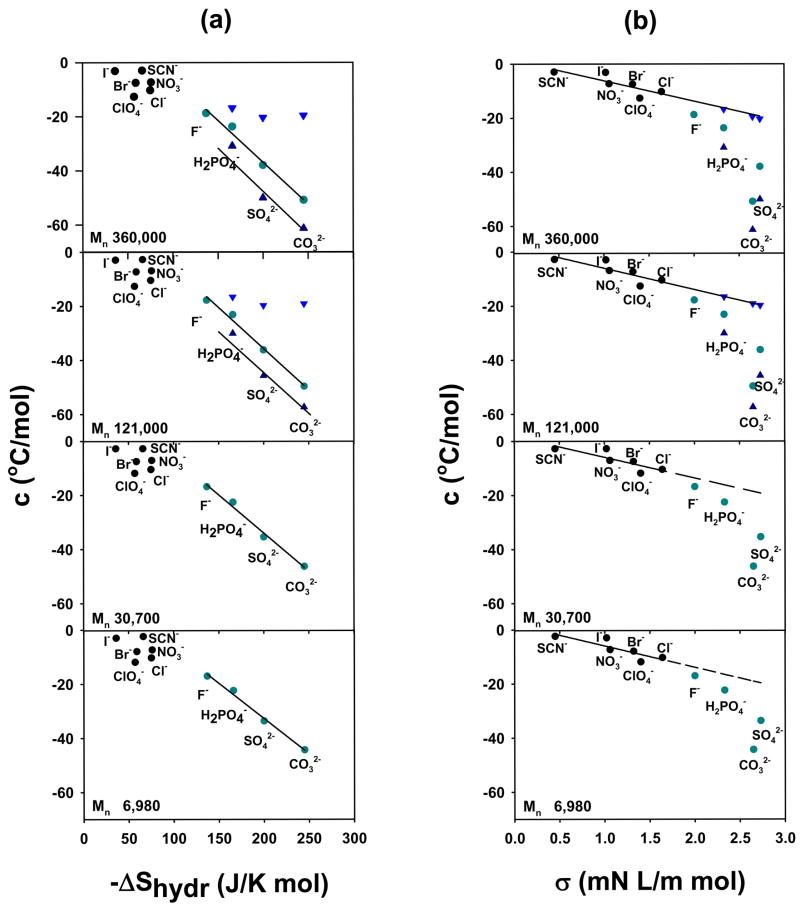
Finally, the abstracted linear slopes (c values) for all the salts were correlated to the known hydration entropy (ΔShydr) and surface tension increment (σ) values of the anions (Figure 10). As can be seen, the correlation between c values and surface tension increments is remarkably good for all the chaotropes. Moreover, the correlation between c and σ extended quite well to the upper step, ▼, of the two step phase transition for the kosmotropes. On the other hand, the c values for initial step, ●, and first step, ▲, in the two-step transition of the kosmotropes were well correlated to the entropy of hydration, ΔShydr, of the anions. In fact, the correlations were found to be equally good at all molecular weights. This confirms the notion that the specific anion effects involve surface tension and direct anion binding for the chaotropes (Figure 1a & 1b).5 On the other hand, the kosmotropes modulate the LCST of PNIPAM through surface tension changes and the polarization of water molecules at all the molecular weights tested (Figure 1a & 1c). It should be noted that the ability to polarize the hydration waters of the pendent amide groups is related to the entropy of hydration of the anions.5
Figure 10.
(a) Plot of hydration entropy of the anions vs. c for PNIPAM with different molecular weights. (b) Plot of the surface tension increment of the anions vs. c for PNIPAM with different molecular weights. Initial slopes are shown with filled gray-green circles; first slope of the split transition (▲) and second slope of the split transition (▼) for kosmotropes; and (●) for the chaotropes. The lines shown represent least-squares fits to the data for the first slope of the split transition and for the slope of the initial transition for the kosmotropes. Hydration entropy values for the anions are obtained from ref. 42. The surface tension increments of the anions were obtained from ref. 43, except for H2PO4− which was from ref. 1, and CO32− which was from ref. 44.
Discussion
Kosmotropic Anions
Table 1 provides the molecular weight dependence of the c values for the initial slope, as well as the upper and lower steps in the two-step phase transition at higher ion concentrations. As can be seen, the c values for the initial step and the lower step decrease with increasing molecular weight of PNIPAM. The effect is most pronounced for Na2CO3 and Na2SO4. It is believed that the decoupling of the amide dehydration from the hydrophobic dehydration manifests itself in the formation of partially collapsed structures which scatter less light than fully collapsed PNIPAM.5 Moreover, it has been reported that molten globular and crumpled coil structures may occur in PNIPAM of very high molecular weight (1 × 10⁷ Da) even in the absence of salt for very dilute polymer solutions.35,36 In the present experiments such partially collapsed states are apparently stabilized at lower molecular weight by sufficiently high concentrations of strongly hydrated ions. It should also be noted that the initial step and the lower step in the two-step phase transition were also sensitive to the concentration of PNIPAM. Namely, the phase transition temperature was more rapidly depressed in NaSO4 with increasing PNIPAM concentration (Table 2). In sharp contrast with these results, the slope for the upper step of the two-step phase transition was found to be independent of both the molecular weight and concentration of PNIPAM.
From a molecular point of view, it appears that hydrogen bonding between amide moieties becomes more facile with either increasing molecular weight or concentration. The former presumably occurs intramolecularly while the latter should be the result of increased intermolecular interactions. By contrast, intramolecular and intermolecular influences are not as important for hydrophobic hydration, which is associated with the upper phase transition step. In other words the hydrophobic moieties’ propensity to remain hydrated appeared to be independent of whether another polymer chain was nearby or not.
The phase transition of PNIPAM as a function of molecular weight appears to be at least somewhat reminiscent of the denaturation of globular proteins. It has been shown that the denaturation of sufficiently small proteins can occur as an all-or-none transition. In other words, the protein molecule denatures completely or not at all at equilibrium.37 However, this is not the case for larger proteins, whose thermally induced denaturation can typically be more complex. The absence of an all-or-none transition for larger proteins, of course, is normally interpreted in terms of their domain structures.38 It has been reported for PNIPAM that the coil-globule transition apparently also occurs according to a “domain” mechanism.39 “Domains” of PNIPAM appear to contain ~90 monomer units. In the present case, only the fraction with the lowest molecular weight (Mn 6,980 Da, ~60 monomer units) underwent an all-or-none transition. The other fractions behaved more like large proteins in the sense that the phase transition could be resolved into two independent steps corresponding to the dehydration of different structural “domains”.
Chaotropic Anions
Chaotropic anions have two influences on the LCST of PNIPAM.5 First, the surface tension of the hydrophobically hydrated moieties increases with added salt (Figure 1a). Second, the anions can shed their hydrations shells and directly binding to the polymer (Figure 1b). As shown in Tables 3 and 4, the c values do not change with the molecular weight or concentration of PNIPAM within experimental error for any of the anions. This is consistent with the results obtained for the upper step of the two-step transition for the kosmotropic ions. On the other hand, direct ion binding (putatively involving the amide groups) does depend upon the molecular weight and PNIPAM concentration. For the most strongly chaotropic anions, ClO4− and SCN−, a clear trend can be seen for Bmax and KA. Namely, the value of Bmax falls with increasing molecular weight, while the value of KA rises. The same trend is observed as a function of polymer concentration. The molecular weight effect is presumably caused by increased intramolecular interactions, while the concentration dependence is caused by intermolecular interactions. Such opposite behavior of KA and Bmax could perhaps appear to be counterintuitive since one might expect a larger KA value to be associated with a stronger salting-in effect (larger Bmax). These results, however, can be understood by considering a multiple binding site model as described below.
For a PNIPAM chain having n apparently independent binding sites, the number of anions bound may range from zero to n. Therefore, the average binding number, ν, must lie between zero and n. The value for ν is related to the equilibrium association constant, KA, by the following equation:40
| [3] |
where [M] is the molar concentration of anion. In this model, n is related to Bmax in equation 2, while ν is correlated to the actual temperature increase in the LCST observed at any given salt concentration due to direct anion binding. Accordingly, increasing n leads to a larger value for Bmax. The fraction of occupied sites, Y, can be found by rearranging equation 3 as follows:
| (4) |
As can be seen from equation 4, a higher fraction of occupied sites is correlated with a larger value for KA. This can also be expressed in terms of the equilibrium dissociation constant, KD, where KD = 1/KA. Either way, stronger binding is related to a higher fraction of bound chaotropic anions.
As was also found for experiments with kosmotropic anions, the amide side chains should have increased opportunities to undergo hydrogen bonding with increasing chain length and polymer concentration. These effects should be intramolecular and intermolecular, respectively. Chain-chain interactions may affect both the number of available binding sites as well as the apparent KA value. In fact, n should be reduced on electrostatic grounds. This is because the proximity of the amides will be closer, making anion binding to neighboring amide moieties more costly. Such an effect will increase with increasing molecular weight or polymer concentration since these chain-chain interactions become more pronounced. Moreover, reducing n will also reduce Bmax. This is exactly what is found by increasing either the molecular weight or the concentration of PNIPAM for the strongest chaotropes (Tables 3 and 4). On the other hand, the apparent value of KA, should be increased for single anion binding to more closely interacting polymer chains. This is at least in part related to a multivalency effect whereby a given anion has greater opportunities to interact with the polymer. Analogous effects for protein-ligand binding have already been hypothesized upon increased interactions between the receptors sites.41
It should be noted that the reasoning for the direction of change for KA and Bmax for the strongest chaotropes should also apply to the weaker chaotropes such as Br−, NO 3−, and I−. In fact, the apparent value of KA increases in all cases with increasing molecular weight. The magnitude of Bmax, however, is down by a factor of 2–4 for the weaker binding anions at identical molecular weights compared with ClO4− and SCN−. This makes the trends more difficult to discern within the signal-to-noise limitations of our experiments.
Conclusions
The effects of molecular weight and concentration on the mechanisms of specific anion interactions with PNIPAM were investigated. It was found that amide dehydration in the presence of kosmotropes was more facile at higher molecular weight and polymer concentration. This was consistent with increased chain-chain interactions of both intramolecular and intermolecular origin. Moreover, the apparent association constants with the chaotropes increased as a function of molecular weight and PNIPAM concentration on largely similar grounds. In stark contrast with this, the slope of LCST change vs. salt concentration for hydrophobic hydration of the polymer was not altered by either modulation of the polymer’s molecular weight or concentration in the presence of either kosmotropes or chaotropes.
Supplementary Material
Representative light scattering curves are provided in the Supporting Information. A note on the effects of the ions on the pH of the polymer solutions is also provided.
Acknowledgments
This work was supported by the National Institutes of Health (R01-070622, PSC), the National Science Foundation (DMR 0348477, DEB) and the Robert A. Welch Foundation (Grant A-1421, PSC, and A-0639, DEB).
References
- 1.Kunz W, Lo Nostro P, Ninham BW. Curr Opin Colloid Interface Sci. 2004;9:1. [Google Scholar]
- 2.Collins KD, Washabaugh MW. Q Rev Biophys. 1985;18:323. doi: 10.1017/s0033583500005369. [DOI] [PubMed] [Google Scholar]
- 3.von Hippel PH, Schleich T. Acc Chem Res. 1969;2:257. [Google Scholar]
- 4.Baldwin RL. Biophys J. 1996;71:2056. doi: 10.1016/S0006-3495(96)79404-3. [DOI] [PMC free article] [PubMed] [Google Scholar]
- 5.Zhang YJ, Furyk S, Bergbreiter DE, Cremer PS. J Am Chem Soc. 2005;127:14505. doi: 10.1021/ja0546424. [DOI] [PubMed] [Google Scholar]
- 6.Bauduin P, Nohmie F, Touraud D, Neueder R, Kunz W, Ninham BW. J Mol Liq. 2006;123:14. [Google Scholar]
- 7.Vrbka L, Jungwirth P, Bauduin P, Touraud D, Kunz W. J Phys Chem B. 2006;110:7036. doi: 10.1021/jp0567624. [DOI] [PubMed] [Google Scholar]
- 8.Hofmeister F. Arch Exp Pathol Pharmakol. 1888;24:247. [Google Scholar]
- 9.Kunz W, Henle J, Ninham BW. Curr Opin Colloid Interface Sci. 2004;9:19. [Google Scholar]
- 10.Cacace MG, Landau EM, Ramsden JJ. Q Rev Biophys. 1997;30:241. doi: 10.1017/s0033583597003363. [DOI] [PubMed] [Google Scholar]
- 11.Clarke RJ, Lupfert C. Biophys J. 1999;76:2614. doi: 10.1016/S0006-3495(99)77414-X. [DOI] [PMC free article] [PubMed] [Google Scholar]
- 12.Lo Nostro P, Fratoni LU, Ninham BW, Baglioni P. Biomacromolecules. 2002;3:1217. doi: 10.1021/bm0255692. [DOI] [PubMed] [Google Scholar]
- 13.Boström M, Williams DRM, Ninham BW. Biophys J. 2003;85:686. doi: 10.1016/S0006-3495(03)74512-3. [DOI] [PMC free article] [PubMed] [Google Scholar]
- 14.Gurau MC, Lim SM, Castellana ET, Albertorio F, Kataoka S, Cremer PS. J Am Chem Soc. 2004;126:10522. doi: 10.1021/ja047715c. [DOI] [PubMed] [Google Scholar]
- 15.Jungwirth P, Tobias DJ. Chem Rev. 2006;106:1259. doi: 10.1021/cr0403741. [DOI] [PubMed] [Google Scholar]
- 16.Lo Nostro P, Ninham BW, Milani S, Fratoni L, Baglioni P. Biopolymers. 2006;81:136. doi: 10.1002/bip.20389. [DOI] [PubMed] [Google Scholar]
- 17.Zhang YJ, Cremer PS. Curr Opin Chem Biol. 2006;10:658. doi: 10.1016/j.cbpa.2006.09.020. [DOI] [PubMed] [Google Scholar]
- 18.Boström M, Williams DRM, Ninham BW. Phys Rev Lett. 2001;87:168103. doi: 10.1103/PhysRevLett.87.168103. [DOI] [PubMed] [Google Scholar]
- 19.Omta AW, Kropman MF, Woutersen S, Bakker HJ. Science. 2003;301:347. doi: 10.1126/science.1084801. [DOI] [PubMed] [Google Scholar]
- 20.Batchelor JD, Olteanu A, Tripathy A, Pielak GJ. J Am Chem Soc. 2004;126:1958. doi: 10.1021/ja039335h. [DOI] [PubMed] [Google Scholar]
- 21.Heskins M, Guillet JE. J Macromol Sci. 1968;2:1441. [Google Scholar]
- 22.Schild HG. Prog Polym Sci. 1992;17:163. [Google Scholar]
- 23.Schild HG, Tirrell DA. J Phys Chem. 1990;94:4352. [Google Scholar]
- 24.Dhara D, Chatterji PR. J Macromol Sci -Rev Macromol Chem Phys. 2000;C40:51. [Google Scholar]
- 25.Freitag R, Garret-Flaudy F. Langmuir. 2002;18:3434. [Google Scholar]
- 26.Mao HB, Yang TL, Cremer PS. J Am Chem Soc. 2002;124:4432. doi: 10.1021/ja017625x. [DOI] [PubMed] [Google Scholar]
- 27.Mao HB, Li CM, Zhang YJ, Bergbreiter DE, Cremer PS. J Am Chem Soc. 2003;125:2850. doi: 10.1021/ja029691k. [DOI] [PubMed] [Google Scholar]
- 28.Zhang YJ, Mao HB, Cremer PS. J Am Chem Soc. 2003;125:15630. doi: 10.1021/ja037869c. [DOI] [PubMed] [Google Scholar]
- 29.Mao HB, Li CM, Zhang YJ, Furyk S, Cremer PS, Bergbreiter DE. Macromolecules. 2004;37:1031. [Google Scholar]
- 30.Zhang YJ, Trabbic-Carlson K, Albertorio F, Chilkoti A, Cremer PS. Biomacromolecules. 2006;7:2192. doi: 10.1021/bm060254y. [DOI] [PubMed] [Google Scholar]
- 31.Furyk S, Zhang YJ, Ortiz-Acosta D, Cremer PS, Bergbreiter DE. J Polym Sci Part A: Polym Chem. 2006;44:1492. [Google Scholar]
- 32.Xia Y, Yin XC, Burke NAD, Stöver HDH. Macromolecules. 2005;38:5937. [Google Scholar]
- 33.Fujishige S. Polymer J. 1987;19:297. [Google Scholar]
- 34.Note: These standards have been recalibrated since ref. 5. This accounts for the different LCST values reported herein.
- 35.Zhang GZ, Wu C. Adv Polym Sci. 2006;195:101. [Google Scholar]
- 36.Wu C, Wang XH. Phys Rev Lett. 1998;80:4092. [Google Scholar]
- 37.Ptitsyn OB. The Molten Globule State. In: Creighton TE, editor. Protein Folding. W. H. Freeman & Company; New York: 1992. p. 243. [Google Scholar]
- 38.Privalov PL. Adv Protein Chem. 1982;35:1. [PubMed] [Google Scholar]
- 39.Tiktopulo EI, Uversky VN, Lushchik VB, Klenin SI, Bychkova VE, Ptitsyn OB. Macromolecules. 1995;28:7519. [Google Scholar]
- 40.Stenesh J. Core Topics in Biochemistry. Cogno Press; Kalamazoo: 1993. Chapter 4. Binding of ligands to macromolecules; p. 187. [Google Scholar]
- 41.Sims PA, Wong CF, Vuga D, McCammon JA, Sefton BM. J Comput Chem. 2005;26:668. doi: 10.1002/jcc.20207. [DOI] [PubMed] [Google Scholar]
- 42.Marcus Y. Ion Properties. Marcel Dekker, Inc; 1997. [Google Scholar]
- 43.Melander W, Horvath C. Arch Biochem Biophys. 1977;183:200. doi: 10.1016/0003-9861(77)90434-9. [DOI] [PubMed] [Google Scholar]
- 44.Washburn EW, editor. International Critical Tables of Numerical data, Physics, Chemistry and Technology. 1. IV McGraw-Hill; New York: 1928. [Google Scholar]
Associated Data
This section collects any data citations, data availability statements, or supplementary materials included in this article.
Supplementary Materials
Representative light scattering curves are provided in the Supporting Information. A note on the effects of the ions on the pH of the polymer solutions is also provided.


