

Abstract
The Gene Ontology (GO) is extensively used to analyze all types of high-throughput experiments. However, researchers still face several challenges when using GO and other functional annotation databases. One problem is the large number of multiple hypotheses that are being tested for each study. In addition, categories often overlap with both direct parents/descendents and other distant categories in the hierarchical structure. This makes it hard to determine if the identified significant categories represent different functional outcomes or rather a redundant view of the same biological processes. To overcome these problems we developed a generative probabilistic model which identifies a (small) subset of categories that, together, explain the selected gene set. Our model accommodates noise and errors in the selected gene set and GO. Using controlled GO data our method correctly recovered most of the selected categories, leading to dramatic improvements over current methods for GO analysis. When used with microarray expression data and ChIP-chip data from yeast and human our method was able to correctly identify both general and specific enriched categories which were overlooked by other methods.
INTRODUCTION
High-throughput experiments in molecular biology are enabling researchers to obtain large quantities of data. In many cases these datasets are in the form of lists of genes (for example, differentially expressed genes or targets of a transcription factor). However, due to the size of the resulting lists it is often hard to manually inspect them to characterize the functional outcome of the experiment. To overcome this challenge researchers have been increasingly relying on automated analysis using curated databases of functional annotations. These include the Gene Ontology (GO) (1) and the MIPS (2) databases, among others. In these databases, genes are annotated by standardized terms (for example, GO categories) indicating their known functions or related biological processes. The popularity of this type of analysis is evident from its wide use in almost all types of high-throughput experiments, including large-scale sequencing efforts (3,4), microarrays (5,6), protein–protein interactions (7–9), protein–DNA interactions (10,11), knockouts (12) and many more.
While using curated databases to analyze high-throughput experiments has led to some success, there are many challenges facing researchers trying to use these databases. Multiple hypothesis testing is often an issue since GO contains thousand of categories which are all tested for enrichment for the same gene set (13). While this issue can be addressed by statistical correction methods, other problems remain unsolved. The categories to which genes are assigned are not independent, making it hard to determine if a set of identified significant categories represents a set of different functional outcomes or rather a redundant view of the same biological process. For example, GO categories are organized into a hierarchy with more general categories close to the root and more specific categories at the bottom. Genes annotated by a specific term are implicitly annotated to all parent terms, resulting in highly overlapping categories. Thus, if an intermediate node is determined to be significant it is often the case that many nodes below it would also be significant. In addition, many genes are annotated to multiple categories that do not share a directed path in the GO hierarchy, resulting in overlapping categories that cannot be detected using the hierarchical structure. Indeed, when using GO to compute hypergeometric P-values, which is the most common method used, researchers often recover several redundant categories as the top hits (14,15; see also Table 1 and Supplementary Tables 3–6) which both masks other important categories and makes it hard to determine the most relevant category.
Table 1.
Categories for cell cycle experiments
| Classic | Parent-Child | Elim | Weight | GenGO |
|---|---|---|---|---|
| Mitotic cell cycle | Cell cycle | Microtubule nucleation | Microtubule nucleation | Mitotic cell cycle |
| DNA replication | Cell cycle process | Mitotic sister chromatid cohesion | Mitotic sister chromatid cohesion | DNA replication |
| Cell cycle | DNA metabolic process | Mitotic spindle organization and biogenesis | DNA strand elongation during DNA replication | Microtubule-based process |
| Cell cycle process | Microtubule-based process | DNA replication initiation | Mitotic spindle organization and biogenesis | Cell division |
| DNA-dependent DNA replication | DNA replication | Telomere maintenance via recombination | Telomere maintenance via recombination | Chromatin assembly or disassembly |
Top five GO categories identified by different methods from the list of periodically expressed yeast genes during the mitotic cell cycle (18).
These problems with GO have been recognized and a few methods were developed to address them. One of the first attempts was the use of ‘GO Slim’ (http://www.geneontology.org/GO.slims.shtml), a leaner version of GO containing a manually picked small set of categories (130 of the current ∼24 000 categories in GO) with a small overlap between them. While useful, this method only retains the general categories and does not provide more specific ones which are often most interesting to biologists. Other attempts were proposed by a few recent papers. Grossmann et al. (14) recomputed the P-value for a specific category by taking into account the immediately more general terms (the parents). This can often lead to the removal of false positives, since some of the more specific categories are eliminated if their parent category is determined to be significant. Alexa et al. (15) proposed two algorithms to correct the P-values for a specific GO term. The first algorithm, ‘Elim’, tests the enrichment of each GO category in a gene set by examining the GO hierarchy in a bottom-up order. Once a GO category is determined to be significant, all genes associated with it are removed in the following analysis of its ancestral (more general) categories. The other algorithm, ‘Weight’, uses a similar strategy but rather than completely removing genes in significant categories it down-weights them for the remaining categories.
While these methods are more powerful, they only utilize local information in the graph structure (parent-child or bottom-up). Thus, they cannot account for longer range relationships and global dependencies such as highly overlapping categories that do not share a directed path. In addition, all the aforementioned methods return a (sometimes long) list of GO categories with their P-values requiring the user to select a cutoff in order to further analyze the resulting list.
Our approach is different. From a biological point of view, one of the goals of using functional databases is to identify a set of biological processes related to the specific study. Thus, it would be natural to identify the set of significant GO categories and processes that ‘generated’ the observed list. This leads us to use a generative model for this task. A generative model is a computational model that assumes that the observed data is sampled from (or was generated by) some distribution. The observed data is then used to estimate the parameters of the distribution and to infer values that could not be directly observed. In this case the parameters we are interested in relate to the noise and incompleteness of the genomic data and the GO hierarchy and the missing observations are the GO categories that are related to the experimental study. Our goal is to identify a (preferably small) set of categories that together account for the set of genes observed. Since many experiments study complicated responses involving several processes, the categories can come from different locations and levels in the hierarchy. However, highly overlapping and redundant categories will not be selected since one of them is often enough to explain the subset of the genes belonging to these categories.
We applied our method, which we term GenGO (GENerative GO analysis), to analyzing the GO hierarchy for yeast and humans. We used a controlled analysis (in which subsets of categories are selected and the goal is to recover the (hidden) categories), microarray expression data and ChIP-chip data for both species. GenGO was able to drastically reduce the false positive rates, even after statistical correction. As we show, GenGO consistently outperforms both the original hypergeometric method and the methods considering only local structural dependencies, in some cases dramatically so.
MATERIALS AND METHODS
The activation graph for GO categories
We developed a generative model to identify a subset of active GO categories. A generative model is a model that assumes that the observed data is sampled from (was generated by) some distribution. That data is then used to estimate the parameters of the distribution, by providing either a point estimate or a Bayesian posterior. These estimates can then be used to infer missing observations. Unlike discriminative models (that are commonly used for classification) generative models make explicit assumptions about how the data was generated. Thus, generative models can be superior when the assumptions are at least approximately correct. In this case we could rely on knowledge regarding the possible noise sources for specifying our generative model.
When designing the method we placed special emphasis on simplicity and speed. GO analysis is often an interactive process in which users change their lists, or analyze multiple lists (for example, different gene clusters or different targets of transcription factors). Thus for a method to be successful it should be computable in a reasonable time to allow interactive analysis.
To explain our method, one can think of this problem in terms of a bi-partite graph representing the relationships between GO categories and genes (Figure 1). Nodes on the left side of the graph represent GO categories and nodes on the right represent all genes annotated in that species. We connect a gene node with a GO node by an edge if and only if the gene is annotated to belong to that GO category. We denote genes that were identified in the experiment as ‘ON’ or active and genes that were not identified as ‘OFF’ or inactive. Similarly, when a biological process (corresponding to a specific GO category) is active, we represent it by setting its GO node to ‘ON’ and when it is inactive, we set its state to ‘OFF’.
Figure 1.

Construction of an activation graph. (a) A diagram showing a GO hierarchy of four categories and the five genes annotated by these categories (letters in each rectangle). Because of the ‘true path’ rule, each gene annotated by a category in the GO hierarchy is also annotated by all its parent categories. (b) The activation graph corresponding to this GO hierarchy when observing three of the genes (A,B,C). In this graph, we connect a gene node with a GO node if and only if the gene is annotated by that GO category. For this set of genes the active category is determined to be the orange category. Note that due to noise there is a gene that is selected even though it does not belong to the active category (A). Noise is also responsible for the fact that a gene belonging to the active category is not selected (D).
To find this set we define a probabilistic model on the activation graph (containing both gene and GO nodes). The model accounts for noise in the experimental and GO data. We develop an algorithm that identifies active GO categories by maximizing the likelihood of this model conditioned on the set of active genes. The final outcome is a small subset of active GO nodes that together explains the set of active genes. We describe the model in details in the following sections.
Probabilistic model for activation graphs
We assume a generative model for gene activation. In this model we first select a subset of GO categories and activate all genes in these categories. Next, a random process (representing noise, errors in GO assignments and partial knowledge) inactivates, with probability 1 − p, genes in each of the selected categories and activates, with probability q, genes in categories that were not selected leading to the observed gene set. Given a list of active (selected) genes and a set of active GO categories, we can define the following sets:
Ag—active gene nodes connected to at least one active GO node
An—active gene nodes not connected to any active GO nodes
I—inactive gene nodes
Sg—edges connecting nodes in I with active GO nodes
Sn—edges connecting nodes in I with inactive GO nodes
Using these symbols we define the following log-likelihood function which we would like to maximize:
| 1 |
where G is the set of active (selected) gene nodes (the input), C is the set of active GO nodes, and |X| represents the size of the X group (Ag, An, etc.). This function captures our generative model. With probability P genes belonging to active categories would remain active (Ag). With probability q genes that do not belong to any active category would be activated (An). Similarly, with probability 1 − p genes in active categories will become inactive (Sg) and with probability 1 − q genes in inactive categories will remain inactive (Sn). The last term in the likelihood function penalizes the size of the set of active GO categories (|C|) so that the model will prefer a smaller set of categories when explaining the selected set of genes. The hyperparameter α is a positive number controlling the penalization. See Supplementary Material for examples illustrating the differences between this likelihood function and using the classic hypergeometric method.
Note that the likelihood function formulated above discourages the identification of highly overlapping and redundant categories. For such categories it is usually enough to select one category to account for the observed genes from both categories. Selecting the second would not increase the contribution from the active genes (since these are already accounted for by the first category) and would lead to penalty for both the non active genes from the second category and the addition of another category to the active GO set (using the α penalty parameter). Thus our method would select the best category that fits the data resulting in a small and unique set of GO categories for each experiment.
The above likelihood model is a function of the selected set of active GO categories (denoted by C). In the next section we present an algorithm for finding such a set that maximizes this likelihood. We also present a method for optimizing the values for the noise parameters p and q. Once the algorithm terminates we compute a P-value score for each of the selected categories using hypergeometric distribution and return an ordered list of selected categories to the user.
Optimization by greedy search
Given an input list of active genes, we would like to determine a set of active GO categories (C) that maximizes the likelihood function (1). This is an NP-hard problem as we discuss in Supplementary Methods. Thus, we use a simple and fast greedy search algorithm to look for a local maximum of the likelihood function. At each iteration, the algorithm searches for categories to add to (or remove from) to the current set of active categories in order to improve the global likelihood. If such categories exist, the one leading to the highest improvement in likelihood is added to (or removed from) to the set and the search continues. Otherwise the current set is retuned as the optimal set of active categories.
The algorithm is as follows (p and q are fixed in this part; they can either be optimized in an outer loop as we discuss below or set by the user in advance.).
Algorithm 1 (Find the best GO set for given parameters)
Initialize C0 to be the empty set
- At iteration i, we consider all possible one-step changes of the current set of active GO categories (Ci), and compare the likelihood of the resulting sets. Let
where T is the set of all GO categories. Thus among all possible reductions of
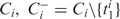 has the highest likelihood. Similarly, among all possible expansions of
 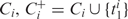 has the highest likelihood.
 If the likelihood of
 is higher than that of both
  and Ci, let
  go to Step 2.
If the likelihood of
is higher than the likelihood of Ci, let  go to Step 2. Otherwise go to the next step.
Return C.
It is important to note that including more GO categories will not necessarily lead to improved likelihood and thus the algorithm above does not overfit the data. The reason for this is that any category that is added must also account for all genes that are included in that category and were not selected. Adding a category for which many of its genes were not selected or if they were selected they are already explained by other selected categories will usually lead to reduction in the likelihood.
Once the algorithm terminates, we use the set of active categories as the final result. For these categories, we compute a P-value using the hypergeometric distribution and return the list, ordered by the P-value significance score, to the user. Corrected P-values can also be computed either by using the Bonferroni correction or by carrying out randomization tests (16).
Optimizing parameters
There are two parameters in our model, p and q. p is the probability that an active GO node will activate a gene belonging to that GO category and q is the probability that a gene node becomes active without being activated by any GO node. A higher p means a higher participation rate of the related genes in the biological process, and/or less uncertainty in the activation relation between a GO node and the related GO nodes. A higher q means a larger portion of the genes are allowed to be explained by background noise or errors in the current ontology. p and q can be set manually according to the estimation of noise level. Alternatively p and q can be learned from the data. See Supplementary Methods for details. The hyperparameter α can be chosen by experiments and we found it generally works well when we set α = 3.
GO annotation data
GO files (release 2007–06) were downloaded from the GO website (ftp://ftp.geneontology.org/). GO annotations for humans and yeast were extracted from the Gene2GO database, which was downloaded from the NCBI website (ftp://ftp.ncbi.nlm.nih.gov/) on 26 June 2007. GO categories were filtered such that only those with at least 5 genes would be used. In this study, we focused on the biological process categories, but our methodology is also applicable to Cellular Component and Molecular Function categories.
Precision/recall curves
Precision/recall plots were done using the ROCR package in R (http://www.r-project.org/). Each point in the precision/recall curve corresponds to a score (or P-value) cutoff. The precision and the recall are defined as follows:
where TP is the number of true positives (true active categories below the cutoff), FP is the number of false positives (inactive categories below the cutoff), and FN is the number of false negatives (true active categories above the cutoff).
Precision/recall curves are more informative than receiver operating characteristic (ROC) curves when working with highly skewed datasets (17). This is exactly the case when working with GO enrichment analysis in which the vast majority of categories are not expected to be enriched for any one dataset.
Comparison
For comparison with the Classic method we used the hypergeometric p-value analysis from STEM (16). We used the Parent-Child method implemented by Ontologizer (http://www.charite.de/ch/medgen/ontologizer/recomb06/index.html), and the Weight and Elim methods implemented in the current release of topGO (R 2.5.1, topGO 1.2.1). For both Classic and Parent-Child methods, P-values are computed with Bonferroni correction, which is a commonly used method for multiple testing corrections.
In every GO analysis task we performed for a species, we used the whole set of annotated genes as the reference set. To generate the precision/recall curve for a method in a specific experiment, we followed the strategy in Grossmann et al. (14) and accumulated all P-values from 100 random gene sets.
Ranking induced genes in amino acid starvation
For each yeast gene in the amino acid starvation experiment, we looked at its second highest expression level throughout the whole time series, and ranked all genes according to this value.
GO hierarchy figures
GO hierarchy figures were generated with QuickGO (http://www.ebi.ac.uk/ego/).
RESULTS
Comparison by selecting a subset of categories
We first tested our method (GenGO) using GO data for yeast and humans. We followed the same procedures in Grossmann et al. (14) and Alexa et al. (15) for objective comparison of different GO analysis methods. For each species, 1, 2 or 5 GO categories were randomly selected as ‘active’, and a subset of genes associated with each active category were randomly picked (90 or 50% of genes in each of the selected categories). In addition, we randomly selected 1 or 15% of the remaining genes (from inactive categories) and combined the two sets from active and non-active categories to form the input to the GO analysis. Due to the large run time of some of the methods we were comparing to (Elim and Weight), for each experiment, 100 random sets were generated using the same parameters. Supplementary Figures 1 and 2 present results for tests carried out on a larger random set for the faster methods.
We used precision/recall curves to compare GenGO with four other methods (see Materials and methods section). These included ‘Classic’ (hypergeometric test) and the three other methods listed above. The results are plotted in Figure 2 (yeast) and Figure 3 (human). For all settings, the performance of GenGO dominates all other methods. When the noise level is low, the performance of GenGO is close to optimal (top rows in Figures 2 and 3). When the noise level is high, the performance drops for all methods, though GenGO is still the best. Even with high noise and multiple categories (as is the case for most real experiments) GenGO can achieve 80% precision for high recall levels (60–80%). As for the other methods, in most cases ‘Weight’ is the second best and ‘Classic’ is usually the worst, indicating that all methods previously proposed for the task indeed improve upon the standard usage of GO.
Figure 2.

Comparison using GO for yeast. Performance comparison of GenGO (blue curve) with four other methods on data generated using the yeast GO database. We use p to represent the fraction of genes that are identified from an active GO category (true positive rate for a category, see Materials and methods section) and q to represent the fraction genes that are selected but do not belong to any active category. (a) Selecting one category with p = 0.9, q = 0.01; (b) Selecting one category with p = 0.5, q = 0.15; (c) and (d) Same as (a) and (b) but using two categories; (e) and (f) same with five categories. Note that even when the noise is substantial (using 50% of genes in selected categories and 15% of all other genes, bottom row) GenGO is still able to accurately recover most of the correct categories. See Supplementary Figure 1 for a more detailed figure.
Figure 3.

Comparison using GO for human data. Performance comparison of five methods on data generated using human GO database. (a–f) Same as in Figure 2 for human GO data. See Supplementary Figure 2 for a more detailed figure.
Note that while the precision usually drops as the recall increases, there could be cases where the precision actually improves even though recall is increasing. For example, in Figure 2a the ‘GenGO’ method correctly assigns the lowest P-values to some of the selected categories, which results in a very high precision rate at low recall rates. However, when the recall increases to 0.1, due to some non-selected categories that are (incorrectly) assigned a low P-value, the precision drops to 0.9. As the recall continues to increase, the precision increases again because the method recovers the rest of the selected categories without picking up much non-selected categories.
Analysis of noise datasets
To test the ability of GenGO to overcome the multiple hypothesis testing problem, 1, 5 and 10% of all human genes were randomly selected as a test set, and the five algorithms were run to identify significant categories. The procedure was repeated 100 times, and the percentages of sets without any significant GO categories (P-value <0.001 with Bonferroni correction where applicable) are listed for each of the methods in Supplementary Table 1. Even after correction the Classic method, which is the most commonly used, identified significant categories in all experiments. When 10% of the genes were selected at random, all methods, except for GenGO identified significant categories in at least 50% of the experiments. In contrast, GenGO was able to determine that no such significant category exists for >98% of tested noise sets.
In addition, we used a similar procedure to test for noise sets randomly selected from different branches of the GO hierarchy. 0.1, 0.2 and 0.5% of genes from each of the Level 2 categories (‘biological_process’ being at Level 1) were randomly selected, and the five algorithms were run to identify significant categories. The results are presented in Supplementary Table 2. As the percentage of genes selected decreases, it becomes easier for all methods to determine that there are no significant categories. However, even with 0.2% of genes selected in this way, all methods except GenGO and Parent-Child wrongly identified significant categories in at least 77% of the experiments.
Comparison on microarray experiment for yeast
Testing GenGO using real expression data is more challenging since the ‘ground truth’ is unknown in most cases. Still, when the biological condition is clearly defined, it is possible to determine whether a set of GO categories provides a good summary of the experimental setup.
Cell cycle
We have initially applied GenGO to analyze the well studied cell cycle expression dataset from Spellman et al. (18). We used the 800 genes determined to be cycling during the mitotic cell cycle in budding yeast. Figure 4 plots the location in the GO hierarchy of the top five categories identified by four of the five methods (see also, Table 1 and Supplementary Figure 3). The results highlight the advantages of GenGO. For example, while both GenGO and Classic successfully identify ‘mitotic cell cycle’ as the most significant category, the Classic method returns highly redundant categories including ‘mitotic cell cycle’, ‘cell cycle process’, and ‘cell cycle’. The Parent-Child method (14) also returns redundant categories (‘cell cycle process’, and ‘cell cycle’) though it does a better job in finding the more specific ‘microtubule-based process’ which is related to cytoskeleton changes during cell cycle progression (18). Both Elim and Weight fail to identify the most appropriate category for this data (cell cycle) though they do identify a number of relevant specific categories. In contrast, GenGO contains both the correct high level categories (‘cell cycle’ and ‘cell division’) as well as more specific categories (‘chromatin assembly or disassembly’) that play an important role in DNA replication and chromosome segregation. Note that cell division here is not redundant with cell cycle. While ‘cell cycle’ describes the different phases of the cell cycle, their regulation, and checkpoints, ‘cell division’ refers to the process of separation of daughter cells following the cell cycle. See Supplementary Table 3 for additional analysis of genes associated with specific cell cycle phases.
Figure 4.

Cell cycle comparison. Comparison of top five GO categories identified in the yeast cell cycle genes (18) by four methods. (a) Top five GO categories identified using the Classic method (hypergeometric P-value) are highlighted. Green represents the most significant category identified. The five categories represent highly redundant view of only two biological processes, as highlighted by the red circles. (b) Parent_Child method (14). (c) Weight method (15) (see website for the Elim method) and (d) GenGO. See text for discussion.
Amino acid starvation
We repeated the above analysis using the top 500 induced genes in amino acid starvation experiments (19). Only GenGO and Weight correctly identified ‘amino acid biosynthetic process’ as the most significant category (Supplementary Table 4 and Supplementary Figures 4–8). The next significant category identified by GenGO is ‘sulfur metabolic process’. It includes genes required in recycling sulfur metabolites, which are known to be highly expressed under amino acid starvation (20). In addition, an interesting finding by GenGO is ‘monosaccharide catabolic process’. During amino acid starvation, besides the lack of amino acid there is a cellular need to produce energy which is carried out mainly by this process (21). Another category identified by GenGO, ‘amino acid catabolic process’, describes the process that generates amino acids from existing proteins, which is a known consequence of amino acid starvation. In contrast, the categories identified by Elim are too specific: three of the five categories are subcategories of ‘amino acid biosynthetic process’ and can be better summarized by the latter. The Classic method again identifies redundant categories: ‘organic acid metabolic process’, ‘carboxylic acid metabolic process’, and ‘amino acid metabolic process’.
Analysis of human expression data
We repeated the analysis described above using human immune response experiments from Nau et al. (22). A total of 977 genes were identified as differentially expressed when host cells were exposed to one or more bacterial pathogens. For this set all methods have correctly identified ‘immune response’ in the top two categories (Table 2). However, as was the case for yeast, the Classic method returned many redundant categories. Parent-Child returned two very general categories (‘biological_process’ and ‘regulation of biology’) which do not provide insight into the set of genes. Interestingly, both Elim and Weight identified ‘response to virus’, as one of the top five categories. Since only bacteria were used in this study this category should not have been identified. It was likely selected by these methods due to its overlap with the more general ‘immune response’ category. In addition to the ‘immune response’ and ‘wound response’ categories identified by GenGO it also identified ‘taxis’ that is clearly relevant due to the mobility need for macrophages during immune response (23). GenGO also identified ‘regulation of apoptosis’ that plays an important role in determining the drastically different fates for macrophages after infection (24–26). The final category identified, ‘tRNA aminoacylation’ is the process that joins an amino acid to its cognate tRNA, which is an important step in protein translation (27).
Table 2.
Categories for immune response
| Classic | Parent-Child | Elim | Weight | GenGO |
|---|---|---|---|---|
| Imune response | Biological process | Immune response | Immune response | Immune response |
| Imune system process | Immune system process | Inflammatory response | Response to wounding | Response to wounding |
| Response to stress | Response to stimulus | Chemotaxis | Cell proliferation | Taxis |
| Response to stimulus | Cell proliferation | Response to virus | Chemotaxis | Regulation of apoptosis |
| Response to wounding | Biological regulation | Anti-apoptosis | Response to virus | tRNA aminoacylation |
Top five GO categories identified from the list of human genes determined to be differentially expressed following exposure to bacteria (22).
Application to ChIP-chip data analysis
ChIP-chip experiments (28) are used to experimentally identify the targets of transcription factors. These targets can later be used to shed light on the functional role of that factor, which can be done by using GO to determine the function of the resulting gene target set (29). We have compared the GO enrichment analysis of the different methods for the targets of transcription factors from yeast and human.
For yeast, we have looked at Swi6, a cell cycle regulator of G1 transcription (30). Supplementary Table 5 presents the results of the five methods for this factor and Supplementary Figures 9–13 present their GO enrichment hierarchies. Except for Elim and Weight, which did not return ‘cell cycle’ in their top five hits, the three other methods correctly selected this as the top category for Swi6. However, the hypergeometric and parent-child again returned a set of redundant categories (‘cell cycle’, ‘cell cycle process’). In contrast, GenGO was able to balance the more detailed and the more high-level categories. Specifically it was the only one to correctly identify ‘reproduction’ as one of the top categories for Swi6, a role that is well documented (31).
We have also looked at the analysis of targets of E2F1, a human cell cycle regulator. Ren et al. (32) have studied the targets of E2F1 and based on their detailed analysis determined in their title that ‘E2F integrates cell cycle progression with DNA repair, replication, and G2/M checkpoints’. While all GO analysis methods correctly identified E2F1's role in controlling various aspects of the cell cycle, GenGO was only method to rank all three functions (replication, DNA repair and G2/M checkpoint) in its top five categories (See Supplementary Table 6 and Supplementary Figures 14–18).
DISCUSSION
The use of GO to analyze large datasets is rapidly becoming a standard procedure following in many high throughput experimental studies. The ability to utilize decades of prior work that have been curated into a single database allow researchers to gain initial insight regarding their experiment and can often suggest novel hypothesis for follow-up work (33,34). However, in many cases the result of this GO analysis is a long list of significant categories. This makes it hard to interpret the results and determine what the most significantly enriched functions are in the selected set of genes.
In this article, we described a generative model for identifying a small subset of categories that, combined, explain the observed set of genes. The algorithm we presented maximizes a global likelihood function to achieve this task. Our results suggest that GenGO is effective in minimizing false positives while at the same time it can accurately balance the set of categories it returns, including both high level and specific categories. GenGO was shown to work very well on both simulated data and real data from a number of different experimental techniques and species. Unlike other methods it does not require an extra step for correcting for multiple hypothesis testing resulting in categories that are both significant and unique.
We have implemented our method as a website at http://www.sb.cs.cmu.edu/GenGO. To facilitate interactive use, the website allows the user to set default values for p and q, leading to faster analysis. Alternatively, users can let the software automatically optimize one or both of the parameters. The running time depends, of course, on the size of the input and the species. However, even when the input is rather large, the running time is very reasonable. For example, for the 800 yeast cell cycle genes mentioned above GenGO takes only 3 s on a P4 2.4 GHz computer.
The current algorithm treats all GO categories in the same way regardless of their size or specificity. In future work we would like to more explicitly address this by using different values for the penalty term α depending on the size of the selected category.
As we gain more knowledge regarding the function of genes and other transcribed elements in the cell these annotation databases will only become larger leading to further redundancies and overlaps. We thus believe that GenGO will be useful for researchers in many different areas of high-throughput biology for many years to come.
SUPPLEMENTARY DATA
Supplementary Data are available at NAR Online.
ACKNOWLEDGEMENTS
Funding for research and funding to pay the open access publication charges for this article were supported by NIH grant NO1 AI-500 and NSF CAREER award 0448453 to Z.B.-J.
Conflict of interest statement. None declared.
REFERENCES
- 1.The Gene Ontology Consortium. Gene ontology: tool for the unification of biology. Nat. Genet. 2000;25:25–29. doi: 10.1038/75556. [DOI] [PMC free article] [PubMed] [Google Scholar]
- 2.Mewes HW, Frishman D, Guldener U, Mannhaupt G, Mayer K, Mokrejs M, Morgenstern B, Munsterkotter M, Rudd S, Weil B. MIPS: a database for genomes and protein sequences. Nucleic Acids Res. 1999;27:144–148. doi: 10.1093/nar/30.1.31. [DOI] [PMC free article] [PubMed] [Google Scholar]
- 3.The ENCODE Project Consortium. Identification and analysis of functional elements in 1% of the human genome by the ENCODE pilot project. Nature. 2007;447:799–816. doi: 10.1038/nature05874. [DOI] [PMC free article] [PubMed] [Google Scholar]
- 4.Kellis M, Patterson N, Endrizzi M, Birren B, Lander ES. Sequencing and comparison of yeast species to identify genes and regulatory elements. Nature. 2003;423:241–254. doi: 10.1038/nature01644. [DOI] [PubMed] [Google Scholar]
- 5.Cheung VG, Conlin LK, Weber TM, Arcaro M, Jen KY, Morley M, Spielman RS. Natural variation in human gene expression assessed in lymphoblastoid cells. Nat. Genet. 2003;33:422–425. doi: 10.1038/ng1094. [DOI] [PubMed] [Google Scholar]
- 6.The Toxicogenomics Research Consortium. Standardizing global gene expression analysis between laboratories and across platforms. Nat. Methods. 2005;2:351–356. doi: 10.1038/nmeth754. [DOI] [PubMed] [Google Scholar]
- 7.Bader GD, Hogue CWV. Analyzing yeast protein–protein interaction data obtained from different sources. Nat. Biotechnol. 2002;20:991–997. doi: 10.1038/nbt1002-991. [DOI] [PubMed] [Google Scholar]
- 8.Giot L, Bader JS, Brouwer C, Chaudhuri A, Kuang B, Li Y, Hao YL, Ooi CE, Godwin B, Vitols E, et al. A protein interaction map of Drosophila melanogaster. Science. 2003;302:1727–1736. doi: 10.1126/science.1090289. [DOI] [PubMed] [Google Scholar]
- 9.Ewing RM, Chu P, Elisma F, Li H, Taylor P, Climie S, McBroom-Cerajewski L, Robinson MD, O’Connor L, Li M, et al. Large-scale mapping of human protein–protein interactions by mass spectrometry. Mol. Syst. Biol. 2007;3:89. doi: 10.1038/msb4100134. [DOI] [PMC free article] [PubMed] [Google Scholar]
- 10.Mukherjee S, Berger MF, Jona G, Wang XS, Muzzey D, Snyder M, Young RA, Bulyk ML. Rapid analysis of the DNA-binding specificities of transcription factors with DNA microarrays. Nat. Genet. 2004;36:1331–1339. doi: 10.1038/ng1473. [DOI] [PMC free article] [PubMed] [Google Scholar]
- 11.Palomero T, Lim WK, Odom DT, Sulis ML, Real PJ, Margolin A, Barnes KC, O’Neil J, Neuberg D, Weng AP, et al. NOTCH1 directly regulates c-MYC and activates a feed-forward-loop transcriptional network promoting leukemic cell growth. Proc. Natl Acad. Sci. USA. 2006;103:18261–18266. doi: 10.1073/pnas.0606108103. [DOI] [PMC free article] [PubMed] [Google Scholar]
- 12.Deutscher D, Meilijson I, Kupiec M, Ruppin E. Multiple knockout analysis of genetic robustness in the yeast metabolic network. Nat. Genet. 2006;38:993–998. doi: 10.1038/ng1856. [DOI] [PubMed] [Google Scholar]
- 13.Ernst J, Nau GJ, Bar-Joseph Z. Clustering short time series gene expression data. Bioinformatics. 2005;21(Suppl 1):I159–I168. doi: 10.1093/bioinformatics/bti1022. [DOI] [PubMed] [Google Scholar]
- 14.Grossmann S, Bauer S, Robinson PN, Vingron M. Improved detection of overrepresentation of gene-ontology annotations with parent-child analysis. Bioinformatics. 2007;23:3024–3031. doi: 10.1093/bioinformatics/btm440. [DOI] [PubMed] [Google Scholar]
- 15.Alexa A, Rahnenfuhrer J, Lengauer T. Improved scoring of functional groups from gene expression data by decorrelating GO graph structure. Bioinformatics. 2006;22:1600–1607. doi: 10.1093/bioinformatics/btl140. [DOI] [PubMed] [Google Scholar]
- 16.Ernst J, Bar-Joseph Z. STEM: a tool for the analysis of short time series gene expression data. BMC Bioinformatics. 2006;7:191. doi: 10.1186/1471-2105-7-191. [DOI] [PMC free article] [PubMed] [Google Scholar]
- 17.Davis J, Goadrich M. Machine learning, Proceedings of the twenty-third International Conference (ICML 2006) 2006. The relationship between precision-recall and ROC curves. , Pittsburgh, PA, USA pp. 233–240. ACM International Conference Proceeding series, http://dblp.uni-trier.de/rec/bibtex/conf/icml/2006. [Google Scholar]
- 18.Spellman PT, Sherlock G, Zhang MQ, Iyer VR, Anders K, Eisen MB, Brown PO, Botstein D, Futcher B. Comprehensive identification of cell cycle–regulated genes of the yeast Saccharomyces cerevisiae by microarray hybridization. Mol. Biol. Cell. 1998;9:3273–3297. doi: 10.1091/mbc.9.12.3273. [DOI] [PMC free article] [PubMed] [Google Scholar]
- 19.Gasch AP, Spellman PT, Kao CM, Carmel-Harel O, Eisen MB, Storz G, Botstein D, Brown PO. Genomic expression programs in the response of yeast cells to environmental changes. Mol. Biol. Cell. 2000;11:4241–4257. doi: 10.1091/mbc.11.12.4241. [DOI] [PMC free article] [PubMed] [Google Scholar]
- 20.Thomas D, Surdin-Kerjan Y. Metabolism of sulfur amino acids in Saccharomyces cerevisiae. Microbiol. Mol. Biol. Rev. 1997;12:503–532. doi: 10.1128/mmbr.61.4.503-532.1997. [DOI] [PMC free article] [PubMed] [Google Scholar]
- 21.Natarajan K, Meyer MR, Jackson BM, Slade D, Roberts C, Hinnebusch AG, Marton MJ. Transcriptional profiling shows that Gcn4p is a master regulator of gene expression during amino acid starvation in yeast. Mol. Cell Biol. 2001;21:4347–4368. doi: 10.1128/MCB.21.13.4347-4368.2001. [DOI] [PMC free article] [PubMed] [Google Scholar]
- 22.Nau GJ, Richmond JF, Schlesinger A, Jennings EG, Lander ES, Young RA. Human macrophage activation programs induced by bacterial pathogens. Proc. Natl Acad. Sci. USA. 2002;99:1503–1508. doi: 10.1073/pnas.022649799. [DOI] [PMC free article] [PubMed] [Google Scholar]
- 23.Jones GE. Cellular signaling in macrophage migration and chemotaxis. J. Leukoc. Biol. 2000;68:593–602. [PubMed] [Google Scholar]
- 24.Grassme H, Jendrossek V, Gulbins E. Molecular mechanisms of bacteria induced apoptosis. Apoptosis. 2001;6:441–445. doi: 10.1023/a:1012485506972. [DOI] [PubMed] [Google Scholar]
- 25.Navarre WW, Zychlinsky A. Pathogen-induced apoptosis of macrophages: a common end for different pathogenic strategies. Cell Microbiol. 2000;2:265–273. doi: 10.1046/j.1462-5822.2000.00056.x. [DOI] [PubMed] [Google Scholar]
- 26.Rojas M, Barrera LF, Puzo G, Garcia LF. Differential induction of apoptosis by virulent Mycobacterium tuberculosis in resistant and susceptible murine macrophages: role of nitric oxide and mycobacterial products. J. Immunol. 1997;159:1352–1361. [PubMed] [Google Scholar]
- 27.Park SG, Ewalt KL, Kima S. Functional expansion of aminoacyl-tRNA synthetases and their interacting factors: new perspectives on housekeepers. Trends Biochem. Sci. 2005;30:569–574. doi: 10.1016/j.tibs.2005.08.004. [DOI] [PubMed] [Google Scholar]
- 28.Harbison CT, Gordon DB, Lee TI, Rinaldi NJ, Macisaac KD, Danford TW, Hannett NM, Tagne JB, Reynolds DB, Yoo J, et al. Transcriptional regulatory code of a eukaryotic genome. Nature. 2004;431:99–104. doi: 10.1038/nature02800. [DOI] [PMC free article] [PubMed] [Google Scholar]
- 29.Bar-Joseph Z, Gerber GK, Lee TI, Rinaldi NJ, Yoo JY, Robert F, Gordon DB, Fraenkel E, Jaakkola TS, Young RA, et al. Computational discovery of gene modules and regulatory networks. Nat. Biotechnol. 2003;21:1337–1342. doi: 10.1038/nbt890. [DOI] [PubMed] [Google Scholar]
- 30.Nasmyth K, Dirick L. The role of SWI4 and SWI6 in the activity of G1 cyclins in yeast. Cell. 1991;66:995–1013. doi: 10.1016/0092-8674(91)90444-4. [DOI] [PubMed] [Google Scholar]
- 31.Leem SH, Chung CN, Sunwoo Y, Araki H. Meiotic role of SWI6 in Saccharomyces cerevisiae. Nucleic Acids Res. 1998;26:3154–3158. doi: 10.1093/nar/26.13.3154. [DOI] [PMC free article] [PubMed] [Google Scholar]
- 32.Ren B, Cam H, Takahashi Y, Volkert T, Terragni J, Young RA, Dynlacht BD. E2F integrates cell cycle progression with DNA repair, replication, and G2/M checkpoints. Genes Dev. 2002;16:245–256. doi: 10.1101/gad.949802. [DOI] [PMC free article] [PubMed] [Google Scholar]
- 33.Ihmels J, Friedlander G, Bergmann S, Sarig O, Ziv Y, Barkai N. Revealing modular organization in the yeast transcriptional network. Nat. Genet. 2002;31:370–377. doi: 10.1038/ng941. [DOI] [PubMed] [Google Scholar]
- 34.Eisen MB, Spellman PT, Brown PO, Botstein D. Cluster analysis and display of genome-wide expression patterns. Proc. Natl Acad. Sci. USA. 1998;95:14863–14868. doi: 10.1073/pnas.95.25.14863. [DOI] [PMC free article] [PubMed] [Google Scholar]
Associated Data
This section collects any data citations, data availability statements, or supplementary materials included in this article.