

Abstract
Charge transfer (CT) in DNA offers a unique approach for the detection of a single-base mismatch in a DNA molecule. While the single-base mismatch would significantly affect the CT in DNA, the kinetic basis for the drastic decrease in the CT efficiency through DNA containing mismatches still remains unclear. Recently, we determined the rate constants of the CT through the fully matched DNA, and we can now estimate the CT rate constant for a certain fully matched sequence. We assumed that further elucidating of the kinetics in mismatched sequences can lead to the discrimination of the DNA single-base mismatch based on the kinetics. In this study, we investigated the detailed kinetics of the CT through DNA containing mismatches and tried to discriminate a mismatch sequence based on the kinetics of the CT in DNA containing a mismatch.
INTRODUCTION
Charge transfer (CT) in DNA has attracted a great deal of attention because of its relevance to DNA oxidative damage, to the development of DNA nanoelectronics, and to biosensors (1–7). In the past decade, the mechanisms of CT in DNA have been investigated by various experimental methods and theoretical calculations (8,9). It has been revealed that the positive charge can migrate over 200 Å through DNA (10,11). It has been reported that this long-range CT in DNA proceeds via hopping mechanisms between Gs, phonon-assisted polaron mechanisms or a conformational gated mechanism (12). Although somewhat controversial, DNA sequences as well as conformational dynamics and local flexibility seem to contribute to the CT through DNA (11,13,14).
The mechanisms of CT in DNA containing a mismatch have also been examined by experimental and theoretical studies. It was suggested by several researchers that once the π stacking of the DNA bases is perturbed by the presence of a mismatch, CT is disrupted, leading to the decreasing the efficiency of CT in DNA. Thus, CT efficiency is likely to be affected by the perturbation of Π stacking caused by the mismatch (15–18). Indeed, Giese and Wessely (15) demonstrated that a guanine-containing mismatch decreases the efficiency of the CT. Bhattacharya and Barton (16) demonstrated that the yields of the long-range oxidative DNA damage through intervening mismatches correlate with the imino proton exchange rates of the mismatch on a millisecond time scale. Previously, Schlientz and Schuster (17) also reported the effects of A/A and T/T mismatches. They reported that the CT efficiency across A/A tandem mismatches is not altered, while the CT efficiency is decreased across the T/T tandem mismatches based on gel electrophoresis experiments.
Previously, the electrochemical detection of a mismatch, especially at a single nucleotide polymorphism (SNP) site, based on CT through the DNA Π stacking was developed. Long-range CT through DNA offers a unique approach for the detection of a single-base mismatch especially in a long DNA molecule, because the presence of a single-base mismatch significantly affects the CT efficiency through DNA (1–3,5,19). Indeed, depending on the charge transport through the Π stack of the DNA duplex, electrochemical detection of the mismatched DNA, which enables SNP discrimination, has been demonstrated (6,20). Kelley et al. (20) developed a strategy for the electrochemical detection of a single-base mismatch based on charge transport through the DNA films. They reported that the signal obtained from the redox-active intercalators bound to DNA modified on gold faces exhibits a remarkable sensitivity to the presence of a mismatched DNA base within the immobilized duplex. Recently, Okamoto et al. (6) developed a new SNP photoelectrochemical detection method that relied on the photoinduced CT in a DNA duplex immobilized on a gold electrode. They designed the DNA probes, which contain anthraquinone as a photosensitizer, and hybridized DNA probe with the target DNA. They reported that the cathodic photocurrent signal markedly changes depending on the presence of the mismatch. Therefore, the CT process might provide the signaling mechanisms for a mismatch or SNP detection.
Recently, we have shown the direct observation of the long-distance CT (21). We have determined the rate constants of the CT through a fully matched DNA which strongly depend on the sequence, and we can now estimate the unique CT rate constant for a certain fully matched sequence and the length of a DNA based on these rate constants (22). We assumed that further elucidating the kinetics through mismatched sequences, especially determining the absolute rate constant of the CT, can lead to the discrimination of a DNA single-base mismatch, because the rate constants of the CT through DNA containing a mismatch will be drastically decreased. That is, it may be possible to transform the information about a DNA mismatched sequence into an absolute value of the rate constants. We now describe the results of the examination for the detailed kinetics of the CT through DNA containing mismatches monitored by transient absorption measurements. Moreover, we extended our kinetic results to the discrimination of the mismatch sequence based on the kinetic modeling of the CT in DNA containing a mismatch.
MATERIALS AND METHODS
DNA Synthesis
The DNA used in this study was synthesized on an Applied Biosystems DNA synthesizer with standard solid-phase techniques and purified on a JASCO HPLC with a reverse-phase C-18 column with an acetonitrile/50 mM ammonium formate gradient. Duplex solutions [100 mM NaCl, 20 mM sodium phosphate (pH 7.0)] were prepared by mixing equimolar amounts of the desired Oligodeoxinucleotide (ODN) complements and gradually annealing with cooling from 80°C to room temperature. DNA conjugated with naphthalimide (NI) or phenothiazine (PTZ) at the 5′ end was synthesized according to a previous procedure (23). ssDNA doubly modified with NI and PTZ at both ends were also synthesized as previously described and characterized by MALDI-TOFF mass spectra. MALDI-TOFF (negative ion): m/z: ssDNA probe: calculated for: 4568.2, found: 4568.6 [M-H]− (24).
Laser flash photolysis experiments
Nanosecond transient absorption measurements were performed as previously described (21,23,25). The third-harmonic oscillation (355 nm, fwhm of 4 ns, 5 mJ/pulse) from a Q-switched Nd:YAG laser (Continuum, CA, USA, Surelight) was used for the excitation light. A xenon flash lamp (Osram, Regensburg, German, XBO-450) was focused into the sample solution as the probe light for the transient absorption measurement. Time profiles of the transient absorption in the UV-visible region were measured with a monochromator (Nikon, G250) equipped with a photomultiplier (Hamamatsu Photonics, Hamamatsu, Japan, R928) and digital oscilloscope (Tektronics, Oregon, USA, TDS-580D). The time profiles of temperature dependence study were measured by a JASCO Peltier temperature controller. The represented profiles were obtained from the accumulation of 32 laser shots. Rate constants were obtained based on three independent experiments.
Melting temperature
The thermal denaturation profile was recorded on a JASCO V-530 spectrometer equipped with a Peltier temperature controller (ETC-505T). The absorbance of the DNA sample [at a strand concentration of 2 μM in 100 mM NaCl, 20 mM sodium phosphate (pH 7.0)] was monitored at 260 nm from 10°C to 70°C with a heating rate of 1°C/min. The Tm value was determined as the maximum in a plot of ΔA260/ΔT versus temperature.
Kinetic modeling
The rate constants of the single-step CT between G bases (kht) were determined from kinetic modeling. Analysis of time profiles based on the multistep hopping mechanism was performed with numerical analysis by using Matlab software (23). Kinetic model of multistep CT process is shown in Figure 3. Charge recombination process can be ignored because the charge separated state persists over hundred microseconds when NI and the nearest G are separated by six or five A–T base pairs (Figures S2, S3 and S4). According to Figure 3, example simultaneous differential equations for DNAs described in Figure 1a are shown as Equation (1).
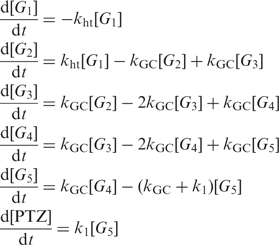 |
1 |
where [Gi] (i = 1 ∼ n) and [PTZ] correspond to the charge population at G and PTZ sites, respectively, ks is the CT rate constant between Gs except for k1 which is the rate constants for the CT from G5 to PTZ (23).
Figure 3.

Kinetic model for GT-1, M1-C, M1-T, M2-C, M2-T, rs1963939-C and rs1963939-T. Rate constants for CT between Gs were depicted. The values of rate constants were summarized in Table 1 and Supplementary Table S1. Rate constants for inter-strand CT from G to G-containing G/T mismatch across the A/T base pair (kGT-1), across the T/A base pair (kGT-2), CT from G-containing G/T mismatch to G across the A/T base pair (kx), across the T/A base pair (ky), CT between G's through GC repeats (kGC), CT from G (nearest to PTZ) to PTZ (k1). Rate constants for intra-strand CT from G-containing mismatch to G (kGT-6) across T/A, and CT from G-containing mismatch to G across T/A (kGT-7), which is described in Supplementary Figure S11. Explanation for other rate constants is summarized in Supplementary Table S1.
Figure 1.

CT in DNA containing a mismatch. (a) Kinetic scheme for charge injection via CT between adenines (As) and subsequent CT between Gs. NI was attached to the A6 sequence at one end of the duplex in order to inject a charge on guanine (G) nearest to NI within the laser duration of 10 ns via CT between As. Following the CT from the G (nearest to NI) to G-containing mismatch (CT through bridge DNA), charge migrates through GC repeat and finally trapped by PTZ to monitor the CT through the DNA by the formation of PTZ radical cation (PTZ•+). The rate constants for CT from the G (nearest to NI) to G-containing mismatch (kht) were determined by the kinetic modeling based on the kinetics of rapid CT between GC repeat as previously reported (23). (b) Sequences of NI- and PTZ-modified DNA used in this study. Assembly-1 (GC-1, GT-1, GA-1, GT-4, AA-1, TT-1 and AC-1) was based on the GAC/CTG sequence (GC-1), substituted by a G mismatch (GT-1, GA-1, GT-4) or A/A, T/T or A/C mismatch (AA-1, TT-1 and AC-1). Assembly-2 (GC-2, GT-2, GA-2 and GT-5) was based on the GTC/CAG sequence (GC-2), substituted by a G mismatch (GC-2, GT-2, GA-2 and GT-5). Assembly-3 (GC-3, GT-3, GA-3, AA-3 and TT-3) was based on the GAAG/CTTC sequence (GC-3), substituted by a G mismatch (GT-3, GA-3) and A/A or T/T mismatch (AA-3 and TT-3), respectively.
RESULTS AND DISCUSSION
Sequence design
In order to elucidate the kinetics of the CT through the DNA containing mismatches, time-resolved transient absorption measurements were carried out. A NI photosensitizer was attached to the adenine [A: oxidation potential Eox = 1.94 eV versus normal hydrogen electrode (NHE)] (26), consecutive sequence at one end of the duplex in order to inject a charge on the nearest guanine (G) [G: Eox = 1.47eV versus NHE] (26) to NI within a laser duration of 10 ns via charge hopping between the adenines, producing a long-lived charge-separated state (21). The quantum yields estimated for the sequences in this study were ∼ 2% (22,27). PTZ was attached at the other end of the DNA duplex as a charge-trap to monitor the subsequent charge hopping between the Gs. After charge hopping between the Gs through the DNA, the charge on G can be accessible to the PTZ and be trapped at the PTZ [Eox = 0.76 V versus NHE] (28), which has an oxidation potential lower than that of G. Therefore, the formation of the PTZ radical cation (PTZ•+) with a peak around 520 nm can be implicated as the CT process between the Gs (Figure 1 and Supplementary Figure S1) (21). The DNA sequences used in this study are given in Figure 1. The 12-or 13-base pair assembly contains the following three parts: the charge injection part (NI and consecutive adenine sequence), the charge detection part (GC repeats and PTZ) and bridge parts with two Gs separated by one or two bases. Fourteen assemblies were prepared. They were classified as three groups by the sequence of the bridge parts; i.e. assembly-1 (bridge parts; A/T), assembly-2 (T/A) and assembly-3 (AA/TT). Mismatches were introduced into the bridge parts as a complemental base of the G (G-containing mismatches) or several intervening bases between the two Gs (A/A, T/T or A/C mismatches) (Figure 1).
The thermostability of these assemblies was characterized by their melting behavior (Table 1). Because the Tm values at the strand concentration of 2 μM for some mismatches are slightly <40°C, a 25 times higher strand concentration was used for the transient absorption measurements, i.e. 50 μM-strand concentration of DNAs to make sure that more than 90% of the strands would be in the duplex form below 40°C. For each mismatched assembly, as well as for the fully matched sequence, the time-resolved transient absorption measurements were carried out.
Table 1.
Melting temperatures of duplexes (Tm), rate constants (kht) and apparent activation energy (Ea) for CT in fully matched and mismatched DNAs
| Assembly | Tm [°C]a | kht [s−1]b | Ea [eV]c | |
|---|---|---|---|---|
| GC-1 | 55.4 | (1.2 ± 0.2) × 106 | (kGAC) | 0.30 ± 0.02 |
| GT-1 | 41.2 | (7.1 ± 0.1) × 104 | (kGT1) | 0.37 ± 0.03 |
| GA-1 | 39.2 | (9.2 ± 0.1) × 104 | (kGA1) | 0.33 ± 0.01 |
| AA-1 | 44.2 | (9.7 ± 0.2) × 105 | (kAA1) | 0.30 ± 0.01 |
| TT-1 | 42.0 | (1.6 ± 0.1) × 105 | (kTT1) | 0.44 ± 0.01 |
| AC-1 | 44.6 | (1.3 ± 0.1) × 105 | (kAC1) | 0.28 ± 0.02 |
| GC-2 | 54.1 | (1.5 ± 0.1) × 106 | (kGTC) | 0.25 ± 0.01 |
| GT-2 | 44.7 | (1.9 ± 0.1) × 105 | (kGT2) | 0.33 ± 0.01 |
| GA-2 | 40.7 | (1.6 ± 0.1) × 105 | (kGA2) | 0.34 ± 0.01 |
| GC-3 | 52.4 | (6.2 ± 0.2) × 104 | (kGAAG) | 0.38 ± 0.03 |
| GT-3 | 41.4 | (1.0 ± 0.2) × 104 | (kGT3) | 0.47 ± 0.04 |
| GA-3 | 45.3 | (9.5 ± 0.2) × 103 | (kGA3) | 0.54 ± 0.02 |
| AA-3 | 36.9 | (1.3 ± 0.1) × 105 | (kAA3) | 0.37 ± 0.01 |
| TT-3 | 38.4 | (2.7 ± 0.2) × 104 | (kTT3) | 0.56 ± 0.02 |
| GT-4 | 45.7 | (5.2 ± 0.4) × 106 | (kx) | 0.30 ± 0.02 |
| GT-5 | 46.5 | (6.9 ± 0.3) × 106 | (ky) | 0.28 ± 0.01 |
aUV melting measurement was carried out in 100 mM NaCl, 20 mM sodium phosphate (pH 7.0) at a strand concentration of 2 μM.
bRate constants were obtained from the laser flash experiments of Ar-saturated solution containing 100 mM NaCl, 20 mM sodium phosphate (pH 7.0) at a strand concentration of 50 μM DNA at 20°C. Rate constants used for kinetic modeling are listed in Supplementary Table S1. Rate constants were obtained based on three independent experiments.
cCalculated according to Equation (2) based on the data that are available in Supplementary Figures S8, S9 and S10.
CT through G-containing mismatches
We first examined the effects of the G-containing mismatches on the CT. Excitation of the NI site with a 355-nm laser results in the formation of the NI radical anion (NI•−) with a peak at 400 nm immediately after the laser flash which remained almost constant on the time scale of the present experiment (≈100 μs) due to the slow charge recombination rate between NI•− and G•+ across six A–T base pairs (Supplementary Figures S2, S3 and S4) (22). Absorptions at 520 nm assigned to PTZ•+ then emerged on the time scale of several microseconds for the fully matched sequences, GC-1 and GC-2, and on the time scale of several dozen microseconds for GC-3 (Figure 2), which was in good agreement with the results of the kinetic modeling using the CT values for the CT between the fully matched Gs reported in our previous studies (Supplementary Table S1) (22,23). It is seen that the kinetics of the CT between Gs, that is, the CT from the G to G-containing mismatch, is slowed by the introduction of a G/T or G/A mismatch (Figure 2). The detailed kinetics of the CT between Gs was obtained using the Matlab software as previously described (23). The represented profiles were obtained from the accumulation of 32 laser shots (Figure 2). The rate constants were obtained on the basis of three independent experiments and we determined the errors from these experiments. The kinetic modeling as shown in Figures 1 and 3 was used to determine the rate constant for the CT. Employing the kinetic modeling based on the assumption that the back CT from the mismatched G to G through the intervening A/T base pairs is slow compared to the rapid CT between the GC repeats, we determined the rate constants of the CT from G to the G-containing mismatch. As for the rate constants for the GC repeats, we utilized the previously reported value (k = 2.2 × 10⁸/s) (23). The rate constants of the CT from G to the G-containing mismatch are listed in Table 1 and represented in Figure 4 as bar graphs.
Figure 2.

CT through DNAs of guanine-containing mismatches and A/A, T/T or A/C mismatches. Time profiles of the transient absorption of PTZ•+ at 520 nm during the 355 nm-laser flash ptotolysis of Ar-saturated aqueous solution containing 100 mM NaCl, 20 mM sodium phosphate (pH 7.0) at a strand concentration of 50 μM at 20°C. The represented profiles were obtained from the accumulation of 32 laser shots.
Figure 4.

Bar graphs showing rate constants for CT in DNA containing a mismatch (kht). Rate constants of assembly-1 (a), assembly-2 (b) and assembly-3 (c), respectively. kht for fully matched sequences, G-containing mismatch and A/A, T/T or A/C are shown in gray, orange and green, respectively.
We compared the CT rate constants at 20°C between Gs (kht) containing the mismatched sequences for the G/C fully matched sequences (Table 1, Figure 1), and as is evident in Table 1 and Figure 2, the kht is slowed by the G/T or G/A mismatch (Figure 4, shown in orange). In the case of the G/T mismatches, the kht for GT-1 (containing G/T mismatch) is 17-times slower than that for GC-1 (fully matched sequence), and the kht for GT-2 is 8-fold slower than that for GC-2 (Table 1). It is noteworthy that a 2.7-fold difference in kht between GT-1 and GT-2 was observed, which is caused by the inversion of the A/T base pair to the T/A base pair adjacent to the G/T mismatch. In the case of the G/A mismatches, the kht for GA-1 (containing a G/A mismatch) is 13-times slower than that for GC-1, and the kht for GA-2 is 9-fold slower than that for GC-2. Similar to the G/T mismatch, a change in the single adjacent base pair results in a 1.7-fold difference in kht for the G/A mismatch. Although the rate constants between GT and GA assemblies are quite similar, the G/A and G/T mismatches are distinguishable by the rate constant of the CT (kht) from the fully matched assembly. Furthermore, the CT from the G-containing mismatch to the fully matched G across the A/T or T/A sequence was also examined (GT-4 and GT-5). Interestingly, the rate constants of CT from the G-containing mismatch to a fully matched G is 4- to 5-fold faster than the CT in the fully matched sequences (GC-1 and GC-2) (Table 1). Comparing the GT-4 and GT-5, a 1.3-fold difference in kht was observed, resulting from a change in the single adjacent base pair, consistent with the CT from the fully matched G to G-containing mismatch. Taken together, these results indicate that the CT from fully matched G to the G-containing mismatch is slower than that for fully matched assembly, while the CT from the G-containing mismatch to fully matched G is faster than that for fully matched one.
CT through A–A or T–T mismatches
We also examined the sequences with the AA, TT or AC mismatch. It is also seen that the kinetics of the CT between Gs are slowed by the introduction of the T/T or A/C mismatch (Figure 2). Interestingly, in the case of the A/A mismatched sequences, the kinetics of the CT between the Gs are not slowed (Figures 2 and 4, shown in green color). In the case of the A/C mismatch, the kht for AC-1 (containing A/C mismatch) is 9-times slower than that for GC-1 (fully matched sequence). In the case of the T/T mismatches, the kht for TT-1 (containing a T/T mismatch) is 8-fold slower than that for GC-1 (fully matched sequence), and the kht for TT-3 is 1/2 that for GC-3. On the other hand, in the case of the A/A mismatches, the kht for AA-1 (containing an A/A mismatch) had a similar value to that for GC-1 (fully matched sequence), and the kht for AA-3 is 2-fold faster than that for GC-3. Above all, the kinetics of CT across the T/T or A/C mismatches are slower than that for fully matched assembly, while the kinetics of CT across A/A mismatch is faster than that for fully matched one. As mentioned above, the rate constants for the CT through the DNA containing a mismatch are distinguishable for the various sequence patterns.
Mechanisms of the CT through DNA containing mismatches
Focusing on the relationships between the rate constants of the CT through the DNA G-containing mismatches and Tm values, our results for the G-containing mismatches suggest that the decreasing Tm seems to produce the decreasing rate constants of kht (Table 1). However, the degree of the decreasing Tm does not necessarily correspond to the degree of the kht decreasing for the A/A mismatches and to the increase in kht for the mismatched G to fully matched G. Thus, the CT through a mismatch cannot be solely explained by the Tm values or the thermal stability of the whole duplex.
We observed that the CT kinetics from the fully matched G to mismatched G are slowed in the time range of microseconds (Figure 4, shown in orange). This might reflect the local conformational dynamics in the microsecond time range, while a G-containing mismatch may transiently form a wobble pair and become stabilized by hydrogen bonding. We observed that the A/A mismatches are comparable (AA-1) or increase (AA-3) the CT rate, while the T/T mismatches suppress the CT (Figure 4, shown in green). Previously, Lewis et al. suggested that the CT between the Gs depends on the intervening bridge base between the Gs, and the lower oxidation potential bases produce a small tunneling energy gap and accelerate the CT. The A/A mismatches, which have a lower oxidation potential and a higher stacking ability than thymine (T) [T: oxidation potential Eox = 2.1 eV versus NHE] (26), producing smaller tunneling energy gaps, may lead to the acceleration of the CT. On the other hand, the T/T mismatch, which has a higher oxidation potential and a lower stacking ability producing higher tunneling energy gaps than A, may lead to the suppression of the CT (16,26,29).
In order to gain some insight into the effect of the DNA dynamics, the time-resolved transient absorption measurements were carried out at various temperatures. The formation of PTZ•+ was monitored at 520 nm between 10°C and 40°C for each assembly (Supplementary Figures S5, S6 and S7). The represented profiles were obtained from the accumulation of 32 laser shots. The increased temperature produced an increased attainment of the charge on the PTZ, as expected according to the electron-transfer theory as shown in Supplementary Figures S5, S6 and S7. The activation energy was obtained using the following semiclassical Marcus equation in which A is a pre-exponential factor (30).
| 2 |
A plot of ln(khtT0.5) versus T−1 provides the Ea value for the CT (Supplementary Figures S8, S9 and S10) (30). The errors were determined from the margin errors of the linear regression. The Ea values vary among the mismatched sequences as well as the fully matched sequences. The Ea values obtained for the G mismatched sequences were higher than that for the fully matched sequences. The Ea values obtained for the A/A or A/C mismatched sequences are almost the same as that for the fully matched sequences. In the case of the T/T mismatches (TT-1 and TT-3), the Ea values are 1.5-fold higher than that of the GC fully matched sequence (GC-1 and GC-3, respectively). Thus, the Ea values for the G-mismatched sequences and T/T mismatches are relatively higher than that for the G/C fully matched sequences. In these cases, the rate constants are slower and the activation energies are higher than that for the fully matched sequence. These results may reflect the requirement of the local DNA base motions for becoming a CT-active conformation during the CT due to the local distortion by the mismatched formation (31,32). On the other hand, the rate constants for the A/A mismatch are comparable to or greater than that for the fully matched sequences, and the Ea values are similar to that of the fully matched sequences. These results may suggest not only a lower tunneling energy gap but also the ease of formation of the CT-active conformations causes an efficient CT in an A/A mismatch sequence. Moreover, the Ea values for the CT from the mismatched G to fully matched G, GT-4 and GT-5 were smaller than that for the CT from the fully matched G to mismatched G or were comparable to that of the fully matched sequences, which might suggest that the formation of a CT-active conformation is more favorable when a positive charge exists on the mismatched G. Therefore, these results further support the importance of the local conformational base pair motion for the CT through DNA, as previously described by O’Neill et al. (33), Valis et al. (34), and us (23,24).
Kinetic discrimination of mismatch sequence
For the kinetic discrimination of a mismatch sequence, the sequences related to a SNP were chosen as a model system. We investigated whether the information about the SNP sequence is transformed into the CT kinetics in DNA. The sequences used in this study are shown in Figure 5. DNAs modified with NI and PTZ at the 5′ end which have an A consecutive sequence and a part of the coding sequences for the nuclear LIM interactor-interacting factor 2 and DNA-binding domain T-box 22, carrying SNP rs12392145 (M1) and rs1965744 (M2) C to T substitution, were employed in this study. These SNPs were chosen as a model for the kinetic SNP discrimination because the rate constants determined in this study were able to adapt to these sequences. First, the time-resolved transient absorption measurement and kinetic modeling of M1-C and M1-T were carried out. Of special interest, the decreased kinetics of the CT were observed for the M1-T containing mismatch, in agreement with the kinetic modeling by the rate constants for the CT. We then examined M2-C and M2-T using the transient absorption method and kinetic modeling. Interestingly, the CT kinetics for the M2-T containing mismatch sequence are increased, consistent with the kinetic modeling by the rate constants. These results suggest that the CT kinetics are sensitive to the position of the mismatch incorporation.
Figure 5.

Discrimination of mismatch DNA related to SNP by CT kinetics in DNAs. Bold letters indicate the SNP sequences. Adenine consecutive sequence is attached to SNP sequence for charge injection. (a, b) Time profiles of the transient absorption of PTZ•+ at 520 nm during the 355 nm-laser flash photolysis of Ar-saturated aqueous solution containing 100 mM NaCl, 20 mM sodium phosphate (pH 7.0) at a strand concentration of 50 μM at 20°C of M1-C and M2-C (red), M1-T and M2-T (black), respectively. The smooth curves superimposed on the curves (green) are the fit derived from the kinetic model using kht values depicted in Table 1 and Supplementary Table S1. The represented profiles were obtained from the accumulation of 32 laser shots.
To further support the kinetic SNP discrimination, we prepared ssDNA doubly modified with NI and PTZ at both ends which enables investigation of the CT without direct modification of the target strand (Figure 6). We performed the time-resolved transient absorption measurements with the 13-mer ssDNA probe, 5′-NI-AAATACAGTCTCT-PTZ-3′. The DNA sequence was designed on the basis of the antisense sequence of the COL25A1, which is a brain-specific membrane-bound collagen related to Alzheimer's disease, carrying the SNP C to T substitution (refSNP ID; rs1963939, allele position 387) (35). We assumed that the kinetics of the CT through the wild-type or target SNP sequence is predictable by kinetic modeling depending on the rate constants as described above. We first tested the rs1963939-C sequence. The time-resolved transient absorption measurement after hybridization with the strand 3′-TTTATGTCAGAGA-5′ was carried out. The experiment was carried out at 20°C, and we modeled the kinetics of the CT through the rs1963939-C sequence. Kinetic modeling showed that the PTZ•+ approached the maximum value within a time of <10 μs (Figure 6, green curve under the red data). In agreement with the kinetic modeling, we observed the maximum PTZ•+ formation within a time of <10 μs. We then tested rs1963939-T. We examined the transient absorption measurement using the target sequence, 3′-TTTATGTTAGAGA-5′, in which a C base replaced a T base of a short COL25A1 fragment, corresponding to a C387T SNP. In the case of the rs1963939-T sequences, we also first modeled the kinetics of the CT through the SNP sequence. Based on the kinetic modeling, the approaching time of about 40 μs was estimated as represented by the green curve under the black data. We measured the PTZ•+ with an approaching time of ∼40 μs from the transient absorption measurement. The result is slightly different than the expected values from the kinetic modeling using the rate constants obtained in this study and those reported in the literature (22). This is probably because the CT through the DNA containing mismatches as well as the fully matched DNA is affected by the sequences or the motions of both neighboring base pairs of the mismatch as mentioned above. These results suggest that the kinetic discrimination using the ssDNA doubly modified probe is possible, though determining the kinetic parameters of the mismatch in other combinations of neighboring base pairs is required for further precision.
Figure 6.

Strategy and results of kinetic SNP typing using ssDNA probe. (a) Schematic representation of ssDNA probe. (b) Time profiles of the transient absorption of PTZ•+ at 520 nm during the 355 nm-laser flash photolysis of Ar-saturated aqueous solution containing 100 mM NaCl, 20 mM sodium phosphate (pH 7.0) at a strand concentration of 50 μM at 20°C. The smooth curves superimposed on the curves are the fit derived from the kinetic model using kht values depicted in Table 1 and Supplementary Table S1. The represented profiles were obtained from the accumulation of 64 laser shots.
In conclusion, we examined the kinetics of the CT through DNA containing a mismatch. The kinetics of CT from fully matched G to the G-containing mismatch and the CT across the T/T or A/C mismatches are slower than those for fully matched assembly, while the kinetics of CT from the G-containing mismatch to fully matched G and the CT across A/A mismatch are faster than those for fully matched one. Moreover, we demonstrated that kinetic modeling, utilizing the absolute rate constants for the CT through DNA containing mismatches, allows the discrimination of the mismatch sequences.
Because our previous studies reported the direct observation of a long-range CT over a 140-Å DNA, our kinetic method could be applied to a long DNA molecule containing a SNP (21,23). For further improvement of the detection methods and various sequence applicabilities, optimizations of our system are required. Although our method depends on the CT between the Gs, using the methoxybenzodeazaadenine-modified ssDNA probe as previously described by Okamoto et al. (6) may realize additional improvements in the kinetic SNP typing for DNA with A/T rich sequences. Moreover, the improvement in the quantum yield of the charge injection and the kinetic monitoring of the CT with a fluorescent probe may open the door to future kinetic SNP genotyping (24).
SUPPLEMENTARY DATA
Supplementary Data are available at NAR Online.
ACKNOWLEDGEMENTS
This work has been partly supported by a Grant-in-Aid for Scientific Research (Project 17105005 and others) from the Ministry of Education, Culture, Sports, Science and Technology (MEXT) of Japanese Government. The authors would like to thank Prof Nakatani of SANKEN for the MALDI mass measurement. Y.O. expresses her special thanks for the JSPS and the Global COE (center of excellence) Program ‘Global Education and Research Center for Bio-Environmental Chemistry’ of Osaka University.
Conflict of interest statement. None declared.
REFERENCES
- 1.Giese B. Long-distance charge transport in DNA: the hopping mechanism. Acc. Chem. Res. 2000;33:631–636. doi: 10.1021/ar990040b. [DOI] [PubMed] [Google Scholar]
- 2.Schuster GB. Long-range charge transfer in DNA: transient structural distortions control the distance dependence. Acc. Chem. Res. 2000;33:253–260. doi: 10.1021/ar980059z. [DOI] [PubMed] [Google Scholar]
- 3.Delaney S, Barton JK. Long-range DNA charge transport. J. Org. Chem. 2003;68:6475–6483. doi: 10.1021/jo030095y. [DOI] [PubMed] [Google Scholar]
- 4.Lewis FD, Zhu H, Daublain P, Fiebig T, Raytchev M, Wang Q, Shafirovich V. Crossover from superexchange to hopping as the mechanism for photoinduced charge transfer in DNA hairpin conjugates. J. Am. Chem. Soc. 2006;128:791–800. doi: 10.1021/ja0540831. [DOI] [PubMed] [Google Scholar]
- 5.Shafirovich V, Dourandin A, Geacintov NE. Proton-coupled electron-transfer reactions at a distance in DNA duplexes: kinetic deuterium isotope effect. J. Phys. Chem. B. 2001;105:8431–8435. [Google Scholar]
- 6.Okamoto A, Kamei T, Saito I. DNA hole transport on an electrode: application to effective photoelectrochemical SNP typing. J. Am. Chem. Soc. 2006;128:658–662. doi: 10.1021/ja057040t. [DOI] [PubMed] [Google Scholar]
- 7.Leung EKY, Sen D. Electron hole flow patterns through the RNA-Cleaving 8-17 Deoxyribozyme yield unusual information about its structure and folding. Chem. Biol. 2007;14:41–51. doi: 10.1016/j.chembiol.2006.11.006. [DOI] [PubMed] [Google Scholar]
- 8.Bixon M, Giese B, Wessely S, Langenbacher T, Michel-Beyerle ME, Jortner J. Long-range charge hopping in DNA. Proc. Natl Acad. Sci. USA. 1999;96:11713–11716. doi: 10.1073/pnas.96.21.11713. [DOI] [PMC free article] [PubMed] [Google Scholar]
- 9.Bixon M, Jortner J. Charge transport in DNA via thermally induced hopping. J. Am. Chem. Soc. 2001;123:12556–12567. doi: 10.1021/ja010018p. [DOI] [PubMed] [Google Scholar]
- 10.Henderson PT, Jones D, Hampikian G, Kan Y, Schuster GB. Long-distance charge transport in duplex DNA: the phonon-assisted polaron-like hopping mechanism. Proc. Natl Acad. Sci. USA. 1999;96:8353–8358. doi: 10.1073/pnas.96.15.8353. [DOI] [PMC free article] [PubMed] [Google Scholar]
- 11.Nunez ME, Hall DB, Barton JK. Long-range oxidative damage to DNA: effects of distance and sequence. Chem. Biol. 1999;6:85–97. doi: 10.1016/S1074-5521(99)80005-2. [DOI] [PubMed] [Google Scholar]
- 12.Liu C-S, Hernandez R, Schuster GB. Mechanism for radical cation transport in Duplex DNA Oligonucleotides. J. Am. Chem. Soc. 2004;126:2877–2884. doi: 10.1021/ja0378254. [DOI] [PubMed] [Google Scholar]
- 13.O’Neill MA, Barton JK. DNA charge transport: conformationally gated hopping through stacked domains. J. Am. Chem. Soc. 2004;126:11471–11483. doi: 10.1021/ja048956n. [DOI] [PubMed] [Google Scholar]
- 14.O’Neill MA, Barton JK. DNA-Mediated charge transport requires conformational motion of the DNA bases: elimination of charge transport in rigid glasses at 77 K. J. Am. Chem. Soc. 2004;126:13234–13235. doi: 10.1021/ja0455897. [DOI] [PubMed] [Google Scholar]
- 15.Giese B, Wessely S. The influence of mismatches on long-distance charge transport through DNA. Angew. Chem. Int. Ed. 2000;39:3490–3491. doi: 10.1002/1521-3773(20001002)39:19<3490::aid-anie3490>3.0.co;2-s. [DOI] [PubMed] [Google Scholar]
- 16.Bhattacharya PK, Barton JK. Influence of intervening mismatches on long-range guanine oxidation in DNA duplexes. J. Am. Chem. Soc. 2001;123:8649–8656. doi: 10.1021/ja010996t. [DOI] [PubMed] [Google Scholar]
- 17.Schlientz NW, Schuster GB. Long-distance radical cation migration in duplex DNA: the effect of contiguous A.A and T.T mismatches on efficiency and mechanism. J. Am. Chem. Soc. 2003;125:15732–15733. doi: 10.1021/ja0382359. [DOI] [PubMed] [Google Scholar]
- 18.Okada A, Yokojima S, Kurita N, Sengoku Y, Tanaka S. Charge transfer in duplex DNA containing mismatch. Theochem. 2003;630:283–290. [Google Scholar]
- 19.Lewis FD, Liu J, Zuo X, Hayes RT, Wasielewski MR. Dynamics and energetics of single-step hole transport in DNA hairpins. J. Am. Chem. Soc. 2003;125:4850–4861. doi: 10.1021/ja029390a. [DOI] [PubMed] [Google Scholar]
- 20.Kelley SO, Boon EM, Barton JK, Jackson NM, Hill MG. Single-base mismatch detection based on charge transduction through DNA. Nucleic Acids Res. 1999;27:4830–4837. doi: 10.1093/nar/27.24.4830. [DOI] [PMC free article] [PubMed] [Google Scholar]
- 21.Takada T, Kawai K, Fujitsuka M, Majima T. Direct observation of hole transfer through double-helical DNA over 100 Å. Proc. Natl Acad. Sci. USA. 2004;101:14002–14006. doi: 10.1073/pnas.0402756101. [DOI] [PMC free article] [PubMed] [Google Scholar]
- 22.Takada T, Kawai K, Fujitsuka M, Majima T. Contributions of the distance-dependent reorganization energy and proton-transfer to the hole-transfer process in DNA. Chem. Eur. J. 2005;11:3835–3842. doi: 10.1002/chem.200500052. [DOI] [PubMed] [Google Scholar]
- 23.Osakada Y, Kawai K, Fujitsuka M, Majima T. Charge transfer through DNA nanoscaled assembly programmable with DNA building blocks. Proc. Natl Acad. Sci. USA. 2006;103:18072–18076. doi: 10.1073/pnas.0607148103. [DOI] [PMC free article] [PubMed] [Google Scholar]
- 24.Kawai K, Osakada Y, Sugimoto A, Fujitsuka M, Majima T. Hole transfer rates in A-form DNA/2′-OMeRNA hybrid. Chem. Eur. J. 2007;13:2386–2391. doi: 10.1002/chem.200601210. [DOI] [PubMed] [Google Scholar]
- 25.Kawai K, Osakada Y, Fujitsuka M, Majima T. Consecutive adenine sequences are potential targets in photosensitized DNA damage. Chem. Biol. 2005;12:1049–1054. doi: 10.1016/j.chembiol.2005.07.005. [DOI] [PubMed] [Google Scholar]
- 26.Seidel CAM, Schulz A, Sauer MHM. Nucleobase-specific quenching of fluorescent dyes. 1. Nucleobase one-electron redox potentials and their correlation with static and dynamic quenching efficiencies. J. Phys. Chem. 1996;100:5541–5553. [Google Scholar]
- 27.Kawai K, Osakada Y, Fujitsuka M, Majima T. Mechanism of charge separation in DNA by hole transfer through consecutive adenines. Chem. Eur. J. 2008;14:3721–3726. doi: 10.1002/chem.200701835. [DOI] [PubMed] [Google Scholar]
- 28.Takada T, Kawai K, Tojo S, Majima T. Hole transfer in DNA: DNA as a scaffold for hole transfer between two organic molecules. Tetrahedron Lett. 2003;44:3851–3854. [Google Scholar]
- 29.Lewis FD, Liu J, Weigel W, Rettig W, Kurnikov IV, Beratan DN. Donor-bridge-acceptor energetics determine the distance dependence of electron tunneling in DNA. Proc. Natl Acad. Sci. USA. 2002;99:12536–12541. doi: 10.1073/pnas.192432899. [DOI] [PMC free article] [PubMed] [Google Scholar]
- 30.Davis WB, Hess S, Naydenova I, Haselsberger R, Ogrodnik A, Newton MD, Michel-Beyerle M.-E. Distance-dependent activation energies for hole injection from protonated 9-amino-6-chloro-2-methoxyacridine into duplex DNA. J. Am. Chem. Soc. 2002;124:2422–2423. doi: 10.1021/ja017304l. [DOI] [PubMed] [Google Scholar]
- 31.Brown T, Kennard O, Kneale G, Rabinovich D. High-resolution structure of a DNA helix containing mismatched base pairs. Nature. 1985;315:604–606. doi: 10.1038/315604a0. [DOI] [PubMed] [Google Scholar]
- 32.Brown T, Leonard GA, Booth ED, Chambers J. Crystal structure and stability of a DNA duplex containing A(anti).G(syn) base-pairs. J. Mol. Biol. 1989;207:455–457. doi: 10.1016/0022-2836(89)90268-4. [DOI] [PubMed] [Google Scholar]
- 33.O’Neill MA, Becker H.-C, Wan C, Barton JK, Zewail AH. Ultrafast dynamics in DNA-mediated electron transfer: base gating and the role of temperature. Angew. Chem. Int. Ed. 2003;42:5896–5900. doi: 10.1002/anie.200352831. [DOI] [PubMed] [Google Scholar]
- 34.Valis L, Wang Q, Raytchev M, Buchvarov I, Wagenknecht H.-A, Fiebig T. Base pair motions control the rates and distance dependencies of reductive and oxidative DNA charge transfer. Proc. Natl Acad. Sci. USA. 2006;103:10192–10195. doi: 10.1073/pnas.0600957103. [DOI] [PMC free article] [PubMed] [Google Scholar]
- 35.Osada Y, Hashimoto T, Nishimura A, Matsuo Y, Wakabayashi T, Iwatsubo T. CLAC binds to amyloid beta peptides through the positively charged amino acid cluster within the collagenous domain 1 and inhibits formation of amyloid fibrils. J. Biol. Chem. 2005;280:8596–8605. doi: 10.1074/jbc.M413340200. [DOI] [PubMed] [Google Scholar]
Associated Data
This section collects any data citations, data availability statements, or supplementary materials included in this article.