

Abstract
Activated B cells reshape their primary antibody repertoire after antigen encounter by two molecular mechanisms: somatic hypermutation (SHM) and class switch recombination (CSR). SHM and CSR are initiated by activation-induced cytidine deaminase (AID) through the deamination of cytosine residues on the immunoglobulin loci, which leads to the generation of DNA mutations or double-strand break intermediates. As a bystander effect, endogenous AID levels can also promote the generation of chromosome translocations, suggesting that the fine tuning of AID expression may be critical to restrict B cell lymphomagenesis. To determine whether microRNAs (miRNAs) play a role in the regulation of AID expression, we performed a functional screening of an miRNA library and identified miRNAs that regulate CSR. One such miRNA, miR-181b, impairs CSR when expressed in activated B cells, and results in the down-regulation of AID mRNA and protein levels. We found that the AID 3′ untranslated region contains multiple putative binding sequences for miR-181b and that these sequences can be directly targeted by miR-181b. Overall, our results provide evidence for a new regulatory mechanism that restricts AID activity and can therefore be relevant to prevent B cell malignant transformation.
Antibody diversification is achieved through somatic remodelling of Ig genes at two distinct stages of B cell development. The first one is coupled to B cell differentiation in the bone marrow and takes place by V(D)J recombination, a site-specific recombination reaction that is also responsible for antigen receptor diversification in T cells. In contrast to T cells, mature B cells that have been stimulated by antigen can undergo a secondary antibody diversification in so-called germinal centers, which entails two distinct molecular mechanisms: somatic hypermutation (SHM) and class switch recombination (CSR). SHM introduces nucleotide changes in the antigen recognition (i.e., variable region) of the Ig genes, thereby allowing the generation of antibodies with a higher affinity for their cognate antigen. CSR is a region-specific recombination reaction that replaces the primary μ constant (Cμ) region by a downstream constant region (Cγ, Cε, or Cα) that will endow the antibody molecule with new effector properties for antigen removal (1). Both CSR and SHM are triggered by the activity of one enzyme, activation-induced cytidine deaminase (AID) (2, 3). AID initiates CSR and SHM by deaminating cytosine residues on the switch or variable region of the Ig genes, respectively (4). AID-induced cytosine deamination results in the generation of U:G mismatches on Ig DNA that can be processed by uracil-N-glycosylase, or of mismatch repair enzymes to promote the fixation of a mutation (SHM) or the generation of a DNA double-strand break and a subsequent recombination reaction (CSR; for review see reference 5).
Most of the lymphomas diagnosed in the western world arise from mature B cells and are characterized by the presence of chromosome translocations that involve one of the Ig loci and a protooncogene (6). AID has been shown to be required for the generation in vivo of c-myc/IgH lymphomagenic translocations, analogous to those found in human Burkitt lymphomas (7, 8). AID promotes c-myc/IgH translocations in a deaminase- and uracil-N-glycosylase–dependent fashion, which indicates that CSR and c-myc/IgH chromosome translocations are initiated through a common mechanism (9). In addition, AID can mutate a significant number of genes expressed in germinal center B cells, including the protooncogenes Bcl-6, c-myc, and Pim1 (10, 11). Moreover, AID lymphomagenic potential has been revealed in IL-6– (7), myc- (12), Bcl6- (13), and pristane-induced (14) B cell neoplasias.
Several mechanisms have been proposed to regulate AID expression and function and, expectedly, to reduce the risk of unwanted DNA damage. These mechanisms include the restriction of AID activity or of mutagenic resolution mostly to Ig DNA sequences, limiting AID nuclear concentration by regulation of its subcellular localization and phosphorylation (for review see reference 15). Regarding the regulation of AID expression, although it is mostly restricted to activated B cells, recent findings have shown that low expression levels can be detected in immature B cells, in response to some viral infections, and occasionally in non–B cells, at least in certain inflammation-associated neoplasic situations (for review see reference 16).
MicroRNAs (miRNAs) are small noncoding RNA molecules that can regulate gene expression by affecting either the stability or the translation efficiency of their target mRNAs. Gene expression regulation by miRNAs has been involved in several processes that include development and differentiation, cell proliferation, cell death, and neoplasic transformation (17). In addition, miRNA expression analysis of different neoplasias, particularly lymphomas, has revealed specific profiles associated with particular malignancies (18, 19). Recently, miRNAs have been shown to regulate some aspects of normal B cell differentiation and function. miR-181a promotes B cell differentiation in the bone marrow, miR-155 is involved in the generation of germinal center and plasma B cells, and miR-150 controls B cell development and response through the regulation of c-Myb transcription factor (for review see reference 20). However, the role of miRNAs in the regulation of AID-dependent reactions in activated B cells has not been specifically addressed. In this work, we have screened for miRNAs involved in the regulation of CSR and have identified miR-181b, which regulates AID expression posttransciptionally in B cells.
RESULTS AND DISCUSSION
miR-181b expression impairs the CSR reaction
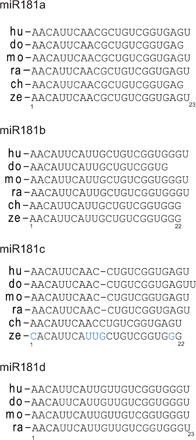
To determine whether specific miRNAs are involved in the regulation of the CSR reaction, we performed a functional screen of an miRNA expression library containing 150 clones. miRNA sequences, including their genomic context, were cloned into a retroviral vector harboring a GFP cassette for tracking purposes (Fig. 1 A). Independent miRNAs were retrovirally transduced into primary B cells from wild-type mouse spleens, and CSR efficiency to IgG1 isotype in the presence of LPS and IL-4 was evaluated (Fig. S1, available at http://www.jem.org/cgi/content/full/jem.20080579/DC1). We found that expression of miR-181b resulted in the most profound decrease of the CSR rate as compared with B cells transduced with an empty control vector (55 ± 15%; Fig. S1, B and C). This effect was observed after 2 d of miR-181b expression but became more apparent at later time points (Fig. 1 D). Both in the mouse and human genomes, two isoforms of miR-181b can be expressed from two different loci. These isoforms are referred to as miR-181b-1 and miR-181b-2 and are identical in their mature forms, but their genomic contexts are slightly different. We found that transduction of either miR-181b-1 or miR-181b-2 precursors resulted in a similar reduction of CSR (Fig. 1 B). miR-181b is member of an miRNA family (miR-181a-d) that is highly conserved in vertebrates while being absent from other phyla (Fig. S2). Interestingly, overexpression of miR-181a-1 or miR-181a-2, whose mature forms differ from miR-181b's by only three nucleotides, failed to induce a similar effect on the efficiency of CSR (Fig. 1 B). These results indicate that miR-181b expression in primary B cells interferes with CSR.
Figure 1.

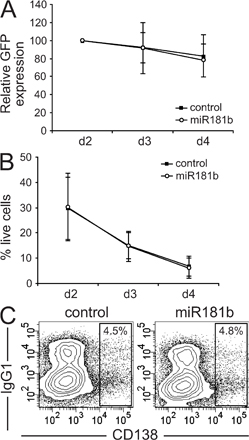
miR-181b expression reduces CSR efficiency. (A) Representation of the pre-miRNA–GFP retroviral vector. (B) miR-181b-1 and -2 isoforms, but not miR-181a-1 or -2 isoforms, decrease CSR. Primary B cells were activated with LPS + IL-4 and were transduced with vectors containing the indicated pre-miRNAs (x axis). CSR efficiency was measured by FACS analysis of IgG1 expression 4 d after retroviral transduction. Bars indicate the mean percentage of IgG1+ cells within the subset of GFP+, transduced cells, normalized to the value obtained in control-transduced cells. Error bars show the SD values in each case. p-values versus control-transduced cells (paired two-tailed t test) are indicated below (n = 14 for miR-181b-1; and n = 5 for miR-181b-2, miR181a-1, and miR181a-2 isoforms). (C) miR-181b reduces CSR efficiency. B cells were activated and transduced as in B. IgG1 CSR efficiency of B cells transduced with control (left) or miR-181b (right) pre-miRNA retroviral vectors was analyzed by flow cytometry after 4 d in culture in the presence of LPS + IL-4. Analysis of IgG1/B220 expression gated on GFP+ cells from three independent representative experiments is shown. Percentages indicate the proportion of IgG1+ (within the GFP+ transduced population) in the displayed gates. (D) Time-course analysis of IgG1 CSR efficiency of control- and miR-181b–transduced B cells in LPS + IL-4 cultures. Means from seven independent experiments are represented. Vertical bars show the SD values at each time point. (P = 0.003, day 3 vs. control using a paired two-tailed t test; P < 0.0001, day 4 vs. control). (E) miR-181b does not affect B cell proliferation. Splenic B cells were labeled with PKH26, and were activated and transduced as in B. The proliferation of transduced cells was assessed by measuring PKH26 dilution in GFP+ cells after 2 (top), 3 (middle), or 4 (bottom) d of LPS + IL-4 stimulation. Histograms show representative flow cytometry profiles of PKH26 (continuous line, control-transduced cells; dashed line, miR-181b–transduced cells). Bars underneath the histograms show the percentage of cells that have undergone each of the indicated cell divisions, as calculated with ModFit software (black bars, control-transduced cells; white bars, miR-181b–transduced cells). Error bars show SD values (n = 2). (F) miR-181b expression is regulated upon B cell activation. RNA from splenic B cells was analyzed by Northern blotting at days 0, 1, 2, and 3 of LPS + IL-4 stimulation for the expression of miR-181b (top gel). Expression of U6 RNA from the same samples is shown as a loading control (bottom gel). (G) Quantification of mature miR-181b expression in B cells. RNA was isolated as in F and retrotranscribed, and mature miR-181b was amplified by real-time PCR. Bars show the amount of miR-181b (in zeptomole/ng RNA) at each time point as calculated with an miRNA reference panel (Fig. S5, available at http://www.jem.org/cgi/content/full/jem.20080579/DC1). Error bars show the SD values (n = 3).
CSR is tightly associated with B cell proliferation (21). To assess whether miR-181b–induced reduction of CSR could be caused by a defect in B cell proliferation, we labeled B cells with PKH26 dye and analyzed cell division in control- and miR-181b–expressing cells. We found that B cells transduced with control or miR-181b vectors display very similar profiles of proliferation at all time points analyzed (Fig. 1 E). Similar proliferative activity was also found by analyzing the percentage of GFP+ cells throughout the cultures (Fig. S3 A, available at http://www.jem.org/cgi/content/full/jem.20080579/DC1). In addition, no significant differences in cell survival or plasma cell generation were observed in miR-181-b versus control-transduced B cells (Fig. S3, B and C). Therefore the CSR impairment induced by miR-181b is not caused by defective proliferation, altered survival, or enhanced plasma cell differentiation.
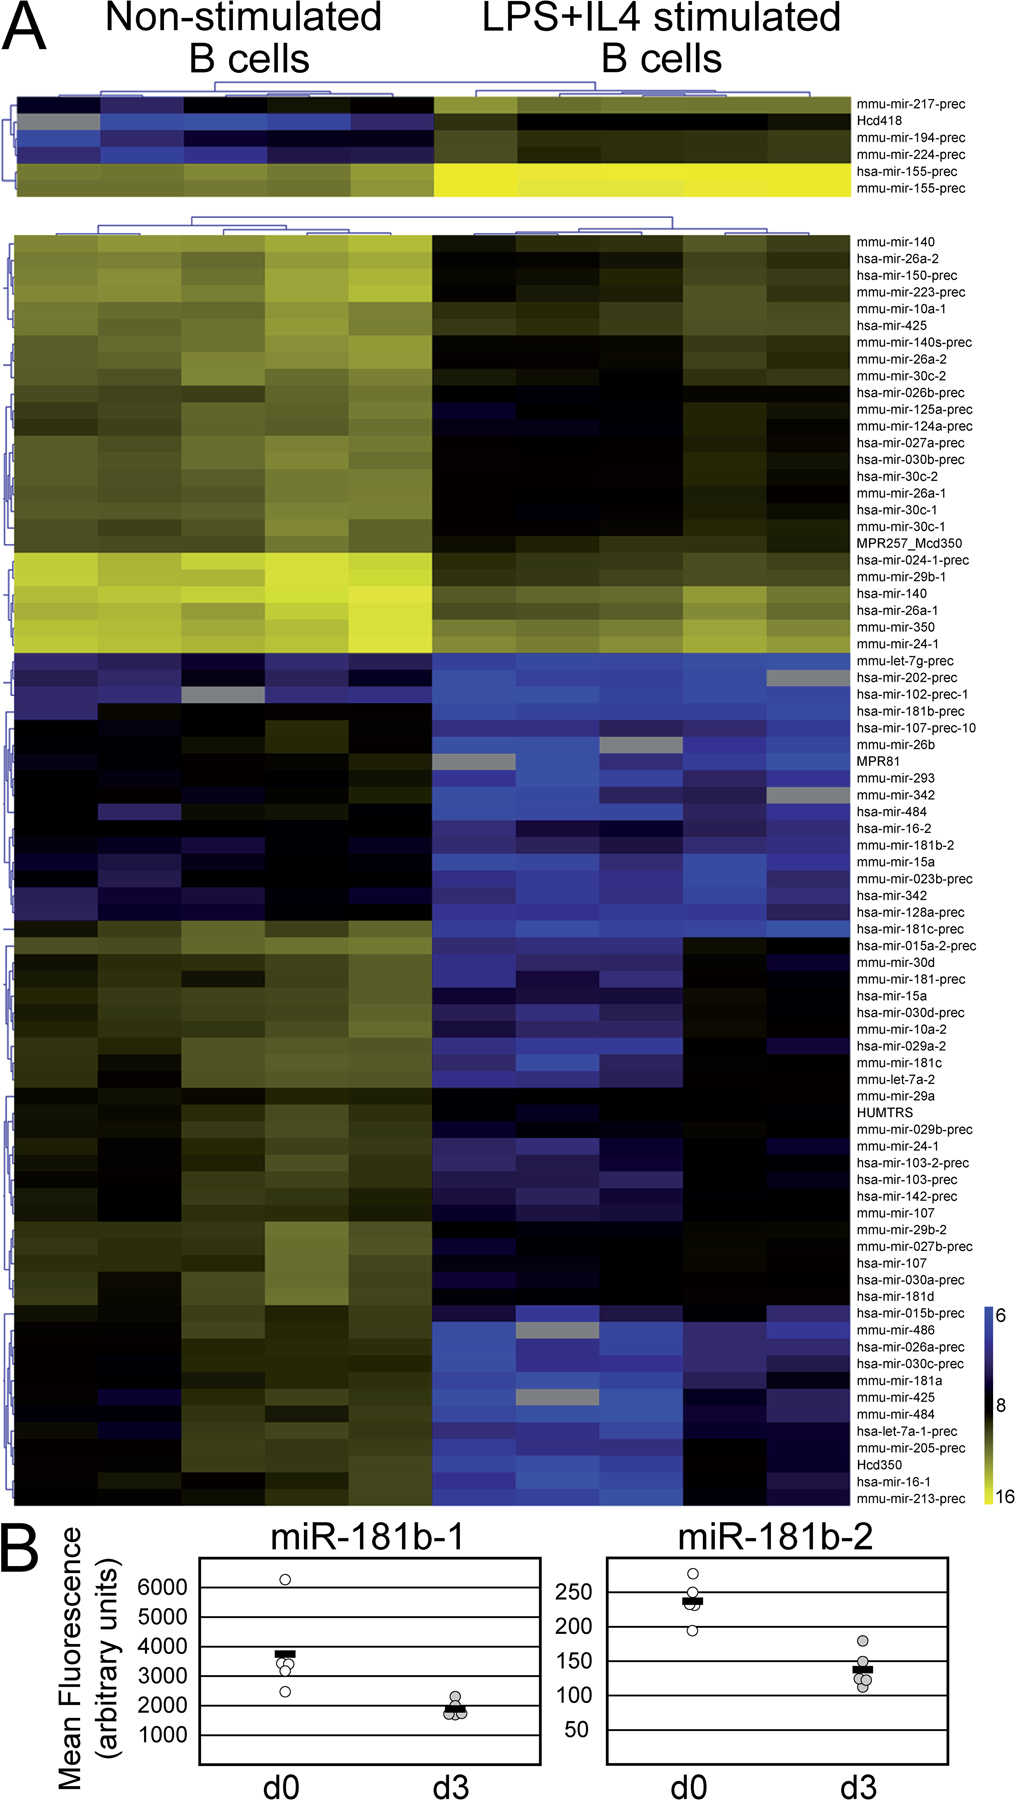
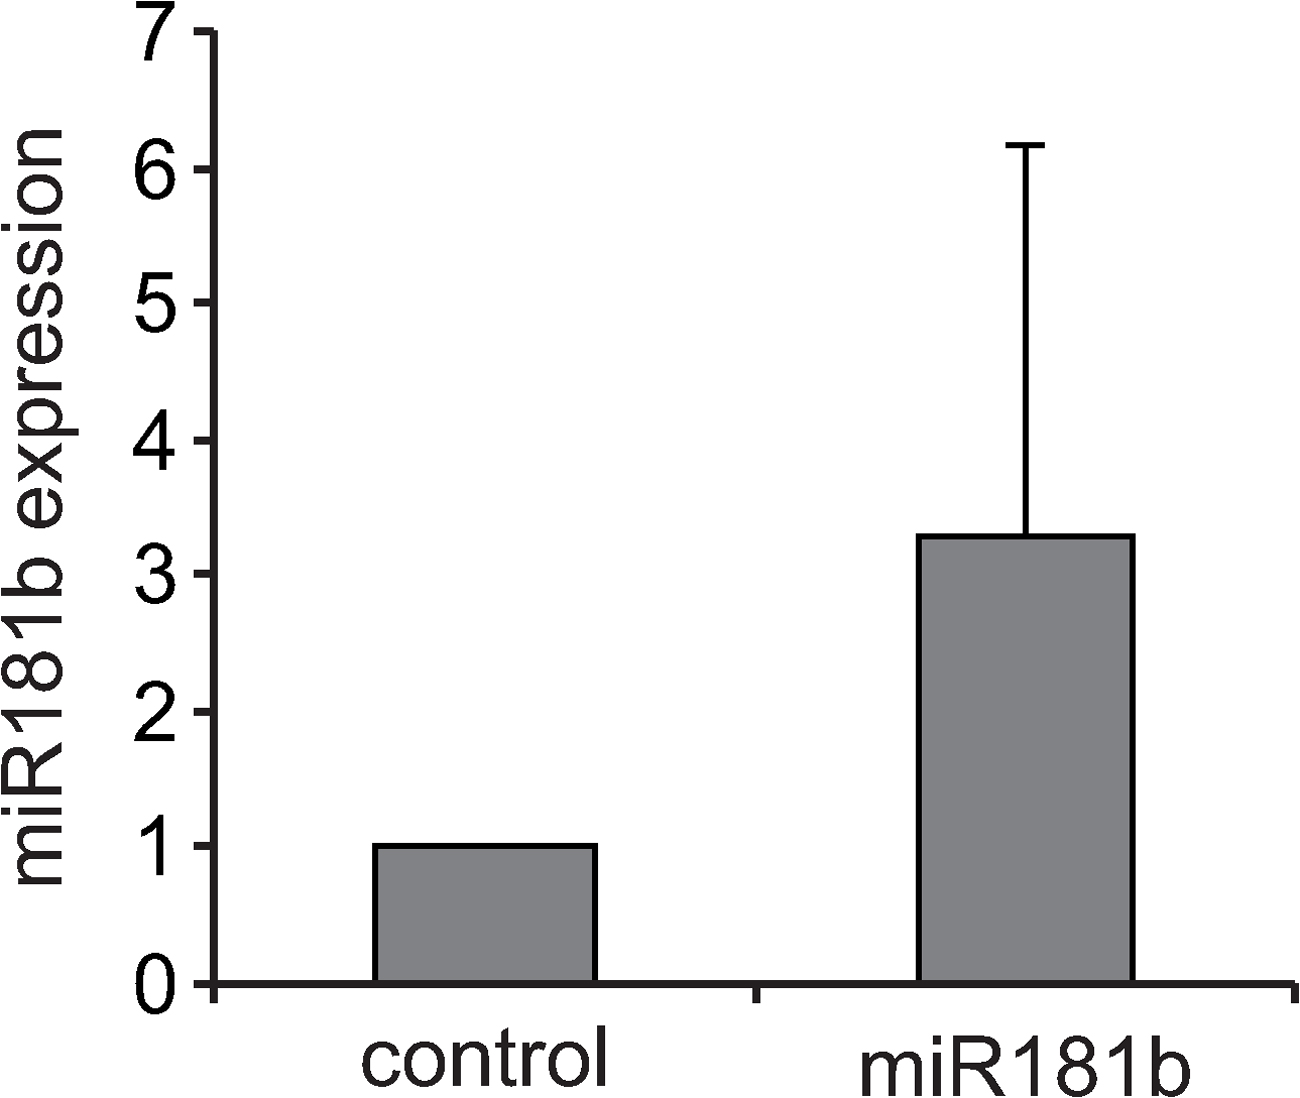
To assess the miRNA expression profile of CSR-stimulated B cells, we performed array analysis of LPS + IL-4–activated versus mature resting B cells. B cell activation resulted in a shift of miRNA expression featuring the down-regulation of a large number of miRNAs and a dramatic increase of a reduced number of miRNAs, including miR-155 and miR-217 (Fig. S4, available at http://www.jem.org/cgi/content/full/jem.20080579/DC1), whose expression has been associated with B cell neoplasias. Interestingly, our array analysis showed that miR-181b is down-regulated in stimulated compared with nonstimulated B cells (Fig. S4). To confirm this observation, we analyzed miR-181b expression in B cells at different time-points of LPS + IL-4 cultures both by Northern blotting and by real-time PCR (Fig. 1, F and G; and Fig. S5). We found that mature miR-181b expression is highest at day 0, drops at day 1 (mean = 18 ± 7%), and increases moderately later to reach ∼50% of initial levels after 3 d of culture (Fig. 1 G). Quantitative analysis of miR-181b expression in transduced B cells showed that our miRNA overexpression assay yielded a 3.3 ± 2.9-fold increase at day 3 of culture (Fig. S6), and therefore that it restores miR-181b levels found in resting, mature B cells. We conclude that miR-181b decreases CSR efficiency and that its expression is down-regulated upon B cell activation. miR181 miRNAs are predominantly expressed in the lymphoid system (19) (for review see reference 20), and miR-181a has been shown to promote B cell differentiation and to fine tune the activation thresholds of thymocytes (for review see reference [20]). These findings suggest that the miR-181 family can have an evolutionarily conserved role in the regulation of adaptive immunity.
Identification of miR-181b mRNA targets
To gain insights into the putative mRNA targets of miR-181b, we profiled mRNA expression shifts upon miR-181b expression. Splenic B cells were transduced with miR-181b or control vectors, and RNA from LPS + IL-4–stimulated, GFP+ cells was used to hybridize oligonucleotide arrays. Within the 760 informative spots (n = 3; P < 0.1), 21% were found to be down-regulated in miR-181b–expressing cells when compared with control cells (Fig. 2 A; for a complete list of down-regulated transcripts, see Table S1, available at http://www.jem.org/cgi/content/full/jem.20080579/DC1).
Figure 2.

AID expression is reduced in cells overexpressing miR-181b. (A) Representation of differentially expressed genes in control- versus miR-181b–transduced B cells analyzed by cDNA microarray analysis. 157 out of 760 transcripts were reduced in miR-181b–transduced cells (P ≤ 0.1; expression difference ≤ 0.95-fold). 93 of the down-regulated transcripts contained miR-181b seeds within their 3′UTR sequences. (B) miR-181b binding site in the AID 3′UTR is evolutionarily conserved. The diagram shows the alignment of miR-181b (top, shown in its reverse orientation) and its putative binding sites in human (hu), dog (do), mouse (mo), and zebrafish (ze) experimental AID 3′UTRs as well as in the predicted rat (ra)* and chicken (ch)* UTRs . Conserved nucleotides are shaded, conserved nucleotides at the seed sequence are bolded. (C) AID mRNA levels are reduced in miR-181b–expressing cells. Primary B cells were retrovirally transduced with miR-181b or control vectors, GFP+ cells were sorted by flow cytometry after 3 d of LPS + IL-4 stimulation, and AID expression levels were determined by real-time RT-PCR. Error bars show SD (n = 4; P = 0.0044). (D) AID protein level is reduced in miR-181b–expressing cells. One-third dilutions of total lysates from GFP+ miR-181b– or control-transduced primary B cells were analyzed by Western blotting. Lysates from LPS + IL-4–stimulated wild-type (+) and AID−/− (−) B cells were included as controls. Molecular masses are indicated. Quantification after blot densitometry and normalization is shown (bottom). Error bars represent SD values (n = 3).
We next aimed at evaluating the content of miR-181b seed sequences within down-regulated mRNAs. miRNAs are 21–23 long RNA molecules that exert their negative regulatory role by imperfect base pairing with sequences of target mRNAs, mostly present in their 3′ untranslated regions (UTRs) (17). The most significant contribution for target recognition involves the six to eight nucleotides located in the 5′ end of the miRNA, and it is termed seed sequence (22). To identify putative miR-181b targets, we assessed the presence of minimal seed complementation in the 3′UTRs of miR-181b–down-regulated mRNAs, as defined by containing the sequences 5′-GAATGT-3′, 5′-AATGTT-3′, or 5′-TGAATG-3′ (23). This analysis resulted in the identification of 93 known transcripts whose expression is down-regulated upon miR-181b expression and which contain miR-181b seed sequences in their 3′UTRs (Fig. 2 A; for a complete list, see Table S2, available at http://www.jem.org/cgi/content/full/jem.20080579/DC1). We found that AID is one of the most down-regulated mRNAs that contains seed sequences for miR-181b (Table I). To assess whether putative miR-181b binding sites in AID mRNA are phylogenetically conserved, we analyzed AID 3′UTR sequences from the human, dog, and zebrafish. There is no experimental data on the rat AID 3′UTR sequence, and only a 60-nucleotide long expressed sequence tag from the chicken 3′UTR, which lacks a polyA sequence, is found in the databases, very likely reflecting that this UTR is not complete. Therefore, we made use of the Ensembl Genome Browser to predict chicken and rat AID 3′UTRs. We found conserved putative miR-181b seed sequences in experimental AID 3′UTR sequences from the human, dog, and zebrafish, as well as in predicted AID 3′UTR sequences from the rat and chicken (Fig. 2 B). This analysis suggests that the miR-181b binding site in the AID 3′UTR is evolutionarily conserved.
Table I.
Most down-regulated genes with miR-181b seed sequences in activated B cells upon expression of miR-181b
| Gene | Fold versus control | p-value |
|---|---|---|
| Slc35d3 | 0.32 | 0.1 |
| Ak3l1 | 0.4 | 0.01 |
| Ndrg1 | 0.46 | 0.07 |
| Pitpnc1 | 0.57 | 0.07 |
| Tmem14a | 0.63 | 0.08 |
| Cd244 | 0.65 | 0.04 |
| Gch1 | 0.65 | 0.05 |
| Errfi1 | 0.66 | 0.06 |
| Hk2 | 0.67 | 0.02 |
| Mxi1 | 0.67 | 0.02 |
| Ccdc58 | 0.67 | 0.04 |
| Sc4mol | 0.69 | 0.03 |
| Pfkfb3 | 0.69 | 0.04 |
| Pdxp | 0.69 | 0.05 |
| Atp5g1 | 0.69 | 0.09 |
| Casp3 | 0.7 | 0.05 |
| Aicda | 0.7 | 0.05 |
| Ulk3 | 0.7 | 0.07 |
| Snx25 | 0.71 | 0.09 |
| Higd1a | 0.71 | 0.09 |
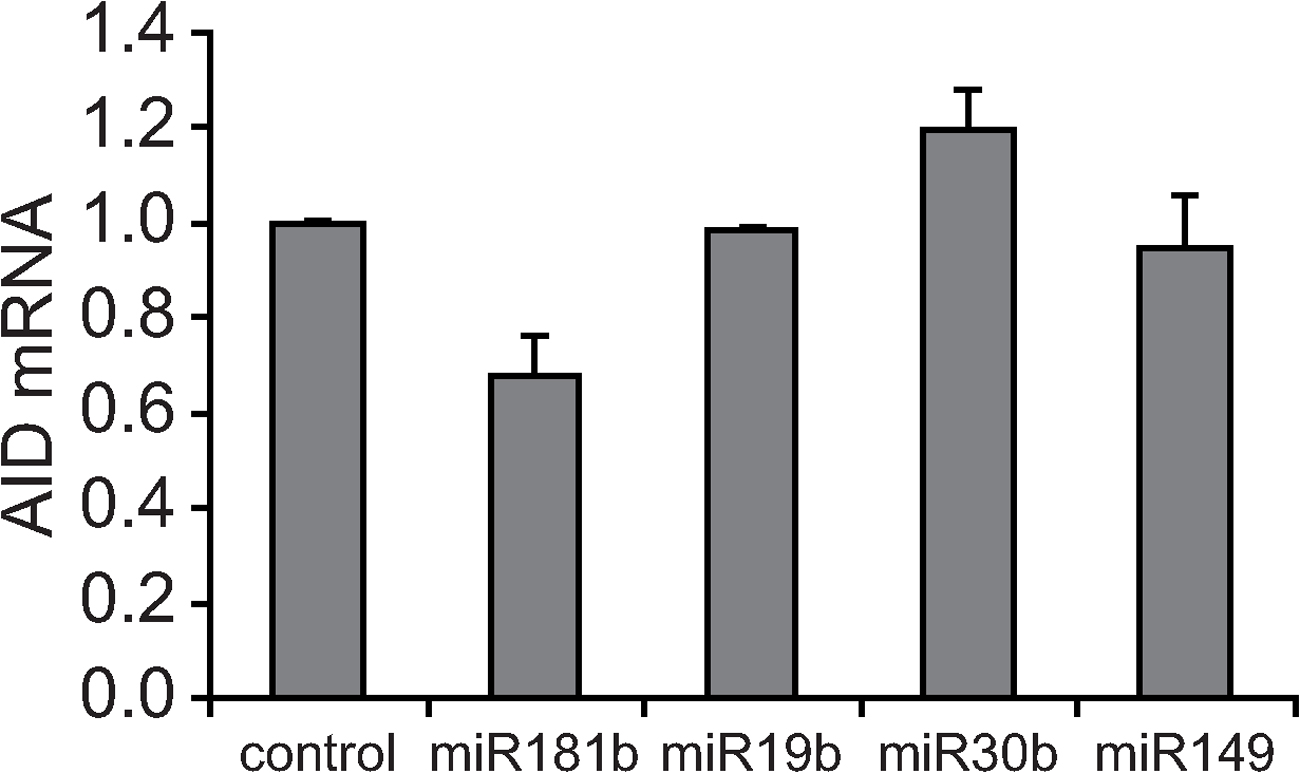
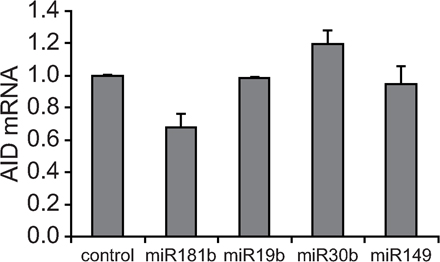
To confirm the down-regulation data obtained by array analysis, we performed real-time RT-PCR and found a consistent decrease in AID levels in miR-181b–transduced when compared with control-transduced primary B cells (32% reduction; P = 0.004; Fig. 2 C). Similar results were obtained in the Ramos Burkitt lymphoma cell line (not depicted) or when protein levels were analyzed by Western blotting (52 ± 8%; Fig. 2 D). In contrast, a reduction of AID levels was not observed in B cells transduced with miRNAs 19b, 30b, or 149 (Fig. S7, available at http://www.jem.org/cgi/content/full/jem.20080579/DC1), indicating that this effect is specific for miR-181b. We conclude that miR-181b expression in CSR-activated primary B cells results in the down-regulation of AID both at the mRNA and protein levels, and that the AID 3′UTR contains putative binding sites for miR-181b. The observed AID reduction is physiologically relevant, as we have found that AID expression level in activated B cells is limiting both for the CSR reaction and for the generation of c-myc/IgH chromosome translocations, as revealed in AID+/− mice (unpublished data). Therefore, AID down-regulation induced by miR-181b can account for the observed reduction in CSR.
AID is a direct target for miR-181b
To assess whether miR-181b promotes AID down-regulation by direct targeting of its 3′UTR, we performed luciferase reporter analysis. Alignment analysis showed that mouse and human AID 3′UTRs in fact contain multiple putative binding sequences for miR-181b (Fig. S8, available at http://www.jem.org/cgi/content/full/jem.20080579/DC1). Luciferase constructs were developed that contain each of the miR-181b putative binding sites identified in the mouse AID 3′UTR (BS1-3), or mutated versions of the same (mutBS1-3). Reporter constructs, which included a firefly luciferase cassette to allow internal Renilla luciferase activity normalization, were transiently cotransfected together with miR-181b duplexes into 293T cells, and luciferase activity was analyzed 24 h later (Fig. S9 shows raw values of luciferase measurements). We found that transfection of the BS1 and BS2 constructs in the presence of miR-181b resulted in a significant decrease of luciferase activity when compared with their mutant counterparts mutBS1 (85 ± 9%) and BS2 (45 ± 9%; Fig. 3 A), whereas transfection of BS3 did not affect luciferase activity (Fig. S9 and not depicted). Besides AID, we have found that miR-181b expression results in the down-regulation of several genes, a subset of which contain minimal seed sequences for miR-181b in their 3′UTRs. Although we cannot rule out that other target genes could play a minor role in the CSR impairment induced by miR-181b, none of these genes are known to directly participate in the CSR reaction.
Figure 3.

AID is a direct target of miR-181b. (A) Luciferase reporter assays of NIH-293T cells transfected with luciferase constructs containing AID–miR-181b putative binding sites. Cells were cotransfected with miR-181b miRNA duplexes along with wild-type (BS1 and BS2) or mutated versions (mutBS1 and mutBS2) of the miR-181b putative binding sites in the mouse AID 3′UTR. The sequences included in each luciferase construct are shown in Table S3 (available at http://www.jem.org/cgi/content/full/jem.20080579/DC1). Bars represent luciferase activity for each of the binding sites relative to their mutated counterparts (for raw data see Fig. S9). Statistical bars show SDs. P-values (paired two-tailed t test) are shown. (B) miR-181b and AID mRNA expression assessed by quantitative RT-PCR in Burkitt (closed triangles), diffuse large B cell lymphoma (closed circles), and Mantle cell lymphoma (open diamonds) human B cell lines. The expression of miR-181b and AID was normalized to their expression in primary human B cells, which has been given an arbitrary value of 1.
Finally, to address whether miR-181b could play a physiological role in the control of AID expression in B cells, we analyzed miR-181b and AID expression by real-time PCR in a collection of Burkitt, mantle cell lymphoma, and diffuse B cell lymphoma human B cell lines. None of the lymphoma cell lines were found to coexpress high levels of AID and miR-181b (Fig. 3 C), which indeed suggests that high expression of miR-181b may prevent the accumulation of high amounts of AID transcripts.
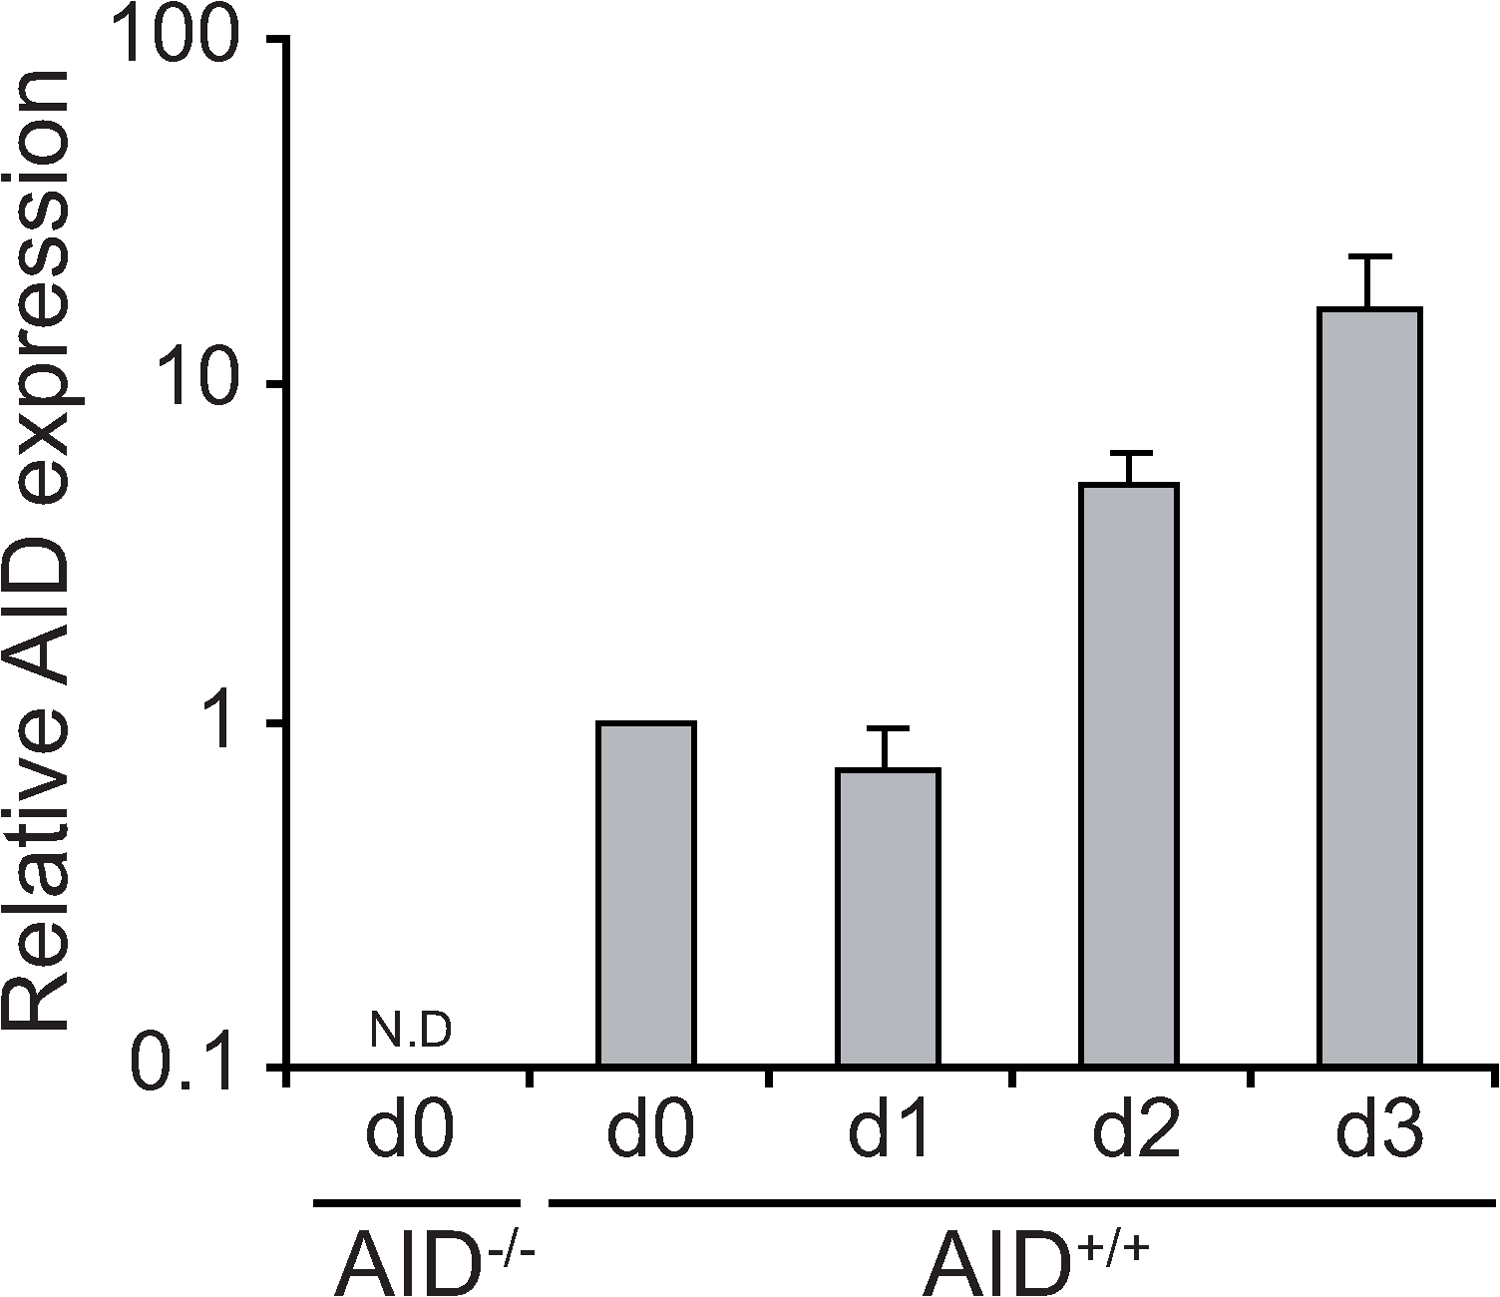
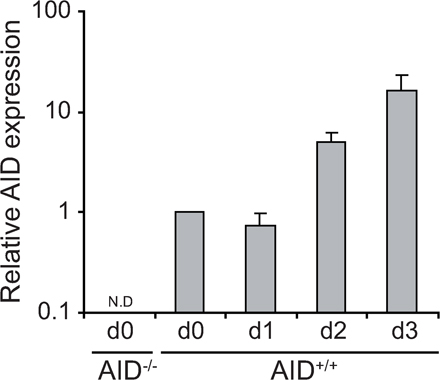
AID mRNA levels are low in resting B cells and dramatically increase 2 d after stimulation with LPS + IL-4 (Fig. S10, available at http://www.jem.org/cgi/content/full/jem.20080579/DC1). In contrast, miR-181b levels are highest in nonstimulated cells, drop upon stimulation, and increase steadily afterward (Fig. 1, F and G). While this manuscript was under review, two reports have shown that AID 3′UTR contains functional sites for miR-155 (24, 25), an miRNA with pleiotropic effects on B cell function, including plasma cell generation and lymphomagenesis (for review see reference 20). Removal of the miR-155 site from the AID 3′UTR results in an increase of AID levels, slightly enhances CSR, and promotes c-myc/IgH translocations (24, 25). miR-155 transduction failed to reduce CSR efficiency in our overexpression assay (Fig. S1), most likely because of the high levels of this miRNA already present in activated B cells. It is tempting to speculate that miR-181b and miR-155 have nonoverlapping functions in regulating AID expression, with miR-181b preventing premature AID activity while allowing proper AID transcriptional activation at early time points and with miR-155 narrowing its function at a later activation stage.
This work provides evidence for a new role of miRNAs in the control of the CSR reaction. We have shown that there is a differential miRNA expression profile in B cells undergoing CSR that shares remarkable similarities with miRNA profiles in human cancers, including overall miRNA down-regulation (26) and a dramatic increase of very few miRNAs whose expression has been linked to B cell neoplasias. This observation may reflect that miRNAs contribute to the transformation propensity that seems associated with germinal center B cells. miRNA functional screening combined with miRNA profiling has allowed to identify miR-181b as a negative regulator of the CSR reaction that directly targets AID. Consistent with this observation, miR-181b expression is reduced upon B cell activation, presumably allowing optimal efficiency of this reaction within the appropriate time window. miR-181b expression yields a moderate decrease of AID levels, which is nevertheless sufficient to promote a proportional impairment of CSR efficiency. This fine-tune regulatory mechanism highlights the importance of miRNAs in keeping the expression of target genes within narrow, physiological levels, as previously suggested (27). By limiting AID expression, miR-181b could act as a tumor suppressor miRNA in B cells. In support of this hypothesis, miR-181b has been shown to target the Tcl-1 oncogene in B cell chronic lymphocytic leukemia, and the loss of miR-181b expression has been shown to be associated to the aggressive form of chronic lymphocytic leukemia (28).
In summary, we have identified miR-181b as a modulator of endogenous AID expression. This finding represents a novel, posttranscriptional regulatory mechanism of AID activity in B cells that may be involved in restricting the lymphomagenic potential associated with this reaction.
MATERIALS AND METHODS
Cell cultures.
The NIH-293T cell line was cultured in 10% FCS DMEM. Burkitt lymphoma (Akata, Boston, Ramos, Namalwa, Raji, and Daudi), diffuse large B cell lymphoma (DB, Oci-Ly19, Su-dhl4, Su-DHl6, and Toledo) and mantle B cell lymphoma (Irm2, Jeko1, Jvm2, Upn1, and Upn2) cell lines were cultured in 10% FCS RPMI 1640 medium. Mouse primary B cells were purified from the spleens of C57/BL6 mice by anti-CD43 immunomagnetic depletion (Miltenyi Biotec) and were cultured in 25 μg/ml LPS (Sigma-Aldrich), 10 ng/ml IL-4 (PeproTech), 10 mM Hepes (Invitrogen), 50 μM β-mercaptoethanol (Invitrogen), and 10% FCS RPMI 1640 medium.
miRNA library and retroviral infection.
DNA fragments containing 150 pre-miRNAs and their flanking 50-bp-long genomic sequences were cloned in XhoI-EcoRI sites of the pre-miRNA GFP vector (Fig. 1 A). Retroviral supernatants were produced by transient calcium phosphate transfection of NIH-293T cells with pCL-ECO (Imgenex) and pre-miRNA GFP retroviral vectors. Mouse primary B cells were transduced with retroviral supernatants for 20 h in the presence of 8 μg/ml polybrene (Sigma-Aldrich), 25 μg/ml LPS, and 10 ng/ml IL-4.
FACS analysis and cell sorting.
Transduced B cells were labeled with anti-B220–PE antibody or anti-CD138–PE antibody, anti-IgG1 biotin antibody, allophycocyanin-streptavidin, and 7-aminoactinomycin D (BD Biosciences), and were analyzed in a flow cytometer (FACSCanto; BD Biosciences) at the time points indicated in the figures. For proliferation analysis, cells were labeled before transduction with 4 μM PKH26 (Sigma-Aldrich), according to the manufacturer's instructions. miR-181b– or control-transduced B cells were sorted at different time points after retroviral transduction based on GFP expression. Activated B cells for miRNA array analysis were obtained after CFSE labeling (Invitrogen), LPS + IL-4 stimulation for 3 d, and sorting of cells that had undergone at least one cell division. Sortings were performed with a cell sorter (FACSAria; BD Biosciences). Primary human B cells were isolated by centrifugation in Ficoll density gradient (GE Healthcare) and immunomagnetic cell sorting of CD19+ cells (Miltenyi Biotec).
Quantitative PCR, Northern blotting, and Western blotting.
RNA was extracted with TRIzol (Invitrogen) and converted into cDNA using random primers (Roche) and SuperScript II reverse transcriptase (Invitrogen). Human and mouse AID mRNA were quantified using an SYBR green assay (Applied Biosystems). GAPDH amplifications were used as normalization controls. The primers used were as follows: (forward) 5-′accttcgcaacaagtctggct-3′ and (reverse) 5-′agccttgcggtcttcacagaa-3′ for mouse Aicda, (forward) 5′-cctcttgatgaaccggaggaa-3′ and (reverse) 5′-agcactgtcacgcctcttcact-3′ for human Aicda, (forward) 5′-tgaagcaggcatctgaggg-3′ and (reverse) 5′-cgaaggtggaagagtgggag-3′ for mouse GAPDH, and (forward) 5′-gaaggtgaaggtcggagtc-3′ and (reverse) 5′-gaagatggtgatgggatttc-3′ for human GAPDH. For miR-181b real-time PCR, RNA was extracted with TRIzol and reverse-transcribed with an miR-181b–specific primer using the TaqMan miRNA RT system (Applied Biosystems). Quantitative PCR of miR-181b was performed using miR-181b–specific primers and a TaqMan probe (Applied Biosystems). Amplification of U18 (for human samples) or sno-142 (for mouse samples) using specific primers and a TaqMan probe was used as a normalization control. Serial dilutions of a mixture of synthetic RNA oligonucleotides of known concentration (Applied Biosystems) were used as a reference to titrate miR-181b amplifications by real-time RT-PCR. Quantitative PCRs were performed on 7900HT fast real-time PCR system (Applied Biosystems). Northern blots were performed using 10 μg of total RNA. Hybridizations were performed with a 5′-end radiolabeled anti–miR-181b LNA probe (Exiqon) and an anti-U6 DNA probe. Band size was determined with a radiolabeled 10-bp RNA decade marker (Ambion). Lysates for protein analysis were prepared in Nonidet P-40 buffer in the presence of protease inhibitors (Roche). 40, 13.3, or 4.4 μg of lysate were analyzed by Western blotting, as previously described (29), using an anti-AID polyclonal antibody (provided by K.M. McBride, The Rockefeller University, New York, NY) or an anti–α-tubulin antibody (Sigma-Aldrich). Western blot quantification was performed using Odyssey software.
Microarray analysis.
miRNA microarray experiments were performed with paired samples of nonstimulated and stimulated B cells sorted as described in FACS analysis and cell sorting. RNA was isolated with TRIzol. miRNA microarray hybridizations were done on slides containing duplicate probes corresponding to 326 human and 249 mouse miRNA genes, as previously described (30). Computational analysis of miRNA microarray data was performed as previously described (30). In brief, blank and probe control spots were removed and local background was subtracted from the median signal. Signal intensity was transformed to a log2 scale, and spots whose intensities were lower than 99th percentile of blank spots were removed. Differentially expressed genes were selected using a significance analysis of microarrays algorithm. Microarray experiments for mRNA expression analysis were performed with RNA from mouse primary B cells transduced with control and miR-181b after sorting of GFP+ cells, as described above. Gene expression profiling was performed by hybridization to a mouse 44K probe platform (Agilent Technologies). Genes with a p-value of ≤0.1 and a ≤0.95 fold expression difference were selected for further analysis. Microarray data have been deposited in the Gene Expression Omnibus under accession no. GSE12186. To examine the presence of potential miR-181b “seeds” within the 3′UTR sequences of down-regulated transcripts in miR-181b–transduced cells, a computational miRNA target search was performed, as previously described (23). In brief, down-regulated genes were mapped to known transcripts in the Ensembl Genome Browser (version 45; available at http://www.ensembl.org/index.html) using the Ensembl Perl API, and a custom Perl script was then used to search for putative miR-181b target sites, defined by complete sequence complementarity between a hexamer in the 3′UTR sequence of the transcript and the miRNA seed (positions 1–8 of the 5′ end) (22).
Sequence alignments.
Motifs complementary to miR-181b seed were searched within Aicda 3′UTR sequences from different species using SeqMan software. Human, mouse, dog, and zebrafish Aicda 3′UTRs were retrieved from the Ensembl database (Ensembl rl. 49). Predicted chicken and rat Aicda 3′UTRs were obtained by a 3′ extension of their CDS sequence up to 1,200 bp with genomic sequences retrieved from the Ensembl Genome Browser.
Luciferase assays.
Luciferase reporter constructs were made by ligating 30-bp-long synthetic oligonucleotides containing putative miR-181b binding sites from the mouse AID 3′UTR or their mutant versions (Table S3, available at http://www.jem.org/cgi/content/full/jem.20080579/DC1) in XhoI-NotI sites of the psiCheck-2 vector (Promega). Cloning was verified by sequencing. Reporter assays were performed in NIH-293T cells cotransfected in duplicates with Lipofectamine 2000 (Invitrogen) with each independent luciferase reporter plasmid along with miR-181b duplex (Applied Biosytems) at a final concentration of 100 nM. Firefly luciferase expression was used as a normalization control. Reporter activity was detected 24 h after transfection with the Dual-Glo Luciferase Assay System (Promega) in a Glomax reader (Promega).
Online supplemental material.
Fig. S1 shows the functional screening of an miRNA library. Fig. S2 depicts the conservation of paralogous miR-181 sequences. Fig. S3 shows that miR-181b expression does not affect cell proliferation or survival, or plasma cell differentiation. Fig. S4 depicts differentially expressed miRNAs in activated B cells. Fig. S5 shows miR-181b quantification by real-time RT-PCR with an miRNA reference panel. Fig. S6 depicts miR-181b expression in transduced primary B cells. Fig. S7 shows that AID mRNA levels are specifically reduced in B cells overexpressing miR-181b. Fig. S8 depicts putative miR-181b binding sites in human and mouse AID 3′UTRs. Fig. S9 depicts luciferase reporter assays of putative miR-181b binding sites in the mouse AID 3′UTR. Fig. S10 shows AID expression in LPS + IL-4–stimulated primary B cell cultures. Table S1 shows down-regulated mRNAs in activated B cells that express miR-181b. Table S2 shows down-regulated mRNAs containing miR-181b seed sequences in activated B cells that express miR181b. Table S3 provides sequences cloned in the psiCheck-2 vector. Online supplemental material is available at http://www.jem.org/cgi/content/full/jem.20080579/DC1.
Supplementary Material
Acknowledgments
We would like to thank Drs. Oskar Férnandez-Capetillo, Luis Lombardía, Raquel Martín, Juan Méndez, and Manuel Serrano for helpful advice and discussion.
V.G. de Yébenes is a Spanish National Cancer Research Center investigator, S. González was funded by the Human Frontiers Science Program Organization, and A.R. Ramiro is supported by the Ramón y Cajal program from the Ministerio de Educación y Ciencia. This work was funded by grants from the Ministerio de Educación y Ciencia (SAF2007-63130), the Comunidad Autónoma de Madrid (DIFHEMAT-CM), and the European Research Council (BCLYM-207844).
The authors have no conflicting financial interests.
S. González's present address is Centro Nacional de Investigaciones Cardiovasculares, Madrid 28029, Spain.
References
- 1.Stavnezer, J. 1996. Antibody class switching. Adv. Immunol. 61:79–146. [DOI] [PubMed] [Google Scholar]
- 2.Muramatsu, M., K. Kinoshita, S. Fagarasan, S. Yamada, Y. Shinkai, and T. Honjo. 2000. Class switch recombination and hypermutation require activation-induced cytidine deaminase (AID), a potential RNA editing enzyme. Cell. 102:553–563. [DOI] [PubMed] [Google Scholar]
- 3.Revy, P., T. Muto, Y. Levy, F. Geissmann, A. Plebani, O. Sanal, N. Catalan, M. Forveille, R. Dufourcq-Labelouse, A. Gennery, et al. 2000. Activation-induced cytidine deaminase (AID) deficiency causes the autosomal recessive form of the Hyper-IgM syndrome (HIGM2). Cell. 102:565–575. [DOI] [PubMed] [Google Scholar]
- 4.Petersen-Mahrt, S.K., R.S. Harris, and M.S. Neuberger. 2002. AID mutates E. coli suggesting a DNA deamination mechanism for antibody diversification. Nature. 418:99–103. [DOI] [PubMed] [Google Scholar]
- 5.Maizels, N. 2005. Immunoglobulin gene diversification. Annu. Rev. Genet. 39:23–46. [DOI] [PubMed] [Google Scholar]
- 6.Kuppers, R. 2005. Mechanisms of B-cell lymphoma pathogenesis. Nat. Rev. Cancer. 5:251–262. [DOI] [PubMed] [Google Scholar]
- 7.Ramiro, A.R., M. Jankovic, T. Eisenreich, S. Difilippantonio, S. Chen-Kiang, M. Muramatsu, T. Honjo, A. Nussenzweig, and M.C. Nussenzweig. 2004. AID is required for c-myc/IgH chromosome translocations in vivo. Cell. 118:431–438. [DOI] [PubMed] [Google Scholar]
- 8.Dorsett, Y., D.F. Robbiani, M. Jankovic, B. Reina-San-Martin, T.R. Eisenreich, and M.C. Nussenzweig. 2007. A role for AID in chromosome translocations between c-myc and the IgH variable region. J. Exp. Med. 204:2225–2232. [DOI] [PMC free article] [PubMed] [Google Scholar]
- 9.Ramiro, A.R., M. Jankovic, E. Callen, S. Difilippantonio, H.T. Chen, K.M. McBride, T.R. Eisenreich, J. Chen, R.A. Dickins, S.W. Lowe, et al. 2006. Role of genomic instability and p53 in AID-induced c-myc-Igh translocations. Nature. 440:105–109. [DOI] [PMC free article] [PubMed] [Google Scholar]
- 10.Liu, M., J.L. Duke, D.J. Richter, C.G. Vinuesa, C.C. Goodnow, S.H. Kleinstein, and D.G. Schatz. 2008. Two levels of protection for the B cell genome during somatic hypermutation. Nature. 451:841–845. [DOI] [PubMed] [Google Scholar]
- 11.Pasqualucci, L., P. Neumeister, T. Goossens, G. Nanjangud, R.S. Chaganti, R. Kuppers, and R. Dalla-Favera. 2001. Hypermutation of multiple proto-oncogenes in B-cell diffuse large-cell lymphomas. Nature. 412:341–346. [DOI] [PubMed] [Google Scholar]
- 12.Kotani, A., N. Kakazu, T. Tsuruyama, I.M. Okazaki, M. Muramatsu, K. Kinoshita, H. Nagaoka, D. Yabe, and T. Honjo. 2007. Activation-induced cytidine deaminase (AID) promotes B cell lymphomagenesis in Emu-cmyc transgenic mice. Proc. Natl. Acad. Sci. USA. 104:1616–1620. [DOI] [PMC free article] [PubMed] [Google Scholar]
- 13.Pasqualucci, L., G. Bhagat, M. Jankovic, M. Compagno, P. Smith, M. Muramatsu, T. Honjo, H.C. Morse III, M.C. Nussenzweig, and R. Dalla-Favera. 2008. AID is required for germinal center-derived lymphomagenesis. Nat. Genet. 40:108–112. [DOI] [PubMed] [Google Scholar]
- 14.Kovalchuk, A.L., W. duBois, E. Mushinski, N.E. McNeil, C. Hirt, C.F. Qi, Z. Li, S. Janz, T. Honjo, M. Muramatsu, et al. 2007. AID-deficient Bcl-xL transgenic mice develop delayed atypical plasma cell tumors with unusual Ig/Myc chromosomal rearrangements. J. Exp. Med. 204:2989–3001. [DOI] [PMC free article] [PubMed] [Google Scholar]
- 15.Ramiro, A., B.R. San-Martin, K. McBride, M. Jankovic, V. Barreto, A. Nussenzweig, and M.C. Nussenzweig. 2007. The role of activation-induced deaminase in antibody diversification and chromosome translocations. Adv. Immunol. 94:75–107. [DOI] [PubMed] [Google Scholar]
- 16.Perez-Duran, P., V.G. de Yebenes, and A.R. Ramiro. 2007. Oncogenic events triggered by AID, the adverse effect of antibody diversification. Carcinogenesis. 28:2427–2433. [DOI] [PubMed] [Google Scholar]
- 17.He, L., and G.J. Hannon. 2004. MicroRNAs: small RNAs with a big role in gene regulation. Nat. Rev. Genet. 5:522–531. [DOI] [PubMed] [Google Scholar]
- 18.Garzon, R., M. Fabbri, A. Cimmino, G.A. Calin, and C.M. Croce. 2006. MicroRNA expression and function in cancer. Trends Mol. Med. 12:580–587. [DOI] [PubMed] [Google Scholar]
- 19.Landgraf, P., M. Rusu, R. Sheridan, A. Sewer, N. Iovino, A. Aravin, S. Pfeffer, A. Rice, A.O. Kamphorst, M. Landthaler, et al. 2007. A mammalian microRNA expression atlas based on small RNA library sequencing. Cell. 129:1401–1414. [DOI] [PMC free article] [PubMed] [Google Scholar]
- 20.Martinez, J., and M. Busslinger. 2007. Life beyond cleavage: the case of Ago2 and hematopoiesis. Genes Dev. 21:1983–1988. [DOI] [PubMed] [Google Scholar]
- 21.McCall, M.N., and P.D. Hodgkin. 1999. Switch recombination and germ-line transcription are division-regulated events in B lymphocytes. Biochim. Biophys. Acta. 1447:43–50. [DOI] [PubMed] [Google Scholar]
- 22.Lewis, B.P., C.B. Burge, and D.P. Bartel. 2005. Conserved seed pairing, often flanked by adenosines, indicates that thousands of human genes are microRNA targets. Cell. 120:15–20. [DOI] [PubMed] [Google Scholar]
- 23.Giraldez, A.J., Y. Mishima, J. Rihel, R.J. Grocock, S. Van Dongen, K. Inoue, A.J. Enright, and A.F. Schier. 2006. Zebrafish MiR-430 promotes deadenylation and clearance of maternal mRNAs. Science. 312:75–79. [DOI] [PubMed] [Google Scholar]
- 24.Teng, G., P. Hakimpour, P. Landgraf, A. Rice, T. Tuschl, R. Casellas, and F.N. Papavasiliou. 2008. MicroRNA-155 is a negative regulator of activation-induced cytidine deaminase. Immunity. 28:621–629. [DOI] [PMC free article] [PubMed] [Google Scholar]
- 25.Dorsett, Y., K.M. McBride, M. Jankovic, A. Gazumyan, T.H. Thai, D.F. Robbiani, M. Di Virgilio, B.R. San-Martin, G. Heidkamp, T.A. Schwickert, et al. 2008. MicroRNA-155 suppresses activation-induced cytidine deaminase-mediated Myc-Igh translocation. Immunity. 28:630–638. [DOI] [PMC free article] [PubMed] [Google Scholar]
- 26.Lu, J., G. Getz, E.A. Miska, E. Alvarez-Saavedra, J. Lamb, D. Peck, A. Sweet-Cordero, B.L. Ebert, R.H. Mak, A.A. Ferrando, et al. 2005. MicroRNA expression profiles classify human cancers. Nature. 435:834–838. [DOI] [PubMed] [Google Scholar]
- 27.Xiao, C., D.P. Calado, G. Galler, T.H. Thai, H.C. Patterson, J. Wang, N. Rajewsky, T.P. Bender, and K. Rajewsky. 2007. MiR-150 controls B cell differentiation by targeting the transcription factor c-Myb. Cell. 131:146–159. [DOI] [PubMed] [Google Scholar]
- 28.Pekarsky, Y., U. Santanam, A. Cimmino, A. Palamarchuk, A. Efanov, V. Maximov, S. Volinia, H. Alder, C.G. Liu, L. Rassenti, et al. 2006. Tcl1 expression in chronic lymphocytic leukemia is regulated by miR-29 and miR-181. Cancer Res. 66:11590–11593. [DOI] [PubMed] [Google Scholar]
- 29.McBride, K.M., V. Barreto, A.R. Ramiro, P. Stavropoulos, and M.C. Nussenzweig. 2004. Somatic hypermutation is limited by CRM1-dependent nuclear export of activation-induced deaminase. J. Exp. Med. 199:1235–1244. [DOI] [PMC free article] [PubMed] [Google Scholar]
- 30.Roldo, C., E. Missiaglia, J.P. Hagan, M. Falconi, P. Capelli, S. Bersani, G.A. Calin, S. Volinia, C.G. Liu, A. Scarpa, and C.M. Croce. 2006. MicroRNA expression abnormalities in pancreatic endocrine and acinar tumors are associated with distinctive pathologic features and clinical behavior. J. Clin. Oncol. 24:4677–4684. [DOI] [PubMed] [Google Scholar]
Associated Data
This section collects any data citations, data availability statements, or supplementary materials included in this article.