Abstract
A graphical user interface based on LabVIEW software was developed to enable clinical evaluation of a new High-Sensitivity Micro-Angio-Fluoroscopic (HSMAF) system for real-time acquisition, display and rapid frame transfer of high-resolution region-of-interest images. The HSMAF detector consists of a CsI(Tl) phosphor, a light image intensifier (LII), and a fiber-optic taper coupled to a progressive scan, frame-transfer, charged-coupled device (CCD) camera which provides real-time 12 bit, 1k × 1k images capable of greater than 10 lp/mm resolution. Images can be captured in continuous or triggered mode, and the camera can be programmed by a computer using Camera Link serial communication. A graphical user interface was developed to control the camera modes such as gain and pixel binning as well as to acquire, store, display, and process the images. The program, written in LabVIEW, has the following capabilities: camera initialization, synchronized image acquisition with the x-ray pulses, roadmap and digital subtraction angiography acquisition (DSA), flat field correction, brightness and contrast control, last frame hold in fluoroscopy, looped playback of the acquired images in angiography, recursive temporal filtering and LII gain control. Frame rates can be up to 30 fps in full-resolution mode. The user friendly implementation of the interface along with the high framerate acquisition and display for this unique high-resolution detector should provide angiographers and interventionalists with a new capability for visualizing details of small vessels and endovascular devices such as stents and hence enable more accurate diagnoses and image guided interventions. (Support: NIH Grants R01NS43924, R01EB002873)
Keywords: SYS, DX, LabVIEW, Graphical-User-Interface, Region-of-Interest, Cone-Beam-Computed-Tomography, Fluoroscopy, Angiography, High-Resolution
1. INTRODUCTION
Continuous advances in Endovascular Image Guided Interventions (EIGI) increase the demand for better quality in medical images such as higher spatial resolution, increased sensitivity, negligible lag, wider dynamic range and higher frame rates. The improved EIGI methods [1, 2, 3, 4] along with the new x-ray imaging detectors [5, 6, 7, 8] are essential tools for the treatment of cerebrovascular diseases (CVD) [3] such as aneurysms and vessel stenoses. Furthermore, improved design of software that automates the radiographic procedures for the above methods and simplifies the job of the radiologist or interventionalist is important for better treatment and more accurate diagnoses. In this paper, a design and an evaluation of a graphical user interface (GUI) based on LabVIEW software for using with a new Micro-Angio Fluoroscopic system is described. Furthermore, we present an evaluation of actual experimental EIGI imaging procedures using the above system in standard x-ray imaging modes such as fluoroscopy, fluoroscopic roadmapping, DSA and rotational Region-of-Interest Cone-Beam Computed Tomography (ROI-CBCT).
2. METHODS AND MATERIALS
2.1 HSMAF Detector
A High-Sensitivity Micro-Angiographic Fluoroscopic (HSMAF) detector [4] was built by our group for better visualization of details of small endovascular devices such as stents, coils, balloons, catheters and guide wires. The HSMAF detector consists of the following components: 300μm CsI(Tl) input Phosphor, dual stage GEN2 micro-channel plate Light Image Intensifier (LII), Fiber Optic Taper (FOT) and high-sensitivity, fast frame rate, progressive scan, frame-transfer CCD camera. (Pantera TF 1M30, DALSA Corporation). The CCD image sensor (TrueFrame™) consists of a matrix of 1024 × 1024 square pixels, with pixel size of 12μm and bit depth of 12 bits per pixel. The field of view of the detector is circular with a diameter of 4cm with equal-area formatting used.
Figure 1 shows the system components placed in a light-sealed enclosure with the cover removed. X-ray energy is converted into light by the CSI (Tl) Phosphor. The light signal gets amplified by the Light Image Intensifier (LII), passes through a 2.88:1 ratio fiber optic taper and finally gets detected by the CCD camera. The CCD camera digital output signal is transferred through a Camera Link cable to a frame-grabber installed on a computer.
Figure 1.
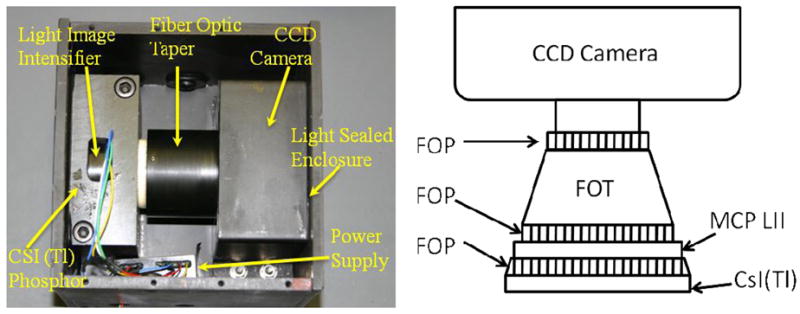
Detector Components. Actual detector (left) and component schematics (right).
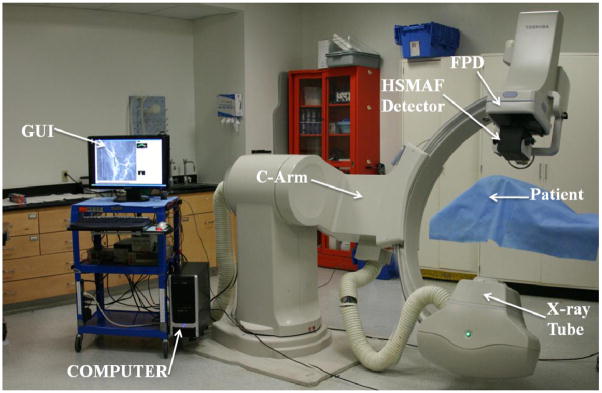
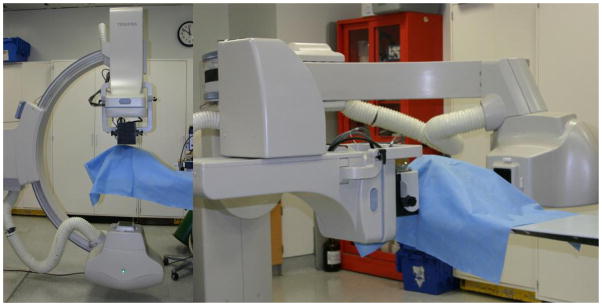
The HSMAF detector which is mounted on a retractable arm is inserted into the x-ray beam of a C-arm angiographic system between the Flat Panel Detector (FPD) and the patient. The arm installed on the C-arm gantry is indicated in figure 2. A collimation button on the side of the arm automatically switches the collimation of the beam between the HSMAF and FPD. Finally, a computer is used to run the GUI and control the system. Figure 3 shows a typical experimental setup of an animal experiment. Rotating the C-arm enables ROI-CBCT acquisition as well.
Figure 2.
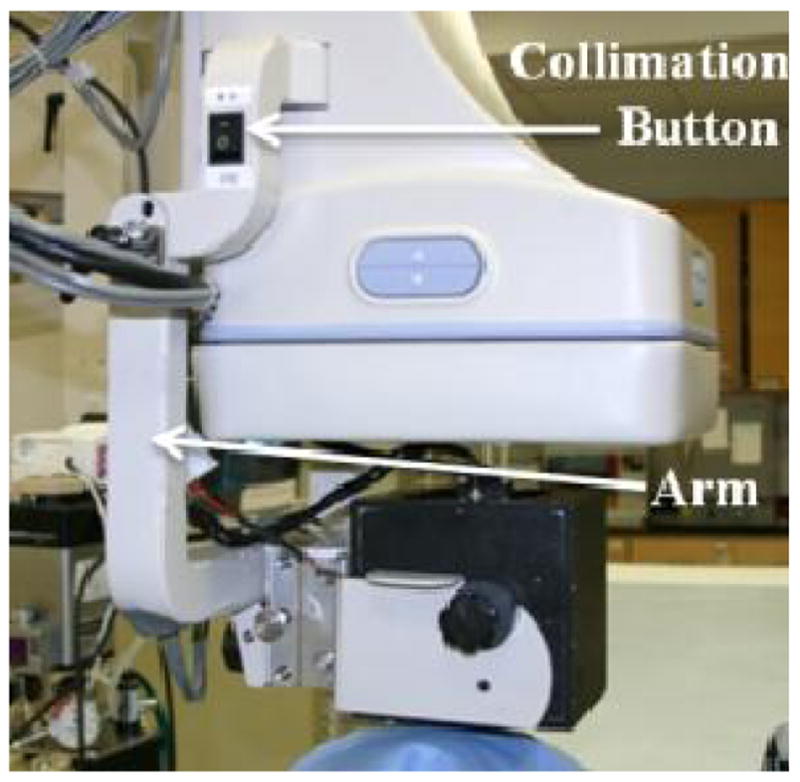
HSMAF Arm
Figure 3.
Experimental Setup for animal imaging using the HSMAF
2.2 System’s peripherals and controllers
The HSMAF detector system and its peripherals described below are controlled by the GUI. The image data are transferred to a dual core processor computer through a frame grabber (National Instuments NI-PCIe-1429 Camera Link board). An analog output module (Adlink ND-6024) is responsible for setting the gain of the LII by varying the voltage between 0–10V. Synchronization of the HSMAF detector with the Toshiba Infinix C-arm gantry’s x-ray generator is accomplished by a trigger circuit which detects the x-ray-on electronic pulses and creates the required signal to trigger the camera whenever the x-ray tube is activated. A flow diagram of the HSMAF system is shown in figure 4.
Figure 4.
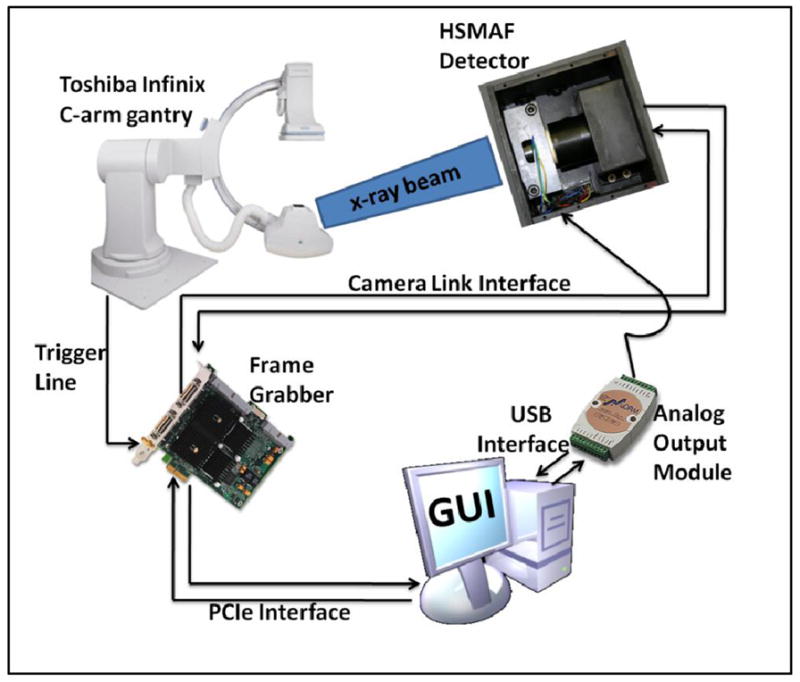
HSMAF system’s flow diagram
2.3 Graphical User Interface functions
A Graphical User Interface (GUI) based on LabVIEW software was developed to operate the system. The GUI controls the camera modes such as gain and pixel binning as well as acquires, stores, displays, and processes the images. The program has the following capabilities: camera initialization, synchronized image acquisition with the x-ray pulses, roadmap, fluoroscopy and DSA, flat field correction, brightness and contrast control, last-frame hold in fluoroscopy, looped playback of the acquired images in angiography, automatic brightness control, recursive temporal filtering and LII gain control. Frame rates can be up to 30 fps in full-resolution mode.
2.3.1 Main Panel
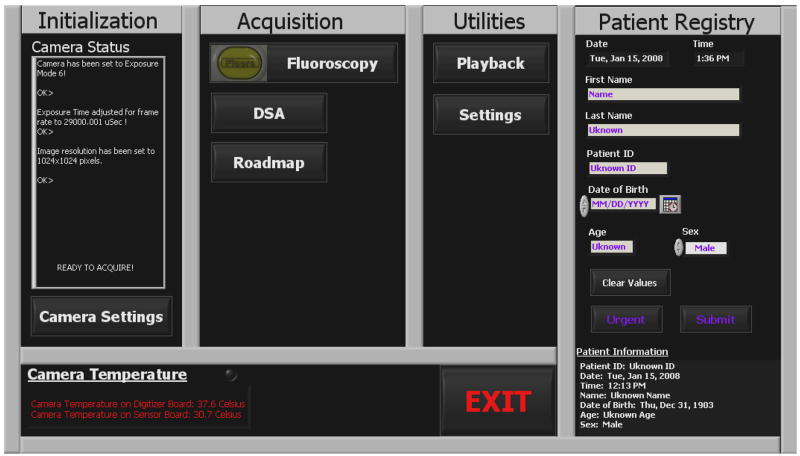
The main panel of the GUI (figure 5) is the first display that appears when the program is started. Firstly, it checks the status of the camera and if the communication between the detector and the camera is confirmed, then it initializes the camera to the default parameters1 and sets the system ready for acquisition. In the case that something is wrong with the camera, such as failure of power, or broken Camera Link communication, then the user is prompt to check the power and cable and restart the GUI. The main panel is divided into four sections: initialization, acquisition, utilities and patient registry. The first three sections can be started from the main panel and they will be described later in the following sections. The patient information can be entered via the patient registry section and is stored along with the imaged data of the particular patient. Important information such as name, patient ID, date of birth, age and sex of the patient can be typed in while the time and date of the procedure is displayed and entered automatically. Acquisition cannot be started unless the patient registry is filled out and submitted. However, in the case of an emergency procedure the angiographer can skip the patient registry form and click the “Urgent” button which automatically fills the form with the time and date and immediately starts the procedure. The rest of the patient’s information can be entered manually after the procedure.
Figure 5.
Main Panel of the GUI
2.3.2 Camera Settings
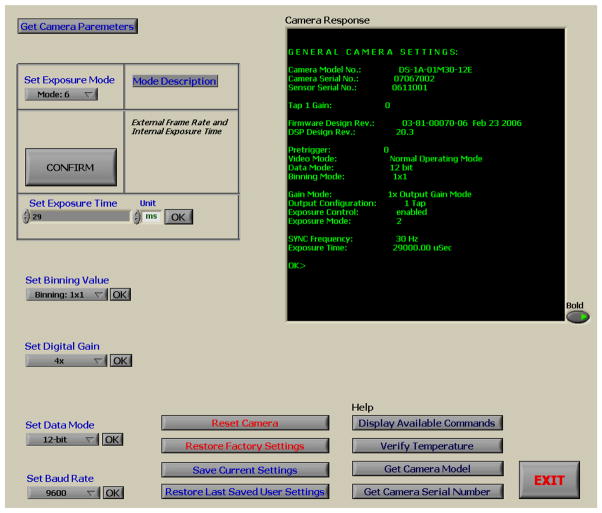
As described above, Camera Settings can be called from the main panel of the GUI or from any acquisition panel (fluoroscopy, roadmap, DSA). The program using a virtual serial port communication interface through the Camera Link cable can select among various exposure modes which vary the exposure time and frame rate using internal or external timing pulses. Binning modes from full resolution down to 8×8, digital gain from 1x up to 4x and bit depth up to 12 bits can be set as well. Any camera parameters that have been changed can be stored on the camera’s hardware for future use while the previous user’s settings as well as the original factory settings can be restored easily anytime. Figure 6 displays a screenshot of the Camera Settings Panel.
Figure 6.
Camera Settings Panel
2.3.3 Image Acquisition and Display
Image acquisition as the most important part of the HSMAF system has the highest priority among all panels of the GUI. When an image acquisition panel (Figure 7) is running, all other panels of the GUI are set to the lowest priority and cannot be accessed until exiting the acquisition panel. Acquisition is synchronized with the x-ray system and starts automatically when the radiographer presses the Angio or Fluoro button and stops when one of the two buttons is released. There are three different modes of acquisition (Fluoroscopy, Roadmap and DSA) which are described below. During any acquisition mode, the images, frame number and frame rate are displayed live. Moreover, LII gain, brightness and contrast, and temporal filtering can be adjusted easily during the procedure in order to optimize the display.
Figure 7.
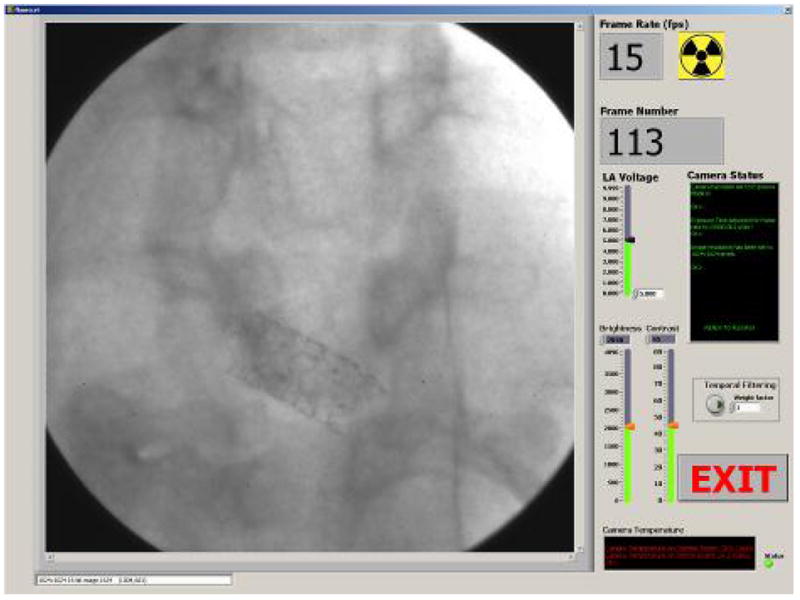
Acquisition Panel
Fluoroscopy: In fluoroscopy mode, images are acquired and displayed in raw format without any processing. High resolution (1k × 1k), high frame rate (30fps) and no lag are three important requirements for fluoroscopic imaging which are all met by the GUI and the HSMAF detector. At the end of each fluoroscopic run the program displays the last acquired frame (last frame hold) and waits for the new run to be acquired. Fluoroscopic images usually do not need to be saved; however, the GUI offers optional saving for experimental purposes. Finally, the “Exit” button returns the program to the Main Panel.
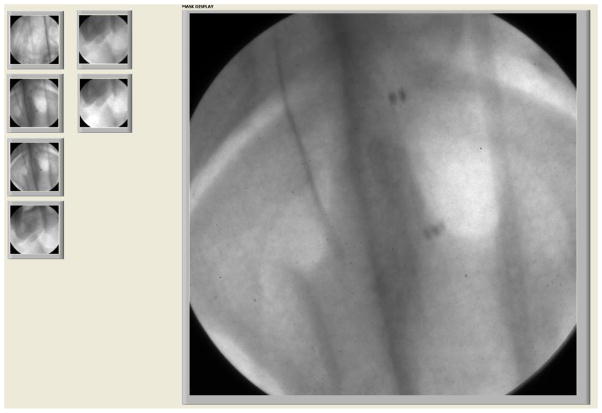
Roadmap: Roadmap display with the ability to change the mask is implemented in the GUI. The mask is calculated during the injection of radiographic contrast media using the peak mask method. Right after the mask calculation, which takes less than a second, the mask is subtracted from acquired images using the multi-division operator2 and the interventionalist can continue the procedure and see the live resulting roadmap of the ROI of the patient. In the case that the patient has not been moved, the GUI offers the ability to use a previously acquired mask in order to avoid the injection of more radiographic contrast media and unnecessary exposure to radiation. A click on the “previous mask” button pops up the Mask Selector panel (Figure 8) which includes all the previously acquired masks of the particular patient for the day of the procedure. The “previous mask” button becomes visible only when previous masks for the current study are available. Roadmap requires on the fly image processing which is a challenging procedure especially when the requirements are high resolution images and high frame rate acquisition. To accomplish this, pipeline coding technique has been implemented in the GUI which allows multiple instructions to be overlapped in execution. More specifically, image processing of the frame that has just been acquired happens simultaneously with the acquisition of the next frame. This allows smart and efficient usage of the processor which enables 12bit 30fps, 1k × 1k, roadmap imaging. Similarly with fluoroscopy, the acquired images can be optionally saved along with the mask of the particular run.
Figure 8.
Mask Selector Panel
DSA: Another important radiographic procedure, DSA, is implemented by the GUI while satisfying all the high-speed and high-resolution requirements which have been discussed in the above paragraph. The average of the first 3 frames of a run is saved as a mask which is subtracted from the following frames. Similarly to the Roadmap mode, mask selection is available as well through the Mask Selector panel (Fig. 8). The resulting DSA is displayed during live acquisition and is automatically saved on the hard disk along with the mask. An adjustable delay between the mask acquisition and DSA can be entered by the user.
2.3.4 ROI-CBCT
Earlier ROI-CBCT technique [9, 10] required rotating-object geometry achieved by using a portable platform [11]. Current HSMAF system setup enables us to acquire ROI-CBCT datasets using standard rotational-DSA settings on the gantry system. After the GUI acquires and saves all the images, a reconstruction algorithm [12] is applied to compute the ROI-CBCT slices. Figure 9 shows a projection image of a stent which was acquired by HSMAF during a rotation of 194 degrees. Figure 10 shows two views of the HSMAF system setup while it was being used for ROI-CBCT acquisition.
Figure 9.
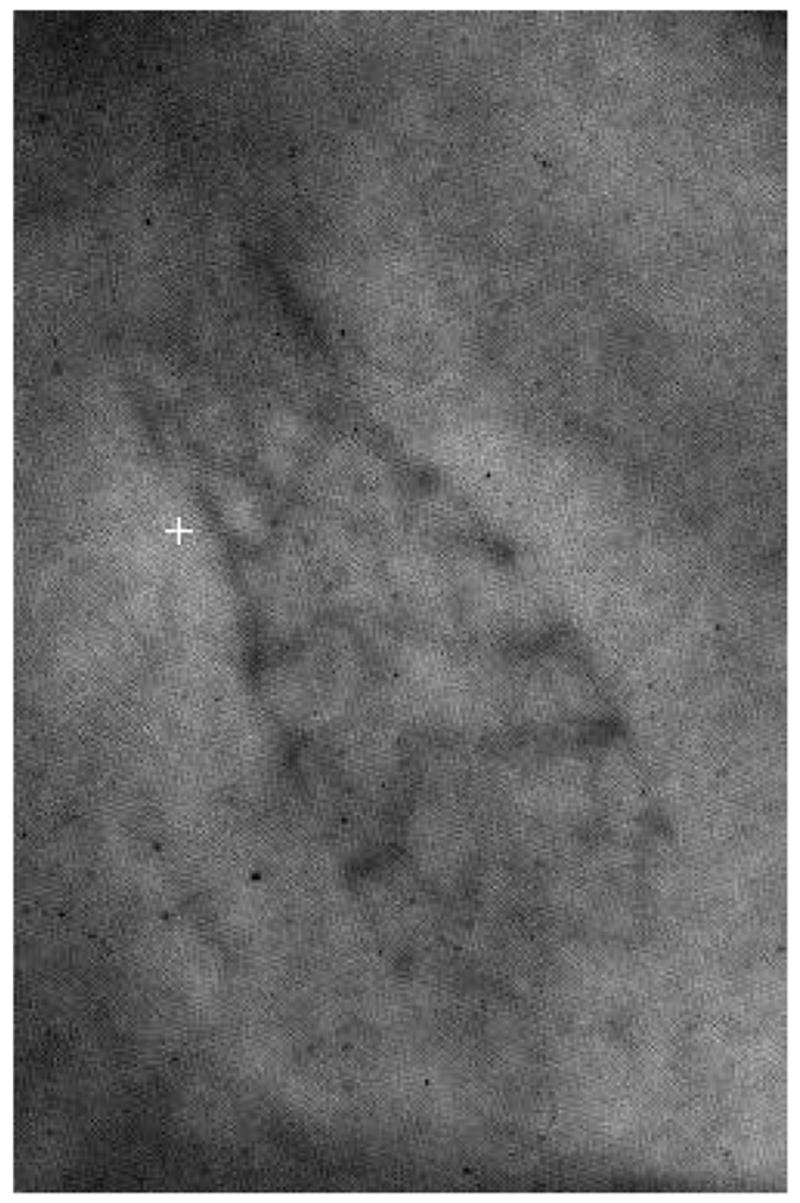
Projection image of a stent placed in a rabbit during ROI-CBCT acquisition
Figure 10.
HSMAF system in horizontal and vertical angles during ROI-CBCT acquisition of a stent in a rabbit.
2.3.5 Playback
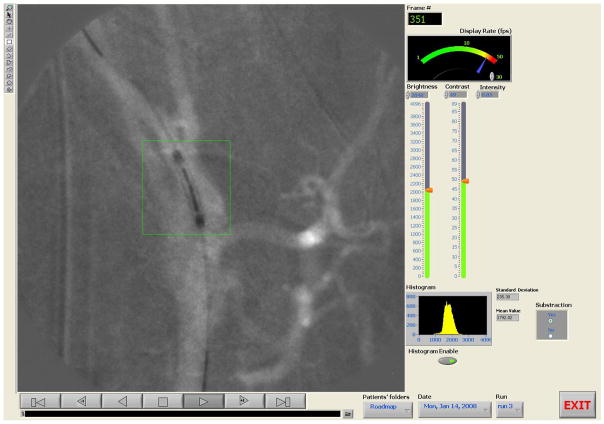
Immediately after the end of any of the above radiographic procedures, the “Playback” panel (figure 11), with the acquired images, are automatically displayed as a sequence in a film loop. The sequence can be paused, stepped to the previous or next frame and displayed in forward or reverse order. One can go to the end or the beginning of the image sequence at any time during playback by using the appropriate playback buttons. The rate of displaying the images can be adjusted by dragging the needle of the “Display Rate” controller. Moreover, the user can adjust the brightness and contrast by using the slide bars on the right side of the “Playback” panel. Histograms of the images can be calculated and displayed next to the images if the “histogram” button is enabled. The histogram of an ROI, along with the mean value and standard deviation can be simply calculated by selecting one of the drawing tools from the drawing palette toolbox which is located at the left side of the display and drawing the shape of the ROI using the mouse. Resolution of the image, bit depth, actual pixel values and their position on the image are displayed at the image information text box which appears below the display upon user selection.
Figure 11.
Playback Panel
2.3.6 Image Correction
Flat field or gain and offset correction is done by the program during acquisition or playback. The corrected image (IC) is calculated by the following equation which is implemented in the LabVIEW program.
IC: Corrected Image.
IA: Acquired Image.
ID: Dark Image. (Nothing in the field of view, no x-rays)
IF: Flat Image (Nothing in the field of view x-rays in the range of 60–120 kVp.)
: is the average of all pixel values of the dark-image corrected flat image.
Flat field correction is essential to remove artifacts from the images that are caused by variations in the pixel-to-pixel sensitivity of the detector. This correction also helps to get rid of the chicken-wire artifact which is caused by the fiber optic taper. The program uses the flat and dark images which are pre-acquired and saved on the hard disk. The user has the option to save the acquired images corrected or uncorrected or both.
2.3.7 Temporal Filtering
Temporal filtering with operator selectable recursive weighting is available during acquisition and playback [4]. As the weighting factor of the temporal filtering increases, the lag or motion blurring between the images is increased, and the noise is reduced. Thus, the choice of weighting factor depends on the compromise between noise reduction and motion blurring. The real-time recursive filtering can be described by the following equation,
where Sn(i,j) denotes the processed gray level value at pixel coordinate (i,j) of the nth frame in the image sequence, Sn−1(i,j) denotes the processed gray level value at the pixel coordinate (i,j) of the previous frame, Pn(i,j) denotes the incoming unprocessed gray level value, and w denotes a weighting factor that governs the amount of frame averaging. More specifically, the weighting factor controls the proportion of image information from the current frame which is being added into the frame averaged total.
2.3.8 Storage
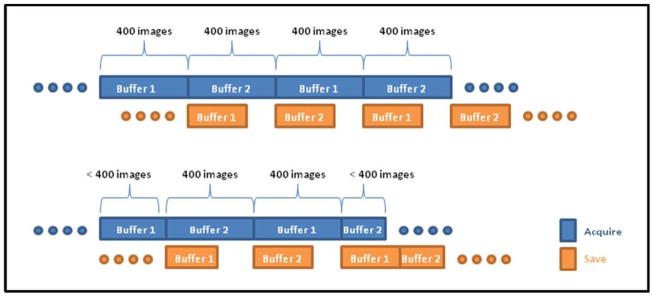
Images are automatically transferred from memory to a temporary location on the hard-disk during acquisition. To accomplish on-the-fly-saving of high resolution images at high frame rates, a double buffer coding technique has been implemented in LabVIEW. Images are saved in independent buffers in blocks of 400 images. While the one buffer is acquiring images from the HSMAF detector, the other buffer, if it contains any images, transfers the images to the hard-disk (4 hard-disks in raid 0 or stripped array configuration). In this way, the GUI takes advantage of the parallel processing ability of LabVIEW software and enables virtually unlimited memory for acquisition and more than enough storage capacity. (Enough for up to six hours of uninterrupted acquisition!) Figure 12 illustrates a timing diagram of the double buffer acquisition. At the end of each run the user is prompted to save or discard the acquired images. If save is selected, the images are automatically transferred to a newly created location, which is identified by the patient ID, date, radiographic procedure and the run number; otherwise they are deleted from the temporary location on the hard-disk.
Figure 12.
Double Buffer acquisition and saving timing diagram.
2.3.9 LII Gain control
The gain of the LII is set by varying its voltage between 0–10V. This voltage is supplied by the analog output module that has been described in section 2.2. The GUI controls this module through the Universal Serial Bus (USB) port by sending the appropriate serial commands. The user can easily adjust the voltage before and during acquisition by changing the value of the “LII voltage” slide bar (Figure 7).
3. RESULTS AND DISCUSSION
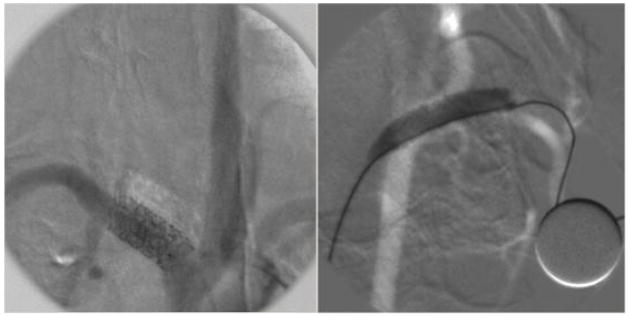
The GUI was used in several interventions on animals [1, 2, 3] and the results demonstrated excellent image quality and software performance [13]. The detector’s high resolution (> 10 lp/mm) offered images in which, small features like the stent strut structures and vessels with very small diameter were visible. Figure 13 shows a roadmap and a DSA image from rabbit experiments. The DSA image displays (with some misregistration of the mask) a stent that was placed in the subclavian artery, and the roadmap image displays a stent being expanded in the carotid artery of the animal.
Figure 13.
DSA (left) and Roadmap (right) images acquired by HSMAF using image subtraction techniques implemented in the LabVIEW GUI. In the DSA image, the stent struts and small markers of a deployed stent are visible. In the roadmapping image a balloon expanded and filled with contrast-media during the stent deployment is visible. Both of these single frame images were acquired at 15 fps.
The reconstruction results of the stent of figure 8 are displayed in figures 14–15.
Figure 14.
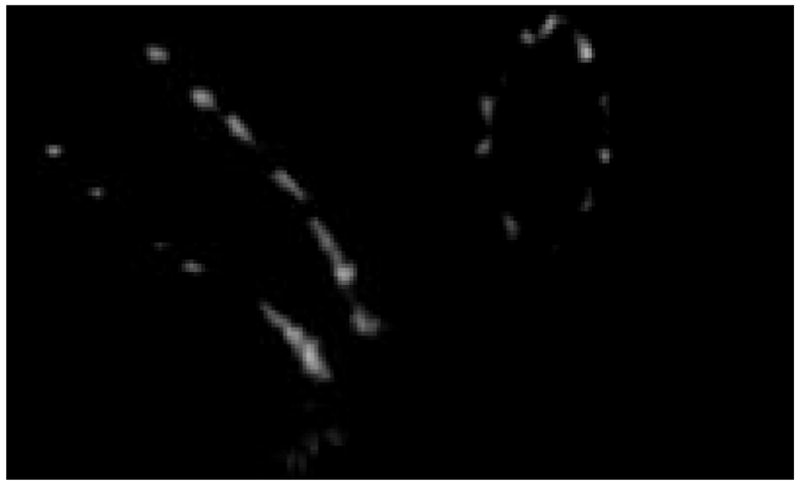
Sagital and axial slices which were created after reconstruction of the projection images of the stent of figure 9
Figure 15.
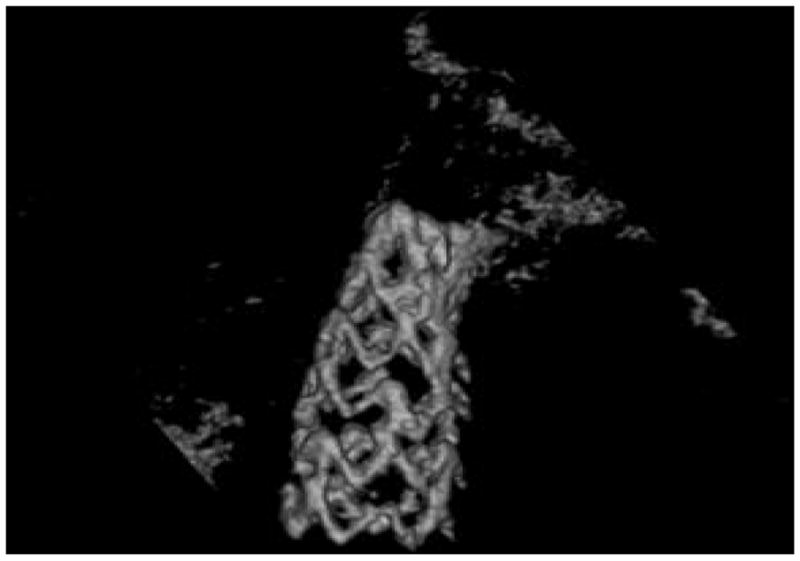
3D rendering computed from the volume backprojected using a ROI-CBCT reconstruction algorithm from the projection images of the stent of figure 9
During all radiographic procedures with the HSMAF detector, the GUI performed well. The GUI’s well-implemented automation and communication with the rest of the system makes conduct of the procedure simpler for the interventionalist. Despite its simple implementation, the program offers quality images, fast frame rates, no motion blurring on the sequence (except for selectable temporal filtering), unlimited acquisition memory and rapid storage of data. Furthermore, it is our group’s first implementation of radiographic software that can acquire and save high-resolution images at 30fps and at the same time combine the above with image correction, subtraction and temporal filtering. Another important feature is the tool for the angiographer to be able to easily access and navigate through the well-organized patient database allowing quick review of images. Lastly, the GUI is built in such a way that it can be used with our new Solid State X-Ray Image Intensifier (SSXII) currently under development as well as future computer-based Micro-Angiographic Detectors.
4. CONCLUSIONS
A new GUI has been developed to control the HSMAF system and provide the angiographer with the following capabilities together for the first time:
High frame rate acquisition and display in high resolution Fluoroscopy, Angiography and rotational DSA modes.
Medical image processing techniques such as roadmapping, DSA and temporal filtering during live display at fast frame rates
Fast and convenient execution of storing high resolution images
With these features, this control and display system provides a practical way to use the HSMAF so that its improved image-quality features can be fully utilized in achieving detailed visualization of small endovascular devices and more accurate image-guided interventions.
Acknowledgments
This work was supported in part by the NIH Grants R01NS43924, R01EB002873 and an equipment grant from Toshiba Medical Systems Corp. that also supplied the new detector support. The authors would also like to acknowledge Mr. Petru M. Dinu for his contribution of designing and building the computer and storage array of the HSMAF system.
Footnotes
Triggering mode with 29ms exposure time, 1×1 binning and 12 bit data mode are chosen as the default settings.
Computes a ratio between mask and acquired images and multiplies by the average of all pixel values of the mask.
References
- 1.Ionita N Ciprian, Yadava Girijesh K, Keleshis Christos M, Hoffmann Kenneth R, Bednarek Daniel R, Jain Amit, Rudin Stephen. In-vivo endovascular image guided interventions (EIGI) using the high-sensitivity microangiographic fluoroscope (HS-MAF) Proc SPIE Medical Imaging. 2008;6918–53 doi: 10.1117/12.770297. in print. [DOI] [PMC free article] [PubMed] [Google Scholar]
- 2.Rudin Stephen, Bednarek Daniel R, Hoffmann Kenneth R. Endovascular image guided interventions (EIGIs) Med Phys. 2008;35(1):301–309. doi: 10.1118/1.2821702. [DOI] [PMC free article] [PubMed] [Google Scholar]
- 3.Ionita N Ciprian, Rudin Stephen, Hoffmann Kenneth R. Microangiographic image-guided localization of a new asymmetric stent for treatment of cerebral aneurysms. Proc SPIE. 2005;5744:354–365. doi: 10.1117/12.594789. [DOI] [PMC free article] [PubMed] [Google Scholar]
- 4.Yadava G. Development and evaluation of a new High Sensitivity, Region-of-Interest, x-ray imaging system for neuro-interventional applications. Ph. D. Dissertation submitted to Department of Physics, SUNY/Univ; Buffalo: 2007. pp. 52–65. [Google Scholar]
- 5.Kuhls-Gilcrist Andrew T, Yadava Girijesh K, Patel Vikas, Jain Amit, Bednarek Daniel R, Rudin Stephen. The solid-state x-ray image intensifier (SSXII): an EMCCD-based x-ray detector. Proc SPIE Medical Imaging. 2008;6913–19 doi: 10.1117/12.772724. in print. [DOI] [PMC free article] [PubMed] [Google Scholar]
- 6.Rudin Stephen, Kuhls Andrew T, Yadava Girijesh K. New light-amplifier-based detector designs for high spatial resolution and high sensitivity CBCT mammography and fluoroscopy. Proc SPIE. 2006;6142:61421R. doi: 10.1117/12.649501. [DOI] [PMC free article] [PubMed] [Google Scholar]
- 7.Kuhls Andrew T, Patel Vikas, Ionita Ciprian. New microangiography system development providing improved small vessel imaging, increased contrast-to-noise ratios, and multiview 3D reconstructions. Proc SPIE. 2006;6142:61423M. doi: 10.1117/12.653654. [DOI] [PMC free article] [PubMed] [Google Scholar]
- 8.Kuhls Andrew T, Yadava Girijesh, Patel Vikas. Progress in electron-multiplying CCD (EMCCD) based high-resolution high-sensitivity x-ray detector for fluoroscopy and radiography. Proc SPIE. 2007;6510:65101C. doi: 10.1117/12.713140. [DOI] [PMC free article] [PubMed] [Google Scholar]
- 9.Chityala RN. Region of Interest Cone Beam Computed Tomography (ROI-CBCT) Ph. D. Dissertation submitted to Department of Mechanical and Aerospace Engineering, SUNY/Univ; Buffalo: 2007. [Google Scholar]
- 10.Chityala R, Hoffmann KR, Rudin S. Region of interest (ROI) computed tomography (CT): comparison with full field of view (FFOV) and truncated CT for a human head phantom. Proc SPIE. 2005;5745:583–590. doi: 10.1117/12.595430. [DOI] [PMC free article] [PubMed] [Google Scholar]
- 11.Rangwala H, Chityala R, Rudin S, Hoffmann K. A Portable Test Platform for Image Acquisition and Calibration for Cone Beam Computed Tomography (CBCT) and Region of Interest CBCT (ROI-CBCT) On a Commercial X-Ray C-Arm System. Medical Physics. 2006;33(6):1997–1998. [Google Scholar]
- 12.Feldkamp LA, Davis LC, Kress JW. Practical cone-beam algorithm. J Opt Soc Am A. 1984;1:612. [Google Scholar]
- 13.Yadava Girijesh K, Rudin Stephen, Kuhls-Gilcrist Andrew T, Bednarek Daniel R. Generalized objective performance assessment of a new high-sensitivity microangiographic fluoroscopic (HSMAF) imaging system. Proc SPIE Medical Imaging. 2008:6913–29. doi: 10.1117/12.769808. in print. [DOI] [PMC free article] [PubMed] [Google Scholar]


