

Summary
Cadherin-mediated cell adhesion is achieved through dimerization of cadherin N-terminal extracellular (EC1) domains presented from apposed cells. The dimer state is formed by exchange of N-terminal β-strands and insertion of conserved tryptophan indole side chains from one monomer into hydrophobic acceptor pockets of the partner molecule. The present work characterizes individual monomer and dimer states and the monomer-dimer equilibrium of the mouse Type II cadherin-8 EC1 domain using NMR spectroscopy. Limited picosecond-to-nanosecond timescale dynamics of the tryptophan indole moieties for both monomer and dimer states are consistent with well-ordered packing of the N-terminal β-strands intramolecularly and intermolecularly, respectively. However, pronounced microsecond-to-millisecond timescale dynamics of the side chains are observed for the monomer, but not the dimer, state, suggesting that monomers transiently sample configurations in which the indole moieties are exposed. Dimer formation is favored at low pH and by the presence of calcium, indicating a role for calcium in the strand swapping mechanism. The results are discussed in terms of possible kinetic mechanisms for EC1 dimerization.
Introduction
Classical cadherins are calcium-dependent cell-adhesion molecules. Cadherins are expressed in most vertebrate tissues and contribute to static somatic integrity and dynamic developmental processes, such as embryonic morphogenesis, tissue specification and neuronal circuit patterning (Halbleib and Nelson, 2006; Patel et al., 2003; Shapiro et al., 2007; Takeichi, 1991, 2007). Mature forms of classical cadherins are comprised of five extracellular immunoglobulin-fold domains (EC1-EC5) anchored at the cell surface by a transmembrane domain. The ectodomain structure is rigidified by binding of calcium ions to interdomain linker regions between EC domains (Nagar et al., 1996). Molecules from opposing cells engage in specific homophilic adhesive “trans” interactions mediated by the N-terminal EC1 domains (Boggon et al., 2002; He et al., 2003; Nose et al., 1990). The EC1-EC1 dimer interface is formed by exchange or “swapping” of N-terminal β-strands, denoted the A*-strands, which leads to the insertion of one (W2, Type I cadherins) or two (W2 and W4, Type II cadherins) tryptophan side chain indole groups, respectively, into the hydrophobic core of the adhesive partner (Patel et al., 2006; Shapiro et al., 1995). Dimer dissociation constants for E-cadherin have been measured by analytical ultracentrifugation and NMR titrations, with a range of values between 60 μM (Chappuis-Flament et al., 2001) and 0.72 mM obtained in the presence of calcium, and up to 10 mM in the absence of calcium (Haussinger et al., 2004).
The strand-exchange mechanism for cadherin dimerization represents an instance of “3D domain-swapping” (Bennett et al., 1994; Liu and Eisenberg, 2002), and has important consequences for homophilic adhesion of cadherin molecules. The free energy difference between the monomer and dimer states is necessarily small, because the interface is similarly satisfied in closed monomer and strand-swapped dimer states. Theoretical analysis suggests that specificity of cell adhesion is the result of weak interactions between cadherin molecules, combined with small effective concentrations (∼10 μM) of cadherin molecules at the cell surface (Chen et al., 2005).
Type I cadherin EC domains have been studied in solution by NMR spectroscopy. The NMR structure of monomeric E-cadherin EC1 is homologous to X-ray structures, exhibiting the key features of an immunoglobulin-like fold (Overduin et al., 1995). Structural and dynamical studies of a construct consisting of the first two domains (EC1-EC2) of E-cadherin (ECAD12) also have been reported (Haussinger et al., 2004). The off-rate and bimolecular on-rate constants for dimer formation were measured using chemical exchange NMR experiments to be 0.7 s−1 and 0.9 mM−1 s−1, respectively, under calcium-saturated conditions at 25 °C (Haussinger et al., 2004). On the basis of the kinetic on-rate constant, Haussinger and co-workers estimated an activation barrier to dimer formation of 29.3 kJ mol−1, relative to the diffusion-controlled molecular collision rate, on the order of 108M−1 s−1.
The present work uses solution NMR spectroscopy to investigate the mechanism of dimer formation by the N-terminal domain EC1 (residues 1-98) of mouse Type II cadherin-8 (denoted 8ec1). Both type I (Shapiro et al., 1995) and type II (Patel et al., 2006) EC1 domain cadherin constructs have been shown in numerous crystal structures to dimerize through a strand swap mechanism both in the presence and absence of calcium ions (Patel et al., 2006). The single-domain 8ec1 construct used here is identical to the construct used for crystallographic structure determination by Patel and co-workers (Patel et al., 2006). This construct, being a single EC1 domain, does not have an intact Ca++ binding site although two of the Ca2+ binding ligands (E12 and D98) are within the domain. In EC1-EC2 constructs inter-domain linker residues and residues from the EC2 domain also contribute to coordination of Ca2+ (Nagar et al., 1996; Patel et al., 2006).
The dimer state observed in solution is consistent with the strand-swapped configuration observed crystallographically. The kinetic off-rate (0.29 ± 0.03 s−1) and bimolecular on-rate (0.35 ± 0.05 s−1 mM−1), measured in the absence of calcium, are comparable to those observed for the Type I E-cadherin two-domain construct, ECAD12 (Haussinger et al., 2004). NMR spin relaxation measurements for the 15Nε1 spins suggest a predominantly closed strand configuration for monomer and dimer A*-strands, on the picosecond-to-nanosecond (ps-ns) timescale. However, chemical exchange broadening of the 15Nε1 spins, and solvent exchange of the 1Hε1 spins, indicate that the monomer indole groups are dynamic on the microsecond-to-millisecond (μs-ms) timescale, while the dimer indole groups are not. The dynamics of the monomer indole moieties are likely to reflect strand exposure. These results suggest a selected-fit mechanism for dimer formation involving single EC1 domains, where strand-exposed monomers associate via a diffusion-controlled process, to form the strand-swapped dimer state. Calcium and low pH favor dimer formation but they do not affect the rate of formation of the open monomer state. A possible relationship between these results and the dimerization properties of EC1-EC2 constructs also is discussed.
Results
Monomer-dimer equilibrium
Two sets of resonances are present in the 1H-15N-HSQC spectrum of 8ec1 at pH 5.5 [Figure 1]. The two sets arise from monomer and dimer states, based on concentration dependence, ZZ-exchange experiments (vide infra), and rotational correlation times (τm) of 7.1 ns and 11.6 ns, respectively, calculated from the ratio of R2 and R1 relaxation rate constants obtained for amide 15N spins at 300 K, pH 5.5. The dimer is populated preferentially at lower solution pH values, and also is favored by increased calcium concentration [Figure 2]. Addition of calcium does not significantly alter the chemical shifts of the majority of resonances, but does perturb the chemical shifts of some residues (E11, E12, and F13) in the dimer-state A*-strand and the monomer-state Trp4 indole. Dimer state chemical shifts of E12, Q97, and D98 are perturbed in response to both pH and calcium, but not concentration.
Figure 1.

8ec1 1H-15N HSQC spectrum at pH 5.5, 300 K. Monomer (red contours) and dimer (black contours) residues X are designated Xm and Xd respectively. The inset of the indole region shows unassigned resonances (labeled a and b) associated with minor populations of the dimer state.
Figure 2.

Concentration dependence, and the effect of pH and calcium, at 300 K. Dilution series of 8ec1 shows concentration dependence of monomer and dimer states in solution, at pH6.4 in the absence of calcium (Top Panels). Lowering the buffer pH, at a protein concentration of 0.3 mM, in the absence of calcium, decreases the monomer-dimer Kd (Middle Panels). The addition calcium, at a protein concentration of 0.1 mM at pH 6.4 also decreases the monomer-dimer Kd (Lower Panels).
Backbone resonance assignments were obtained under conditions (pH 5.5) that favor the dimer state. For clarity in the following, residues in the monomer and dimer states are designated Xm and Xd, in which X is the residue identifier. Assignments for the dimer state initiate at W2d and are 95 % complete. A monomer state resonance could be identified for 35 % of the residues. In some cases, monomer resonances are overlapped with the dimer resonances. The A*-strand could not be assigned in the monomer state. Furthermore, monomer assignments are not complete, even under conditions that favor the monomer state (pH 7.5), regardless of the presence of calcium. Broadened and missing resonances for the monomer state are attributed to chemical exchange broadening (vide infra).
The 8ec1 monomer-dimer equilibrium dissociation constant at pH 6.0, 306.6 K was obtained from the respective resonance amplitudes aM and aD in a fully relaxed 1H-15N-HSQC spectrum (Eq. [1]). In the absence of calcium, Kd = 0.84 ± 0.15 mM; addition of 15 mM calcium lowers the dissociation constant to Kd = 0.11 ± 0.04 mM.
The pH dependence of the monomer-dimer equilibrium dissociation constant in the absence of calcium also was measured by analytical ultracentrifugation (AUC). The results are shown in Table I.
Table I.
Dissociation constants for 8ec1 at 300 K in absence of calcium.
| pH | 5.0 | 5.5 | 6.0 | 6.5 | 7.0 |
|---|---|---|---|---|---|
| Kd (mM) | 0.064 | 0.14 | 1.24 | 39.7 | 389 |
Dimer state is strand-swapped
The 8ec1 crystal structure (1ZXK) is a strand-swapped dimer, and predicts specific W2dHε1-S90dHN intermolecular, and W4dHε1-W2dHN intramolecular NOE contacts. The average distances between these spin pairs, 3.9 ± 0.1 Å and 4.7 ± 0.2 Å, respectively, were estimated after adding hydrogens to the structure in silico. Dimer state indole resonances were assigned via the specific W2dHε1-S90dHN and W4dHε1-W2dHN contacts in a 1H-15N HSQC-NOESY experiment [Figure 3]. Monomer state indole resonances were assigned from the dimer assignments by ZZ-exchange cross-peaks at 295 K (not shown). To confirm the intermolecular nature of the W2Hε1-S90dHN contact, a 15N-edited / 15N-filtered 1H-1H NOE experiment (Wider et al., 1990) was recorded for a sample equally composed of 14N and 15N labeled molecules [Figure 3]. The specific intermolecular NOE is present in the filtered experiment. This result demonstrates that the dimer state observed in solution is consistent with the strand-swapped 8ec1 crystal structure, in which the tryptophan side chains are docked in the hydrophobic pocket of the partner molecule.
Figure 3.
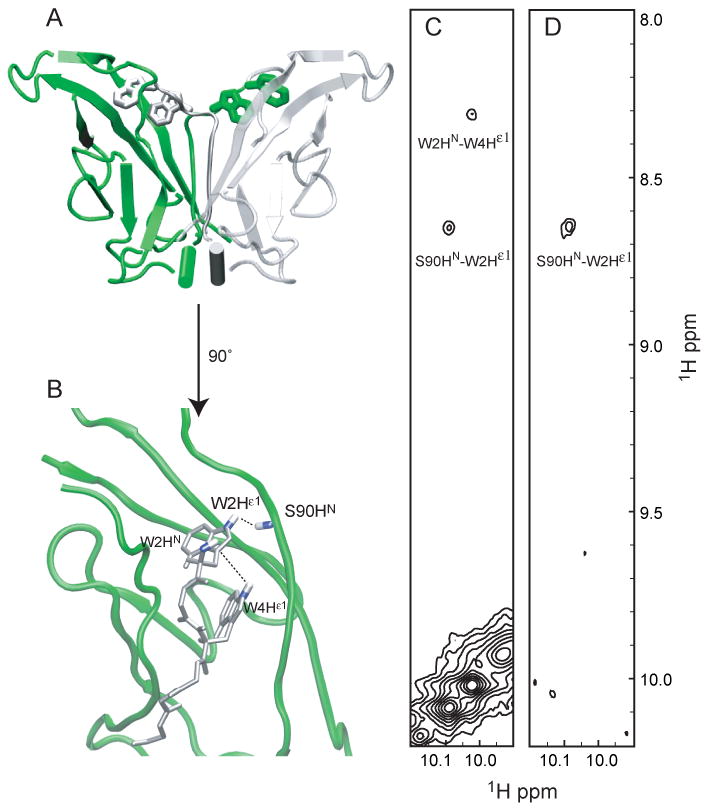
The strand-swapped dimer state is confirmed by an F1-edited / F2-filtered NOE experiment. The structure of the strand-swapped 8ec1 dimer is shown in panel A, with invading A*-strand in predicted inter and intramolecular NOEs in panel B. The 1H-1H NOE experiment (panel C) confirms the predicted NOEs. The dimer-specific intermolecular W2Hε1-S90HN NOE cross-peak is present in the F1-edited / F2-filtered NOE experiment (panel D).
Monomer-dimer kinetics
Monomer and dimer state resonances that are resolved the HSQC spectrum are in slow exchange on the chemical shift time scale. A 15N ZZ-exchange experiment was used to measure the kinetics of dimer formation and dissociation using these resonances as probes (Farrow et al., 1994; Palmer et al., 2001).
The 8ec1 monomer-dimer equilibrium in the absence of calcium at pH 6.0, 306.6 K is described by kinetic rate constants, koff = 0.29 ± 0.03 s−1 and kon = 0.35 ± 0.05 s−1 mM−1 determined by a fit of Eq. [2] to data for six well-resolved monomer/dimer resonance pairs [Figure 4]. Comparison of the kinetic on-rate constant to the diffusion-controlled molecular collision rate, on the order of 108 s−1 M−1 at 306.6 K, suggests an estimate of the activation barrier to dimer formation, ΔG‡ = 32.0 ± 0.4 kJ mol−1. However, an estimate of the diffusion-controlled on-rate, on the order of 105 – 2·106 s−1 M−1, is more consistent with site-specific constraints, and suggests an activation barrier, ΔG‡ ∼ 14.4 − 22.1 kJ mol−1 (Northrup and Erickson, 1992; Schreiber and Fersht, 1996).
Figure 4.

Monomer-dimer interconversion via ZZ-exchange in the absence of calcium at pH 6.0, 306.6 K. The spectra show the build-up of exchange cross peaks for Val78. The time behavior of the auto-peaks and cross-peaks for six residues (E17 – green, G41 – blue, Q49 – red, E66 – magenta, A69 – black, A75 – orange) were determined using a composite peak intensity ratio and simultaneously fit using Eq. 1 (solid line). The best fit value ζ = 0.13 ± 0.02 s−2.
Addition of 15 mM calcium decreases the off-rate constant, koff = 0.19 ± 0.03 s−1, and increases the on-rate constant, kon = 1.74 ± 0.53 s−1 mM−1. The changes in rate constants in the presence of calcium suggest a reduction of the activation barrier by 4.1 ± 1.3 kJ/mol and a stabilization of the dimer state by 3.0 ± 1.3 kJ/mol.
Tryptophan indole resonances as a probe of the A*-strand
Tryptophan residues W2 and W4 are prominent features of the strand-swapped interface and convenient probes of the A*-strand conformation. The intensity of the W2m indole resonance is dependent on the sample temperature, and is undetectable at 300 K, [Figure 5]. Hence, relaxation data were acquired at 281.5 K, so as to observe monomer and dimer states concurrently. Lower bounds for the monomer and dimer state lifetimes are estimated to be 30 s and 7 s, respectively, in a ZZ-experiment at 281.5 K (not shown); consequently, monomer-dimer averaging does not confound relaxation measurements for the respective states.
Figure 5.

Temperature dependence of tryptophan indole resonances. The monomer 15Nε1 resonances are broadened by chemical exchange, while the dimer state resonances are relatively insensitive to temperature. The W2mε1 resonance is essentially undetectable at 300 K.
Picosecond-to-nanosecond timescale dynamics of 15Nε1 spins
Laboratory-frame ps-ns timescale dynamics of the 15Nε1 spins were measured at 281.5 K [Table I]. Dimer state tryptophan indole resonances are not exchange broadened (vide infra). For dimer 15Nε1 spins at 281.5 K, the value of τm = 21.6 ± 0.5 ns derived from the R2/R1 ratio is consistent with the value at 300 K derived from the R2/R1 ratio of backbone amide 15NH spins, when scaled for the effect of temperature on rotational diffusion and solvent viscosity, (apparent scale factor = 1.9, theoretical scale factor = 1.8). Monomer state tryptophan indole resonances are exchange broadened at 281.5 K. The value of τm = 12.8 ± 0.7 ns was estimated from τm = 7.1 ± 0.1 ns at 300 K using a scale factor = 1.8 ± 0.1. This value of τm predicts R2 = 15.7 s−1, suggesting chemical exchange contributions of 15.4 ± 1.3 s−1 and 4.7 ± 0.8 s−1 for W2m and W4m, respectively at 281.5 K in the absence of calcium. The transverse relaxation rate constants are not significantly changed by addition of 5 mM calcium, yielding estimated exchange contributions of 15.5 ± 2.2 s−1 and 8.2 ± 2.2 s−1 for W2m and W4m, respectively.
The square of the generalized order parameter, S2, was calculated directly from the reduced spectral densities, J(0.87ωH) and J(ωN), using monomer and dimer correlation times of 12.8 ± 0.7 ns and 21.6 ± 0.5 ns for monomer and dimer states, respectively [Table II]. Using larger values of τm for the monomer state leads to S2 values closer to unity. The values of S2 suggest high rigidity of the 15Nε1 spins on ps-ns timescale, for both monomer and dimer states, consistent with packing of the indole moieties into the hydrophobic core of the molecule.
Table II.
15Nε1 relaxation and dynamics parameters at pH 6.25, 281.5 K, and 14.1 T.
| 15Nε1 spin | Calcium-Free | 5 mM Ca2+ | |||
|---|---|---|---|---|---|
| NOE | R1 (s−1) | S2 | R2 (s−1) | R2 (s−1) | |
| W2m | 0.76 ± 0.04 | 0.92 ± 0.04 | 0.96 ± 0.06 | 32.5 ± 1.2
[31.1 ± 1.3] |
[31.2 ± 2.2] |
| W2d | 0.76 ± 0.05 | 0.56 ± 0.02 | 0.96 ± 0.04 | 24.5 ± 0.3
[21.8 ± 1.0] |
[23.0 ± 0.4] |
| W4m | 0.75 ± 0.02 | 0.84 ± 0.04 | 0.88 ± 0.06 | 22.6 ± 0.8
[20.4 ± 0.8] |
[23.9 ± 2.2] |
| W4d | 0.73 ± 0.04 | 0.52 ± 0.02 | 0.89 ± 0.04 | 22.9 ± 0.2
[24.7 ± 0.7] |
[23.2 ± 0.4] |
NOE and R1 measurements used 0.65 mM 8ec1. R2 measurements are reported for both 0.65 mM and 0.30 mM 8ec1 in the absence of calcium and for 0.3 mM 8ec1 in the presence of 5 mM calcium; R2 results for 0.3 mM 8ec1 are shown in square brackets. Values of S2 were obtained from the NOE and R1 data using τm = 12.8 ± 0.7 ns and 21.6 ± 0.5 ns, for monomer and dimer states, respectively, as discussed in the text.
Microsecond-to-millisecond timescale dynamics of 15Nε1 spins
Elevated CPMG R2 transverse relaxation rate constants observed for the monomer 15Nε1 spins suggest a chemical exchange contribution to transverse relaxation, on the μs-ms timescale [Table II]. Dilution experiments show that exchange broadening is not concentration dependent, and therefore represents an intramolecular process. Relaxation dispersion, a dependence of R2 on the pulsing rate in the CPMG pulse train, is observed for the monomer but not dimer spins [Figure 6]. A two-site exchange model, Eq. [6], described by the Carver-Richards equation (Carver and Richards, 1972), was globally fit to both W2m and W4m dispersion curves acquired at 11.7 and 14.1 T. Kinetic exchange rate, relative populations, and chemical shift differences of major and minor states are reported in Table III. The exchange regime is not sufficiently slow (kex < 1000 s−1) to deviate from a description by a single exponential, nor is the population of minor state sufficiently large (pminor > 5 %) to introduce significant errors in the fitted kex parameter as a result of assuming identical major and minor state R20 rate constants (Ishima and Torchia, 2006; Tollinger et al., 2001).
Figure 6.

CPMG relaxation dispersion of tryptophan indole 15Nε1 spins at 281.5 K. Data was acquired at 11.7 (open symbols) and 14.1 (closed symbols) T, for W2m (red - top curves) and W4m (black - lower curves). The monomer (A), but not dimer (B) state displays relaxation dispersion. (A) Dashed and solid lines show the globally fitted results for data acquired at 11.7 T and 14.1 T, respectively, using the general two-site Carver-Richards CPMG expression (Carver and Richards, 1972). The point at τcp = 6 ms was withheld from the fit, due to larger uncertainty. (B) Dashed and solid lines show the mean values for data acquired at 11.7 T and 14.1 T, respectively. Fitted results are presented in Table III.
Table III.
15Nε1 relaxation dispersion parameters at pH 6.25, 281.5 K.
| 15Nε1 spin | kex (s−1) | Pminor (%) | Δω (ppm) | *R20 (s−1) | *Rex (s−1) |
|---|---|---|---|---|---|
| W2m | 1364 ± 479 | 3.2 ± 0.4 | 5.8 ± 0.7 | 22.3 ± 1.6 | 12.5 ± 2.2 |
| W4m | ″ | ″ | 3.1 ±0.4 | 18.8 ± 1.5 | 3.9 ± 1.6 |
Relaxation dispersion parameters obtained from fitting the Carver-Richards equation (Carver and Richards, 1972) to the relaxation dispersion profiles shown in Figure 6. Values reported with (*) refer to parameters fit at 14.1 T. The value of Rex is reported for a τcp = 1 ms CPMG pulsing rate.
The extracted parameters indicate that the monomer species major state interconverts with a (3.2 ± 0.4) % minor state population with a forward rate constant of 44 ± 16 s−1 and the reverse rate constant of 1320 ± 460 s−1. The minor state population corresponds to a destabilization of minor state, ΔG = 8.1 ± 0.3 kJ mol−1. Because the W2Nε1 resonance has a larger degree of exchange broadening and is observed upfield of W4Nε1, the minor state conformers are expected to have downfield chemical shifts of 134.4 ppm and 132.2 ppm, respectively. The minor conformer chemical shifts are not explained by assuming a random coil conformation for the minor state, either taken as the mean of the Trp Nε1 chemical shift distribution (129.5 ppm) from the RefDB database (Zhang et al., 2003), or measured experimentally (130.5 ppm) in unstructured penta-peptides (Schwarzinger et al., 2001).
Monomer hydrogen-deuterium exchange
To further investigate the relationship between the observed dynamics and strand opening, hydrogen - deuterium (H-D) exchange was performed at 276 K, 11.7 Tesla [Figure 7]. The separation between experiments was 20 min. The exchange rate for the W2m resonance is estimated as kHDex = 0.036 ± 0.014 min−1, on the basis of the first two experiments, (3-to-23 min and 23-to-43 min). A repeat experiment yielded a similar estimate for kHDex. The EX2 limit is obtained under the present experimental conditions of low temperature and moderately acidic pH. A predicted random coil exchange rate of tryptophan indole Hε1 protons, krc = 0.63 min−1, suggests ΔG = 6.6 ± 0.9 kJ mol−1 between open and closed states (Bai et al., 1993; Krishna et al., 2004).
Figure 7.

Hydrogen-deuterium exchange of W2mHε1 at 276 K. (A) 1H-15N spectrum of 8ec1 tryptophan indole region of a spectrum recorded in H2O. (B,C) 1H-15N spectra of the 8ec1 tryptophan indole region of spectra recorded in 20 minutes each, starting at (B) 3 minutes and (C) 23 minutes after dissolving a sample in D2O. Insets in (B) and (C) show 1H cross-sections through the W2mε1 resonance. Positive and negative contours are colored black and red, respectively.
The accuracy of this measurement of ΔG is complicated by exchange with the dimer state during the experiment. The monomer – dimer ratio is approximately 4:1, under the experimental conditions. Assuming a completely protected dimer state would lower the estimate of the activation barrier to ΔG = 5.0 ± 0.7 kJ mol−1. Hence, the reported value should be considered an approximation to the true equilibrium between open and closed states of the molecule.
The H-D exchange data show that the monomer A*-strand can sample solvent-exposed states, contrasting the rigidity observed on the ps-ns timescale. While this experiment was performed at lower temperature, to reduce the solvent exchange rate, compared to relaxation dispersion experiments, the ΔG value obtained from H-D exchange is on the order of that obtained from relaxation measurements, arguing that the chemical exchange and H-D exchange observed for the monomer 15Nε1 spins both result from A*-strand opening in the monomer state.
Discussion
Cadherin interactions mediate cellular adhesive properties. Specificity at the cellular level has been suggested to result from low-affinity molecular interactions, a consequence of the “3D domain swapping” interaction of cadherin homodimers (Chen et al., 2005). Reciprocal exchange of N-terminal β-strands provides a specific interaction surface for dimerization but limits the free energy difference between monomer and dimer states. Closed monomer, strand-exposed intermediate monomer, and strand-swapped dimer are postulated to describe possible states of the cadherin EC1 domain.
NMR spectroscopic evidence demonstrates that open monomer, closed monomer, and A*strand-swapped dimer states of the Type II cadherin-8 EC1 domain (8ec1) are in equilibrium in solution, at buffer pH values ranging from 5.5 – 6.5 and sample temperatures ranging from 276 – 306 K. The 8ec1 dimer state is consistent with the strand-swapped configuration, observed in crystal structures, on the basis of a specific intermolecular NOE contact. Spin relaxation measurements for 15Nε1 spins suggest that the monomer indole side chains are equally rigid as the strand-swapped dimer side chains on the ps-ns timescale. Hence, the monomer A*-strand is not solvent exposed to a significant extent, but rather docked within the monomer hydrophobic pocket, on the ps-ns timescale. This result is consistent with the closed monomer conformation reported for the Type I, E-cadherin two-domain construct (ECAD12), based on intramolecular NOE contacts and limited ps-ns timescale dynamics (Haussinger et al., 2004).
The monomer dimer equilibrium constant for 8ec1 obtained from NMR depends on pH and calcium concentration. The KD at pH 6 is 0.84 mM in the absence of calcium, but binding is significantly tighter (0.11 mM) in the presence of 15 mM calcium. AUC measurements at pH 6 yield a value similar to that obtained from NMR, 1.2 mM, while at pH 5.5 the KD is reduced to 0.14 mM, which is close to that observed at pH 6 in the presence of calcium. Although the source of these effects is unclear, partial occupancy of the calcium half-site may favor dimerization in the presence of calcium. Indeed Ca2+ analogs such as ytterbium bind at the EC1 domain “half-sites” (Shapiro et al., 1995), so that Ca2+ binding at this half-site may partially recapitulate the effects of calcium binding at intact cadherin sites. The effect of low pH is likely to mimic the effects of calcium binding by neutralizing liganding residues. This is consistent with the observation that the dimer state chemical shifts of the liganding residues, E12, Q97, and D98 are perturbed in response to both pH and calcium, but not concentration.
The fact that EC1 constructs alone can dimerize with affinities in the range of two domain constructs, and that dimerization is driven by calcium and low pH suggests that calcium ions play a role in cadherin function that goes beyond rigidifciation of multidomain structure. Rather, calcium and low pH appear to stabilize the dimer state through a still unidentified mechanism that appears to involve neutralization of liganding residues.
The major result of the present work is that the monomer state A*-strand is dynamic on the μs-ms timescale. Relaxation dispersion behavior of the monomer tryptophan 15Nε1 spins demonstrates that a low population (pm = [3.2 ± 0.4] %) is in slow-to-intermediate exchange (kex = 1364 ± 479 s−1) with the monomer major state in the absence of calcium at 281.5 K. This exchange process is attributed to sampling of exposed strand conformations, consistent with H-D exchange measurements for W2m Hε1. Addition calcium stabilizes the transition state for dimer formation and the dimer state to nearly the same degree, but does not affect exchange broadening of the monomer state W2 and W4 Nε1 spins associated with the rate of formation of the open monmer state.
Two distinct mechanisms for dimer formation are discussed in the Experimental Procedures section. In the pre-existing equilibrium or selected-fit mechanism, collisions between reactive strand-exposed molecules lead to the strand-swapped dimer state. In the induced-fit mechanism, closed molecules associate to form an initial encounter complex and then subsequently swap A*-strands, to form the strand-swapped dimer state.
The selected-fit mechanism predicts an activation barrier over a diffusion-controlled process limited by ΔG‡ = 2RT loge(pm), where pm is the population of the strand-exposed state, R = 8.314 J mol−1K−1, and T is the temperature. The population of the strand-exposed state obtained from fitting of relaxation dispersion profiles is 3.2 %, at 281.5 K. In the limiting case where the free energy for strand exposure is not temperature dependent, ΔG = ΔH, the population of the minor state at 306.6 K is expected to be pm = exp(−ΔH/RT) = 0.032 (280/306.6) = 4.3 %. A strand-exposed population of 3.2 - 4.3 % at 306.6 K, predicts a 16.0 -17.5 kJ mol−1 activation barrier to dimer formation, for the selected fit mechanism, which is in reasonable agreement with the midpoint of the estimated range for the activation barrier from ZZ-exchange experiments (∼ 18.3 kJ mol−1).
The alternative induced-fit mechanism for dimer formation is qualitatively considered by analogy of the monomer-dimer equilibrium to a ligand-binding scheme (see Experimental Procedures). The parameter F is used to compare the total initial fluxes through the selected-fit and induced-fit pathways (Eq. [8]). The induced-fit mechanism is expected to be dominant if the population (or lifetime) of an encounter complex is greater than the population (or lifetime) of the strand-exposed state. However, relaxation dispersion of the monomer 15Nε1 spins is not concentration dependent, and relaxation dispersion is not observed for dimer state 15Nε1 spins, suggesting that encounter complex formation between closed monomers does not contribute to the observed dynamics, and is not necessary for dimer formation. Therefore, the selected-fit mechanism is the dominant pathway leading to dimer formation for 8ec1 under the present solution conditions. However, the equilibrium of strand-exposed states in vivo may be modified for multi-domain constructs in the presence of calcium (vide infra).
The present work applies NMR spectroscopic methods sensitive to dynamics at multiple timescales to 8ec1 to investigate the monomer-dimer equilibrium of Type II cadherins. Specifically, the contribution of A*-strand dynamics in the monomer state to formation of the strand-swapped dimer state has been elucidated. While both monomer and dimer state A*-strands are rigid on the ps-ns scale, consistent with packing into respective hydrophobic pockets, a small population of monomer molecules sample strand-exposed states on the μs-ms timescale. This inherent property of the monomer state suggests a selected-fit mechanism, where reactive strand-exposed molecules associate to form the strand-swapped dimer state of Type II cadherin EC1 domains. The existence of a small but significant population of open conformers suggests that some degree of inherent strain in the monomeric closed conformation of the A*-strand may play a role in driving dimerization. The kinetics of dimerization of multi-domain constructs may be different than for single EC1 constructs alone. Non-swapped dimers involving contacts near the calcium site have been observed in a number of crystal structures, including the recently determined structure of T-cadherin suggesting the possibility that such structures may constitute an intermediate in the swapping process (Carlo Ciatto and Lawrence Shapiro, unpublished). However, the underlying dynamical properties of EC1 domains revealed in the present study indicate that at least some of the elements that drive strand-swapped dimerization are inherent properties of the EC1 domain. This conclusion is consistent with a recent computational analysis that identified unique features present only in EC1 domains that favor swapping (Posy, et al.).
Experimental Procedures
Protein Purification
Samples of 8ec1 for NMR spectroscopy were prepared as described previously for x-ray crystallography, with modification for isotopic labeling (Patel et al., 2006). E. coli (Codon Plus, Stratagene Inc.) containing the SUMO-8ec1 expression construct were grown in minimal media (M9), containing [U - 99 %]15N ammonium chloride (Cambridge Isotope Labs, Inc., abbreviated CIL) and/or [U - 99 %]13C-D-glucose (CIL) (Maniatis et al., 1989). Protein expression was induced with 0.2 mM isopropyl-β-D-thiogalactoside (IPTG), at 18 °C. Cells were harvested at 72 hours post induction. Purification of 8ec1 followed the previously published protocol (Patel et al., 2006). This construct contains a Gly1Ser mutation, but has no additional residues added to the N-terminus. A proper length A*-strand is required for functional dimer formation (Harrison et al., 2005); however, the amino-acid type at position 1 need not be conserved and Ser1 is observed in other cadherin molecules (Patel et al., 2006). Mass-spectrometry (MALDI-TOF) was used to confirm the molecular weight of the correctly processed, uniformly 15N labeled protein sample.
Sample Preparation
The sample buffer consisted of 20-50 mM D13-morpholino-ethane-sulfonate (MES), 100 mM NaCl or 500 mM D5-glycine, 0.1 mM ethylene-glycol-tetraacetic-acid (EGTA), 0.02 % sodium azide, 10 % D2O (CIL). The buffer pH range between pH 5.5 – pH 6.5, was utilized to control monomer-dimer equilibrium. Resonance assignments and relaxation experiments used glycine to improved protein solubility at lower pH (over the course of days). Use of glycine did not significantly alter the 1H-15N HSQC spectrum. Initial titrations testing concentration dependence, pH dependence, and calcium dependence, used 100 mM NaCl. Hydrogen-deuterium exchange experiments used 50 mM NaCl instead of glycine, to more closely resemble the conditions specified for reference random-coil exchange rates (Bai et al., 1993). Protein concentration was measured by UV absorbance at 280 nm, by diluting 5 μl of the NMR sample into 500 ul of 6M guanidine hydrochloride (GdCl), and using ε280 = 13.94 cm−1 mM−1 as the extinction coefficient (Pace et al., 1995). A sample composed of 50 % 14N and 50 % 15N labeled molecules was used for the 15N-edited / 15N-filtered NOE experiment.
Data Acquisition
Backbone resonance assignment was performed on cryoprobe-equipped Bruker DRX600 and Avance900 spectrometers. ZZ-exchange experiments were performed on a cryoprobe-equipped Bruker Avance800 spectrometer. Relaxation experiments were acquired on cryoprobe-equipped Bruker Avance500 and DRX600 spectrometers. Sample temperature for relaxation experiments was calibrated using 99.8% D4-methanol (Aldrich Inc.), to a splitting of 1.70 ppm, corresponding to temperature of 281.5 K, to avoid errors associated with radiation damping (Findeisen et al., 2007).
Standard triple resonance shift-correlation pulse sequences: HNCO, HNCA, HNCACO, HNCOCA, HNCACB, and 1H-15N-NOESY-HSQC (80 ms mixing time) were used to assign the 8ec1 backbone at 300 K (Cavanagh et al., 2007; Ikura et al., 1990). The 2D filtered NOE experiment sequence was similar to published sequences (Wider et al., 1990). ZZ-exchange experiments were acquired at 306.6 K using a previously published pulse sequence (Farrow et al., 1994). A composite ratio (see text and supplemental data) was computed for 6 residues (E17, G41, Q49, E66, A69, A75) with well-resolved auto and cross-peak resonances, in the absence of calcium. Identical analysis was applied to five residues (G41, Q49, E70, A75, V78) in the presence of 15 mM calcium. The monomer-dimer ratios were computed from volumes of seven residues (I35, Q49, A69, E70, T74, A75, V78). The jackknife error reported in the fitted values for the ZZ-exchange experiment reflect grouping of the data on a residue basis (Mosteller and Tukey, 1977).
The R1 (spin-lattice) and R2 (spin-spin) relaxation rate constants, and the heteronuclear (1H)-15N steady-state NOE were measured with previously published pulse sequences (Palmer, 2001). Relaxation dispersion experiments used relaxation-compensated pulse sequences (Loria et al., 1999; Millet et al., 2000). For tryptophan indole specific experiments, the 15N carrier frequency was placed on resonance (128.6 ppm) with the tryptophan indole region, to avoid artifacts associated with off-resonance effects. The R2 CPMG (τcp = 1 ms) rate constants were measured on sample protein concentrations of 0.30 or 0.65 mM.
The relaxation dispersion data are summarized for each field, as the (τcp value, number of unique relaxation decay curve time points, total number of experiments). At 11.7 T, the following data were acquired : (0.67 ms, 5, 10), (1.2 ms, 5, 10), (1.5 ms, 7, 13), (2.0 ms, 6, 12), (3.0 ms, 4, 12), and (6.0 ms, 2, 8). At 14.1 T the following data were acquired : (0.67 ms, 6, 10), (1.0 ms, 6, 10), (1.2 ms, 6, 10), (1.5 ms, 6, 9), (2.0 ms, 6, 9), (3.0 ms, 4, 12), and (6.0 ms, 2, 11). Duplicate experiments were acquired at τcp values of 3.0 ms at 11.7 T, and 1.5 ms and 3.0 ms at 14.1 T. Uncertainties in individual data points were either obtained as the standard deviation of repeats, or extrapolated from neighboring points.
For H–D exchange experiments, a sample prepared in H2O solution was lyophilized and resuspended in 99.96% D2O prior to data collection. The experimental setup (shimming, tuning/matching and pulse calibration) was optimized on a sample containing D2O buffer alone. The lag time to the start of the first 1H-15N HSQC experiment following resuspension in D2O was 3 minutes. The length of each experiment was 20 minutes. A control 1H-15N HSQC experiment was acquired by re-lyophilizing the D2O exchanged sample, and resuspending in H2O.
Data Processing
NMR spectra were processed with NMRPipe (Delaglio et al., 1995) and analyzed with SPARKY3 (T.D. Goddard and D.G. Kneller, UCSF). The CurveFit program (www.palmer.hs.columbia.edu) was used to extract exponential relaxation rate constants from relaxation decay curves. MOLMOL (Koradi et al., 1996) was used to calculate 1H-1H distances by adding hydrogen atoms (in silico) to the 8ec1 crystal structure (1ZXK). Figures were prepared with GRACE (http://plasma-gate.weizmann.ac.il/Grace/), and VMD (Humphrey et al., 1996).
Monomer-dimer equilibrium dissociation
The monomer-dimer equilibrium dissociation constant was determined from the respective resonance amplitudes aM and aD in a fully relaxed 1H-15N-HSQC spectrum acquired using a seven-second recycle delay. The dissociation constant is given by:
| [1] |
in which [P0] is the total protein concentration and aM/aD = [M]/(2[D]).
ZZ-exchange analysis of monomer-dimer kinetics
The time dependence of the auto- and cross-peak intensities was analyzed using a composite intensity ratio with quadratic time dependence, Eq. [2] and Supplemental Data:
| [2] |
in which the amplitude of resonances originating on state X and detected on state Y are denoted aYX(t), where monomer and dimer states are M and D, respectively, and ζ = 4koffkon[M]. Individual rate constants were obtained from ζ using the relationship Kd = koff / kon. Global fitting of ZZ-exchange profiles was performed with the Levenberg-Marquardt nonlinear least-squares algorithm implemented in Mathematica v5.2. Jackknife errors are reported as uncertainties in the fitted parameters (Mosteller and Tukey, 1977).
Model-free analysis of 15Nε1 relaxation
The r2r1_diffusion and r2r1tm programs (www.palmer.hs.columbia.edu) were used to calculate global correlation times, based on the R2/R1 ratio. Global tumbling correlation times were determined from 10 % trimmed means of 15N amide R2/R1 ratios, to reduce artifacts associated with overlap between monomer and dimer states, as well exchange broadening for select resonances in the monomer state. The reduced spectral density at frequencies 0.87ωH and ωN was computed from the R1 relaxation rate constant and heteronuclear NOE (Farrow et al., 1995):
| [3] |
| [4] |
in which d=μ0ћγNγH/(4πr3), c=ωXΔσX/√3, μ0 is permitivity of free space, ћ is Planck's constant divided by 2π, r is the length of H-N internuclear bond, and γX is gyromagnetic ratio, ωX is the observed frequency, and ΔσX is the chemical shift anisotropy of nucleus X. The values of r = 1.02 10-10 m and ΔσX = −107.7 ppm were used for the Trp 15Nε1 spins (Hu et al., 1995).
The Lipari-Szabo model-free formalism describes the spectral density function as (Lipari and Szabo, 1982):
| [5] |
in which τm is the overall rotational correlation time, S2 is the square of the generalized order parameter, and τe is the internal correlation time, 1/τ = 1/τm + 1/τe. For a given τm (vide supra and Table II) S2 and τe (not shown) were obtained by inverting Eqs. [3] and [4] and using Eq. [5] (Bracken et al., 1999; Renner et al., 2001). The solution of the cubic equation leading to the square of the generalized order parameter, S2, and error propagation were performed with Mathematica v5.2 (Wolfram Research).
Analysis of relaxation dispersion
CPMG relaxation dispersion data were fit to (Carver and Richards, 1972):
| [6] |
in which:
| [7] |
, ζ = −2ΔωNkex (1 − 2pminor), kex = k1+ k−1 is the sum of the forward and reverse rate constants, ΔωN is the chemical shift difference between major and minor conformations, R20 is the average limiting value of the relaxation rate constant for processes other than chemical exchange, pminor is the population of the less populated conformational state, and τcp is the spacing between pulses in the CPMG train. Scaling of the R20 rate constant between 11.7 T and 14.1 T, for the monomer state was constrained by the theoretical scaling value (scale = 1.03), consistent with the observed dimer state R20 scaling (scale = 1.03). Global fitting of relaxation dispersion profiles was performed with the Levenberg-Marquardt nonlinear least-squares algorithm implemented in Mathematica v5.2. Jackknife errors are reported as uncertainties in the fitted parameters (Mosteller and Tukey, 1977).
Analytical ultracentrifugation
Sedimentation equilibrium measurements were performed using a Beckman XL-A/I analytical ultracentrifuge (Beckman-Coulter, Palo Alto CA, USA) with six-cell straight-walls centerpieces, a 12 mm path length and, sapphire windows. Samples were dialyzed overnight at 277 K against a buffer at the appropriate pH (ranging from 5.0 to 7.0) containing 50 mM MES and 500 mM glycine and then diluted to 70, 35 and 20 mM for analysis. Data were recorded at 300 K using speeds of 25000, 29000 and 32000 rpm; scans were taken in quadruplicate by absorbance at 280 nm. The dissociation constant, Kd, was determined at each pH by a global fit of all data using Beckman Optima version 4.0. Partial specific volume and solvent density were determined using SednTerp (Alliance Protein Laboratories, Corte Cancion, Thousand Oaks, CA, USA).
Selected-fit and Induced-fit Pathways
Conformational dynamics of proteins detected by NMR spin relaxation techniques have been interpreted variously as supporting induced-fit (Bracken et al., 1999; Yuan et al., 2002) and selected-fit (Gardino et al., 2003; Sugase et al., 2007; Wang et al., 2004) mechanisms for ligand binding. A simple scheme for ligand binding is shown below:
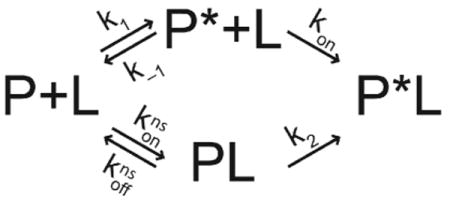
In this scheme, P and P* are ground-state (binding-incompetent) and activated-state (binding-competent) conformations of the protein, and PL is a non-specific encounter complex. The upper pathway represents the selected-fit mechanism and the lower pathway represents the induced-fit mechanism. The ratio of the initial fluxes through the two pathways, when the initial concentration of the final complex P*L is negligible, is given by
| [8] |
in which K = (k−1 + kon [L]) / k1 and
The expression for F can be obtained using the steady-state approximation, or more simply the approach of Cleland (Cleland, 1975). As this scheme makes evident, in the general case, both induced-fit and selected-fit binding occur simultaneously. When F < 1, the selected-fit mechanism is dominant and when F > 1, the induced-fit mechanism is dominant. If k−1 ≫ kon[L], k1 and koffns ≫ konns[L], k2, then K/Kns is approximately the ratio of the concentrations (or populations) [PL] /[P*]. Thus, intuitively, the selected-fit (induced-fit) mechanism is favored if the population of the activated conformational state is sufficiently larger (smaller) than the population of the encounter complex and/or if binding of P* and L is sufficiently faster (slower) than conversion of PL to P*L. In addition, if k1 = k2 and konns = kon, then the selected-fit (induced-fit) mechanism is dominant when the lifetime of the activated state P* (τ =1/k−1) is larger (smaller) than the lifetime of the encounter complex PL (τ = 1/koffns).
The minimal dimerization reaction for 8ec1 is more complex than for simple ligand binding, as shown in scheme 2:
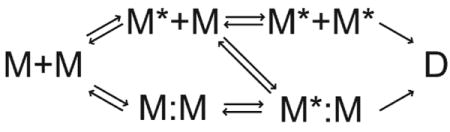
because the upper and lower pathways are interconnected. Nonetheless, the same qualitative conditions favor selected-fit or induced-fit mechanisms for dimerization as for simple ligand binding.
Supplementary Material
Acknowledgments
We thank Shoshana Posy (Columbia University) for helpful discussions. This work was supported by National Institutes of Health grants MSTP 5T32 GM07367 (V. Z. M.), R01 GM30518 (B.H.), U54 CA121852 (B.H. and L. S.), and R01 GM59273 (A. G. P.).
Footnotes
Publisher's Disclaimer: This is a PDF file of an unedited manuscript that has been accepted for publication. As a service to our customers we are providing this early version of the manuscript. The manuscript will undergo copyediting, typesetting, and review of the resulting proof before it is published in its final citable form. Please note that during the production process errors may be discovered which could affect the content, and all legal disclaimers that apply to the journal pertain.
References
- Bai YW, Milne JS, Mayne L, Englander SW. Primary structure effects on peptide group hydrogen-exchange. Proteins: Struct Funct Genet. 1993;17:75–86. doi: 10.1002/prot.340170110. [DOI] [PMC free article] [PubMed] [Google Scholar]
- Bennett MJ, Choe S, Eisenberg D. Domain swapping: Entangling alliances between proteins. Proc Natl Acad Sci USA. 1994;91:3127–3131. doi: 10.1073/pnas.91.8.3127. [DOI] [PMC free article] [PubMed] [Google Scholar]
- Boggon TJ, Murray J, Chappuis-Flament S, Wong E, Gumbiner BM, Shapiro L. C-cadherin ectodomain structure and implications for cell adhesion mechanisms. Science. 2002;296:1308–1313. doi: 10.1126/science.1071559. [DOI] [PubMed] [Google Scholar]
- Bracken C, Carr PA, Cavanagh J, Palmer AG. Temperature dependence of intramolecular dynamics of the basic leucine zipper of GCN4: Implications for the entropy of association with DNA. J Mol Biol. 1999;285:2133–2146. doi: 10.1006/jmbi.1998.2429. [DOI] [PubMed] [Google Scholar]
- Carver JP, Richards RE. General 2-site solution for chemical exchange produced dependence of T2 upon Carr-Purcell pulse separation. J Magn Reson. 1972;6:89–105. [Google Scholar]
- Cavanagh J, Fairbrother W, Palmer AI, Rance M, Skelton N. Protein NMR Spectroscopy : Principles and Practice. 2nd. San Diego: Academic Press; 2007. [Google Scholar]
- Chappuis-Flament S, Wong E, Hicks LD, Kay CM, Gumbiner BM. Multiple cadherin extracellular repeats mediate homophilic binding and adhesion. J Cell Biol. 2001;154:231–243. doi: 10.1083/jcb.200103143. [DOI] [PMC free article] [PubMed] [Google Scholar]
- Chen CP, Posy S, Ben-Shaul A, Shapiro L, Honig BH. Specificity of cell-cell adhesion by classical cadherins: Critical role for low-affinity dimerization through beta-strand swapping. Proc Natl Acad Sci USA. 2005;102:8531–8536. doi: 10.1073/pnas.0503319102. [DOI] [PMC free article] [PubMed] [Google Scholar]
- Cleland WW. Partition analysis and concept of net rate constants as tools in enzyme kinetics. Biochemistry. 1975;14:3220–3224. doi: 10.1021/bi00685a029. [DOI] [PubMed] [Google Scholar]
- Delaglio F, Grzesiek S, Vuister GW, Zhu G, Pfeifer J, Bax A. NMRpipe: A multidimensional spectral processing system based on UNIX pipes. J Biomol NMR. 1995;6:277–293. doi: 10.1007/BF00197809. [DOI] [PubMed] [Google Scholar]
- Farrow NA, Zhang OW, Formankay JD, Kay LE. A heteronuclear correlation experiment for simultaneous determination of 15N longitudinal decay and chemical exchange rates of systems in slow equilibrium. J Biomol NMR. 1994;4:727–734. doi: 10.1007/BF00404280. [DOI] [PubMed] [Google Scholar]
- Farrow NA, Zhang OW, Szabo A, Torchia DA, Kay LE. Spectral density function mapping using 15N relaxation data exclusively. J Biomol NMR. 1995;6:153–162. doi: 10.1007/BF00211779. [DOI] [PubMed] [Google Scholar]
- Findeisen M, Brand T, Berger S. A 1H NMR thermometer suitable for cryoprobes. Magn Reson Chem. 2007;45:175–178. doi: 10.1002/mrc.1941. [DOI] [PubMed] [Google Scholar]
- Gardino AK, Volkman BF, Cho HS, Lee SY, Wemmer DE, Kern D. The NMR solution structure of BeF3−-activated Spo0F reveals the conformational switch in a phosphorelay system. J Mol Biol. 2003;331:245–254. doi: 10.1016/s0022-2836(03)00733-2. [DOI] [PubMed] [Google Scholar]
- Halbleib JM, Nelson WJ. Cadherins in development: cell adhesion, sorting, and tissue morphogenesis. Genes & Development. 2006;20:3199–3214. doi: 10.1101/gad.1486806. [DOI] [PubMed] [Google Scholar]
- Harrison OJ, Corps EM, Kilshaw PJ. Cadherin adhesion depends on a salt bridge at the N-terminus. J Cell Sci. 2005;118:4123–4130. doi: 10.1242/jcs.02539. [DOI] [PubMed] [Google Scholar]
- Haussinger D, Ahrens T, Aberle T, Engel J, Stetefeld J, Grzesiek S. Proteolytic E-cadherin activation followed by solution NMR and X-ray crystallography. EMBO J. 2004;23:1699–1708. doi: 10.1038/sj.emboj.7600192. [DOI] [PMC free article] [PubMed] [Google Scholar]
- He WZ, Cowin P, Stokes DL. Untangling desmosomal knots with electron tomography. Science. 2003;302:109–113. doi: 10.1126/science.1086957. [DOI] [PubMed] [Google Scholar]
- Hu W, Lazo ND, Cross TA. Tryptophan Dynamics and structural refinement in a lipid bilayer environment: Solid-state NMR of the gramicidin channel. Biochemistry. 1995;34:14138–14146. doi: 10.1021/bi00043a019. [DOI] [PubMed] [Google Scholar]
- Humphrey W, Dalke A, Schulten K. VMD: Visual molecular dynamics. Mol Graph. 1996;14:33–38. doi: 10.1016/0263-7855(96)00018-5. [DOI] [PubMed] [Google Scholar]
- Ikura M, Kay LE, Bax A. A novel approach for sequential assignment of 1H, 13C, and 15N spectra of larger proteins: Heteronuclear triple-resonance three-dimensional NMR spectroscopy Application to calmodulin. Biochemistry. 1990;29:4659–4667. doi: 10.1021/bi00471a022. [DOI] [PubMed] [Google Scholar]
- Ishima R, Torchia DA. Accuracy of optimized chemical-exchange parameters derived by fitting CPMG R-2 dispersion profiles when R20a ≠ R20b. J Biomol NMR. 2006;34:209–219. doi: 10.1007/s10858-005-6226-7. [DOI] [PubMed] [Google Scholar]
- Koradi R, Billeter M, Wuthrich K. MOLMOL: A program for display and analysis of macromolecular structures. J Mol Graph. 1996;14:51–55. doi: 10.1016/0263-7855(96)00009-4. [DOI] [PubMed] [Google Scholar]
- Krishna MMG, Hoang L, Lin Y, Englander SW. Hydrogen exchange methods to study protein folding. Meth Enzymol. 2004;34:51–64. doi: 10.1016/j.ymeth.2004.03.005. [DOI] [PubMed] [Google Scholar]
- Lipari G, Szabo A. Model-free approach to the interpretation of nuclear magnetic-resonance relaxation in macromolecules .1. Theory and range of validity. J Am Chem Soc. 1982;104:4546–4559. [Google Scholar]
- Liu Y, Eisenberg D. 3D domain swapping: As domains continue to swap. Prot Sci. 2002;11:1285–1299. doi: 10.1110/ps.0201402. [DOI] [PMC free article] [PubMed] [Google Scholar]
- Loria JP, Rance M, Palmer AG. A relaxation-compensated Carr-Purcell-Meiboom-Gill sequence for characterizing chemical exchange by NMR spectroscopy. J Am Chem Soc. 1999;121:2331–2332. [Google Scholar]
- Maniatis T, Fritsch EF, Sambrook J. Molecular cloning : a laboratory manual. Cold Spring Harbor, N.Y: Cold Spring Harbor Laboratory Press; 1989. [Google Scholar]
- Millet O, Loria JP, Kroenke CD, Pons M, Palmer AG. The static magnetic field dependence of chemical exchange linebroadening defines the NMR chemical shift time scale. J Am Chem Soc. 2000;122:2867–2877. [Google Scholar]
- Mosteller F, Tukey J. Data analysis and regression: A second course in statistics. Reading MA: Addison-Wesley; 1977. [Google Scholar]
- Nagar B, Overduin M, Ikura M, Rini JM. Structural basis of calcium-induced E-cadherin rigidification and dimerization. Nature. 1996;380:360–364. doi: 10.1038/380360a0. [DOI] [PubMed] [Google Scholar]
- Northrup SH, Erickson HP. Kinetics of protein protein association explained by Brownian dynamics computer simulation. Proc Natl Acad Sci USA. 1992;89:3338–3342. doi: 10.1073/pnas.89.8.3338. [DOI] [PMC free article] [PubMed] [Google Scholar]
- Nose A, Tsuji K, Takeichi M. Localization of specificity determining sites in cadherin cell-adhesion molecules. Cell. 1990;61:147–155. doi: 10.1016/0092-8674(90)90222-z. [DOI] [PubMed] [Google Scholar]
- Overduin M, Harvey TS, Bagby S, Tong KI, Yau P, Takeichi M, Ikura M. Solution structure of the epithelial cadherin domain responsible for selective cell-adhesion. Science. 1995;267:386–389. doi: 10.1126/science.7824937. [DOI] [PubMed] [Google Scholar]
- Pace CN, Vajdos F, Fee L, Grimsley G, Gray T. How to measure and predict the molar absorption coefficient of a protein. Prot Sci. 1995;4:2411–2423. doi: 10.1002/pro.5560041120. [DOI] [PMC free article] [PubMed] [Google Scholar]
- Palmer AG. NMR probes of molecular dynamics: Overview and comparison with other techniques. Annu Rev Biophys Biomolec Struct. 2001;30:129–155. doi: 10.1146/annurev.biophys.30.1.129. [DOI] [PubMed] [Google Scholar]
- Palmer AG, Kroenke CD, Loria JP. Nuclear magnetic resonance methods for quantifying microsecond-to-millisecond motions in biological macromolecules. Meth Enzymol. 2001;339:204–238. doi: 10.1016/s0076-6879(01)39315-1. [DOI] [PubMed] [Google Scholar]
- Patel SD, Chen CP, Bahna F, Honig B, Shapiro L. Cadherin-mediated cell-cell adhesion: sticking together as a family. Curr Opin Struct Biol. 2003;13:690–698. doi: 10.1016/j.sbi.2003.10.007. [DOI] [PubMed] [Google Scholar]
- Patel SD, Ciatto C, Chen CP, Bahna F, Rajebhosale M, Arkus N, Schieren I, Jessell TM, Honig B, Price SR, Shapiro L. Type II cadherin ectodomain structures: Implications for classical cadherin specificity. Cell. 2006;124:1255–1268. doi: 10.1016/j.cell.2005.12.046. [DOI] [PubMed] [Google Scholar]
- Posy S, Shapiro L, Honig B. Sequence and structural determinants of strand swapping in cadherin domains: do all cadherins bind through the same adhesive interface? J Mol Biol. 2008;378:952–966. doi: 10.1016/j.jmb.2008.02.063. [DOI] [PMC free article] [PubMed] [Google Scholar]
- Renner C, Moroder L, Holak TA. Analytical solution to the Lipari-Szabo model based on the reduced spectral density approximation offers a novel protocol for extracting motional parameters. J Magn Reson. 2001;151:32–39. doi: 10.1006/jmre.2001.2346. [DOI] [PubMed] [Google Scholar]
- Schreiber G, Fersht AR. Rapid, electrostatically assisted association of proteins. Nat Struct Biol. 1996;3:427–431. doi: 10.1038/nsb0596-427. [DOI] [PubMed] [Google Scholar]
- Schwarzinger S, Kroon GJA, Foss TR, Chung J, Wright PE, Dyson HJ. Sequence-dependent correction of random coil NMR chemical shifts. J Am Chem Soc. 2001;123:2970–2978. doi: 10.1021/ja003760i. [DOI] [PubMed] [Google Scholar]
- Shapiro L, Fannon AM, Kwong PD, Thompson A, Lehmann MS, Grubel G, Legrand JF, Alsnielsen J, Colman DR, Hendrickson WA. Structural basis of cell-cell adhesion by cadherins. Nature. 1995;374:327–337. doi: 10.1038/374327a0. [DOI] [PubMed] [Google Scholar]
- Shapiro L, Love J, Colman DR. Adhesion molecules in the nervous system: Structural insights into function and diversity. Annu Rev Neurosci. 2007;30:451–474. doi: 10.1146/annurev.neuro.29.051605.113034. [DOI] [PubMed] [Google Scholar]
- Sugase K, Dyson HJ, Wright PE. Mechanism of coupled folding and binding of an intrinsically disordered protein. Nature. 2007;447:1021–U1011. doi: 10.1038/nature05858. [DOI] [PubMed] [Google Scholar]
- Takeichi M. Cadherin cell-adhesion receptors as a morphogenetic regulator. Science. 1991;251:1451–1455. doi: 10.1126/science.2006419. [DOI] [PubMed] [Google Scholar]
- Takeichi M. The cadherin superfamily in neuronal connections and interactions. Nat Rev Neurosci. 2007;8:11–20. doi: 10.1038/nrn2043. [DOI] [PubMed] [Google Scholar]
- Tollinger M, Skrynnikov NR, Mulder FAA, Forman-Kay JD, Kay LE. Slow dynamics in folded and unfolded states of an SH3 domain. J Am Chem Soc. 2001;123:11341–11352. doi: 10.1021/ja011300z. [DOI] [PubMed] [Google Scholar]
- Wang CY, Karpowich N, Hunt JF, Rance M, Palmer AG. Dynamics of ATP-binding cassette contribute to allosteric control, nucleotide binding and energy transduction in ABC transporters. J Mol Biol. 2004;342:525–537. doi: 10.1016/j.jmb.2004.07.001. [DOI] [PubMed] [Google Scholar]
- Wider G, Weber C, Traber R, Widmer H, Wüthrich K. Use of a double-half-filter in 2-dimensional 1H nuclear magnetic resonance studies of receptor-bound cyclosporine. J Am Chem Soc. 1990;112:9015–9016. [Google Scholar]
- Yuan Y, Simplaceanu V, Lukin JA, Ho C. NMR investigation of the dynamics of tryptophan side-chains in hemoglobins. J Mol Biol. 2002;321:863–878. doi: 10.1016/s0022-2836(02)00704-0. [DOI] [PubMed] [Google Scholar]
- Zhang HY, Neal S, Wishart DS. RefDB: A database of uniformly referenced protein chemical shifts. J Biomol NMR. 2003;25:173–195. doi: 10.1023/a:1022836027055. [DOI] [PubMed] [Google Scholar]
Associated Data
This section collects any data citations, data availability statements, or supplementary materials included in this article.