

Abstract
Resolution of the spectra of the intermediates in the photocycle of wild-type bacteriorhodopsin (BR) was achieved by singular value decomposition with exponential-fit-assisted self-modeling (SVD-EFASM) treatment of multichannel difference spectra measured at 5 °C during the course of the photocycle. New is the finding that two spectrally distinct L intermediates, L1 and L2, form sequentially. Our conclusion is that the photocycle is more complex than most published schemes. The dissection of the spectrally different L forms eliminates stoichiometric discrepancies usually appearing as systematically varying total intermediate concentrations before the onset of BR recovery. In addition, our analysis reveals that the red tails in the spectra of K and L1 are more substantial than those of L2 and BR. We suggest that these subtle differences in the shapes of the spectra reflect torsional and/or environmental differences in the retinyl chromophore.
Introduction
No cis-trans photoisomerization reactions rival in interest those in the retinal proteins: rhodopsin and the triggering of vision, and bacteriorhodopsin (BR) and the triggering of proton transport. Recent reviews describe BR, the light-activated proton pump.1 The chromophore in BR is the protonated Schiff base of all-trans-retinal. Light absorption causes trans → cis photoisomerization in 500 fs to the 13-cis isomer, J, which relaxes to K in 3 ps.2 Cooperative conformational changes and proton transfers involving the chromophore and the protein follow in the ns to ms time range through discrete intermediates L, M, N, and O that return the system to BR. As the net result, a proton is transferred from the interior to the exterior of the cell and ATP synthesis ensues. BR is especially well suited for revealing the interplay of the activated chromophore and protein structural dynamics and their relation to function. Structures of BR and some of the intermediates are available to high resolution (down to 1.43 Å) from X-ray crystallographic studies with significant mechanistic implications.1c Following pulsed excitation, difference spectral responses are obtained relative to the reference BR, that reflect the time evolution of formation of the intermediates and BR depletion. Kinetics analyses of such data have led to photocycle models ranging from several independent photocycles originating from different forms of BR, in dynamic but slow equilibrium,3 to a single photocycle, including reversible steps and branching steps.4
Flawed photocycle models may appear correct if their use leads only to subtle changes in the derived intermediate spectra that may nevertheless profoundly distort the calculated time evolution of the intermediates. To eliminate such pitfalls, we have pursued the goal of a priori determination of accurate intermediate spectra by applying singular value decomposition with self-modeling (SVD-SM) to matrices of difference spectra, thus relegating selection of the photocycle model to the final stage of the analysis. We developed and tested the method on the BR mutant D96N with its abbreviated photocycle,5 refined it on the BR mutant E204Q whose kinetic complexity approaches that of wild-type BR (WTBR),6 and described in detail its proposed application to the derivation of the spectra of WTBR.7 The self-modeling has evolved to an exponential-fit-assisted procedure (EFASM) that achieves noise reduction based on multi-exponential simultaneous fit of the kinetic eigenvectors.7 We report here the SVD-EFASM resolution of WTBR spectral matrices.
Experimental Section
Purple membranes containing WTBR, isolated by using standard methods8 from Halobacterium salinarum strain L33 transformed with a plasmid carrying the bop gene as well as a gene for novobiocin resistance, were immobilized in polyacrylamide gel (10%), and equilibrated in 100 mM NaCl and 100 mM sodium phosphate buffer at pH 6. The sample was light adapted and its T maintained at 5.0 °C to ± 0.1 °C. The gel slab absorbance (10 mm thick) at λmax ca. 568 nm was 1.14 in the light adapted state. The photocycle was initiated by the second harmonic of a Nd-YAG laser (532 nm, 5 ns pulse width, 2 mJ/cm2, Continuum Surelite I). The power of the white, unpolarized measuring light (tungsten/halogen lamp, OSRAM) was reduced by a diaphragm and a digital chopper to avoid its possible interference with the photocycle. Detection was through a Jarrell-Ash Monospec 27 spectrograph (150 grooves/mm grating, blazed at 450 nm, Genesis Laboratory Systems) with a gated intensified diode array detector (Princeton Instruments IRY-700S/B). Control and gating of the detector was provided by Princeton Instruments ST-120 controller, and FG-100 and PG-10 gate pulse generators for short and long delays, respectively.9 Delay times after the laser pulse were selected logarithmically equidistant from 100 ns to 150 ms, with 5 spectra per decade.
Results and Discussion
The 32 experimental difference spectra are shown in Figure 1. The SVD-EFASM procedure was applied as described for a matrix of simulated realistic spectra.7 In this treatment it was possible to separate the spectra into two sub-matrices consisting of the first 20 (the K → M portion of the photocycle) and the last 12 difference spectra (the M → BR portion of the photocycle).
Figure 1.
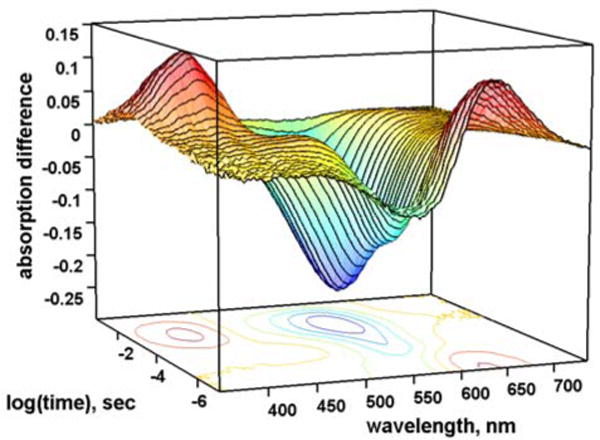
Time resolved difference spectra for the WTBR photocycle at 5.0 °C.
In this paper we focus primarily on the results from the treatment of the first 20 spectra. Salient features are: (1) Starting with the complete matrix, SVD yields a matrix of spectral and a matrix of temporal (kinetic) eigenvectors. The first 5 spectral eigenvectors account for 99.986% of the total variance (superior S/N to most published data and comparable to those for the E204Q mutant6 and for the WTBR simulation7). (2) Global multiexponential fits of the significant kinetic eigenvectors weighted by their singular values (a.k.a. combination coefficients) identify eight exponential components. The fitted temporal vectors were then used to reconstitute a relatively noise-free spectral matrix.7 Plots of the 4th vs. the 1st temporal vector before and after the multiexponential fit illustrate the advantage of this procedure, Figure 2. The scattered points in the plot of the initial vectors are replaced by the smooth curve of the plot of the fitted vectors. (3) The M–BR spectrum was obtained by target testing (it is identical to the –BR spectrum in the 540-735 nm region) on the stoichiometric plane defined by spectra in the first half of the photocycle (prior to BR recovery). The 27.1% photocycling ratio (PCR) follows directly from the M–BR spectrum. The surprise here is that fulfillment of the stoichiometric condition (sum of intermediate concentrations = the BR bleach) requires the presence of 4 spectrally distinct intermediates in the partial matrix for the first part of the photocycle. (4) The K–BR spectrum was obtained by extrapolation of the combination coefficients to t = 0 using the time-dependent multiexponential fit. (5) Addition of the BR spectrum to exactly eliminate the bleach converts the difference spectra to normal absorption spectra. SM to obtain the L spectrum was as described for the simulated spectra7 except that here the elimination of K was performed in 4D space, Figure 3. The L1,L2,M plane is defined by the combination coefficients of the K-free projections of the experimental spectra (square points in Figure 3). Vectors originating at the K vertex were passed through the point for each bleach and noise corrected experimental spectrum and extended until they reached the spectrum with baseline above 680 nm where only K absorbs (see Figure 4). The self-modeling extrapolation using the vector starting at the K vertex and passing through the first experimental spectral point yields the L1 vertex of the stoichiometric tetrahedron. (6) Figure 3 reveals the existence of two consecutive, spectrally distinct L intermediates. On removal of M, the first four projected spectra are essentially identical to L1, whereas removal of M from the 13th to 20th projected spectra gives the spectrum taken as L2. (7) The kinetics of the intermediates are obtained by linear least squares fit of the data matrix with the intermediate spectra. Fit improvements due to the two L spectra are: (i) Use of a single L spectrum (L2) in the fit yields RMS deviation of 1.20 × 10⁻³, whereas use of both L spectra gives 1.06 × 10⁻³. (ii) The RMS deviation of the (normalized) sum of the concentrations of the intermediates from the expected value of unity, 1.4 × 10⁻² for the single L fit, improves to 1.1 × 10⁻³ for the two-L fit. Thus the consecutively appearing L intermediates eliminate generally observed systematic variations of this sum.
Figure 2.
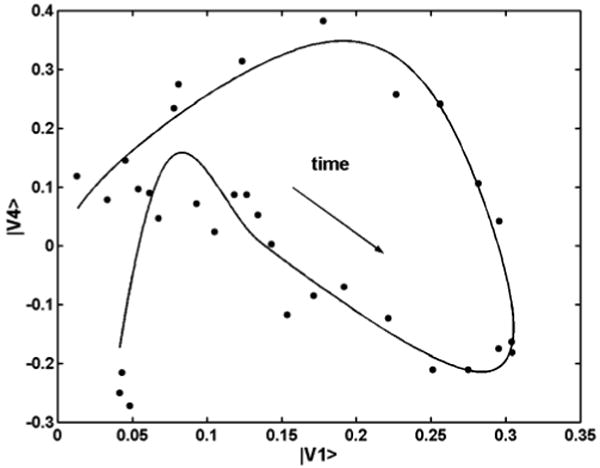
Plots of the 4th temporal eigenvector vs. the 1st (dots) and the pair of fitted multiexponential functions (line); arrow shows time flow.
Figure 3.
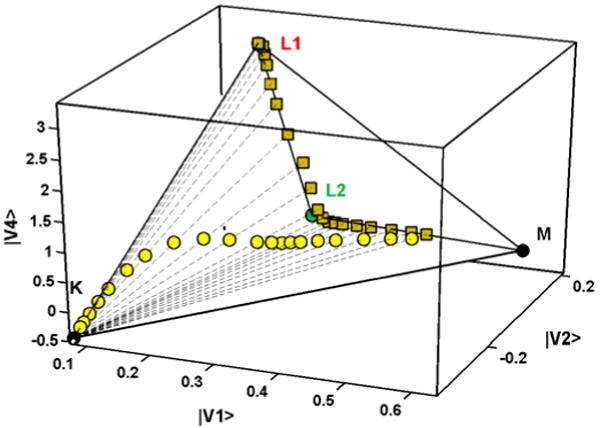
A 3D “cross section” shown in the 4D combination coefficient space: bleach-corrected experimental spectra (○), their projection on the L/M plane (□), and pure spectra including those of the two Ls (•).
Figure 4.
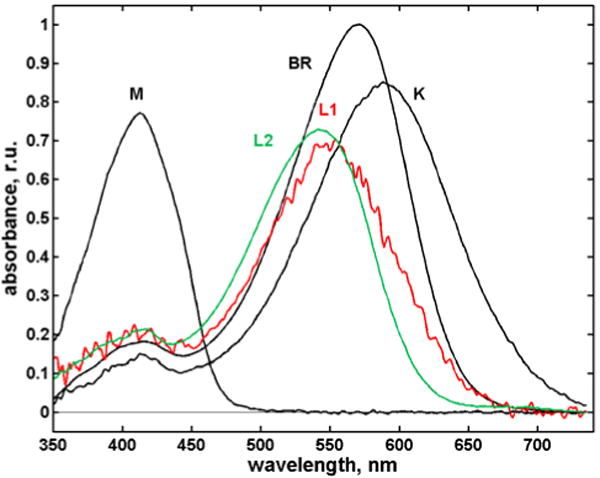
Intermediate spectra calculated by the SVD-EFASM method.
The high quality spectra for K, L1, L2 and M are plotted in Figure 4 (for N and O, see SI), and their time evolution for the first half of the photocycle in Figure 5. The K and L1 spectra have more substantial red tails than the L2 and BR spectra. Possible causes include increased retinyl torsion, different hydrogen bonding of the protonated Schiff base, and increased steric conflict of the retinal with the protein pocket. X-ray structures of L obtained at 150 and 170 K differ slightly,10 hinting at a relaxation of the chromophore that may be related to the L1 → L2 step at ambient T.
Figure 5.
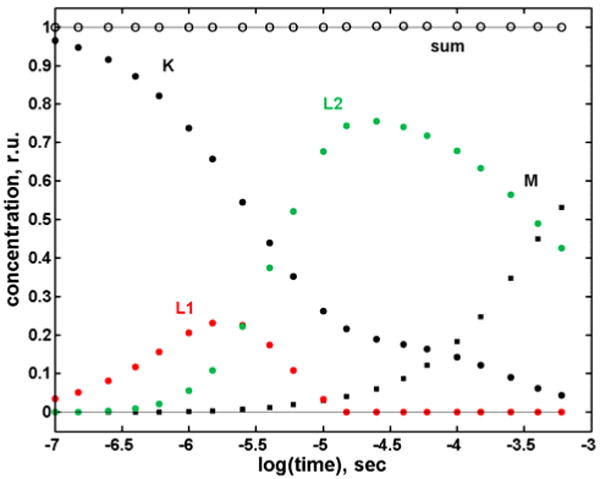
Kinetics of the intermediates calculated by fitting the spectra in Figure 4 to the experimental spectra. The open circles are the sums of normalized intermediate concentrations.
Analogous treatment of a matrix of WTBR difference spectra measured at 30 °C has also revealed the involvement of the two spectrally distinct L intermediates.11 Two kinetically distinct L intermediates had been shown to improve kinetics fits in the region of M formation both in WTBR and in the D96N mutant.5b,12-14 However, those kinetically distinct L forms appear at later times in the photocycle than the two spectrally distinct L forms reported here. The two phenomena do not coincide in time. and are not related. Similarly, the first component of the biphasic recovery of the initial BR state that removed the apparent stoichiometric discrepancy in the D96N photocycle has a half life in the 100 μs range,5b much too long to be associated with the rapid interconversion of the two spectrally distinct L intermediates in the WT photocycle. One may ask whether our failure to detect two spectrally distinct Ls in our previous SVD-SM treatment of the spectral matrix for the D96N5b mutant is a consequence of the single amino acid residue substitution or was due to our having neglected a small but significant contribution from the 4th eigenvector. Careful reexamination of the D96N spectral matrix using the procedure described in this paper yielded no second spectrally distinct L, confirming the published analysis.5b Thus, the biphasic BR recovery is a real consequence of the substitution at D96 as is the photocycle with a single L spectrum.
SVD-EFASM resolution of the spectra for N and O of WTBR and significant implications for the photocycle and for the proton transport mechanism will be addressed in the full account of this work.
Conclusion
We have established that SVD-EFASM is a powerful approach that, when properly applied, yields accurate BR photocycle intermediate spectra without the assumption of a kinetics scheme. Spectra obtained by self-modeling under stoichiometric constraints reveal important, hitherto hidden, features that have not yielded to previous analyses. They include the biphasic BR recovery in the D96N mutant5b and the resolution of the spectra of two distinct L intermediates in WTBR. No photocycle scheme with a single L intermediate is acceptable. The absence of the second spectrally distinct form of L in the D96N mutant suggests that in WTBR D96 plays an essential role in a transient change of the cytoplasmic interactions that is reflected in the sequential L formation.
Supplementary Material
Figures showing all the intermediate spectra and their time evolution for the complete photocycle. Included is a Figure showing the stoichiometric fit improvement on inclusion of L2. This material is available free of charge via the Internet at http://pubs.acs.org.
Acknowledgments
Supported by the Hungarian Scientific Research Fund (OTKA T049207) to LZ, by NSF (CHE-0314784) to JS, and by the National Institutes of Health (GM29498) and the Department of Energy (DEFG03-86ER13525) to JKL.
References
- 1.a Lanyi JK. FEBS Lett. 1999;464:103–107. doi: 10.1016/s0014-5793(99)01685-3. [DOI] [PubMed] [Google Scholar]; b Lanyi JK. Annu Rev Physiol. 2004;66:665–688. doi: 10.1146/annurev.physiol.66.032102.150049. [DOI] [PubMed] [Google Scholar]; c Lanyi JK, Schobert B. Biochemistry. 2004;43:3–8. doi: 10.1021/bi035843s. [DOI] [PubMed] [Google Scholar]; d Haupts U, Tittor J, Oesterhelt D. Annu Rev Biophys Biomol Struct. 1999;28:367–399. doi: 10.1146/annurev.biophys.28.1.367. [DOI] [PubMed] [Google Scholar]; e Heberle J. Biochim Biophys Acta. 2000;1458:135–147. doi: 10.1016/s0005-2728(00)00064-5. [DOI] [PubMed] [Google Scholar]; d Stoeckenius W. Protein Sci. 1999;8:447–459. doi: 10.1110/ps.8.2.447. [DOI] [PMC free article] [PubMed] [Google Scholar]
- 2.a Ruhman S, Hou B, Friedman N, Ottolenghi M, Sheves M. J Am Chem Soc. 2002;124:8854–8858. doi: 10.1021/ja026426q. [DOI] [PubMed] [Google Scholar]; b Logunov SL, El-Sayed MA. J Phys Chem B. 1997;101:6629–6633. [Google Scholar]
- 3.a Lin GC, Awad ES, El-Sayed MA. J Phys Chem. 1991;95:10442–10447. [Google Scholar]; b Hanamoto JH, Dupuis P, El-Sayed MA. Proc Natl Acad Sci, USA. 1984;81:7083–7087. doi: 10.1073/pnas.81.22.7083. [DOI] [PMC free article] [PubMed] [Google Scholar]; c Dancshazy ZS, Govindjee R, Ebrey TG. Proc Natl Acad Sci USA. 1988;85:6358–6361. doi: 10.1073/pnas.85.17.6358. [DOI] [PMC free article] [PubMed] [Google Scholar]; d Balashov SP, Govindjee R, Ebrey TG. Biophys J. 1991;60:475–490. doi: 10.1016/S0006-3495(91)82074-4. [DOI] [PMC free article] [PubMed] [Google Scholar]; e Birge RR. Biochim Biophys Acta. 1990;1016:293–327. doi: 10.1016/0005-2728(90)90163-x. [DOI] [PubMed] [Google Scholar]; f Eisfeld W, Althaus T, Stockburger M. Biophys Chem. 1995;56:105–112. doi: 10.1016/0301-4622(95)00021-o. [DOI] [PubMed] [Google Scholar]; g Hendler RW. J Phys Chem B. 2005;109:16515–16528. doi: 10.1021/jp052733h. [DOI] [PubMed] [Google Scholar]
- 4.a Nagle JF, Parodi LA, Lozier RH. Biophys J. 1982;38:161–174. doi: 10.1016/S0006-3495(82)84543-8. [DOI] [PMC free article] [PubMed] [Google Scholar]; b Nagle JF. Biophys J. 1991;59:476–487. doi: 10.1016/S0006-3495(91)82241-X. [DOI] [PMC free article] [PubMed] [Google Scholar]; c Ames JB, Mathies RA. Biophys J. 1990;29:7181–7190. doi: 10.1021/bi00483a005. [DOI] [PubMed] [Google Scholar]; d Gerwert K, Souvignier G, Hess B. Proc Natl Acad Sci USA. 1990;87:9774–9778. doi: 10.1073/pnas.87.24.9774. [DOI] [PMC free article] [PubMed] [Google Scholar]; e Váró G, Duschl A, Lanyi JK. Biochemistry. 1990;29:3798–3804. doi: 10.1021/bi00467a029. [DOI] [PubMed] [Google Scholar]; f Váró G, Lanyi JK. Biochemistry. 1990;29:6858–6865. doi: 10.1021/bi00481a015. [DOI] [PubMed] [Google Scholar]; g Ludmann K, Gergely C, Váró G. Biophys J. 1998;75:3110–3119. doi: 10.1016/S0006-3495(98)77752-5. [DOI] [PMC free article] [PubMed] [Google Scholar]; h van Stokkum IHM, Lozier RH. J Phys Chem B. 2002;106:3477–3485. [Google Scholar]; i Mathies RA, Lin SW, Ames JB, Pollard WT. Annu Rev Biophys Biophys Chem. 1991;20:491–518. doi: 10.1146/annurev.bb.20.060191.002423. [DOI] [PubMed] [Google Scholar]
- 5.a Zimányi L, Kulcsár Á, Lanyi JK, Sears DF, Jr, Saltiel J. Proc Natl Acad Sci USA. 1999;96:4408–4413. doi: 10.1073/pnas.96.8.4408. [DOI] [PMC free article] [PubMed] [Google Scholar]; b Zimányi L, Kulcsár Á, Lanyi JK, Sears DF, Jr, Saltiel J. Proc Natl Acad Sci USA. 1999;96:4414–4419. doi: 10.1073/pnas.96.8.4414. [DOI] [PMC free article] [PubMed] [Google Scholar]
- 6.Kulcsár Á, Saltiel J, Zimányi L. J Am Chem Soc. 2001;123:3332–3340. doi: 10.1021/ja0030414. [DOI] [PubMed] [Google Scholar]
- 7.Zimányi L. J Phys Chem B. 2004;108:4199–4209. [Google Scholar]
- 8.Oesterhelt D, Stoeckenius W. Methods Enzymol. 1974;31:667–678. doi: 10.1016/0076-6879(74)31072-5. [DOI] [PubMed] [Google Scholar]
- 9.Zimányi L, Keszthelyi L, Lanyi JK. Biochemistry. 1989;28:5165–5172. doi: 10.1021/bi00438a038. [DOI] [PubMed] [Google Scholar]
- 10.Lanyi JK, Schobert B. J Mol Biol. 2003;328:439–450. doi: 10.1016/s0022-2836(03)00263-8. [DOI] [PubMed] [Google Scholar]
- 11.Zimányi, L.; Saltiel, J; Brown, L. S.; Lanyi, J. K. Unpublished results
- 12.Nagle JF, Zimányi L, Lanyi JK. Biophys J. 1995;68:1490–1499. doi: 10.1016/S0006-3495(95)80321-8. [DOI] [PMC free article] [PubMed] [Google Scholar]
- 13.Zimányi L, Lanyi JK. Biophys J. 1993;64:240–251. doi: 10.1016/S0006-3495(93)81360-2. [DOI] [PMC free article] [PubMed] [Google Scholar]
- 14.Gergely C, Ganea C, Groma G, Váró G. Biophys J. 1993;65:2478–2483. doi: 10.1016/S0006-3495(93)81308-0. [DOI] [PMC free article] [PubMed] [Google Scholar]
Associated Data
This section collects any data citations, data availability statements, or supplementary materials included in this article.
Supplementary Materials
Figures showing all the intermediate spectra and their time evolution for the complete photocycle. Included is a Figure showing the stoichiometric fit improvement on inclusion of L2. This material is available free of charge via the Internet at http://pubs.acs.org.