Abstract
This paper reports an improvement in the purification of thioredoxin (Trx) expressed from E. coli by inverse transition cycling (ITC) using cationic elastin-like polypeptides (ELPs). Two ELP libraries having 2 and 5 % lysine residues and molecular weights ranging from 4 to 61.1 kDa showed greater salt sensitivity in their inverse transition behavior than purely aliphatic ELPs. Expression yield of Trx-ELP fusions was an unpredictable function of guest residue composition, but reducing the molecular weight of the ELP tag generally increased Trx yield. A cationic 4.3 kDa ELP is the shortest ELP used to purify any protein by ITC to date. A 15.9 kDa ELP with a guest residue composition of K:V: F of 1:7:1 was found to be the optimal cationic tag to purify Trx, as it provided 50% greater Trx yield and only required one-fifth the added NaCl for purification of Trx compared to previously used aliphatic ELP tags.
Keywords: Elastin-like polypeptides, environmental sensitivity, non-chromatographic protein purification
Introduction
A variety of affinity based chromatographic purification schemes have been developed to simplify protein purification at the laboratory scale in a serial format.1 By expressing recombinant proteins fused to a peptide or protein having moderate affinity and high specificity for a particular ligand, recombinant proteins can be purified in a single step by binding to resins to which the ligand has been immobilized.2 In practice, however, affinity chromatography is costly, requiring specialized equipment and customized resins, and scale-up to industrial scale is empirical, expensive, and often results in significant purification losses.
We have previously developed inverse transition cycling (ITC) of elastin-like polypeptide (ELP) fusion proteins as an alternative to affinity-based purification schemes.3,4 ELPs are artificial biopolymers comprised of the pentapeptide repeat motif, Val-Pro-Gly-Xaa-Gly (VPGXG) that is derived from the hydrophobic domain of tropoelastin. At low temperatures, ELPs are soluble in aqueous solution, but as the solution temperature is raised, they become insoluble and aggregate at a critical temperature, termed the inverse transition temperature (Tt).5-7 This process is reversible so that subsequent cooling of the solution below the Tt results in the resolubilization of the ELP. The inverse transition can also be isothermally triggered by the addition of salt, and the response of ELPs to different salts follows the Hofmeister series.5,8-10
We were the first group to demonstrate that the inverse transition behavior of ELPs was imparted to ELP fusion proteins,3 and exploited this finding to develop a protein purification process that we have termed inverse transition cycling (ITC).3,4,11-15 This approach for protein purification has subsequently been validated by other groups.16-24 The ITC method is inexpensive, as it requires no specialized equipment or resins; instead, it uses inexpensive reagents such as sodium chloride to trigger the inverse phase transition and readily available centrifuges to separate the ELP fusion protein from other cellular contaminants. Multiple rounds of ITC increase the purity of the ELP fusion protein, and target proteins can be liberated from their ELP purification tag either by proteolytic cleavage at engineered polypeptide sequences3,4,14,15 or by self-cleaving inteins.24,25
Although previous studies have shown that ITC purification of ELP fusion proteins is a promising alternative to chromatography for purification of recombinant proteins, the ELP tags most commonly used for ITC have not been optimized for maximal protein expression or purification efficiency. To date, nearly all published examples of ITC purification of ELP fusion proteins have only utilized two types of ELP tags that were introduced in our original articles on ITC.3,4 These tags were not optimal, because they required at least ∼2 M NaCl to induce the phase transition. This concentration of salt was necessary to trigger the inverse phase transition of ELP fusion proteins because these ELP tags had aliphatic guest residues that are only modestly sensitive to changes in salt concentration.3,4,10 Previous studies have shown that incorporation of ionizable guest residues in an ELP increases its sensitivity to salt.5,26 Thus, we hypothesized that the addition of ionizable groups in the ELP tag should allow the purification of ELP fusion proteins from E. coli soluble lysate with less added NaCl than is needed to purify ELP fusions containing only aliphatic guest residues.
In this study, we report on the phase transition behavior of charged ELPs and their thioredoxin (Trx) fusions. These cationic ELPs have guest residues composed of Lys (K), Val (V), and Phe (F) in 1:2:1 and 1:7:1 ratios and span a range of molecular weights (MWs) from 7.7 to 61.1 kDa. We chose ionizable Lys residues to enhance the salt sensitivity of these ELPs compared to purely aliphatic ELPs and hydrophobic Phe residues to lower the Tt of the ELP, and thereby counterbalance the effect that charged Lys residues have on the Tt. The systematic investigation of the salt sensitivity, phase behavior, and expression yield of cationic ELPs and their fusions with Trx reported in this study provide significant new information to optimize the molecular design of ELPs as protein purification tags for ITC.
Materials and Methods
ELP Nomenclature
All ELPs are named using the following notation: ELP[XiYjZk-n] where the bracketed capital letters are single letter amino acid codes of a guest residue, their corresponding subscripts denote the ratios of that guest residue in the monomer, and n indicates the number of pentapeptides in the ELP. For example, ELP[KV7F-36] is an ELP that contains 36 repeats of the VPGXG pentapeptide, in which one pentapeptide contains K at the 4th, guest residue position (X), another pentapeptide has F at the 4th position, and 7 pentapeptides have V at the 4th position.
Monomer ELP gene design, synthesis, and oligomerization
Standard molecular biology protocols were used for all DNA manipulation steps in ELP gene cloning.12 All restriction endonucleases and T4 DNA ligase were purchased from New England Biolabs, (Beverly, MA), and calf intestinal alkaline phosphatase was obtained from Gibco BLR-Life Technologies (Grand Island, NY).
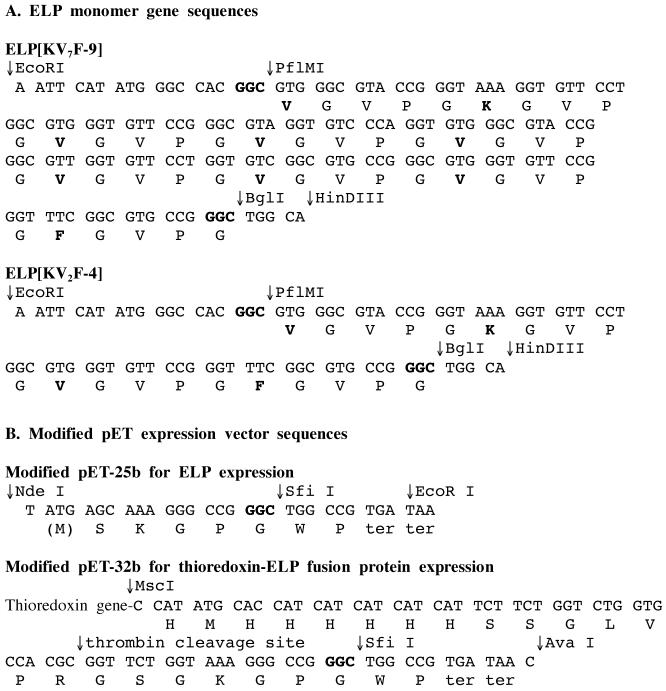
Monomer ELP genes of ELP[KV2F-4] and ELP[KV7F-9] (Figure 1A) were synthesized by ligating double stranded oligonucleotide cassettes that were created by either annealing 5′ phosphorylated synthetic oligonucleotides (Integrated DNA Technologies, Coralville, IA) or were excised from previously synthesized ELP genes in pUC19.26 Monomer genes were oligomerized by recursive directional ligation (RDL)12 to create genes for ELP[KV2F-8, 16, 32, 64, 128] and ELP[KV7F-18, 36, 72, 144] that encode ELPs with molecular weights (MWs) ranging from 7.7 to 55.7 kDa and from 8.4 kDa to 61.1 kDa, respectively. ELP[KV2F] and ELP[KV7F] genes were ligated separately into the SfiI site of a modified pET-25b(+) vector (Figure 1B), as previously described.3 The same ELP genes were also ligated into the SfiI site of a modified pET32a(+) vector (Figure 1B), as previously described,3 to express the corresponding series of Trx-ELP fusion proteins.
Figure 1.
Cloning scheme for cationic ELPs and their ELP fusion proteins showing coding DNA strand, the corresponding amino acid sequence, the ELP guest residue amino acids in bold, and the location of key endonuclease restrictions sites. PflM I and Bgl I restriction enzymes are used for recursive directional ligation to oligomerize ELP monomer genes in (A) as well as for gene excision for subcloning into pET expression vectors at the SfiI site shown in (B).
Gene expression and purification of ELPs and Trx-ELP fusion proteins
The E. coli strain, BLR (DE3) cells (Novagen Inc., Milwaukee, WI) were transformed with the modified pET-25b(+) and pET32a(+) expression vectors containing the ELP and Trx-ELP genes. E. coli were cultured and purified as previously described.3,4 Briefly, 50 ml of transformed cells were cultured in triplicate for 24 h, without induction, at 37 °C with orbital shaking at 200 rpm in CircleGrow™ media (Qbiogene, Carlsbad, CA) supplemented with 100 μg/ml of ampicillin.14 ELP and Trx-ELP fusions were purified by ITC, as previously described.3 Briefly, cells from 50 ml cultures were harvested by centrifugation at 4 °C, resuspended in PBS buffer (137 mM NaCl, 2.7 mM KCl, 4.2 mM NaH2PO4, 1.4 mM KH2PO4, pH 7.3) supplemented with a protease inhibitor cocktail (Roche catalog number 1697498) and lysed by ultrasonic disruption at 4 °C. The lysate was centrifuged in order to remove insoluble cell debris. Nucleic acids were precipitated by the addition of polyethyleneimine (0.5 % w/v final concentration) and were removed by centrifugation. The inverse phase transition of the ELP fusion proteins were triggered by the addition of NaCl (0.25-3 M), and the aggregated ELP proteins were separated from the lysate by centrifugation at moderate temperatures (25-37 °C). The aggregated fusion proteins were resolubilized in cold PBS buffer, and the resolubilized protein solutions were centrifuged at 4 °C to remove any particulate contaminants. This aggregation and resolubilization process was repeated 3-4 times until purity of the fusion proteins was approximately 95%, as ascertained by SDS-PAGE.
Characterization of ELPs and Trx-ELP fusion proteins
The concentration of ELPs and Trx-ELP fusion proteins was determined by their molar extinction coefficients at 280 nm (5690 M-1cm-1 for ELPs and 19870 M-1cm-1 for Trx-ELPs) calculated from their primary amino acid sequence with the software program, Protean (DNA Star). Their absorption at 280 nm was measured by UV-visible spectrophotometry (UC-1601, Shimadzu Scientific Instruments). Purity and molecular weight of ELPs and Trx-ELP fusion proteins were characterized by SDS-PAGE (BioRad, Inc., Hercules, CA) with copper staining and matrix-assisted laser desorption/ionization mass spectroscopy (MALDI-MS), performed on a PE Biosystems Voyager-DE instrument equipped with a nitrogen laser (337 nm). The ELP samples for MALDI-MS measurements were prepared in an aqueous 50% (v/v) acetonitrile solution containing 0.1 % (v/v) trifluoroacetic acid, using a sinapinic acid matrix.
The effect of increasing temperature on the turbidity of the ELP solutions was measured at 350 nm on a Cary 300 UV-visible spectrophotometer equipped with a multicell thermoelectric temperature controller (Varian Instruments, Walnut Creek, CA) between 10°C and 90°C at a rate of 1°C/min. The inverse transition temperature (Tt) of each ELP fusion protein was defined as the temperature at which the first derivative of the turbidity as a function of temperature was the maximum. The sensitivity of Tt to ionic strength was defined by the slope of a linear fit of the Tt as a function of NaCl concentration (ΔTt/M NaCl) in phosphate buffered saline (PBS).
Statistical Analysis
To quantitatively evaluate the linearity of the ELP and Trx-ELP salt sensitivity trends, the Tt data for each ELP as a function of salt was fit by linear regression. The residual at each data point was determined from the difference between the observation and the best-fit line, and the squared residuals were then log10 transformed to meet equality of variance assumptions. The transformed fit residuals were compared by a three-way ANOVA using SPSS version 14.0.0 (Chicago, IL). Three variables were considered: (1) the ELP library (KV7F or KV2F); (2) the presence of Trx (yes or no); and (3) the polymer length (short, medium, or long).
Results and Discussion
Purification of cationic ELPs and their Trx fusions
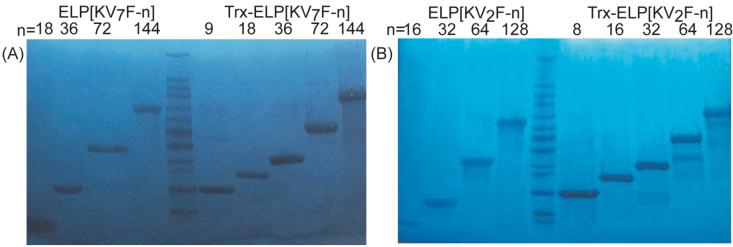
Figure 2 shows copper stained SDS-PAGE gels of purified ELP[KV2F] and ELP[KV7F] of differing molecular weights as well as their corresponding Trx-ELP fusion proteins. The gels show that the purified ELPs and their Trx-ELP fusions migrate to positions that are approximately consistent with molecular weights 20% greater than the molecular weights calculated from their engineered DNA sequences; this observation is typical of previously characterized ELPs.12,27 However, MALDI-MS indicated that for all ELPs and their Trx fusions, experimentally measured molecular weights were within 0.1-0.5% of their calculated molecular weights.
Figure 2.
Copper stained SDS-PAGE gels of purified (A) ELP[KV7F] (lanes 1-4) and Trx-ELP[KV7F] (lanes 6-10) and (B) ELP[KV2F] (lanes 1-4) and Trx-ELP[KV2F] (lanes 6-10) . Lane M (lane 5 on both gels) contains molecular size markers (205, 116, 97, 84, 66, 55, 45, 36, 29, 24, 20, 14, 7 kDa from top to bottom). Each lane is marked with the number of pentapeptide repeats (n) in the ELPs and ELP fusion proteins. Lower MW fragments observed in Trx-ELP[KV2F] protein samples are the result of proteolytic cleavage within the linker peptide located between Trx and ELP domains.
ELP[KV2F-8] and ELP[KV7F-9], with only 40 and 45 amino acids (4.3 kDa and 4.6 kDa), respectively, are the shortest tags, to date, that have been used to purify an ELP fusion protein by ITC; however their corresponding free ELPs could not be purified by ITC. Although the exact reasons for this remain unclear, two problems -the decrease of ELP expression (data not shown) and the increase in ELP Tt with decreasing molecular weight- compound the purification of very low molecular weight ELPs (Table 1). These combined effects are likely responsible for the observations that the inverse phase transition of ELP[KV2F-8] and ELP[KV7F-9] could not be detected in cell lysate and no ELP could be retrieved by ITC. However, Trx fusions to these very short ELPs were successfully purified by ITC, which is consistent with the facts that Trx is an over-expressed protein in E. coli, and fusion to Trx lowers the Tt of these ELPs, such that the addition of 3 M NaCl is enough to trigger the phase transition of the fusion protein.
Table 1.
Molecular weight, lysine (K) and phenylalanine (F) content, transition temperature (Tt) and fusion ΔTt parameters for purified ELPs and Trx-ELPs at 25 μM in PBS (N/A*: not available)
| Purified ELPs |
Purified Trx-ELPs |
fusion ΔTt parameter | |||||
|---|---|---|---|---|---|---|---|
| ELPs | # pentapeptides | #K or F residues | Observed MW (kDa) | Tt (°C) | Observed MW (kDa) | Tt (°C) | |
| [KV7F] | 9 | 1 | N/A* | N/A* | 18.5 | >90.0 | N/A* |
| 18 | 2 | 8.4 | >90.0 | 22.2 | 73.1 | >-16.9 | |
| 36 | 4 | 15.8 | 48.0 | 29.7 | 42.1 | -5.9 | |
| 72 | 8 | 31.0 | 35.7 | 44.9 | 34.0 | -1.7 | |
| 144 | 16 | 61.1 | 26.1 | 74.9 | 28.4 | 2.3 | |
| [KV2F] | 8 | 2 | N/A* | N/A* | 18.1 | >90.0 | N/A* |
| 16 | 4 | 7.7 | >90.0 | 21.5 | >90.0 | N/A* | |
| 32 | 8 | 14.5 | >90.0 | 28.4 | 67.4 | >-22.6 | |
| 64 | 16 | 28.4 | 60.7 | 42.1 | 43.1 | -17.6 | |
| 128 | 32 | 55.7 | 42.4 | 69.6 | 37.3 | -5.1 | |
The copper-stained SDS-PAGE gel in Figure 2B shows several smaller MW bands in the purified Trx-ELP[KV2F-32, 64, and 128] products. Analysis of MALDI-MS data indicates that all of the Trx-ELP[KV2F] fusions, except Trx-ELP[KV2F-8], contain minor contaminants, the largest of which is consistently 13.4 ± 0.45 kDa smaller than the Trx-ELP fusion protein from which it is derived. This difference in size approximately corresponds to the MW of Trx that would be liberated from the ELP by enzymatic cleavage with thrombin (13.9 kDa), suggesting that there are two or three sites within the SSGLVPRGS linker region of the Trx-ELP fusion protein that are susceptible to enzymatic attack by E. coli proteases. Because this minor contamination product likely consists of the cleaved ELP fragment of the fusion, it is co-purified with the Trx-ELP fusion through multiple rounds of ITC and hence, is present in the final purified product. Furthermore, we hypothesize that ELP[KV2F] fusions are more susceptible to proteolysis than ELP[KV7F] fusions because of conformational differences caused by different interactions between Trx and ELP domains in the fusion proteins. Clues to these conformational differences can be elucidated from analysis of the thermal properties of these ELPs and their Trx fusions (vide infra).
Thermal Characterization of ELPs and Trx-ELP fusion proteins
Figure 3 and Table 1 show the Tts of all expressed ELPs and Trx-ELP fusion proteins at a concentration of 25 μM in PBS over the experimentally accessible temperature range of 20 to 90 °C. The Tts of a number of ELPs and Trx-ELP fusions could not be accurately measured under these solution conditions because they were higher than 90°C (Table 1). In general, the Tts of members of the ELP[KV2F] series are 16 to 42 °C higher than those of the ELP[KV7F] series of similar MW, reflecting their > 2-fold greater lysine content. ELP[KV2F] series ELPs have Tts that are very similar to ELPs of similar MW having a guest residue composition of 50%valine, 20% alaine, and 30% glycine (ELP[V5A2G3]),12,13 the most widely used ELP fusion protein purification tag.3,4,14,15 In contrast, the ELP[KV7F] series exhibit Tts approximately 20°C lower than their size-matched ELP[V5A2G3] counterparts.
Figure 3.
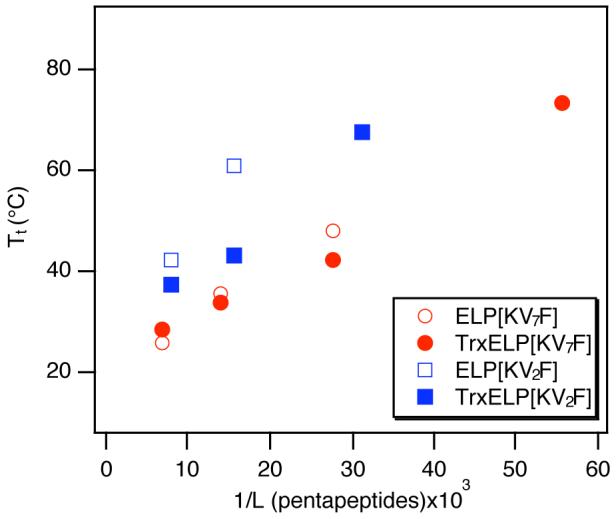
Plot of transition temperature as a function of 1/length of ELP pentapeptid×103 for ELPs and thioredoxin-ELPs. The transition temperature was measured from 25 μM solutions of ELP and Trx-ELP in PBS, and the data supports a linear relationship between Tt and 1/ELP length similar that observed for other ELPs.30 Linear regression shows r2=0.986 for ELP[KV7F], r2= 0.983 for Trx-ELP[KV7F], and r2=0.977 for Trx-ELP[KV2F]. Goodness of fit could not be established for ELP[KV2F] polymers because only two of the four expressed ELP[KV2F] proteins have measurable Tt (below 90°C) at 25 μM in PBS.
We have previously reported that the Tt of a set of aliphatic ELPs could be predicted by a simple equation which accounts for the ELP concentration and its length, where the Tt is inversely proportional to the length of the ELP.13 Figure 3 shows that the Tts of these cationic ELPs and Trx-ELP fusions also exhibit a linear relationship with 1/length of ELP pentapeptides. ELP[KV2F] polypeptides and Trx fusions have steeper slopes than their corresponding ELP[KV7F] counterparts, which indicates that the fraction of Lys residues in these cationic ELPs dominates their change in Tt with ELP length. Although we were only able to measure the Tt at 25 μM in PBS for a small subset of the ELP and Trx-ELP proteins (Tt<90°C), limiting our ability to measure the goodness of the linear fits, these data suggest that this linear correlation is not limited to aliphatic ELPs. It appears that cationic ELPs and their Trx fusions also exhibit linear correlations with 1/ELP length as well. Thus, the Tts of ELPs and Trx-ELPs can be reasonably approximated by these correlations, allowing the Tts for new ELP lengths to be predicted for these amino acid compositions. This knowledge provides a predictive tool to control the phase transition behavior of ELPs and their fusion proteins for different applications.
Figure 3 and Table 1 also show the effect that fusion of Trx to these ELPs has on the ELP Tt. In general, fusion of Trx to ELP[KV2F] and ELP[KV7F] results in a depression in the ELP Tt relative to the free ELP (negative fusion ΔTt parameter), and the magnitude of this depression depends on the ELP sequence. ELP[KV2F] sequences show a greater fusion ΔTt parameter than ELP[KV7F] sequences. Only ELP[KV7F-144] exhibits a positive fusion ΔTt parameter, as the Tt of its Trx fusion is elevated by approximately 2 °C. The negative fusion ΔTt parameter, observed for most of these ELPs, contrasts with the results of a previous study of Trx-ELP fusion proteins, in which fusion of Trx to an ELP having only aliphatic guest residues resulted in an elevation of the ELP Tt by ∼6 °C.15
These previous studies showed that the fusion ΔTt parameter exhibits a linear negative correlation with the fraction of hydrophobic surface area of the fused protein. These studies were performed using a single ELP tag, ELP[V5A2G3-90] and different fusion partners.15 In this study, however, we have a single protein, Trx, but the composition and the hydrophobicity of the ELP are altered by variations in both guest residue composition and ELP length.
There are two plausible explanations for the observed changes in the sign of the fusion ΔTt parameter: enhanced interaction between Trx and ELP domains via hydrophobic contacts or electrostatic attraction between positively charged Lys residues in the ELP and negatively charged acidic residues on the surface of Trx. We note that the latter possibility is unique to the cationic ELPs studied here, as the aliphatic ELP[V5A2G3-90] in the previous study only had Val, Ala and Gly at the guest residue position. The Tts of ELP[KV7F] proteins are 16 to 42 °C lower than ELP[KV2F] polypeptides indicating that for the same concentration and similar molecular weight they are more hydrophobic; however, when fused to Trx, ELP[KV2F] polypeptides exhibit a greater negative fusion ΔTt parameter, indicating that in this case it is not the net hydrophobic character of the ELP that is responsible for the changes in the fusion ΔTt parameter. Instead, the sign and magnitude of their fusion ΔTt parameter are consistent with electrostatic attraction between the positively charged lysine residues on these ELPs and negatively charged Asp and Glu residues present on the surface of Trx. The isoelectric point of Trx, calculated from its primary sequence is 4.5, indicating that at pH 7, each Trx molecule has a formal charge of nearly -5, so that it presents a negatively charged surface with which positively charged ELPs may favorably interact. Electrostatic interaction between the cationic ELPs and Trx then results in the neutralization of charged moieties in the ELP, which lowers the Tt of the fused ELP, resulting in a negative ΔTt parameter. As ELP[KV2F] tags have more than twice the fraction of charged lysine residues, their Tts are depressed to greater extent by fusion to Trx than ELP[KV7F], so that they have greater negative ΔTt parameters.
Salt sensitivity of cationic ELPs and their Trx fusion proteins
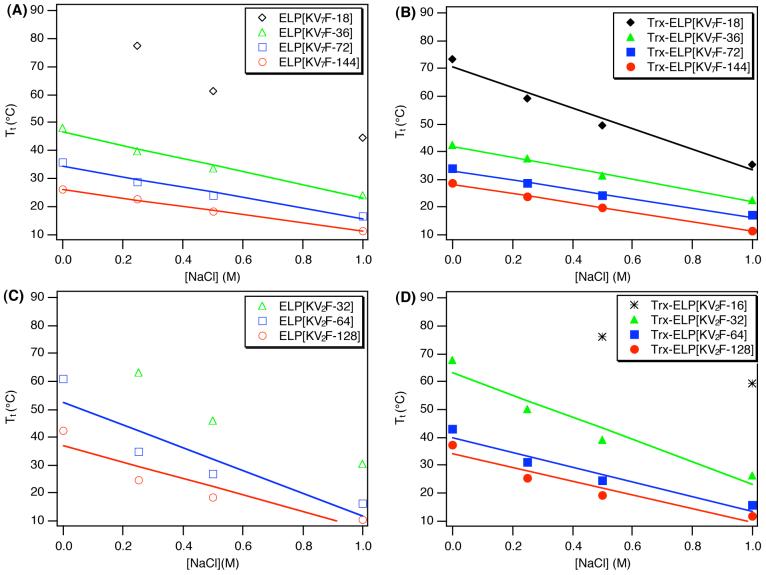
Figure 4 shows the effect of NaCl concentration on the Tt of the ELPs (Figures 4A and 4C) and their Trx fusions (Figures 4B and 4D). As is typical of all ELPs, the Tt decreases with NaCl concentration, and this trend holds true for their Trx fusions as well. Comparison of panels A and C in Figure 4 shows that the Tt of ELP[KV2F] proteins are more greatly affected by NaCl concentration than ELP[KV7F] proteins, as indicated by their steeper slopes. These trends can be quantitatively evaluated by fitting linear correlations to the data in Figure 4A-D.
Figure 4.
Plot of transition temperature as a function of NaCl concentration and molecular weight for (A) ELP[KV7F], (B) Trx-ELP[KV7F], (C) ELP[KV2F], and (D) Trx-ELP[KV2F]. The transition temperature was measured from 25 μM ELP and Trx-ELP solutions in PBS with each added NaCl concentration. ELP[KV7F] (r2 from 0.980 to 0.998) and Trx-ELP[KV7F](r2 from 0.974 to 0.999) exhibit largely linear trends in Tt as a function of NaCl concentration, while ELP[KV2F] (r2 from 0.840 to 0.860) and Trx-ELP[KV2F] (r2 from 0.918-0.941) proteins show more non-linear character consistent with their higher ELP charge densities. Best fit linear correlations to salt sensitivity data were plotted only for ELPs and Trx-ELPs where the Tt could be accurately measured at all four tested NaCl concentrations in PBS (0, 0.25, 0.5, and 1 M NaCl). These correlations are summarized in Figure 5.
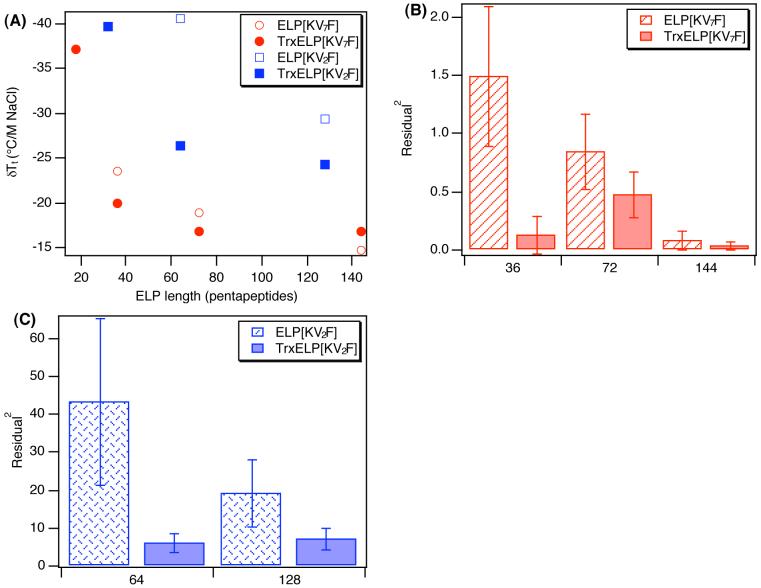
Figure 5A plots the slopes of these linear correlations as a function of ELP length for both the ELPs and their Trx fusions, and Figure 5B and 5C show the average of the squared fit residuals for each correlation for ELP[KV7F] and ELP[KV2F] proteins with and without the presence of Trx. Only proteins whose Tt could be measured (Tt<90°C) in PBS for both the ELP and corresponding Trx-ELP protein have been plotted and statistically analyzed to determine the effects of ELP composition and added Trx on the error in the linear fit.
Figure 5.
Sensitivity of the ELP and Trx-ELP phase transition to added NaCl as a function of ELP length. (A) δTt/M of NaCl taken from the slope of a linear fit to the data in Figure 4 plotted as a function of number of ELP pentapeptides for ELPs and Trx-ELPs. Linear fit error is expressed as average of the squared fit residuals for (B) ELP[KV7F] and (C) ELP[KV2F] proteins and corresponding Trx fusions. ELP[KV2F] proteins were found to be significantly more non-linear than ELP[KV7F] proteins (p= 1.0×10⁻⁹) in their sensitivity to added salt, and error in the linear fit over all the ELP fusion proteins is significantly reduced (p=0.0033) upon fusion to Trx. Error bars reflect the standard deviation for n=4 salt concentrations per protein.
Free ELP[KV2F] polypeptides exhibit the greatest sensitivity to NaCl, followed by Trx-ELP[KV2F], ELP[KV7F], and Trx-ELP[KV7F]. Although the slopes plotted in Figure 5A are derived from linear fits to the data in Figure 4, it is clear from Figure 4 as well as Figures 5B and 5C that not all the ELPs and their Trx fusions exhibit a linear change in Tt with NaCl concentration. The salt sensitivity of ELP[KV7F] polypeptides and their Trx fusion proteins are better approximated by a linear fit than the ELP[KV2F] and their Trx fusions. Figure 5B and 5C shows the average squared fit residuals for the ELPs and their corresponding Trx fusions for which Tt could be measured (Tt<90°C) in PBS without any added salt. Figure 5C shows that ELP[KV2F] proteins have average squared fit residuals between 20 and 45 compared to ELP[KV7F] proteins (Figure 5B), which have average squared fit residuals of less than 1 for the proteins of similar length. When similar length proteins are directly compared, the average squared fit residuals for ELP[KV2F] proteins are as much as 270 fold higher than ELP[KV7F] proteins with ELP[KV2F] proteins. The deviation from linearity is correlated with the net charge on the ELP, as the more highly charged ELP[KV2F] polypeptides having 5% cationic residues are more poorly fit by a linear function, than the ELP[KV7F] polypeptides, which have only 2% cationic content.
We believe that electrostatic repulsion between the ELP and Trx are responsible for the nonlinear changes in Tt with salt concentration. Previous studies of purely aliphatic ELPs (with no ionizable amino acid content) have shown that Tt is linearly correlated with NaCl (-14°C/M NaCl).10 ELP[KV7F-72], which has only 2% positively charged lysine residues, exhibits a 19 °C/M NaCl depression and can be reasonably fit by a linear function having an average squared residual of only 0.84. In contrast, ELP[KV2F-64], which has more than twice the cationic character (5%), exhibits a 40 °C/M NaCl depression in Tt and is poorly fit by a linear model, exhibiting an average squared fit residual of 43. Addition of Trx to both these polymers not only reduces the slope of the Tt depression to 17 and 26 °C/M NaCl for ELP[KV7F-72] and ELP[KV2F-64] proteins, respectively. Furthermore, it also reduces the average squared fit residuals by 1.8 and 7.2 fold, respectively. We believe these changes in slope and linear fit error are a function of Coulombic repulsion, which is a non-linear effect of the solution ionic strength as described by Debye-Huckel screening. The Debye length, which is a measure of the distance over which electrostatic effects are damped out by mobile ions in an aqueous solution, is inversely proportional to the square root of the solution ionic strength.28 Thus, in low ionic strength buffer, like charges in the ELP would repel one another over greater distances inhibiting aggregate formation and leading to elevated Tt,s. This charge screening hypothesis is consistent with the fact that the greatest non-linearity in Tt as a function of ionic strength is observed for the ELPs with the greatest cationic content and that the addition of the negatively charged ELP reduces the net charge in the fusion leading to increased linear behavior in the Tt with NaCl concentration.
Overall trends in the linearity of fit behavior and the significance of fused Trx to this behavior were determined by statistical analysis of the squared fit residuals. A global 3-way ANOVA was found to significantly fit the entire dataset (F9,30=12.9, p=4.0×10⁻⁸, R2=0.795). The statistical analysis pointed to two significant main effects of (1) ELP identity (F1,30=76.1, p=1.0×10⁻⁹); and (2) the fusion of Trx (F1,30=10.2, p=0.0033), confirming the visually observable differences between the thermal behavior ELP[KV7F] and ELP[KV2F] polymers. This model also controlled for an expected significant main effect of ELP length (F2,30=9.42, p=0.00067) and a two-way interaction between ELP and length (F1,30=11.2, p=0.0023). Since the primary goal of this analysis was to compare deviation from linearity between ELP[KV7F] and ELP[KV2F] with and without fused Trx, and since there was no interaction between Trx and ELP, we did not split the dataset to further explore the significance of length on the ELPs and corresponding Trx-ELPs. The main effects from 3-way ANOVA of Trx and ELP on the linearity of Tt with added NaCl indicate two things. First, the charge density of ELP has a significant effect on linearity between Tt and added salt. ELP[KV2F] was significantly (p=1.0×10⁻⁹) more non-linear than ELP[KV7F]. Second, the fusion of a negatively charged Trx protein to cationic ELPs overall significantly improved the linearity between Tt and added salt (p=0.0033). The significant improvement in linearity upon fusion to Trx suggests that the fusion of the negatively charged Trx to the cationic ELPs effectively reduces the net cationic charge in the fusion protein, promoting Tt salt sensitivity that more closely approximates that exhibited by non-ionic ELPs. This indicates that ELP to fused protein interactions are likely important to the formation of aggregates above Tt, especially at lower ionic strengths. Furthermore, these data suggest that ELP/target protein interactions are improved by matching anionic target proteins with cationic ELPs. By extrapolation, we suggest that cationic proteins should be fused to anionic ELPs in order to improve ELP-protein interactions in the aggregated state.
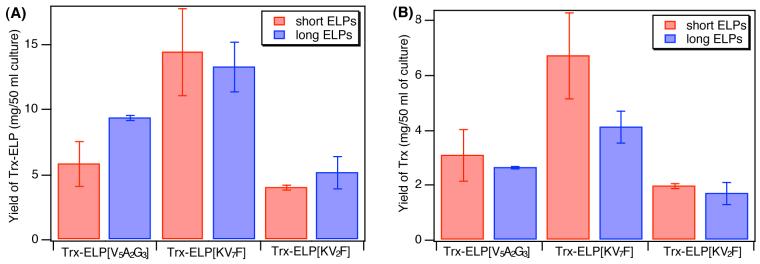
Because of the heightened sensitivity of charged ELPs and their Trx fusions to NaCl, we would anticipate that Trx-ELP would be purified from soluble E. coli lysate with a minimum of added salt by using a relatively short ELP[KV2F] fusion tag; however, in practice we found that more NaCl was necessary to purify Trx-ELP[KV2F] proteins from soluble lysate than Trx-ELP[KV7F] proteins. This unanticipated problem was found to result from the strong dependence of fusion protein yield on the ELP, which altered the ELP concentration in the soluble lysate. Figure 6 shows the quantitative yield of the Trx-ELP fusion protein and the corresponding mass of Trx target protein calculated based on its mass fraction in each fusion for short (30-36 pentapeptides) and long (64-90 pentapeptides) ELPs from three different series: ELP[KV7F], ELP[KV2F], and ELP[V5A2G3]. The last series is included because it is the most commonly used ELP tag for purification of recombinant proteins. Figure 6A shows that the yield of Trx-ELP[KV7F-36] is approximately 2.5 times higher than Trx-ELP[V5A2G3-30] and 3.6 times higher than Trx-ELP[KV2F-32] proteins, suggesting that the yield of Trx-ELP fusion proteins is dependent on the stoichiometry of the guest residue position of the fused ELP tag, which may arise from changes in mRNA stability and translation efficiency of the ELP tag.29
Figure 6.
Yield of (A) Trx-ELP fusion proteins and (B) target Trx protein from 50 mL of E.coli culture as a function of the ELP length (30-36 pentapeptides for the short tags and 64-90 pentapeptides for the long tags) and guest residue composition of the ELP purification tag. Protein yield is reported as the mean±SD (n=3). The gravimetric yield of Trx is higher for the lower molecular weight tag (30-36 pentapeptides) in the case of all three ELP guest residue compositions and the yield of Trx-ELP is greatest for the ELP[KV7F] tags. The poorest fusion protein and target protein yield was exhibited by the ELP[KV2F] proteins suggesting that expression is highly dependent on the guest residue composition and not easily predictable.
In addition, decreasing the length of the ELP tag can be advantageous for fusion protein expression: we previously showed that reducing the length of the ELP purification tag from 90 to 20 pentapeptides, resulted in a ∼4 fold increase in the yield of Trx in the ELP fusion.4 This is consistent with the data in Figure 6B. The yield of Trx from the shorter fusion proteins is 1.1-1.6 times that of the yield from the corresponding longer ELP fusions. Trx-ELP[KV7F-36] has more than 1.6-fold greater Trx yield than that from Trx-ELP[KV7F-72], which is more than 2.5-fold greater than that from Trx-ELP[V5A2G3-90], which utilizes the most commonly used ELP purification tag. Furthermore, the Trx yield from Trx-ELP[KV7F-32] is approximately 1.5-fold greater than that from Trx-ELP[V-20], the fusion boasting the highest Trx published yield to date.4 Although ELP[KV7F-36] is somewhat longer than ELP[V-20] it has a significant advantage as a purification tag since the Trx fusion was completely retrieved from the E. coli lysate without any loss during ITC. In contrast, Trx-ELP[V-20] forms nanoparticles, which cannot be easily recovered by centrifugation, which is a well-documented problem observed in the purification of Trx-ELP[V-20].4
To deconvolute the coupled effects that ELP Tt, salt sensitivity, and Trx-ELP expression yield have on the purification efficiency of Trx-ELP fusion proteins, the Tt of Trx-ELP fusion proteins was measured at a fixed concentration in E. coli soluble lysate as well as in PBS. Figure 7 shows the difference in Tt between 0.5 M and 1.0 M NaCl (ΔTt(NaCl)) added to 100 μM Trx-ELP solutions in PBS and soluble E. coli lysate for Trx-ELP[KV7F-36], Trx-ELP[KV2F-32], and Trx-ELP[V5A2G3-90]. These data indicate that the sensitivity of cationic ELP fusion proteins is maintained in the soluble lysate. For each of the proteins investigated the ΔTt(NaCl) in lysate and PBS do not exhibit a significant difference. Trx-ELP[KV2F-32], which has the highest cationic content in the ELP exhibits the greatest sensitivity to salt in the soluble lysate, similar to its behavior in PBS buffer. However, this sensitivity to salt does not positively impact its purification as an expression product due to its poor expression yield. Conversely, the improved expression yield combined (Figure 6) with similar salt sensitivity (Figure 7) and a lower Tt (Table 1 and Figure 3) allows Trx-ELP[KV7F-36] to be purified using 1/3 of the salt that is needed to purify Trx-ELP[V5A2G3-90] (the most commonly used purification tag) with a 2.6-fold improvement in the gravimetric yield of Trx. Furthermore, Trx-ELP[KV7F-36] exhibits a 50% increase in Trx gravimetric yield over that purified from Trx-ELP[V-20], the most successful Trx tag previously published, using only 20% of the added salt without the complication of nanoparticle formation exhibited by the ELP[V-20] tag.4
Figure 7.
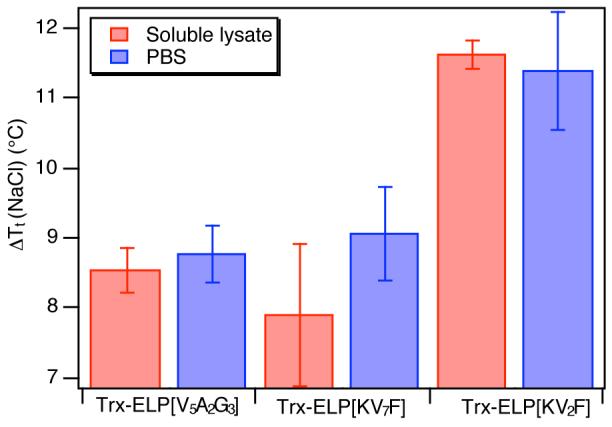
Transition temperature difference (ΔTt(NaCl)) between 0.5 and 1M NaCl added to E. coli soluble lysate and to PBS solutions of 100 μM Trx-ELP[KV7F-36], Trx-ELP[KV2F-32], and Trx-ELP[V5A2G3-90]. There is no significant difference between lysate and PBS in the ΔTt(NaCl) in for any of the proteins investigated. The transition temperature difference (ΔTt(NaCl) is reported as the difference in the mean Tts at 0.5M and 1M NaCl (n=3 for each salt concentration) ± the standard deviation calculated by the propagation of errors in the measurements of Tt with 0.5 and 1M NaCl.
Conclusions
The first important finding of this study is that the ELP tag can be significantly shortened without introducing any complications in the purification of a model protein, Trx. ELP[KV7F-8] with a MW of ∼4.5 kDa is the shortest ELP that has been used to purify an ELP fusion protein to date, and ELP[KV7F-36], the most optimized tag engineered to date for the purification of Trx, has a MW of only 15.9 kDa. The MW of ELP[KV7F-8] is similar to that of many peptide affinity tags, while that of the optimized ELP[KV7F-36], is significantly smaller than or similar to many protein affinity tags.
The study of cationic tags for the purification of Trx also uncovered molecular parameters that will be important for the design of future ELP tags for purification of recombinant proteins. These are: (1) the incorporation of ionizable residues into the ELP sequence enhances the sensitivity of the ELP inverse phase transition to added salt and thereby reduces the amount of salt needed to induce the inverse phase transition in the soluble lysate. (2) The incorporation of ionizable groups must be balanced by the addition of hydrophobic residues in order to maintain a reasonable Tt of the ELP. The optimal Tt should be above room temperature at all working fusion protein concentrations, but should be designed to be reasonably low so that only a minimum of salt must be added at each round of ITC. (3) The ELP molecular weight should be minimized to improve target protein yield; however, it should be high enough that micellization or nanoparticle formation above the phase transition is not observed. (4) The guest residue composition significantly affects the expression yield of the ELP and thus the ELP fusion protein, so that well-expressed ELP sequences should be used as purification tags. Because the cause of sequence dependent expression is, as yet, unknown, this variable will be difficult to predict and control. (5) Finally, the data suggest that it the incorporation of cationic residues into ELPs is effective in promoting ELP-protein interactions in the aggregated state of the anionic Trx-ELP fusion proteins. We believe that oppositely charged Trx and ELPs aid the formation of large aggregates during fusion protein purification. Bearing this in mind, we caution that the design of ELP fusion proteins having like charge characteristics in both the target protein and ELP might inhibit aggregate formation and thereby complicate ELP fusion protein purification.
In conclusion, we believe that for most laboratory scale purification by ITC, optimization of the ELP tag is probably not necessary, as the most commonly used aliphatic ELP tags are sufficiently versatile to provide purified fusion proteins with yields and purities that are typically similar to, if not greater, than those achieved with affinity chromatography.14 However, the results presented here suggest that large-scale purification of recombinant proteins for pharmaceutical or industrial applications will benefit from optimization of the ELP tag for a specific protein to maximize its expression yield and purification efficiency.
Acknowledgments
We would like to thank Tennyson Liu, for performing preliminary ELP cloning steps necessary to synthesize all the ELP and ELP fusion proteins genes reported in this work. We also thank the National Institutes of Health (GM061232, F32-CA123889) for their financial support of this research.
References
- (1).Nilsson J, Stahl S, Lundeberg J, Uhlen M, Nygren PA. Protein Expression And Purification. 1997;11:1–16. doi: 10.1006/prep.1997.0767. [DOI] [PubMed] [Google Scholar]
- (2).Mondal K, Gupta MN. Biomolecular Engineering. 2006;23:59–76. doi: 10.1016/j.bioeng.2006.01.004. [DOI] [PubMed] [Google Scholar]
- (3).Meyer DE, Chilkoti A. Nature Biotechnology. 1999;17:1112–1115. doi: 10.1038/15100. [DOI] [PubMed] [Google Scholar]
- (4).Meyer DE, Trabbic-Carlson K, Chilkoti A. Biotechnology Progress. 2001;17:720–728. doi: 10.1021/bp010049o. [DOI] [PubMed] [Google Scholar]
- (5).Urry DW. Journal Of Physical Chemistry B. 1997;101:11007–11028. [Google Scholar]
- (6).Li B, Alonso DOV, Bennion BJ, Daggett V. Journal Of The American Chemical Society. 2001;123:11991–11998. doi: 10.1021/ja010363e. [DOI] [PubMed] [Google Scholar]
- (7).Li B, Alonso DOV, Daggett V. Journal Of Molecular Biology. 2001;305:581–592. doi: 10.1006/jmbi.2000.4306. [DOI] [PubMed] [Google Scholar]
- (8).Cacace MG, Landau EM, Ramsden JJ. Quarterly Reviews Of Biophysics. 1997;30:241–277. doi: 10.1017/s0033583597003363. [DOI] [PubMed] [Google Scholar]
- (9).Zhang YJ, Trabbic-Carlson K, Albertorio F, Chilkoti A, Cremer PS. Biomacromolecules. 2006;7:2192–2199. doi: 10.1021/bm060254y. [DOI] [PubMed] [Google Scholar]
- (10).Luan CH, Parker TM, Prasad KU, Urry DW. Biopolymers. 1991;31:465–475. doi: 10.1002/bip.360310502. [DOI] [PubMed] [Google Scholar]
- (11).Chow DC, Dreher MR, Trabbic-Carlson K, Chilkoti A. Biotechnology Progress. 2006;22:638–646. doi: 10.1021/bp0503742. [DOI] [PMC free article] [PubMed] [Google Scholar]
- (12).Meyer DE, Chilkoti A. Biomacromolecules. 2002;3:357–367. doi: 10.1021/bm015630n. [DOI] [PubMed] [Google Scholar]
- (13).Meyer DE, Chilkoti A. Biomacromolecules. 2004;5:846–851. doi: 10.1021/bm034215n. [DOI] [PubMed] [Google Scholar]
- (14).Trabbic-Carlson K, Liu L, Kim B, Chilkoti A. Protein Science. 2004;13:3274–3284. doi: 10.1110/ps.04931604. [DOI] [PMC free article] [PubMed] [Google Scholar]
- (15).Trabbic-Carlson K, Meyer DE, Liu L, Piervincenzi R, Nath N, LaBean T, Chilkoti A. Protein Engineering Design & Selection. 2004;17:57–66. doi: 10.1093/protein/gzh006. [DOI] [PubMed] [Google Scholar]
- (16).Kim JY, Mulchandani A, Chen W. Biotechnology And Bioengineering. 2005;90:373–379. doi: 10.1002/bit.20451. [DOI] [PubMed] [Google Scholar]
- (17).Kim JY, O’Malley S, Mulchandani A, Chen W. Analytical Chemistry. 2005;77:2318–2322. doi: 10.1021/ac0484326. [DOI] [PubMed] [Google Scholar]
- (18).Kim JY, Mulchandani A, Chen W. Analytical Biochemistry. 2003;322:251–256. doi: 10.1016/j.ab.2003.08.009. [DOI] [PubMed] [Google Scholar]
- (19).Kostal J, Mulchandani A, Chen W. Biotechnology And Bioengineering. 2004;85:293–297. doi: 10.1002/bit.10890. [DOI] [PubMed] [Google Scholar]
- (20).Kostal J, Mulchandani A, Chen W. Macromolecules. 2001;34:2257–2261. [Google Scholar]
- (21).Gao D, McBean N, Schultz JS, Yan YS, Mulchandani A, Chen WF. Journal Of The American Chemical Society. 2006;128:676–677. doi: 10.1021/ja056364e. [DOI] [PubMed] [Google Scholar]
- (22).Kostal J, Yang R, Wu CH, Mulchandani A, Chen W. Applied And Environmental Microbiology. 2004;70:4582–4587. doi: 10.1128/AEM.70.8.4582-4587.2004. [DOI] [PMC free article] [PubMed] [Google Scholar]
- (23).Shimazu M, Mulchandani A, Chen W. Biotechnology And Bioengineering. 2003;81:74–79. doi: 10.1002/bit.10446. [DOI] [PubMed] [Google Scholar]
- (24).Banki MR, Feng LA, Wood DW. Nature Methods. 2005;2:659–661. doi: 10.1038/nmeth787. [DOI] [PubMed] [Google Scholar]
- (25).Ge X, Yang DSC, Trabbic-Carlson K, Kim B, Chilkoti A, Filipe CDM. Journal Of The American Chemical Society. 2005;127:11228–11229. doi: 10.1021/ja0531125. [DOI] [PubMed] [Google Scholar]
- (26).Trabbic-Carlson K, Setton LA, Chilkoti A. Biomacromolecules. 2003;4:572–580. doi: 10.1021/bm025671z. [DOI] [PubMed] [Google Scholar]
- (27).McPherson DT, Morrow C, Minehan DS, Wu JG, Hunter E, Urry DW. Biotechnology Progress. 1992;8:347–352. doi: 10.1021/bp00016a012. [DOI] [PubMed] [Google Scholar]
- (28).Creighton TE. Proteins: Structures and Molecular Properties. Second ed. W. H. Freeman and Company; New York: 1993. [Google Scholar]
- (29).Fexby S, Bulow L. Trends In Biotechnology. 2004;22:511–516. doi: 10.1016/j.tibtech.2004.08.005. [DOI] [PubMed] [Google Scholar]
- (30).Meyer DE, Chilkoti A. Biomacromolecules. 2003 in review. [Google Scholar]


