

Whereas the concept of absolute ionization energies, IEs, (or reduction energies) of isolated gas-phase atoms, molecules, and ions is well understood, and extensive data have been tabulated, the concept of comparable absolute values in solution is obfuscated by several factors. In solution, electrochemical half-cell potentials are measured on a relative basis and provide a ladder or scale of thermochemical values that is anchored to the standard hydrogen electrode (SHE), which is arbitrarily assigned a value of exactly 0 V. The development of an “absolute” electrode potential has been extensively debated,1 and the concept of such a potential has been described as “necessarily something very obscure and abstruse, which certainly escapes the comprehension of average minds. Something like the origin of life in the world, the Arabian phoenix of electrochemistry.”1c
In principle, the half-cell potentials of hydrated ions can be measured directly in the gas phase and for sufficiently large clusters, these values can potentially be related to solution-phase values. We recently demonstrated a method whereby extensively hydrated divalent ions are used as “nanocalorimeters” to measure the internal energy deposition when these ions are reduced by thermal electrons.2 Specifically, the binding energy of a water molecule to hydrated clusters rapidly approaches a value of ∼10 kcal/mol with increasing cluster size.2,3 When a thermal electron in the gas phase recombines with a cluster, energy corresponding to the recombination energy (RE) or adiabatic IE of the reduced species can potentially be deposited into the ion2 (Supporting Information Figure 1). The resulting internal energy distribution can be obtained from the number of water molecules that evaporate from the cluster. Electron capture by M(H2O)322+, M = Mg, Ca, Sr, and Ba, results in the loss of on average 10.0–10.3 water molecules from the reduced clusters, corresponding to an average internal energy deposition of ∼4.5 eV.2 The RE does not depend significantly on the metal ion identity despite the wide range in second IEs of the isolated gas-phase atoms (10.0 and 15.0 eV for Ba and Mg, respectively). This suggests that an ion–electron pair is formed in the reduced cluster. By comparison to calculated values for the RE for hydrated magnesium and calcium clusters, it was demonstrated that electron capture (EC) results in statistical dissociation for these extensively hydrated ions and that the RE values obtained from this experiment correspond to gas-phase reduction energies of the clusters.
Here, we show that the reduction energy of aqueous gas-phase nanodrops that have a concentration equivalent of 1 M Ru(NH3)63+ can be measured using our nanocalorimetry method. The binding energy of water to metal ions rapidly decreases with cluster size. For Ca(H2O)n2+, n = 6–14, the sequential water dissociation enthalpy decreases from 25.3 to 11.9 kcal/mol.4 For larger clusters, we expect that this value approaches about 10 kcal/mol; the heat of vaporization of water is 10.8 and 9.7 kcal/mol at 0 and 100 °C, respectively.5 Thus, it should be possible to quantify the energy deposition resulting from reduction of extensively hydrated trivalent ions from the numbers of water molecules lost from the reduced precursor ions.
Experiments were performed on a 2.75 T Fourier-transform ion cyclotron resonance mass spectrometer with an ion cell cooled to 130 K using a regulated flow of liquid nitrogen.6 Electrons are produced using a 1.0 cm heated cathode that is 20 cm from the cell center, and 40 ms electron radiation times were used.
Electrospray ionization of an aqueous ∼2 mM Ru(NH3)63+ solution results in a broad distribution of hydrated ions (Figure 1) that can be shifted to larger or smaller clusters.6b A nanodrop consisting of 55 water molecules and a single Ru(NH3)63+ corresponds to a concentration of about 1 M, which should be similar to the activity because no other ions are present. Isolation of Ru(NH3)6(H2O)553+, followed by reduction of these ions by thermally generated electrons results in three product ions: Ru(NH3)6(H2O)n2+, n = 36, 37, and 38 (Figure 2). In contrast to the alkaline earth cation clusters, Ru ions are likely reduced in these clusters. These results show that a weighted average of ∼18.2 water molecules are lost. Residual activation of the ions by blackbody radiation or collisions with residual gases result in a loss of <0.1 water molecules, and the average water loss from EC reported here is corrected for this minor background dissociation. From this value, an average internal energy deposition resulting from EC by the precursor ion of 18.2 × 10 kcal/mol ≈ 182 kcal/mol (7.9 eV) is obtained. The maximum energy deposition corresponds to a value between 19 and 20 water molecules lost or ∼8.2 to 8.7 eV. By comparison, the third IE of isolated Ru atoms is 28.5 eV. This indicates that the ions are significantly stabilized by solvation in the nanodrop. The deposited internal energy is reflected by the distribution and the intensity of the product ions.2,7 The observed distribution is very narrow and on the order of ±15 kcal/mol (0.7 eV).
Figure 1.
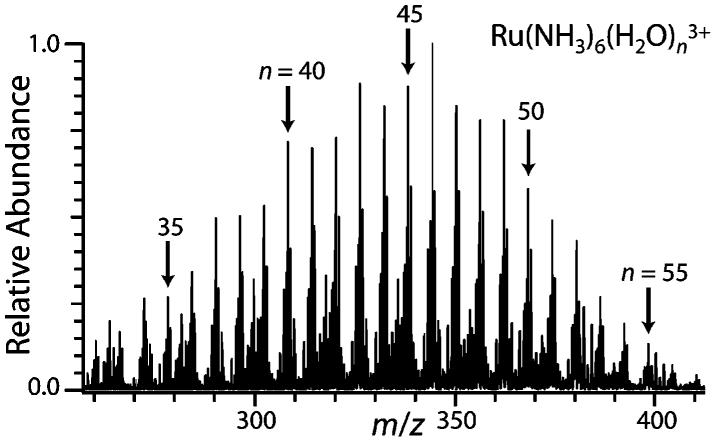
ESI mass spectrum of ∼2 mM aqueous Ru(NH3)63+ showing hydrated clusters, Ru(NH3)6(H2O)n3+, with n indicated in the figure.
Figure 2.
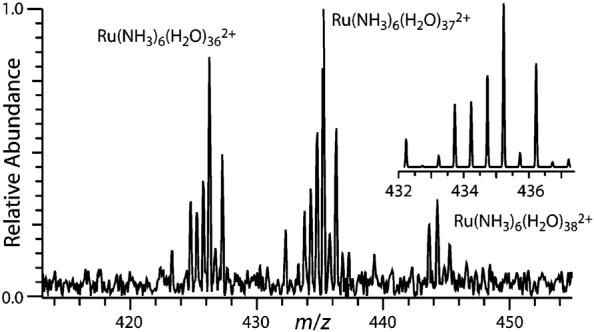
Electron capture dissociation products resulting from reducing isolated Ru(NH3)6(H2O)553+ with thermally generated electrons. Inset is the calculated theoretical isotope distribution for the n = 37 product ion.
To determine the effect of cluster size on the number of water molecules that evaporate from the cluster, EC spectra of Ru(NH3)6(H2O)n3+ were measured for n between 18 and 61. For clusters with n ≥ 40, reduction of the precursor ion results only in loss of water molecules, the average number of which reaches a broad maximum between n = 40–55 (Figure 3). For clusters with n ≤ 37, a competing channel is observed where loss of one ammonia molecule accompanies water loss. The average ligand loss (including the ammonia loss channel) decreases with cluster size for n < 37, an effect presumably due to higher ligand binding energies to the smaller reduced species. This effect may be counteracted by increasing RE with decreasing cluster size,2b but the effect of higher binding energy is predominant. The average number of water molecules lost from the larger clusters decreases slightly from the maximum, an effect that is predominantly attributable to greater ion stabilization with increasing nanodrop size. A larger number of degrees of freedom8 and slightly higher water binding energies due to surface energy effects9 with increasing cluster size may also contribute.2b
Figure 3.
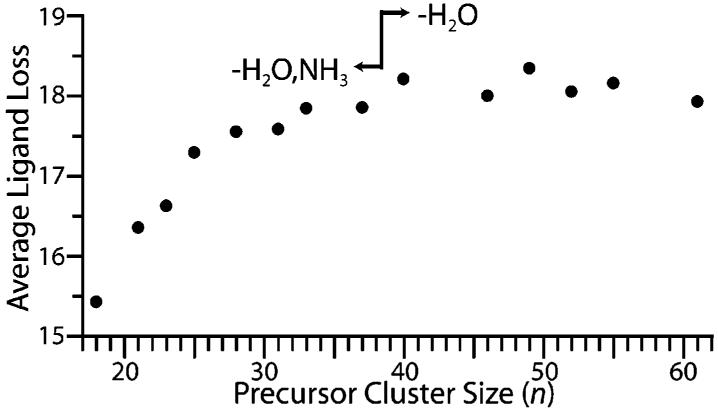
The average number of ligands lost because of electron capture by Ru(NH3)6(H2O)n3+ as a function of cluster size. For n ≥ 40, loss of water is the only process observed. For n ≤ 37, a competing channel corresponding to loss of water molecules accompanied by loss of a single ammonia molecule is observed.
These gas-phase measurements can be related to solution-phase reduction potentials at 0 K by the thermodynamic cycle described in eqs 1-5. The measured RE (eq 1), obtained from the number of water molecules lost from the reduced precursor (assuming statistical dissociation), is combined with the solvation energies of the reactant Esolv(3+) and product Esolv(2+) clusters (eq 2 and 3) obtained from Born theory and the adiabatic electron affinity (AEA) of water (eq 4) resulting in an approximate energy for solution-phase reduction (eq 5) referenced to an electron in aqueous solution (or a gas-phase electron by omitting eq 4).
| (1) |
| (2) |
| (3) |
| (4) |
| (5) |
For gas-phase ∼1 M aqueous Ru(NH3)63+, we estimate this value to be roughly −8.2 + 3.1 + 1.3 ≈ −3.8 eV, where the 0 K AEA of water is ∼1.3 eV,10 and the ΔEsolv(3+,2+) is −3.1 eV (see Supporting Information for details). This 0 K energy can be temperature corrected to 25 °C and related to a half-cell potential (ΔG=−nFE). By comparison, the one-electron reduction potential of Ru(NH3)63+ in aqueous solution, extrapolated to infinite dilution, is +0.1 eV versus the SHE.11 Within the limits of the approximations and uncertainties associated with our method, this suggests that eq 5 or the SHE can be assigned an absolute value to which all other half-cell potentials can be referenced. Results from additional redox couples can provide information about the accuracy of this method. Such studies, combined with temperature correction estimates, are ongoing. It should be emphasized that the reduction energy from eq 5 corresponds to reduction of the ion by a solvated electron versus an electron from a metal electrode in solution; relating these two values is made more complicated by the absence of any counterions or junction potentials in the gas phase and other factors. However, a key advantage of this approach to measuring absolute half-cell reduction potentials over methods that use solvation models and IEs of the bare ion12 is that solute–solvent specific interactions which are poorly accounted for in solvation models13 are accurately accounted for in our measurements. Additional advantages include that the effects of counterions, dilution, and chemical form are easily controlled and individually quantifiable, and half-cell reactions not directly observable in aqueous solution, such as a one electron reduction of hydrated Fe2+, can be readily measured in the gas phase.
Supplemental Material
Acknowledgment
The authors thank Professors Marcin Majda, Daniel M. Neumark, and Kenneth N. Raymond for helpful discussions and NSF (Grant CHE-041593) and NIH (Grant R01 GM064712-05) for generous financial support.
Footnotes
Supporting Information Available: Evaluation of solvation and ionization energies. This material is available free of charge via the Internet at http://pubs.acs.org.
References
- 1.(a) Trasatti S. Pure Appl. Chem. 1986;58:955–966. [Google Scholar]; (b) Reiss H, Heller A. J. Phys. Chem. 1985;89:4207–4213. [Google Scholar]; (c) Trasatti S. Electrochim. Acta. 1990;35:269–271. [Google Scholar]
- 2.(a) Leib RD, Donald WA, Bush MF, O'Brien JT, Williams ER. J. Am. Chem. Soc. 2007;129:4894–4895. doi: 10.1021/ja0666607. [DOI] [PMC free article] [PubMed] [Google Scholar]; (b) Leib RD, Donald WA, Bush MF, O'Brien JT, Williams ER. J. Am. Soc. Mass Spectrom. doi: 10.1016/j.jasms.2007.03.033. published online, Apr 15, 2007, http://dx.doi.org/10.1016/j.jasms.2007.03.033. [DOI] [PMC free article] [PubMed] [Google Scholar]
- 3.Shi Z, Ford JV, Wei S, Castleman AW., Jr. J. Chem. Phys. 1993;99:8009–8015. [Google Scholar]
- 4.Peschke M, Blades AT, Kebarle P. J. Phys. Chem. A. 1998;102:9978–9985. [Google Scholar]
- 5.Marsh KN. Recommended Reference Materials for the Realization of Physicochemical Properties. Blackwell; Oxford: 1987. p. 275. [Google Scholar]
- 6.(a) Wong RL, Paech K, Williams ER. Int. J. Mass Spectrom. 2004;232:59–66. [Google Scholar]; (b) Bush MF, Saykally RJ, Williams ER. Int. J. Mass Spectrom. 2006;253:256–262. doi: 10.1016/j.ijms.2006.04.009. [DOI] [PMC free article] [PubMed] [Google Scholar]
- 7.(a) DeKrey MJ, Kenttämaa HI, Wysocki VH, Cooks RG. Org. Mass Spectrom. 1986;21:193–195. [Google Scholar]; (b) Kenttämaa HI, Cooks RG. Int. J. Mass Spectrom. Ion Processes. 1985;64:79–83. [Google Scholar]
- 8.McLafferty FW, Wachs T, Lifshitz C, Innorta G, Irving P. J. Am. Chem. Soc. 1970;92:6867–6880. [Google Scholar]
- 9.Klots CE. J. Chem. Phys. 1985;83:5854–5860. [Google Scholar]
- 10.Han P, Bartels DM. J. Phys. Chem. 1990;94:7294–7299. [Google Scholar]
- 11.Meyer TJ, Taube H. Inorg. Chem. 1968;7:2369–2379. [Google Scholar]
- 12.Uudsemaa M, Tamm T. J. Phys. Chem. A. 2003;107:9997–10003. [Google Scholar]
- 13.Cramer CJ, Truhlar DG. Chem. Rev. 1999;99:2161–2200. doi: 10.1021/cr960149m. [DOI] [PubMed] [Google Scholar]
Associated Data
This section collects any data citations, data availability statements, or supplementary materials included in this article.