Abstract
5-Aminolevulinate synthase (ALAS), the first enzyme of the heme biosynthetic pathway in mammalian cells, is member of the α-oxoamine synthase family of pyridoxal 5′-phosphate (PLP)-dependent enzymes. In all structures of the enzymes of the α-oxoamine synthase family, a conserved histidine hydrogen bonds with the phenolic oxygen of the PLP cofactor and may be significant for substrate-binding, PLP-positioning, and maintaining the pKa of the imine nitrogen. In ALAS, replacing the equivalent histidine, H282, with alanine reduces the catalytic efficiency for glycine 450-fold and decreases the slow phase rate for glycine binding by 85%. The distribution of the absorbing 420 and 330 nm species was altered with an increased A420/A330 ratio from 0.45 to 1.05. This shift in species distribution was mirrored in the cofactor fluorescence and 300 to 500 nm circular dichroic spectra and likely reflects variation in the tautomer distribution of the holoenzyme. The 300 to 500 nm circular dichroic spectra of ALAS and H282A diverged in the presence of either glycine or aminolevulinate indicating that the reorientation of the PLP cofactor upon external aldimine formation is impeded in H282A. Alterations were also observed in the value and spectroscopic and kinetic properties, while the increased 9-fold. Altogether, the results imply that H282 coordinates the movement of the pyridine ring with the reorganization of the active-site hydrogen bond network and acts as a hydrogen bond donor to the phenolic oxygen to maintain the protonated Schiff base and enhance the electron sink function of the PLP cofactor.
Keywords: 5-Aminolevulinate, 5-aminolevulinate synthase, heme, pyridoxal, pyridoxal 5′ phosphate, α-oxoamine synthase family
INTRODUCTION
Heme is an essential tetrapyrrole in nearly all living cells, and all tetrapyrroles are biosynthesized from the same precursor, 5-aminolevulinic acid (ALA). In mammals, 5-aminolevulinate synthase (ALAS, EC 2.3.1.37) catalyzes the condensation of glycine and succinyl-CoA to form ALA, CoA, and carbon dioxide, in the first and regulatory step of heme biosynthesis. Mammals express genetically distinct erythroid and housekeeping ALAS isoforms, and mutations in the erythroid specific ALAS have been implicated in X-linked sideroblastic anemia, a disease characterized by inadequate formation of heme and the accumulation of iron in the erythroblast mitochondria (1).
ALAS belongs to a catalytically versatile class of enzymes that require pyridoxal 5′-phosphate (PLP) as a cofactor (2). PLP-dependent enzymes that catalyze reactions involving amino acids share common mechanistic characteristics based on utilization of the electron withdrawing properties of the cofactor to labilize bonds to the substrate α-carbon (3). Specifically, the PLP cofactor covalently binds to the ε-amino group of an active site lysine via a Schiff base linkage to form the “internal aldimine.” The incoming amino acid substrate replaces the lysine amino group to form an “external aldimine” via a gem-diamine intermediate, in a reaction often referred to as transaldimination. Subsequently, the cleavage of one of the substrate α-carbon bonds leads to a resonance-stabilized quinonoid intermediate in which the coenzyme acts an electron sink, storing electrons from the cleaved bond through the conjugated system of the Schiff base and pyridinium ring. Ultimately, the electrons are dispensed back for the formation of new linkages to the Cα (3).
PLP-dependent enzymes have been classified according to reaction specificity relative to the Cα (4) and fold-types derived from three-dimensional structures (5, 6). ALAS is classified within the α-oxoamine synthase sub-family of the α-within class II of fold type I of PLP-dependent enzyme superfamilies (7). In all known structures of fold-type I, the pyridine ring of the PLP cofactor superimposes very well (8). The pyridoxal moiety interacts with the enzyme in a common motif, which includes the previously mentioned Schiff base linkage with an active site lysine, a salt-bridge between the pyridinium ring nitrogen and an aspartate, and a hydrogen bond with the phenolic oxygen which occurs through a variety of amino acids (8).
In ALAS and other α-oxoamine synthase enzymes, the hydrogen bond of the phenolic oxygen involves a conserved histidine (9–11), which corresponds to H282 in murine erythroid ALAS (Figure 1). No studies have examined the role of this residue in any α-oxoamine synthase family member, although based on structural data alone it has been suggested that it may function as an acid catalyst during transaldimination (12, 13), play a key role in positioning the PLP aromatic ring (11), or influence the pKa of the imine nitrogen (13).
Figure 1.
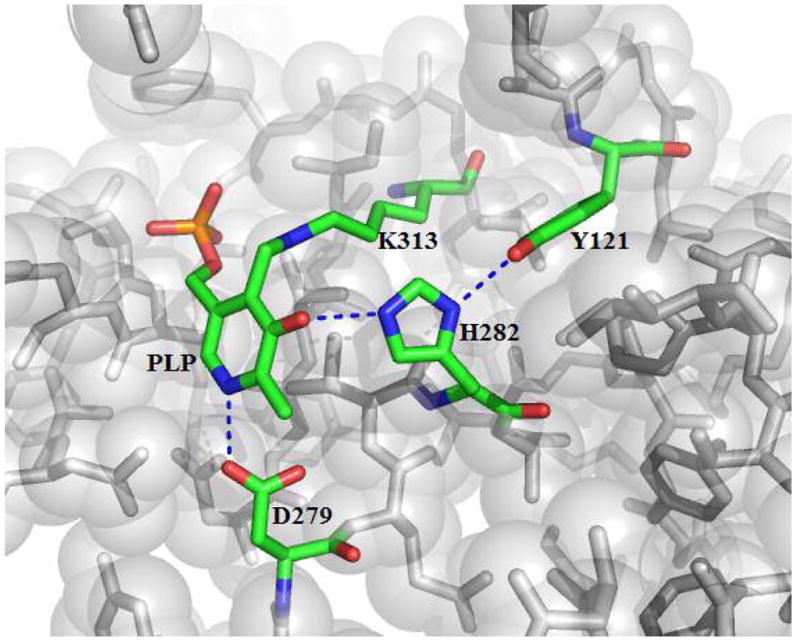
Spatial position of active site residues in the R. capsulatus ALAS holoenzyme crystal structure. This view highlights the interaction of the pyridinium ring of the cofactor with active site residues and the H282 imidazole Nε2 and Nδ1 hydrogen bonds between the cofactor phenolic oxygen and Y121. The image was constructed using Pymol (31) and PDB file 2BWN. Residue numbering is relative to murine erythroid ALAS.
Studies in other α-family enzymes indicate that the significance of interaction between the protein and the phenolic oxygen of PLP may vary according to the requirements of the enzyme. In aspartate aminotransferase and 1-aminocyclopropane-1-carboxylate synthase, the phenolic oxygen interacts with a tyrosine residue (14, 15). The deletion of the hydrogen bond through the replacement of the active site tyrosine with phenylalanine reveals a different function in the kinetic properties of each enzyme. In aspartate aminotransferase, the tyrosine stabilizes the reactive form of the internal aldimine at physiological pH and increases the kcat value (14, 15). Similar studies of 1-aminocyclopropane-1-carboxylate synthase reveal that the tyrosine decreases the Km, but has no effect on kcat (15).
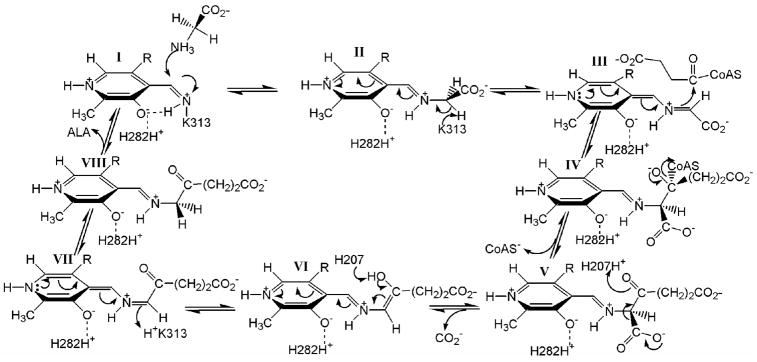
In murine erythroid ALAS, H282 is tethered between PLP and Y121 through hydrogen bonds between the imidazole Nε2 and Nδ1, respectively (Figure 1). Previous studies have demonstrated that the H-bond between the Y121 hydroxyl group and H282 Nδ1 is important for efficient cofactor and substrate binding (16), providing evidence for a probable role for H282 in these interactions. The ordered ALAS catalytic pathway is comprised of the following steps (Scheme 1): the association of glycine with the enzyme forming the Michaelis complex (I); the transaldimination reaction between glycine and the active site lysine (K313) to generate the external aldimine (II); the removal of the pro-R proton to generate a transient quinonoid intermediate (III); the condensation of succinyl-CoA (IV); the removal of Co-A and the formation α-amino-β-ketoadipate (V); decarboxylation of the α-amino-β-ketoadipate (VI); the protonation of the second quinonoid intermediate (VII) and finally the releases of ALA (VII) (17,18). In order to characterize the role of the conserved histidine in murine erythroid ALAS function, a series of H282 variants were constructed. The results provide evidence that H282 impacts a variety of ALAS functions including substrate and PLP binding and catalysis.
Scheme 1.
EXPERIMENTAL DETAILS
Materials
The following reagents were purchased from Sigma-Aldrich Chemical Company: DEAE-Sephacel, Ultrogel AcA-44, β-mercaptoethanol, PLP, bovine serum albumin, succinyl-CoA, ALA-hydrochloride, α-ketoglutaric acid, α-ketoglutarate dehydrogenase, Bis-Tris, HEPES-free acid, AMPSO-free acid, MOPS, tricine, thiamin pyrophosphate, NAD+, and the bicinchoninic acid protein determination kit. Glycerol, glycine, disodium ethylenediamine tetraacetic acid dihydrate, ammonium sulfate, magnesium chloride hexahydrate, perchloric acid, and potassium hydroxide were acquired from Fisher Scientific. Sodium dodecyl sulfate polyacrylamide gel electrophoresis reagents were acquired from Bio-Rad. Phenylhydrazine was from by Eastman Kodak. PD-10 columns were from Amersham Biosciences. Chameleon mutagenesis kit was from Stratagene. Xho I and Xba I restriction enzymes were from New England Biolabs.
Methods
Mutagenesis
The pGF23 plasmid encoded the full-length sequence for the murine, mature erythroid ALAS. Site-directed mutagenesis for the H282Y and H282F mouse ALAS mutant was performed on the single-stranded pGF23 using the chameleon mutagenesis kit from Stratagene. The mutagenic oligonucleotides for H282Y and H282F were GAT GAA GTC TAT GCT TAT GCT GTA GGA CTG TAT GGA and GAT GAA GTC TTT GCT TAT GCT GTA GGA CTG TAT GGA, respectively, with the introduced codon substitutions underlined. The H282A mutant was generated using the method previously described by Gong (1998). Briefly, two rounds of PCR were performed to obtained DNA fragments with the desired mutation flanked by unique restriction sites. The mutagenic primers used to generate the H282A mutation were 5′-GTA GAT GAA GTC GCT GCT GTA GGA CTG or 5′-GAG TCC TAC AGC AGC GAC TTC ATC TAC with the introduced codon substitution underlined. The two fragments containing the mutation were used as megaprimers and amplified by a third round of PCR. The product was then digested with Xba I and Xho I and subcloned into pGF23 vector. Clones obtained after mutagenesis procedures were confirmed by sequencing.
Protein purification, SDS-PAGE, protein determination and steady-state analysis
Recombinant murine erythroid ALAS and the H282A variant were purified from DH5α Escherichia coli bacterial cells containing the overexpressed protein as previously described (19). Sufficient expression of H282Y and H282F variants could not be obtained. Purity was determined by SDS-PAGE (20) and protein concentration determined by the bicinchoninic acid method using BSA as the standard (21). All protein concentrations are reported on the basis of a subunit molecular weight of 56,000 kD. Enzymatic activity was determined by a continuous spectrometric assay at 30°C (19). To evaluate the pH dependence of the kinetic parameters, assays were performed in 20 mM MOPS for pH 6.7, HEPES for pH 7–8 or AMPSO for pH 8.2–9.5. The pH dependences of log kcat and log kcat/Km were fit to equation 1, while the pH dependence of log 1/Km was fit to equation 2.
| Equation 1 |
| Equation 2 |
Spectroscopic measurements
Prior to spectroscopic measurement, enzyme was dialyzed in 20 mM HEPES, pH 7.5 with 10% glycerol to remove free PLP. Absorption spectra were acquired at ambient temperature using a Shimadzu UV 2100 dual beam spectrophotometer, with a reference containing all components except the purified enzyme. Circular dichroism (CD) spectra were obtained using an AVIV CD spectrometer calibrated for both wavelength maxima and signal intensity with an aqueous solution of D-10 camphorsulfonic acid (22). Protein concentrations were 10–11 μM and 100 μM for the near and far CD spectra, respectively, in 20 mM Bis-Tris, pH 7.5 containing 10% glycerol. Spectra were recorded in triplicate and averaged, using a 0.1 cm path length cuvette with a total volume of 300 μl. Fluorescence spectra were collected on a Shimadzu RE-5301 PC spectrofluorophotometer using protein concentrations of 2–4 μM. The pH was adjusted with 20 mM MOPS (pH range 6.7–7.0), 20 mM HEPES (pH range 7–8.2), or 20 mM AMPSO, (pH range 8.3–9.5). 10% glycerol was also included in the buffers. CD and fluorescence blank spectra were collected from samples containing all components except protein immediately prior to the measurement of samples. The blank spectra were subtracted from spectra of sample containing enzyme. The pH dependence of the 510 nm-fluorescence emission upon 420 nm-excitation was fit to equation 3.
| Equation 3 |
Stopped-flow spectroscopy
Rapid scanning stopped-flow measurements were conducted using a model RSM-100 stopped-flow spectrophotometer (OLIS Inc. This instrument has a dead-time of approximately 2-ms and an observation chamber path length of 4 mm. Scan spectra covering a wavelength range of 300–510 nm were collected at a rate of 1000 scans/s and then averaged to 62 scans/s to reduce data files to a manageable level. The temperature of the syringes and the stopped-flow cell compartment was maintained at 30°C by an external water bath. The concentration of glycine was always at least 10-fold greater than the enzyme concentration to ensure pseudo-first order kinetics were observed. For each experimental condition, three replicate experiments were performed. The absorbance changes at 420 nm (ΔAbsorbance420) were globally fit using the simulation program DynaFit to the binding mechanisms described in schemes 2 and 3(23).
Determination of dissociation constants of glycine and ALA
Dissociation constants were determined spectroscopically by monitoring spectral changes upon the binding of glycine and ALA (24). The Kd values for glycine from pH 6.7–9.5 were determined at 30 °C for ALAS and the H282A variant by monitoring the increase in cofactor absorbance at 420 nm upon glycine binding. The pH was adjusted with 20 mM MOPS (pH range 6.7–7.0), 20 mM HEPES (pH range 7–8.2), or 20 mM AMPSO, (pH range 8.3–9.5). 10% glycerol was also included in the buffers. Glycine was prepared as 2 M stocks adjusted to the same pH as the corresponding buffers. Kd is defined by equation 4 where [Gly] and [Enz] are the concentrations of free glycine and free enzyme, respectively, and [Gly-Enz] represents the concentration of glycine-bound ALAS.
| Equation 4 |
The changes in absorbance at 420 nm were plotted as a function of glycine concentration and the data were fit to equation 5 to determine Kd, where ΔAbs is the absorbance increase at 420 nm, Absmax is the maximum increase in absorbance, and [Gly] is the total glycine concentration. The pH dependence of the Kd values for ALAS was fit to equation 3 and for H282A to equation 6.
| Equation 5 |
| Equation 6 |
The ALA Kd for the H282A variant was determined by monitoring the decrease in absorbance at 420 nm at 30°C in 20 mM HEPES, pH 7.5 and 10% glycerol. Enzyme (25–30 μM) solution was titrated with small aliquots of concentrated ALA solution, and the change in absorbance measured. Data were analyzed by non-linear regression fitting to equation 7, where A is the observed absorbance, and Ai and Af are the fitted values of the initial and final absorbance, respectively. [L] is the ligand concentration, and [E] is the enzyme concentration. Determinations were made in duplicate and the reported values represent the mean and standard error of measurement.
| Equation 7 |
Preparation of apoenzyme and determination of the PLP dissociation constant
To obtain H282A apoenzyme, 1 mg/ml enzyme in 20 mM HEPES pH 7.5, containing 20% glycerol was treated with 150 mM phenylhydrazine for 1.5 hours at 4°C, following which phenylhydrazine was removed by running the solution through a PD-10 column. The phenylhydrazine treatment was then repeated to ensure all PLP was removed.
The PLP Kd for the H282A variant was determined at 25oC by monitoring the PLP-dependent increase in the 510 nm fluorescence emission upon excitation at 420 nm, in a buffer composed of 20 mM HEPES, pH 7.5 and 10% glycerol. To determine the Kd value for PLP, data were analyzed by non-linear regression fitting to equation 7, where A is the observed fluorescence, and Ai and Af are the fitted values of the initial and final fluorescence, respectively.
pH titration of quinonoid intermediate formation for H282A variant
The pH dependence of quinonoid intermediate formation was investigated with ALA-saturated enzymes as described previously (24). Equation 8 was used to fit the quinonoid intermediate titration data where Y is the observed absorbance at 510 nm, Ymax and Ymin are the theoretical maximal and minimal absorbance values at 510 nm, and pKa is the equivalence point for quinonoid intermediate formation.
| Equation 8 |
RESULTS
Spectroscopic properties of the H282A variant
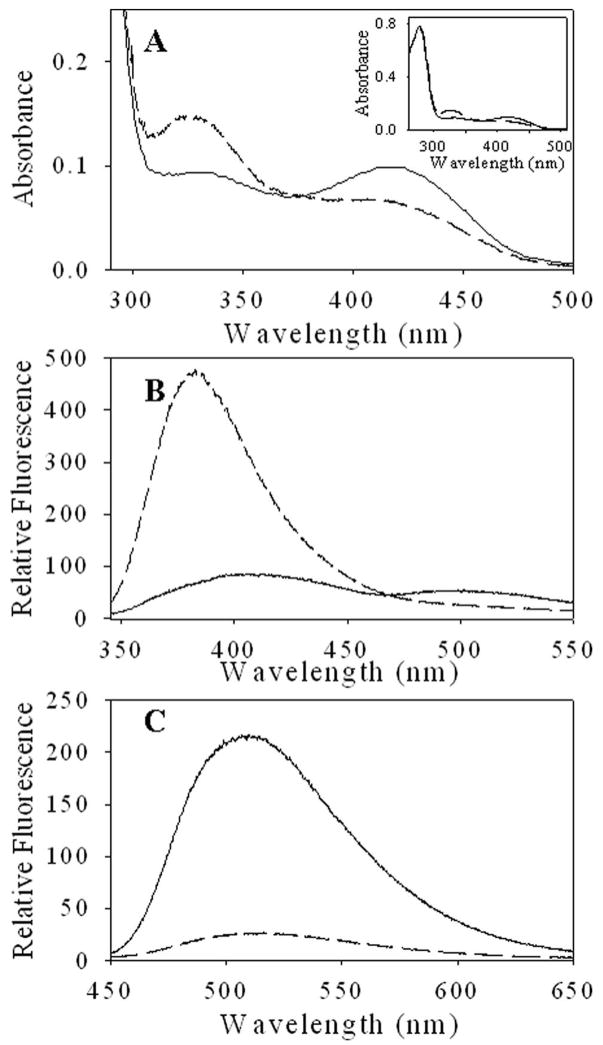
At pH 7.4, three absorbance maxima at approximately 278, 330 and 420 nm are observed in both ALAS and the H282A variant (Figure 2A). The absorbance at 278 nm is primarily due to the protein, while the 330 nm and 420 nm maxima are common in PLP-dependent enzymes and are typically attributed to deprotonated and protonated aldimine species, respectively (25). A similar assignment for ALAS is ambiguous because the spectrum is unchanged in the pH range 6.5–9.51. The mutation had no discernable effect on the protein absorption band centered at 278 nm, but the cofactor absorption peaks were significantly altered. The ratio of the 420 nm to 330 nm absorbance was increased from 0.45 in the wild-type enzyme to 1.05 in the variant.
Figure 2.
Absorption and fluorescence spectra of ALAS and H282A variant. (A) UV-visible absorption spectra. The inset includes the region from 250–300 nm. Protein concentrations were adjusted to 13 μM in 20 mM Hepes, pH 7.5. (B) Fluorescence emission spectra of 5 μM ALAS and H282A in 20 mM Hepes, pH 7.5 containing 10% glycerol upon excitation at (B) 330 nm and (C) 420 nm. For (A)–(C), ALAS (--) and H282A (—).
The changes in the absorption spectra were reflected in the fluorescence spectra (Figure 2B and C). Upon excitation at 330 nm ALAS exhibits only one maximum at 385 nm, while in H282A the 385 nm fluorescence emission maximum is shifted to 410 nm with a 6-fold decrease and a second maximum is observed at 510 nm. With excitation at 420 nm, the cofactor exhibits fluorescence emission maximum at 510 nm for both enzymes; however the magnitude of the 510 nm emission was ~7 times greater in the H282A. The pH titration of the species emitting at 510 nm upon excitation at 420 nm demonstrated that this species diminished as a result of loss of a single proton for both enzymes (Figure 3). A fit of the data to equation 3 yield a pKa of 8.05 ± 0.043 and 9.02 ± 0.07 for ALAS and H282A, respectively.
Figure 3.
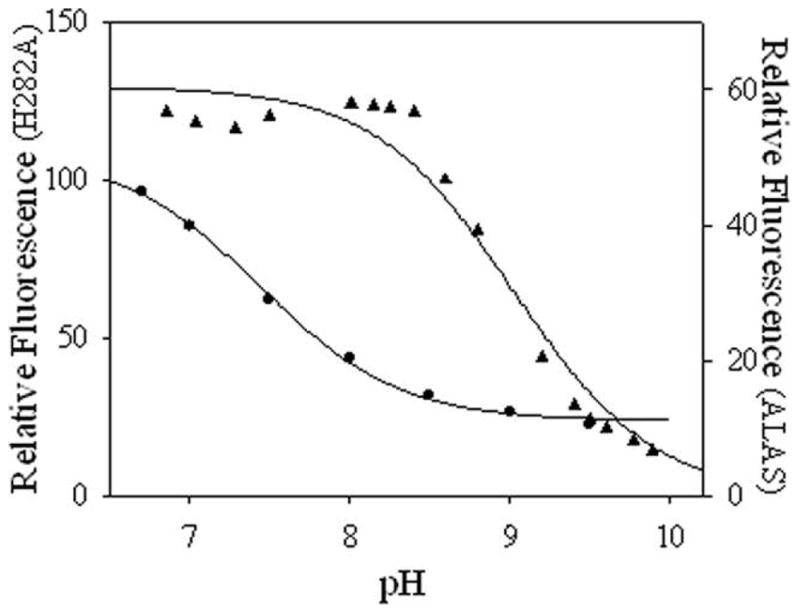
The pH dependence of fluorescence emission. The fluorescence emission at 510 nm upon excitation at 420 nm for 2.0 μM ALAS (▲) and 3.5 μM H282A (●) at varying pH. Each of the line represents the nonlinear regression fit to equation 3.
Kinetic characterization of the H282A variant
The steady-state kinetic parameters of the H282A variant were determined and the results are summarized in Table 1. The mutation resulted in a kcat of 1.4% of the wild-type ALAS value. The Km for glycine was increased 5-fold relative to ALAS, while the Km for succinyl-CoA was not significantly affected. The overall catalytic efficiency for glycine and succinyl-CoA decreased 450-fold and 87-fold respectively as compared to ALAS values.
Table 1.
Summary of steady-state kinetic parameters and dissociation constants
| Protein | kcat (min−1) | (mM) | (min−1mM−1) | (mM) | (μM) | (min−1μM−1) | (μM) | (μM) |
|---|---|---|---|---|---|---|---|---|
| ALASa | 10 (±1) | 23 (±1) | 0.4 (±0.06) | 22 (±2) | 2.3 (±0.1) | 4.35 (±0.62) | 25 (±3) | 1.6 (±1) |
| H282A | 0.137 (±0.003) | 144 (±7.7) | 9.5 (±0.06) ×10−4 | 49 (±5) | 2.75 (±0.07) | 0.05 (±0.002) | 40 (±4) | 14 (±4) |
Data from (24)
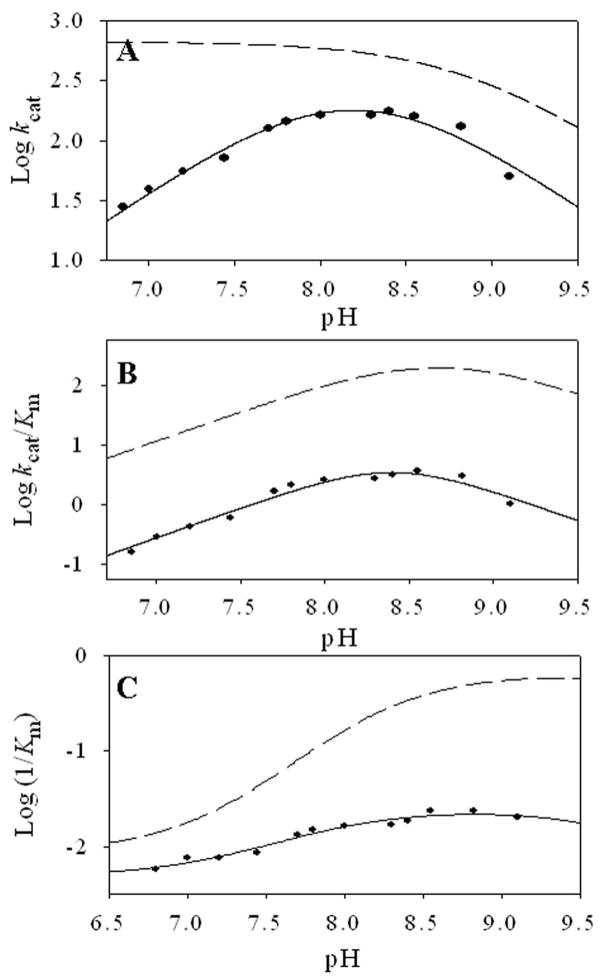
If H282 acts as a hydrogen bond donor to the phenolic oxygen of the cofactor, then the H282A mutation may lower the pKa for the imine nitrogen. To investigate this possibility the pH dependence of the steady-state kinetic parameters was studied, with the results summarized in Table 2 and Figure 4. The log kcat vs. pH profile for H282A decreased on both the acidic and basic sides, and the best fit of the data to equation 1 generated a pKa of 7.2 ± 0.1 for a residue in the enzyme-substrate complex that must be protonated for optimal catalysis. A second pKa of 8.6 ± 0.1 for a residue that is deprotonated during catalysis was also observed for H282A, which shifted from the previously reported pKa of 9.1 ± 0.03 in ALAS (12). The possibility of an acidic limb pKa, below 7.0, in the wild-type enzyme could not be investigated due to instability at pH values below 6.5–7.0 (12), but the available data do suggest that the H282A mutation results in a substantial increase to the pKa of an important enzyme-substrate complex ionization. This ionization might be assigned directly to H282, or it could be assigned to the imine nitrogen that presumably shares a proton with the phenolic oxygen atom.
Table 2.
Summary of pK values obtained from the pH dependence of kinetic parameters
Figure 4.
pH dependence of (A) log kcat, (B) log kcat/KmGly and (C) log 1/KmGly for ALAS (- -) and H282A (—). The lines represent the nonlinear regression fits to equation 1 or 2 as described in Materials and Methods. The profiles for the pH dependence of the steady-state kinetic parameters for ALAS (- -) are from (12)
The log kcat/Km pH profile for the mutant was similar to that of the wild-type enzyme, decreasing on both the acidic and basic limbs. Nonlinear regression of the data using equation 1 yielded a pKa for the acidic and basic limb of 8.00 ± 0.14 and 8.50 ± 0.14 for H282A, which reflects a shift in the acidic limb from the at 8.60 ± 0.11 pKa value previously reported in ALAS (12). The pH variation of the log 1/KmGly decreased with increasing pH for both enzymes. The data were fit to equation 2 to generate a pKa of 8.36 ± 0.1 for ALAS and 7.76 ± 0.16 for the H282A variant. The log kcat and profiles limiting slopes of approximately 1 or −1 indicate the ionization of a single group for acidic and basic limbs. Given that glycine is not a sticky substrate and does not ionize over the pH range studied, the pKa observed for 1/KmGly and the acidic limb of the likely represents group(s) in the free enzyme.
Reaction of glycine with H282A variant
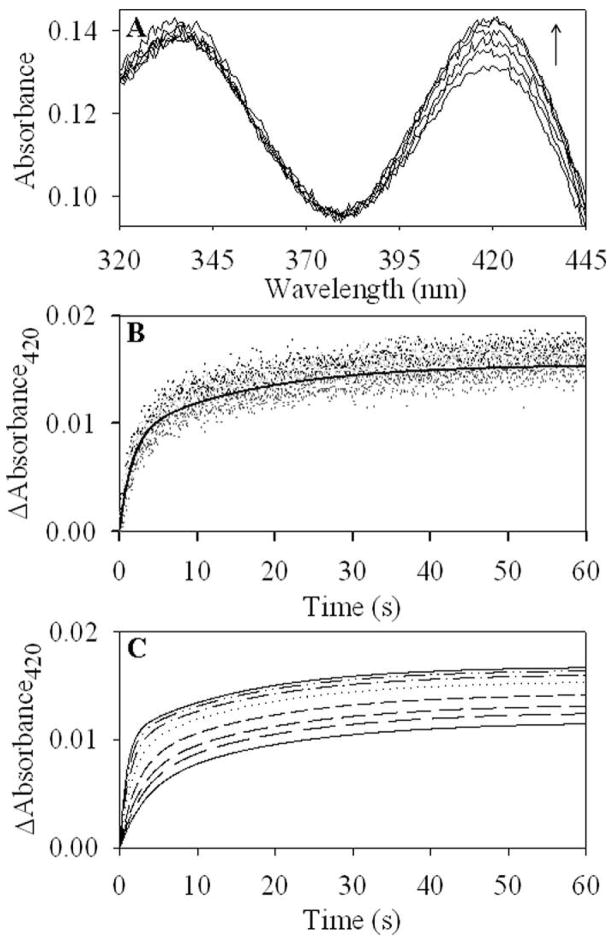
The reaction of 60 μM H282A variant with glycine resulted in an increased absorbance at 420 nm (Figure 5A). The data best fitted to the two-step process described by scheme 2 (Figure 5B-C). A fit of the data yielded values for k1 of 0.001654 ± 3.8 × 10⁻⁵ s−1, k−1 of 0.14 ± 0.0064 s−1, k2 of 0.022 ± 0.0025 s−1, and k−2 of 0.0455 ± 0.0016 s−1.
Figure 5.
Reaction of 60 μM H282A variant with glycine. (A) Spectral changes observed during the reaction of 300 mM glycine with H282A. Spectra were collected at 1, 5, 11, 23, 41 and 52 seconds and are shown sequentially with the lowest to the highest absorbance at 420 nm. The ΔAbsorbance420 data were globally fit to a two-step mechanism using the simulation program DynaFit. (B) The time course for the reaction of H282A variant with 300 mM glycine, as monitored by the ΔAbsorbance420, is denoted by circles and overlaid with the line representing the fitted data. (C) Fits of the ΔAbsorbance420 data for binding of glycine at 100, 125, 150, 200, 300, 400, 500 and 600 mM.
Dissociation constants for the binding of glycine and ALA
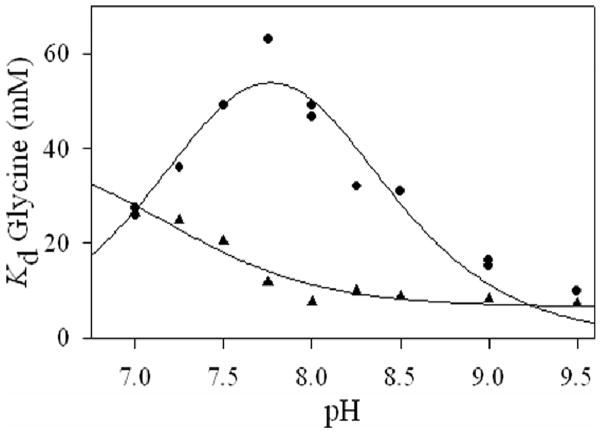
To elucidate a potential role of H282 in substrate binding, the enzymes were titrated with glycine and ALA to determine the dissociation constants for formations of the external aldimine with the substrate and product. At pH 7.5, the Kd for ALA and glycine increase 8.5-fold and 5-fold, respectively, relative to ALAS (Table 1). To establish if the ionization of groups reflected in the kcat profiles are involved in substrate binding or catalysis, the pH dependence of Kd for glycine was determined. The loss of the PLP-O3-H282 interaction also had a marked effect on the pH profile for the values. For ALAS, the decreases with increasing pH and, when fitted to equation 1, yielded a pKa value at the boundary of the pH range tested, therefore a pKa ≤ 7 was assumed. In contrast, the KdGly values for the H282A variant fit to a bell curve with pKa values at 7.4 ± 0.2 and 8.1 ± 0.2 (Figure 6). The data indicate that the H282 mutation results in a substantial modification to the pKa of an enzyme-glycine complex ionization.
Figure 6.
pH dependence of the Kd for glycine for ALAS (▲) and H282A (•). The data were fit to equation 5 (ALAS) or equation 6 (H282A) using non-linear regression analysis.
pH titration of quinonoid intermediate formation for H282A variant
When ALAS is saturated with ALA, the external aldimine is converted to a quinonoid intermediate in a pH-dependent manner; the extent of this reaction can be monitored by following the absorbance of the quinonoid intermediate at 510 nm. Formation of the ALA-bound quinonoid intermediate in ALAS has been reported to occur with an apparent pKa of 8.1 ± 0.1 (24), and involves participation of the active site K313, which acts as a general base catalyst for the reaction by abstracting a proton from the ALA-aldimine to form the quinonoid intermediate (26). The ALA-bound quinonoid intermediate was observed to increase with pH for H282A as was observed previously in ALAS (18), although the amplitude of the absorption of the quinonoid intermediate was markedly diminished by the mutation at all pH values tested (Figure 7A). pH titration of the H282A quinonoid intermediate absorbance demonstrated that the intermediate was formed as a result of loss of a single proton with an equivalence point at 8.8 ± 0.1 (Figure 7B). The higher pKa value in the variant indicates that one function of H282 is to lower the apparent pKa for quinonoid intermediate formation such that the PLP cofactor functions more effectively as an electron sink at physiological pH. The observation that disruption of a hydrogen bond to the phenolic oxygen of the cofactor has a significant effect on quinonoid intermediate formation indicates that the equivalence point of 8.1 ± 0.1 observed with ALAS is a complex function of the electronic interaction of the active site lysine with the ALA-PLP aldimine and its active site environment, and not simply reflective of an ionization constant for the active site lysine.
Figure 7.
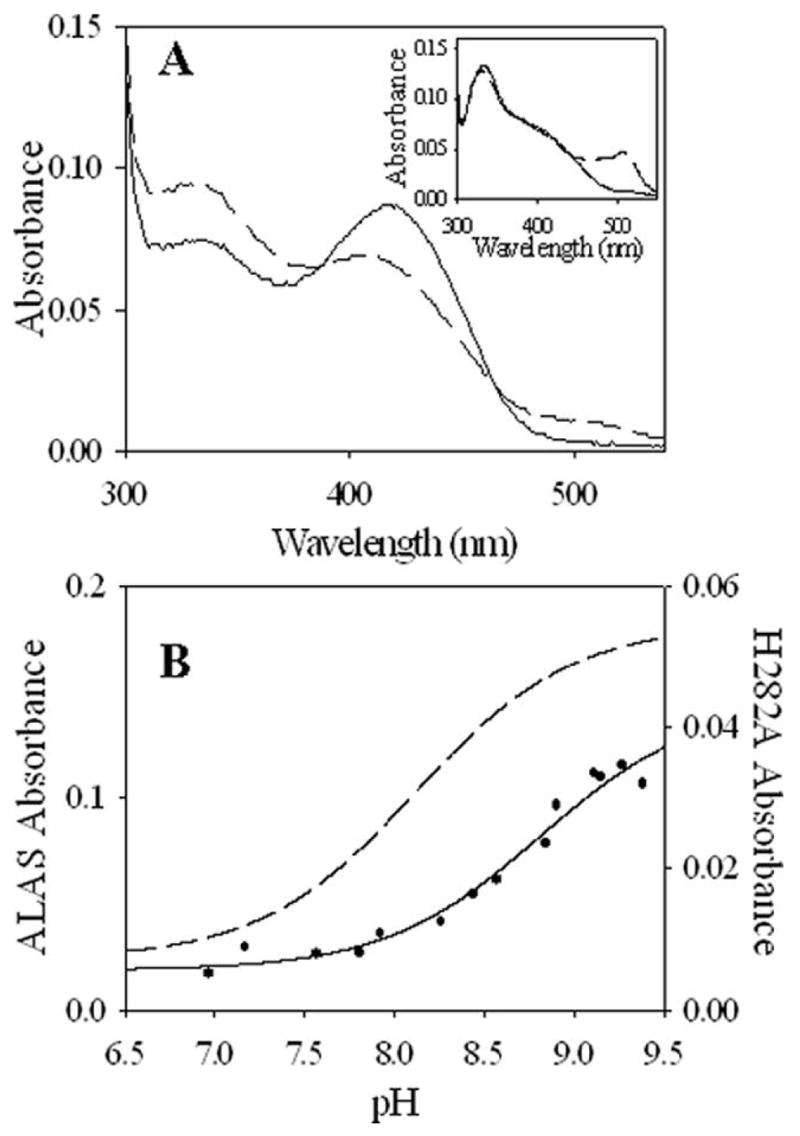
UV-visible absorption spectra of H282A in the presence of ALA and pH-dependence of ALA-quinonoid intermediate formation. (A) Absorption spectra of H282A (—) and ALAS (- -) in the presence of 500 μM ALA. (Inset) Absorption spectra of H282A (—) and ALAS (- -) in the presence of 300 μM ALA. Spectra were acquired at 30 °C and pH 7.5. (B) pH-dependence of quinonoid intermediate absorption upon addition of 20 mM ALA to either ALAS (- -) or H282A (—). The lines represent theoretical curves based on the best fit of the data to equation 8.
CD spectroscopy
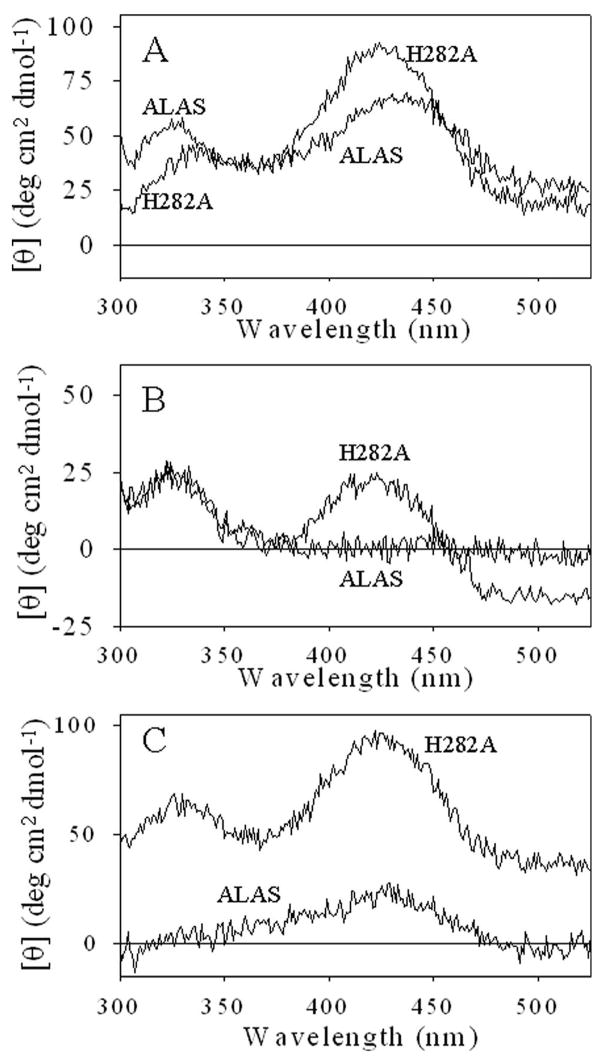
The disruption of the H-bond between the phenolic oxygen and the enzyme could potentially alter the time-averaged orientation of the PLP cofactor in the active site. The circular dichroism in the UV-visible region reflects the PLP microenvironment by monitoring the asymmetry of the bound cofactor. Formation of an external aldimine results in the reorientation of the PLP cofactor which can be followed with CD spectroscopy (27). Spectra of the holo- and ligand-bound enzymes were collected (Figure 8). Spectra of the free enzyme exhibited positive dichroic bands at ~330 and 420 nm with an increase in the 420 nm band with an associated decrease in the ~330 nm band observed in the variant. The addition of glycine to ALAS or H282A resulted in comparable decrease in the ~330 nm dichroic band, while the ~420 nm band decreased 75% in the variant and disappeared in the ALAS spectra. The addition of a saturating concentration of ALA to ALAS or H282A had strikingly different effects on the relative chiral environment of the external aldimine in the two enzymes. Specifically, the ~330 nm dichroic band was decreased and the ~420 nm band disappeared in the ALAS spectra, while the addition of ALA to H282A resulted in a moderate increase in the 330 nm and little change to the ~420nm band. The CD spectra for ALAS and H282A between the 200–300 nm were similar, indicating that no significant changes occurred in the overall conformation as a result of the mutation (data not shown).
Figure 8.
Circular dichroism spectra of ALAS- and H282A-ligand complexes. Spectra of ALAS and H282A (A) Holoenzymes; (B) in the presence of 300 μM ALA; (C) in the presence of 200 mM glycine. Spectra were recorded in 20 mM Bis-Tris with 10% glycerol, pH 7.5, at an enzyme concentration of 100 μM.
Dissociation constants for the binding of PLP
To address the role of H282 in cofactor binding, the effect of the H282 to alanine mutation on Kd of PLP was studied. The titration of the H282A apoenzyme with PLP leads to the reconstitution of the holoenzyme, which can be monitored by following changes in the intensity of fluorescence emission at 510 nm upon excitation at 420 nm (Figure 6). Theoretical saturation curves were generated from which the dissociation constant of PLP from H282A was determined. When compared to the wild-type enzyme, the Kd for PLP was increased ~9 fold by the H282A mutation, as reported in Table 1.
DISCUSSION
The crystal structure of Rhodobacter capsulatus ALAS reveals the existence of a hydrogen bond between H282 and the phenolic oxygen atom of the PLP cofactor (10). A clustal sequence alignment demonstrated that this histidine residue was perfectly conserved in over 70 known ALAS sequences from bacteria to mammals (data not shown). The existence of one, and often two, hydrogen bonds between the enzyme and the PLP phenolic oxygen is common in fold type I PLP-dependent enzymes, and is likely multifunctional. The ALAS crystal structures suggest possible roles for H282 in binding and orientation of the cofactor within the active site, as well as control of the electronic status of the cofactor during catalysis (9). These possibilities led us to postulate that mutation of H282 should have multiple effects on substrate and cofactor binding, as well as catalysis. In this communication, we constructed ALAS variants harboring the H282A, H282Y, and H282F mutations, of which only the H282A variant was recoverable as a soluble enzyme. The effects of the H282A mutation on the spectroscopic and kinetic properties of the enzyme were characterized in order to better understand the functional roles of H282 in the ALAS-catalyzed formation of ALA.
The absorption spectra (Figure 2) indicate the mutation has a substantial effect on the electronics of the PLP cofactor. A decrease in the absorbance of the 330 nm peak is accompanied by an increase in the absorbance of the 420 nm peak. These changes are reflected in the cofactor fluorescence spectra. In some transaminases, including aspartate aminotransferase and tyrosine aminotransferase, the corresponding absorbance peaks titrate as a function of pH with the long wavelength peak favored at low pH and the short wavelength peak favored at high pH (14, 28). These are generally attributed to the ketoenamine and enolamine tautomers, respectively, which differ in the position of the proton shared between the phenolic oxygen and the Schiff base nitrogen atoms. The changes in the absorbance spectra for H282A suggest that the mutation significantly alters the equilibrium of cofactor tautomeric structures to favor the ketoenamine, but this assignment is ambiguous because, unlike aspartate and tyrosine aminotransferases, the absorbance spectrum of ALAS is largely pH-independent and the H282A mutation did not alter this property (data not shown).
In contrast to the absorption spectra, fluorescence spectra of ALAS upon excitation at 330 or 420 nm are pH-dependent (12). Upon excitation at 420 nm, the ALAS 510 nm fluorescence emission titrates with a single pKa of 8.05 ± 0.043, while in H282A a pKa of 9.02 ± 0.07 is observed under similar conditions (Figure 3). The 385 nm fluorescence emission signal resulting from excitation at 330 nm, which occurs with a pKa of 8.4 ± 0.1 in the wild-type enzyme, is greatly diminished in the mutant, and an equivalent titration could not be performed.
The two pKas observed in ALAS fluorescence spectra are presumably indicative of more complex chemistry than simple titration of the Schiff base nitrogen atom. This is not unprecedented, as in dialkylglycine decarboxylase, three pKas are observed during absorbance spectra titrations, with both ketoenamine and enolamine species present in each ionization state (29). For both dialkylglycine decarboxylase and glutamate decarboxylase, it has been proposed that the multiple ionizations observed reflect active site residues that regulate the distribution of ketoenamine and enolamine tautomers through electrostatic effects (29, 30). In ALAS, the ionizations observed in the fluorescence spectra, but not the absorption spectra, are also likely to be attributable to active site residues and not the Schiff base nitrogen. Alterations observed in the H282A spectra may be due to changes in both tautomeric equilibria and the electrostatic interactions between the phenolic oxygen and other active site residues. The steady-state kinetic parameters of the variant indicate loss of H282 interaction with the phenolic oxygen impairs both glycine binding and catalysis. The increased 5-fold and the kcat decreased by two orders of magnitude. Rapid-scanning stopped-flow analysis experiments were performed to further characterize the effect of the mutation. A pre-steady-state burst of the quinonoid intermediate for the reaction of H282A-glycine and succinyl-CoA was not observed, presumably due to diminished absorption of the quinonoid intermediate that is typically observed with the wild-type enzyme (data not shown).
The transimination reaction expected to occur during glycine binding involves nucleophilic attack of the protonated Schiff base internal aldimine by the deprotonated amine of glycine, to form a transient gem-diamine intermediate. If the hydrogen bond donated by H282 to the phenolic oxygen of the cofactor is important in maintaining a protonated Schiff base, then the loss of this hydrogen bond in H282A might be expected to slow the rate at which glycine binds to the enzyme. In the absence of succinyl-CoA, glycine binding to H282A is a two-step process (Figure 5). Previous studies demonstrated that glycine also binds with ALAS in two steps; however the rates associated with the fast phase were not slow enough to be resolved (18). The slow phase rate for H282A decreased 85% relative to ALAS. The slower binding of glycine observed in H282A may be attributed to alterations in the electronic status of the Schiff base, but other interpretations are also possible. One interesting possibility is that H282 is directly or indirectly involved in proton transfers that convert the internal aldimine and glycine to the reactive ionic states necessary to formation of the glycine external aldimine (Scheme 1, I). In any case, these data, along with the data in Figure 6, indicate an important role for H282 in glycine binding.
The pH-dependence of log kcat, and were all diminished in H282A-catalyzed reaction, indicating that the mutation had severe catalytic consequences (Figure 4), but only the log kcat profile contained an ionization that was obviously changed by the mutation. The appearance of a new pKa of ~7.3 for H282A in the acidic limb of both the log kcat and suggests that the mutation results in a substantial change to a pKa for the enzyme–glycine complex. In ALAS, kcat is known to be determined by release of ALA, or a conformational change associated with ALA release (18). The appearance of an acidic limb ionization in the log kcat vs. pH profile for H282A shifted the pH optimum from less than 6.5 to slightly over 8.0, and indicates a change in the nature of the rate-determining step for catalysis, at least at lower pH values. The further observation that a similar pKa is apparent in the pH profile suggests that in H282A the rate-determining step at pH values less than 8.0 may be associated with binding of glycine. The ALAS spectroscopic pKa of 8.4 ± 0.1 observed upon excitation at 330 nm is mirrored in the log 1/Km and the acidic limb of log kcat/Km pH profile of ALAS (12). Although it was not possible to titrate the equivalent species in the H282A spectra, the pH dependence of the log 1/Km and acidic log kcat/Km was shifted to ~7.9. This ionization controls the reactive free enzyme species, and the disappearance or significant reduction of the equivalent species in the H282A spectrum suggests that H282 stabilizes the reactive form of the internal aldimine.
In ALAS, the binding of ALA results in the appearance of an ALA-quinonoid intermediate with a 510 nm absorbance (24). In H282A, the addition of ALA results in a decrease in absorbance at 420 nm with an associated increase at 330 nm as well as the appearance of a 510 nm absorbance, though the amplitude of the 510 nm absorption associated with the ALA-quinonoid species is markedly diminished. While the Kd value for ALA is minimally affected, the pKa of the ALA-quinonoid intermediate is increased from 8.1 ± 0.1 in ALAS to 8.8 ± 0.1 in H282A. The data suggest that proton abstraction from ALA is impaired in the variant. One possible explanation is that the loss of the hydrogen bond between the phenolic oxygen and H282 is likely to cause a net flow of electrons into the conjugated π-bond system, thereby disrupting the electron sink capacity of the cofactor.
Additionally, it has been suggested that the process of ALA binding and quinonoid intermediate formation may involve some structural reorganization of the active site (18). In both the glycine and succinyl-CoA soaked R. capsulatus ALAS crystals, a 15° rotation of the pyridine ring around the C5-C5A bonds occurs such that the O3 and C4A atoms move away from the catalytic lysine (10). Upon the binding of product in AONS, a similar rotation of the pyridine ring occurs along with subtle rearrangement of the active site hydrogen bond system (13). In R. capsulatus ALAS, the movement of the O3 is tracked by the residue equivalent to murine ALAS H282 (10), indicating that this residue is probably involved in coordinating the movement of the pyridine ring with the reorganization of the hydrogen bond system occurring upon substrate binding. H282 is tethered between the phenolic O3 of PLP and Y121 by way of hydrogen bonds between the imidazole Nε2 and Nδ1, respectively. The loss of H282 hydrogen bonds with the cofactor and Y121 would likely affect the PLP movement and orientation within the active site that are presumably a crucial aspect of the catalytic process.
The possibility that the PLP microenvironment is affected in solution by the H282A mutation was examined using CD spectroscopy, performed in the absence and presence of ALA or glycine. The spectra for the ALAS and H282A holoenzymes are relatively similar and exhibit two positive dichroic bands around 330 and 420 nm (Figure 8) which mirror the shift from the 330 to 420 nm species observed in the absorbance spectra (Figure 2). In these holoenzyme spectra the cofactor is covalently anchored to the enzyme via the internal aldimine linkage with the active site lysine, and this attachment would be expected to maintain the orientation of the cofactor in the active site. However, upon formation of an external aldimine with glycine or ALA, the attachment of the cofactor to the active site lysine is lost, and the resulting CD spectra diverge in the two enzymes. Upon the addition of glycine, the 420 nm dichroic band disappears in ALAS, while the band continues to be observed in the H282A spectra (Figure 8). In ALAS, the binding of ALA results in the loss of the 330 nm band and a significantly diminished ~420 nm band. In contrast, the binding of ALA to H282A results in a spectrum remarkably similar to the holoenzyme. The divergence observed in the ligand bound CD spectra of ALAS and H282A suggests that the reorientation of the PLP cofactor, observed with ALAS upon external aldimine formation, is blocked or diminished by the H282A mutation. This would influence both the cofactor position and interaction with key catalytic residues and could help explain the multiple effects caused by the mutation in the variant.
In summary, H282 is involved in a hydrogen bond with the phenolic oxygen of the PLP cofactor. The deletion of this interaction in the H282A variant has multiple effects on the spectral, binding, and kinetic properties of the enzyme that support the conclusion that H282 plays multiple roles in the enzymology of ALAS. It may also be further concluded that the impaired function of the variant results from a combination of direct and indirect effects, including alterations in the protonation of the phenolic oxygen and changes to the stereoelectronic relationships between the cofactor and active site residues, through the disruption in the processional PLP positioning that normally occurs during catalysis.
Supplementary Material
Footnotes
The abbreviations used are: ALAS, 5-aminolevulinate synthase; ALA, 5-aminolevulinate; AMPSO, 3-([1,1-dimethyl-2-hydroxyethyl]amino)-2-hydroxypropanesulfonic acid; Bis-tris, Bis(2-hydroxyethyl) amino-tris(hydroxymethyl) methane; BSA, bovine serum albumin; CD, circular dichroism; CoA, coenzyme A; DEAE, diethylaminoethyl; HEPES, (N-[2-hydroxyethyl] piperazine-N′-[2-ethane sulfonic acid]); MOPS, 4-Morpholinepropanesulfonic acid; NAD+, β-nicotinamide adenine dinucleotide; PLP, pyridoxal 5′-phosphate; SDS-PAGE, sodium dodecyl sulfate polyacrylamide gel electrophoresis.
G.C. Ferreira and G.A. Hunter, unpublished results
This work was supported by the National Institutes of Health (DK63191 to GCF)
References
- 1.May A, Bishop DF. The molecular biology and pyridoxine responsiveness of X-linked sideroblastic anaemia. Haematologica. 1998;83:56–70. [PubMed] [Google Scholar]
- 2.Ferreira GC, Gong J. 5-Aminolevulinate synthase and the first step of heme biosynthesis. J Bioenerg Biomembr. 1995;27:151–159. doi: 10.1007/BF02110030. [DOI] [PubMed] [Google Scholar]
- 3.Christen P, Mehta PK. From cofactor to enzymes. The molecular evolution of pyridoxal-5′-phosphate-dependent enzymes. Chem Rec. 2001;1:436–447. doi: 10.1002/tcr.10005. [DOI] [PubMed] [Google Scholar]
- 4.Mehta PK, Christen P. Homology of 1-aminocyclopropane-1-carboxylate synthase, 8-amino-7-oxononanoate synthase, 2-amino-6-caprolactam racemase, 2,2-dialkylglycine decarboxylase, glutamate-1-semialdehyde 2,1-aminomutase and isopenicillin-N-epimerase with aminotransferases. Biochem Biophys Res Commun. 1994;198:138–43. doi: 10.1006/bbrc.1994.1020. [DOI] [PubMed] [Google Scholar]
- 5.Alexander FW, Sandmeier E, Mehta PK, Christen P. Evolutionary relationships among pyridoxal-5′-phosphate-dependent enzymes. Regio-specific alpha, beta and gamma families. Eur J Biochem. 1994;219:953–960. doi: 10.1111/j.1432-1033.1994.tb18577.x. [DOI] [PubMed] [Google Scholar]
- 6.Eliot AC, Kirsch JF. Pyridoxal phosphate enzymes: mechanistic, structural, and evolutionary considerations. Annu Rev Biochem. 2004;73:383–415. doi: 10.1146/annurev.biochem.73.011303.074021. [DOI] [PubMed] [Google Scholar]
- 7.Schneider G, Kack H, Lindqvist Y. The manifold of vitamin B6 dependent enzymes. Structure. 2000;8:R1–6. doi: 10.1016/s0969-2126(00)00085-x. [DOI] [PubMed] [Google Scholar]
- 8.Kack H, Sandmark J, Gibson K, Schneider G, Lindqvist Y. Crystal structure of diaminopelargonic acid synthase: evolutionary relationships between pyridoxal-5′-phosphate-dependent enzymes. J Mol Biol. 1999;291:857–876. doi: 10.1006/jmbi.1999.2997. [DOI] [PubMed] [Google Scholar]
- 9.Alexeev D, Alexeeva M, Baxter RL, Campopiano DJ, Webster SP, Sawyer L. The crystal structure of 8-amino-7-oxononanoate synthase: a bacterial PLP-dependent, acyl-CoA-condensing enzyme. J Mol Biol. 1998;284:401–419. doi: 10.1006/jmbi.1998.2086. [DOI] [PubMed] [Google Scholar]
- 10.Astner I, Schulze JO, van den Heuvel J, Jahn D, Schubert WD, Heinz DW. Crystal structure of 5-aminolevulinate synthase, the first enzyme of heme biosynthesis, and its link to XLSA in humans. Embo J. 2005;24:3166–3177. doi: 10.1038/sj.emboj.7600792. [DOI] [PMC free article] [PubMed] [Google Scholar]
- 11.Schmidt A, Sivaraman J, Li Y, Larocque R, Barbosa JA, Smith C, Matte A, Schrag JD, Cygler M. Three-dimensional structure of 2-amino-3-ketobutyrate CoA ligase from Escherichia coli complexed with a PLP-substrate intermediate: inferred reaction mechanism. Biochemistry. 2001;40:5151–5160. doi: 10.1021/bi002204y. [DOI] [PubMed] [Google Scholar]
- 12.Zhang J, Cheltsov AV, Ferreira GC. Conversion of 5-aminolevulinate synthase into a more active enzyme by linking the two subunits: spectroscopic and kinetic properties. Protein Sci. 2005;14:1190–1200. doi: 10.1110/ps.041258305. [DOI] [PMC free article] [PubMed] [Google Scholar]
- 13.Webster SP, Alexeev D, Campopiano DJ, Watt RM, Alexeeva M, Sawyer L, Baxter RL. Mechanism of 8-amino-7-oxononanoate synthase: spectroscopic, kinetic, and crystallographic studies. Biochemistry. 2000;39:516–528. doi: 10.1021/bi991620j. [DOI] [PubMed] [Google Scholar]
- 14.Goldberg JM, Swanson RV, Goodman HS, Kirsch JF. The tyrosine-225 to phenylalanine mutation of Escherichia coli aspartate aminotransferase results in an alkaline transition in the spectrophotometric and kinetic pKa values and reduced values of both kcat and Km. Biochemistry. 1991;30:305–312. doi: 10.1021/bi00215a041. [DOI] [PubMed] [Google Scholar]
- 15.White MF, Vasquez J, Yang SF, Kirsch JF. Expression of apple 1-aminocyclopropane-1-carboxylate synthase in Escherichia coli: kinetic characterization of wild-type and active-site mutant forms. Proc Natl Acad Sci U S A. 1994;91:12428–12432. doi: 10.1073/pnas.91.26.12428. [DOI] [PMC free article] [PubMed] [Google Scholar]
- 16.Tan D, Barber MJ, Ferreira GC. The role of tyrosine 121 in cofactor binding of 5-aminolevulinate synthase. Protein Sci. 1998;7:1208–13. doi: 10.1002/pro.5560070516. [DOI] [PMC free article] [PubMed] [Google Scholar]
- 17.Zhang J, Ferreira GC. Transient state kinetic investigation of 5-aminolevulinate synthase reaction mechanism. J Biol Chem. 2002;277:44660–44669. doi: 10.1074/jbc.M203584200. [DOI] [PMC free article] [PubMed] [Google Scholar]
- 18.Hunter GA, Ferreira GC. Pre-steady-state reaction of 5-aminolevulinate synthase. Evidence for a rate-determining product release. J Biol Chem. 1999;274:12222–12228. doi: 10.1074/jbc.274.18.12222. [DOI] [PubMed] [Google Scholar]
- 19.Hunter GA, Ferreira GC. A continuous spectrophotometric assay for 5-aminolevulinate synthase that utilizes substrate cycling. Anal Biochem. 1995;226:221–224. doi: 10.1006/abio.1995.1217. [DOI] [PubMed] [Google Scholar]
- 20.Laemmli UK. Cleavage of structural proteins during the assembly of the head of bacteriophage T4. Nature. 1970;227:680–685. doi: 10.1038/227680a0. [DOI] [PubMed] [Google Scholar]
- 21.Smith PK, Krohn RI, Hermanson GT, Mallia AK, Gartner FH, Provenzano MD, Fujimoto EK, Goeke NM, Olson BJ, Klenk DC. Measurement of protein using bicinchoninic acid. Anal Biochem. 1985;150:76–85. doi: 10.1016/0003-2697(85)90442-7. [DOI] [PubMed] [Google Scholar]
- 22.Chen GC, Yang JT. Two-point calibration of circular dichrometer with D-10-camphorsulfonic acid. Analytical letters. 1977;10:1195–1207. [Google Scholar]
- 23.Kuzmic P. Program DYNAFIT for the analysis of enzyme kinetic data: application to HIV proteinase. Anal Biochem. 1996;237:260–273. doi: 10.1006/abio.1996.0238. [DOI] [PubMed] [Google Scholar]
- 24.Gong J, Hunter GA, Ferreira GC. Aspartate-279 in aminolevulinate synthase affects enzyme catalysis through enhancing the function of the pyridoxal 5′-phosphate cofactor. Biochemistry. 1998;37:3509–3517. doi: 10.1021/bi9719298. [DOI] [PubMed] [Google Scholar]
- 25.Metzler CM, Metzler DE. Quantitative description of absorption spectra of a pyridoxal phosphate-dependent enzyme using lognormal distribution curves. Anal Biochem. 1987;166:313–327. doi: 10.1016/0003-2697(87)90580-x. [DOI] [PubMed] [Google Scholar]
- 26.Hunter GA, Ferreira GC. Lysine-313 of 5-Aminolevulinate Synthase Acts as a General Base during Formation of the Quinonoid Reaction Intermediates. Biochemistry. 1999;38:12526–12531. doi: 10.1021/bi995076q. [DOI] [PubMed] [Google Scholar]
- 27.Moore PS, Dominici P, Voltattorni CB. Transaldimination induces coenzyme reorientation in pig kidney dopa decarboxylase. Biochimie. 1995;77:724–728. doi: 10.1016/0300-9084(96)88189-2. [DOI] [PubMed] [Google Scholar]
- 28.Chow MA, McElroy KE, Corbett KD, Berger JM, Kirsch JF. Narrowing substrate specificity in a directly evolved enzyme: the A293D mutant of aspartate aminotransferase. Biochemistry. 2004;43:12780–12787. doi: 10.1021/bi0487544. [DOI] [PubMed] [Google Scholar]
- 29.Zhou X, Toney MD. pH studies on the mechanism of the pyridoxal phosphate-dependent dialkylglycine decarboxylase. Biochemistry. 1999;38:311–320. doi: 10.1021/bi981455s. [DOI] [PubMed] [Google Scholar]
- 30.Chu WC, Metzler DE. Enzymatically active truncated cat brain glutamate decarboxylase: expression, purification, and absorption spectrum. Arch Biochem Biophys. 1994;313:287–295. doi: 10.1006/abbi.1994.1390. [DOI] [PubMed] [Google Scholar]
- 31.DeLano W. The PyMOL Molecular Graphics System. De Lano Scientific; San Carlos, CA: 2002. [Google Scholar]
Associated Data
This section collects any data citations, data availability statements, or supplementary materials included in this article.


