Abstract
The ability to predict and interpret membrane permeation coefficients is of critical importance, particularly because passive transport is crucial for the effective delivery of many pharmaceutical agents to intracellular targets. We present a method for the quantitative measurement of the permeation coefficients of protonophores by using laser confocal scanning microscopy coupled to microelectrochemistry, which is amenable to precise modeling with the finite element method. The technique delivers well defined and high mass transport rates and allows rapid visualization of the entire pH distribution on both the cis and trans side of model bilayer lipid membranes (BLMs). A homologous series of carboxylic acids was investigated as probe molecules for BLMs composed of soybean phosphatidylcholine. Significantly, the permeation coefficient decreased with acyl tail length contrary to previous work and to Overton's rule. The reasons for this difference are considered, and we suggest that the applicability of Overton's rule requires re-evaluation.
Keywords: Overton's rule, permeation, ultramicroelectrode, laser confocal scanning microscopy, finite element method
Cell membranes act as a semipermeable barrier to control the contents of a cell with respect to the surrounding environment and maintain homeostasis (1). Both active and passive transport are important for the regulation of a cell (2), with passive permeation operating for a wide range of neutral species (3–5). Among molecules transported by passive permeation, weak acids are a significant class whose pharmacological action depends on reaching specific intracellular sites of action (6). On the other hand, some weak acid protonophores may also exert detrimental effects on cellular processes such as oxidative phosphorylation, apoptosis (7), and photosynthesis (8). The transport of weak acids across model cell membranes and the determination of permeation rates have consequently been the subject of a considerable number of studies (9–17).
Overton's rule (18, 19) has been widely applied to describe the permeation coefficient, P, of a molecule across a membrane in terms of the partition coefficient, K, between the oily and aqueous phases:
where D is the diffusion coefficient of the molecule in the membrane and l is the membrane thickness. Based on an analogy of aqueous/membrane systems and two-phase oil/water interfaces, K typically changes much more significantly than D (in a bulk hydrocarbon phase) for a homologous series of molecules. It is therefore generally assumed that K largely determines P, and that there is a direct correlation between the two (20–22). Consequently, oil/water partition coefficient measurements have become popular in the estimation of permeation coefficients (23–26). Despite the obvious differences in the bulk and interfacial structure of simple oils and phospholipid bilayers, this general empirical treatment of passive transport has largely stood unchallenged for a century (9, 13, 20–22). Previous studies of weak acid permeation (9, 12, 13) support Overton's rule but there are significant variations in the permeation coefficients obtained by different researchers for the same permeant molecules (see Results and Discussion).
Investigations of membrane permeation have essentially used two configurations based on either planar bilayer lipid membranes (BLMs) (9–13, 20) or liposomes (10, 14, 16, 17). The former configuration has received the most attention, with flux measurements made between adjacent stirred chambers of different composition separated by the BLM. The flux has been determined by measuring changes in either the bulk pH (9) or the concentration of labeled tracer molecules (20) in the trans compartment as a function of time. Localized pH measurements close to the BLM have also been reported (15, 27–30).
The permeation process involves mass transport of the permeant from bulk solution to the membrane surface in series with the membrane transport process. Thus, stirring of the bulk region is essential to enhance mass transport to the BLM. Nonetheless, an “unstirred layer” (USL) is considered to extend for several hundred microns on either side of the BLM in which transport of the permeant occurs predominantly by diffusion. This USL represents a significant resistance to the rate at which the permeant can be transported, restricting the permeation coefficients that can be measured by this technique. Moreover, neglecting to appropriately correct flux measurements for the USL necessarily leads to large errors in measured permeation coefficients (9, 12, 20).
We present here an original method to quantitatively measure the permeation of weak acids through membranes via microelectrochemistry, combined with laser confocal scanning microscopy (LCSM) and supported by finite element modeling (FEM). Dynamic electrochemistry in the form of scanning electrochemical microscopy (SECM) has found some application in the study of membrane transport (31–36). Our method uses an ultramicroelectrode (UME) placed close to one side of a BLM to deliver weak acids in a well defined manner by the electrogeneration of protons in the presence of weak acid anions and a trace quantity of the pH-sensitive fluorophore, fluorescein. The resulting steady-state pH distribution in the vicinity of the UME and on either side of the BLM is highly sensitive to the distribution of the weak acid and the BLM permeation coefficient. Our results provide values for the permeation coefficients of a series of aliphatic weak acids, casting significant doubt on classical methods, while highlighting the need to reconsider the applicability of Overton's rule.
Results and Discussion
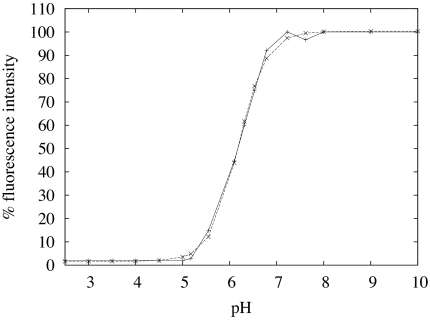
Our method relies on 3D mapping of the fluorescence of fluorescein as a visual indicator of the local pH distribution, sensitive over pH range 5–7 (Fig. 1). The pH is altered locally by the UME, comprised of a fine Pt wire (25 μm in diameter) sealed in glass with the end polished flat, operated galvanostatically and positioned close to one side of a BLM. The resulting steady-state fluorescence profile is measured accurately by using LCSM before it is used to parameterize a FEM simulation of the experimental system (using Matlab and Comsol Multiphysics) in which the permeation coefficient, P, of a protonophore is the only adjustable parameter. It should be noted that when experiments were carried out in the absence of weak acid anions we found no evidence for the permeation of protons, and hence the transport processes reported herein are the result of weak acid permeation alone.
Fig. 1.
Fluorescence intensity vs. experimental pH (solid line) and sigmoidal Boltzmann fit (dashed line).
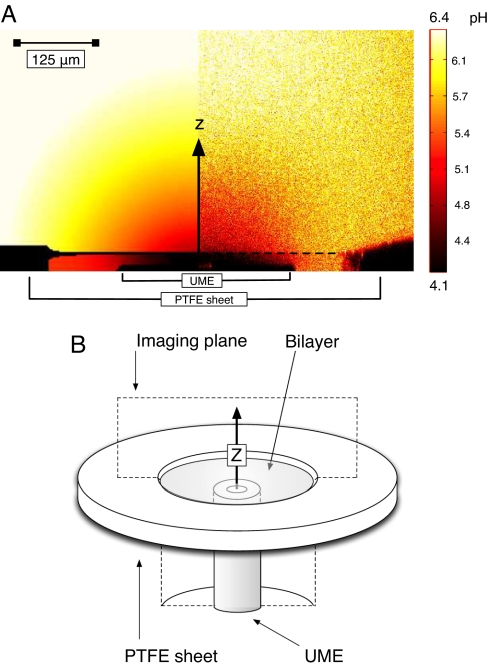
The 2D image in Fig. 2A pertains to the plane perpendicular to the electrode surface and the bilayer, covering a typical region of interest in the axisymmetric cylindrical geometry. The simulations, reported below, yield the pH distribution, while the experiments provide fluorescence intensity data for the solution, which can be related to pH (Fig. 1)
Fig. 2.
Image and imaging plane for the visualization of electrochemically-induced passive transport. (A) Simulated pH profile (Left) and experimental pH profile (Right) for the permeation of hexanoic acid. Bilayer position is marked by a solid line in the simulated profile and a dashed line in the experimental profile. (B) Illustration of the LCSM scan plane with respect to the experimental bilayer (see also Fig. 6).
Fig. 2A shows an experimental steady-state fluorescence (pH) profile and simulated pH data for an applied current of 5 nA at the UME positioned 20 μm below a BLM in a solution containing 1 mM hexanoic acid with 0.1 M KCl supporting electrolyte (bulk pH 6.4) and 5 μM of the sodium salt of fluorescein. There is good agreement between experiment and simulation, although noise in the experimental fluorescence data is evident.
The galvanostatic oxidation of water at the UME quantitatively corresponds to (37):
coupled with the following solution processes:
where X− is an anion conjugate of a particular weak acid, HX, added to both compartments of the diffusion cell at a predefined concentration. If HX does not cross the BLM, the fluorescence change that accompanies the UME process would be confined to the cis side of the BLM. On the other hand, for the case of no apparent kinetic barrier to the transfer of HX across the BLM, a fluorescence profile, reflecting hemispherical diffusion from the UME would be seen (37). Thus, the profile is highly sensitive to the presence of weak acid anions and the permeation of their conjugate protonated forms through the BLM. In Fig. 2A it is evident that the behavior is between these two limiting scenarios: the fluorescence profile indicates that HX permeates the BLM, but the discontinuity in the fluorescence profile at the location of the BLM is clear evidence of a kinetic barrier to permeation. The experimental fluorescence signal does not attain a bulk value for several hundred micrometers, as noted previously (37), because the signal reflects the pH dependence of the fluorescence of fluorescein (Fig. 1).
Readily discernible in the experimental part of the image in Fig. 2A are dark regions caused by the nonfluorescing surface of the UME in the cis compartment (below the bilayer) and the polytetrafluoroethylene (PTFE) sheet that supports the BLM. Thus, the precise experimental geometry can be reproduced faithfully in simulations. The restricted channel formed between the UME tip and the bilayer hinders diffusion when transfer across the BLM is partly kinetically limited, and hence generates a region of relatively low pH that can be seen directly above the UME tip on the cis side of the BLM. An advantage of the method is that by constantly generating protons at the UME, a high proton concentration gradient is maintained, avoiding the effects of proton backflux (11).
It should be noted that the region close to the active part of the UME experiences the lowest pH (and hence should show minimal fluorescence), as evident in the simulated data (Fig. 2A), yet the optical signal in this location is higher than the surrounding area. This effect, which is absent in the vicinity of the glass insulating sheath, is simply a consequence of optical interference from the highly reflective Pt surface. This perturbation of the signal has minimal effect on the quantitative analysis of data.
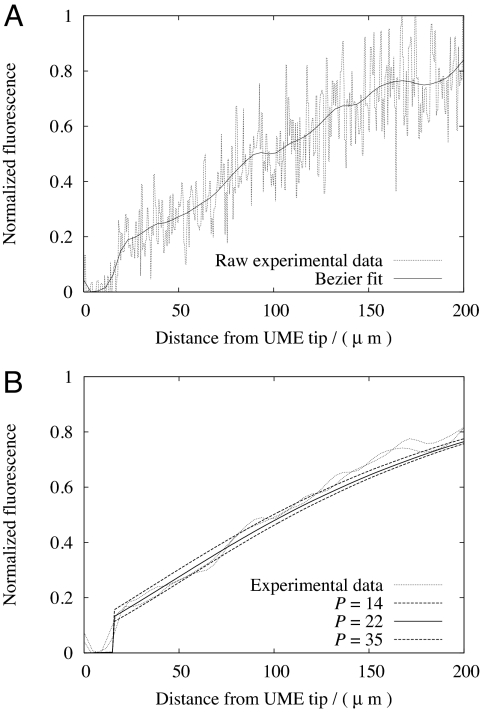
To analyze experimental data, a Bezier curve (38) was fitted through the experimental fluorescence profile along the z axis, perpendicular to the bilayer with the origin at the UME tip center (Fig. 2B). The effect of the Bezier curve-fit can be seen in Fig. 3A, which shows a reduction in experimental noise, while preserving the essential shape and nature of the fluorescence profile. In Fig. 3B the Bezier fit was used to parameterize the FEM simulation results for the permeation coefficient of acetic acid; the best match for P from the FEM simulations was determined by minimizing the RMS error between the experimental and simulated fluorescence curves. It can be seen that a value of P = 22 (± 4) × 10−4 cm·s−1 describes the data. In fitting the experimental profile to simulations, P values were also chosen to enclose the upper and lower bounds of two independent experimental fluorescence profiles on two different bilayers. The main region of interest lies just above the BLM, because at distances of a few hundred microns from the electrode natural convection may influence the process slightly (37). Confidence in this assignment is further apparent by noting that the effective mass transport coefficient between the tip and BLM is ≈D/d, where d (= 20 μm) is the UME tip/BLM separation, ≈5 × 10⁻³ cm·s−1. This high mass transport coefficient allows the precise determination of P values of this order.
Fig. 3.
Fluorescence-distance plots normal to the center of the microelectrode. (A) Bezier fit to the experimental fluorescence profile of acetic acid. (B) Fitted simulation data for P (units 10−4 cm·s−1) from FEM calculations of acetic acid under the experimental conditions and geometry.
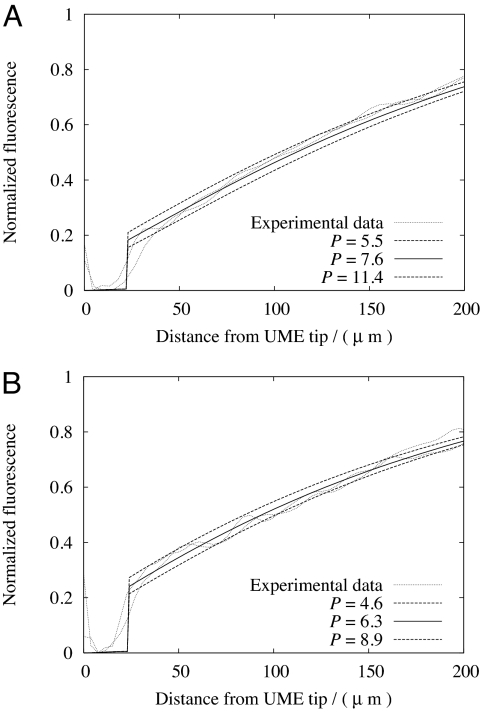
Typical indicative results from the matching of experimental and simulated fluorescence profiles are shown in Fig. 4 for valeric and hexanoic acid. The composition of the solutions was similar to that already defined, with the bulk pH adjusted to the values in Table 1. As for the data in Fig. 3, it can be seen that the fluorescence (pH) is low on the cis side of the BLM, just above the UME surface. The magnitude of the fluorescence just adjacent to the trans side of the membrane is indicative of the extent of the permeation; the higher the permeation coefficient, the lower the fluorescence in this location, given that all of the weak acids sudied had similar pKa values (Table 1).
Fig. 4.
Fluorescence-distance plots normal to the center of the microelectrode. (A) Valeric acid. (B) Hexanoic acid. Units of P are 10−4 cm·s−1.
Table 1.
Diffusion coefficients, pKa values, and bulk pH measurements for the FEM model
| Acid | DHX, 10−5 cm2·s−1 | pKa | pH |
|---|---|---|---|
| Acetic | 1.271 | 4.76 | 6.82 |
| Butanoic | 0.918 | 4.83 | 6.77 |
| Valeric | 0.817 | 4.83 | 7.10 |
| Hexanoic | 0.784 | 4.85 | 6.40 |
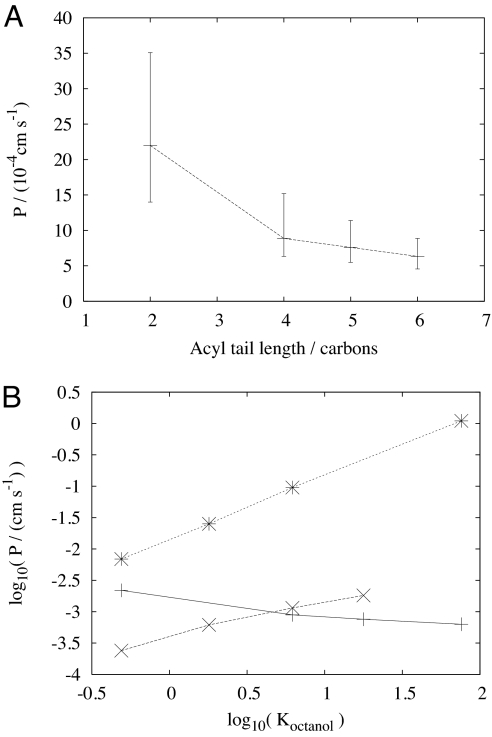
Strikingly, on this basis, the permeation coefficient for acetic acid appears to be much higher than for butanoic acid, which itself is slightly higher than that of hexanoic acid. Indeed, in contrast to previous results (Table 2), the homologous series of weak acids was found to follow a trend of monotonically decreasing permeation coefficient with acyl length (Fig. 5A). This finding diametrically opposes the proportionality between P and K, which is generally assumed to arise from Overton's rule, where the partition coefficient is the major parameter controlling the permeation coefficient and the diffusion coefficient plays a minor role.
Table 2.
Permeation coefficients from various weak acid permeation studies (units of 10−4 cm·s−1)
| Acid | Ref. 9 | Ref. 10 | Ref. 20 | Ref. 12 | Ref. 16 | This study |
|---|---|---|---|---|---|---|
| Acetic | 2.38 | 5 | 66 | 3.9, 65 | 22.0 | |
| Butanoic | 11.5 | 640 | 950 | 8.9 | ||
| Valeric | 18.0 | 7.6 | ||||
| Hexanoic | 11,000 | 6.33 | ||||
| Temperature,°C | 25 | 7 | 25 ± 2 | 22 ± 2 | 20, 26 | 20 ± 2 |
All studies used egg PC, except DMPC was used in ref. 16 and soybean PC was used in this study.
Fig. 5.
Trends in permeability coefficients for a homologous series of aliphatic weak acids. (A) P vs. acyl length. (B) P vs. water/octanol partition coefficient, K (log10 scale). In B, the solid line denotes data from this study, the dotted line indicates data from ref. 9, and the dashed line denoted data from ref. 12. All K values were taken from refs. 9 and 12. Note that partition coefficient data were not available for the same weak acids in the two studies cited.
A phosphatidylcholine BLM of the type used in this study is heterogeneous in structure and would be expected to have some influence on the permeation process (39). Hence, to analyze the trend in permeation coefficient with K, we have considered the partition coefficients between water and octanol. Similar trends were seen for water and olive oil, although K is shifted to lower values by an order of magnitude, and for other oils including hydrocarbons (9, 13). We selected octanol to better reflect the innate structural order in bilayers rather than decane (9) or hexadecane (12, 13) used in other analyses.
The results of this analysis on our data, and those of others, are summarized in Fig. 5B. The difference in behavior that we observe compared with others, both in trend and magnitude, is clear and we briefly consider the reasons below. We note, however, that the trend is not entirely without precedent; the gel-phase dipalmitolyphosphatidylcholine (DPPC) studies of Xiang and Anderson (14, 16, 17) also found a decreasing permeation coefficient from acetic to propionic acid, but for larger acids P increased again (17). DPPC is a fully saturated lipid, thus P values are orders of magnitude smaller in the gel phase (17) and so are easier to measure accurately. In constrast, soy lecithin remains in the fluid phase from 3°C to 80°C, because of the high proportion of unsaturated lipids (40).
Previous studies of permeation in BLMs had to account for USLs that limit mass transport to the BLM. When the coefficient defining mass transport from bulk solution to the BLM surface is significantly smaller than the BLM permeation coefficient, it clearly becomes increasingly difficult to measure the permeation coefficient precisely, and diffusion in the USL becomes the rate-limiting step of the overall BLM permeation process. Stirring of the aqueous phase and buffering at low pH in an attempt to ensure a plentiful supply of protonated weak acid can enhance mass transport, but the size of the USL and its ill-defined nature necessarily places restriction on the magnitude of membrane permeabilities that can be extracted from such measurements with confidence. In contrast, the galvanostatic generation of protons close to the cis surface of the BLM, and the measurement of weak acid transport in the immediate vicinity of the opposing trans surface, ensures that diffusion is extremely well defined and that high mass transport rates can be generated. This method is also rapid, with profiles generated in seconds as opposed to the hours that may be required for proton titration or tracer molecule measurements.
Conclusion
We have found that the permeation coefficient of a homologous series of aliphatic weak acids does not correlate with the partition coefficient, as generally assumed. Rather, a trend of decreasing permeation coefficient with increasing acyl tail length for the transport of weak acids across model planar BLMs correlates most closely with molecular size (and therefore diffusion coefficient). This trend violates Overton's rule, which considers that the hydrocarbon/water partition coefficient is the most significant parameter controlling permeation; the applicability of the rule requires reassessment.
The method described uses microelectrode-generated pH gradients, coupled to LCSM visualization and FEM simulations, and is highly controlled, with the value of P as the only unknown variable used to analyze experimental data. The method could be extended to living cells with relative ease, because of the nontoxic nature and biologically relevant pH range of the fluorescence of fluorescein or other fluorophores. More complex multispecies kinetics and equilibria could also be treated readily. The technique is of value because of the common use of weak acids and bases in pharmaceutical treatments, both of which can induce changes in pH and hence are amenable to investigation in this manner. Previous studies of protonophore transport have often relied on setting up asymmetrical bulk pH values across a membrane, the use of various buffer effects, and major assumptions about the USL to infer information on permeation through membranes. Such considerations are unnecessary with the method we have presented. The technique is noninvasive and allows not only the measurement of permeation through cell membranes but also the direct visualization of concentration gradients on both sides of a BLM.
Materials and Methods
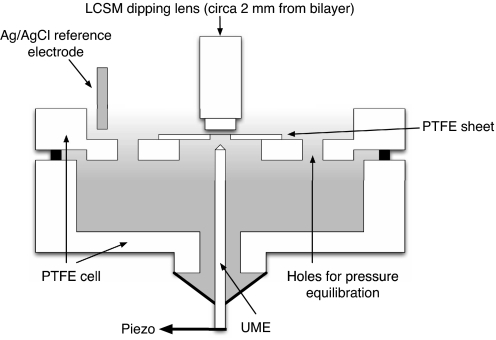
The key features of the experimental setup are illustrated in Fig. 6. A dipping lens was positioned above the bilayer (typically at a distance of 2 mm) for the visualization (Zeiss LSM 510 laser scanning confocal microscope with Archoplan ×20/0.5-W Ph2 lens). HeNe and Ar lasers at wavelengths of 543 and 488 nm were used for the observation of the bilayer formation and the fluorescence measurements, respectively. A two-electrode galvanostatic arrangement was used with a home-built galvanostat with a AgCl-coated Ag wire reference electrode to apply a well defined pH perturbation at the UME (25-μm diameter Pt disk, with a glass surround of 250-μm diameter) positioned beneath the bilayer. The location of the UME, fabricated as described (41), was controlled via micrometers with a piezoelectric positioner (E-660; Physik Instrumente) for optimum displacement.
Fig. 6.
Schematic of the PTFE cell arrangement. Two PTFE sections form the upper and lower chambers, with holes for pressure equilibration (31). The dipping lens of the confocal microscope is positioned at a working distance of ≈2 mm above the bilayer.
Experimental Bilayer Formation.
Bilayers were formed by using the paintbrush method of Mueller et al. (42) using soybean phosphatidylcholine (95% lecithin; Avanti Polar Lipids) dissolved to 50 mg/ml in decane (99%; Alfa Aesar) supported on a circular hole of radius 0.5 mm punched into a square of PTFE sheet (0.025 mm thick; Goodfellow Cambridge) fixed as a diaphragm between a two-chamber PTFE cell with wax (Fig. 6). The cell was similar to that developed previously by Bard and coworkers (31) for pure SECM experiments. This method of bilayer formation is a well established and popular protocol (42–44) and was thus a good choice for initial studies that needed to compare measurements on similar systems to those in the literature. The membrane formation was monitored until a clear black bilayer formed, with excess lipid and solvent restricted to the periphery of the bilayer structure that was not investigated. The ability to investigate the bilayer exclusively is a further advantage of the technique used.
After observation of the bilayer formation, the argon laser was activated and a current of 5 nA was generated at the UME with respect to the reference electrode. The system was allowed to reach a steady state over at least 45 s (with a steady state visible from the fluorescence profile after ≈15 s), before a series of scan lines (eight signals averaged) recorded the fluorescence profile generated by the presence of fluorescein in a pH gradient. Multiple readings were taken from independent bilayers for each weak acid, with the bilayers typically forming in the same location with respect to the plane of the PTFE sheet, with a perpendicular difference of ±3 microns. All measurements were taken at a temperature of 20 ± 2°C and could be made repetitively within 5 min of forming a bilayer.
Experimental Reagents.
Aqueous carboxylic acid solutions (Fisher Scientific) were made to a concentration of 1 mM with 0.1 M KCl supporting electrolyte and 5 μM of the sodium salt of fluorescein (Sigma–Aldrich) added. The pH of the solutions was adjusted with NaOH so that the weak acid conjugate anion was the dominant species in solution (i.e., pH ≫ pKa; see Table 1). The pH of the solution was checked regularly throughout the measurements by using an electrode and found to be stable on the experimental time scale.
FEM Simulations.
These were performed by using geometries determined from the LCSM experiments, and doubling the mesh resolution of the elements did not significantly alter the results. The electrochemical and coupled chemical processes are defined by Eqs. 2–4.
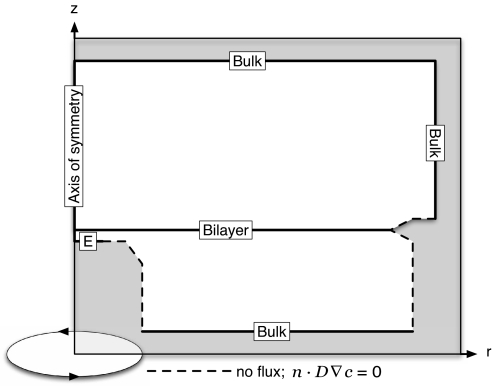
The influence of the protonation/deprotonation state of fluorescein was found to have no significant effect on the results because of the very low concentration of that species and was therefore ignored in the calculations. The rapidity of the solution processes on the experimental timescale meant they could be considered at an equilibrium governed by the local pH. The pKa values of all species (Table 1) were corrected for ionic activity with the Davies equation (45) given the presence of 0.1 M KCl, and the geometry and boundary conditions were modeled with axisymmetric cylindrical geometry of the system (Fig. 7). A steady-state solution to the reaction-diffusion equation was sought for the axisymmetric system, with diffusion coefficients, Di, listed in Table 1:
where ci is the concentration of species i (H+, X−, and HX), Ri is the net production of species i due to acid-base equilibration, and r and z are the radial and normal coordinates starting at the center of the microelectrode surface. The boundary conditions were:
with the bulk concentration, ci*, of a species determined from the composition of the solution, JBilayer denoting the radially dependent flux across the bilayer (with cHXb and cHXa the concentration of the protonated weak acid immediately below and above the bilayer, respectively) and JPt denoting the H+ flux caused by proton generation at the Pt electrode surface. The flux gradient on the axial boundary is . All PTFE and glass surfaces were modeled as no flux boundaries, n· Di ∇ ci = 0, and unless otherwise specified other species had null fluxes on the electrode and at the BLM. See supporting information (SI) Appendix for the report generated by COMSOL Multiphysics for a typical simulation.
Fig. 7.
Schematic of the FEM geometry and boundaries (see FEM Simulations for conditions).
Supplementary Material
Acknowledgments.
This research was supported by the U.K. Engineering and Physical Sciences Research Council (J.M.A.G. and M.A.E.) and the University of Warwick Postgraduate Research Fellowship Scheme (N.C.R.)
Footnotes
The authors declare no conflict of interest.
This article is a PNAS Direct Submission.
This article contains supporting information online at www.pnas.org/cgi/content/full/0803720105/DCSupplemental.
References
- 1.Krylov AV, Pohl P, Zeidel ML, Hill WG. Water permeability of asymmetric planar lipid bilayers: Leaflets of different composition offer independent and additive resistances to permeation. J Gen Physiol. 2001;118:333–340. doi: 10.1085/jgp.118.4.333. [DOI] [PMC free article] [PubMed] [Google Scholar]
- 2.Gennis RB. Biomembranes. New York: Springer; 1989. [Google Scholar]
- 3.Doan KMM, et al. Passive permeability and P-glycoprotein-mediated efflux differentiate central nervous system (CNS) and non-CNS marketed drugs. J Pharmacol Exp Ther. 2002;303:1029–1037. doi: 10.1124/jpet.102.039255. [DOI] [PubMed] [Google Scholar]
- 4.Doppenschmitt S, Spahn-Langguth H, Regardh CG, Langguth P. Role of P-glycoprotein-mediated secretion in absorptive drug permeability: An approach using passive membrane permeability and affinity to P-glycoprotein. J Pharm Sci. 1999;88:1067–1072. doi: 10.1021/js980378j. [DOI] [PubMed] [Google Scholar]
- 5.Stein WD, Lieb WR. Transport and Diffusion Across Cell Membranes. New York: Academic; 1986. [Google Scholar]
- 6.Cairns D. Essentials of Pharmaceutical Chemistry. London: Pharmaceutical Press; 2003. pp. 57–69. [Google Scholar]
- 7.Gottlieb E, Armour SM, Harris MH, Thompson CB. Mitochondrial membrane potential regulates matrix configuration and cytochrome c release during apoptosis. Nat Cell Death Differentiation. 2003;10:709–717. doi: 10.1038/sj.cdd.4401231. [DOI] [PubMed] [Google Scholar]
- 8.Yamasaki H, et al. Induction of the H+ release from thylakoid membranes by illumination in the presence of protonophores at high concentrations. Plant Cell Physiol. 1991;32:925–934. [Google Scholar]
- 9.Wolosin JM, Ginsburg H. The permeation of organic acids through lecithin bilayers resemblance to diffusion in polymers. Biochim Biophys Acta. 1975;389:20–33. doi: 10.1016/0005-2736(75)90382-x. [DOI] [PubMed] [Google Scholar]
- 10.Alger JR, Prestegard JH. Nuclear magnetic resonance study of acetic acid permeation of large unilamellar vesicle membranes. Biophys J. 1979;28:1–14. doi: 10.1016/S0006-3495(79)85154-1. [DOI] [PMC free article] [PubMed] [Google Scholar]
- 11.Walter A, Hastings D, Gutknecht J. Weak acid permeability through lipid bilayer membranes. J Gen Physiol. 1982;79:917–933. doi: 10.1085/jgp.79.5.917. [DOI] [PMC free article] [PubMed] [Google Scholar]
- 12.Walter A, Gutknecht J. Monocarboxylic acid permeation through lipid bilayer membranes. J Membr Biol. 1984;77:255–264. doi: 10.1007/BF01870573. [DOI] [PubMed] [Google Scholar]
- 13.Walter A, Gutknecht J. Permeability of small nonelectrolytes through lipid bilayer membranes. J Membr Biol. 1986;90:207–217. doi: 10.1007/BF01870127. [DOI] [PubMed] [Google Scholar]
- 14.Xiang T-X, Anderson BD. Phospholipid surface density determines the partitioning and permeability of acetic acid in DMPC:cholesterol bilayers. J Membr Biol. 1995;148:157–167. doi: 10.1007/BF00207271. [DOI] [PubMed] [Google Scholar]
- 15.Evtodienko VY, Kovbasnjuk ON, Antonenko YN, Yaguzhinsky LS. Effect of the alkyl chain length of monocarboxylic acid on the permeation through bilayer lipid membranes. Biochim Biophys Acta. 1996;1281:245–251. doi: 10.1016/0005-2736(96)00023-5. [DOI] [PubMed] [Google Scholar]
- 16.Xiang T-X, Anderson BD. Permeability of acetic acid across gel and liquid-crystalline lipid bilayers conforms to free-surface-area theory. Biophys J. 1997;72:223–237. doi: 10.1016/S0006-3495(97)78661-2. [DOI] [PMC free article] [PubMed] [Google Scholar]
- 17.Xiang T-X, Anderson BD. Influence of chain ordering on the selectivity of dipalmitoylphosphatidylcholine bilayer membranes for permeant size and shape. Biophys J. 1998;75:2658–2671. doi: 10.1016/S0006-3495(98)77711-2. [DOI] [PMC free article] [PubMed] [Google Scholar]
- 18.Overton CE. On the general osmotic properties of the cell, their probable origin, and their significance for physiology. Vierteljahrsschr Naturforsch Ges Zurich. 1899;44:88–135. [Google Scholar]
- 19.Overton CE. Studies in Narcosis. Jena, Germany: Fischer; 1901. translated from German. [Google Scholar]
- 20.Orbach E, Finkelstein A. The nonelectrolyte permeability of planar lipid bilayer membranes. J Gen Physiol. 1980;75:427–436. doi: 10.1085/jgp.75.4.427. [DOI] [PMC free article] [PubMed] [Google Scholar]
- 21.Saparov SM, Antonenko YN, Pohl P. A new model of weak acid permeation through membranes revisited: Does Overton still rule? Biophys J. 2006;90:L86–L88. doi: 10.1529/biophysj.106.084343. [DOI] [PMC free article] [PubMed] [Google Scholar]
- 22.Al-Awqati Q. One hundred years of membrane permeability: Does Overton still rule? Nat Cell Biol. 1999;1:E201–E202. doi: 10.1038/70230. [DOI] [PubMed] [Google Scholar]
- 23.Levin VA. Relationship of octanol/water partition coefficient and molecular weight to rat brain capillary permeability. J Med Chem. 1980;23:682–684. doi: 10.1021/jm00180a022. [DOI] [PubMed] [Google Scholar]
- 24.Lin R-Y, Hsu C-W, Chen W-Y. A method to predict the transdermal permeability of amino acids and dipeptides through porcine skin. J Controlled Release. 1996;38:229–234. [Google Scholar]
- 25.Camenisch G, Alsenz J, van de Waterbeemd H, Folkers G. Estimation of permeability by passive diffusion through Caco-2 cell monolayers using the drugs lipophilicity and molecular weight. Eur J Pharm Sci. 1998;6:313–319. [PubMed] [Google Scholar]
- 26.Edwards A, Prausnitz MR. Predicted permeability of the cornea to topical drugs. Pharm Res. 2001;18:1497–1508. doi: 10.1023/a:1013061926851. [DOI] [PubMed] [Google Scholar]
- 27.Pohl P, Saparov SM, Antonenko YN. The effect of a transmembrane osmotic flux on the ion concentration distribution in the immediate membrane vicinity measured by microelectrodes. Biophys J. 1997;72:1711–1718. doi: 10.1016/S0006-3495(97)78817-9. [DOI] [PMC free article] [PubMed] [Google Scholar]
- 28.Antonenko YN, Bulychev AA. Measurements of local pH changes near bilayer lipid membrane by means of a pH microelectrode and a protonophore-dependent membrane potential: Comparison of the methods. Biochim Biophys Acta. 1991;1070:279–282. doi: 10.1016/0005-2736(91)90176-9. [DOI] [PubMed] [Google Scholar]
- 29.Antonenko YN, Pohl P. Steady-state nonmonotonic concentration profiles of bilayer lipid membranes in the unstirred layers. Biochim Biophys Acta. 1995;1235:57–61. doi: 10.1016/0005-2736(94)00274-s. [DOI] [PubMed] [Google Scholar]
- 30.Pohl P, Saparov SM, Antonenko YN. The size of the unstirred layer as a function of the solute diffusion coefficient. Biophys J. 1998;75:1403–1409. doi: 10.1016/S0006-3495(98)74058-5. [DOI] [PMC free article] [PubMed] [Google Scholar]
- 31.Tsionsky M, Zhou J, Amemiya S, Fan F-RF, Bard AJ. Scanning electrochemical microscopy. 38. Application of SECM to the study of charge transfer through bilayer lipid membranes. Anal Chem. 1999;71:4300–4305. doi: 10.1021/ac9903858. [DOI] [PubMed] [Google Scholar]
- 32.Mauzeroll J, Bard AJ. Scanning electrochemical microscopy of menadione-glutathione conjugate export from yeast cells. Proc Natl Acad Sci USA. 2004;101:7862–7867. doi: 10.1073/pnas.0402556101. [DOI] [PMC free article] [PubMed] [Google Scholar]
- 33.Yamada H, Matsue T, Uchida I. A microvoltammetric study of permeation of ferrocene derivatives through planar bilayer lipid membrane. Biochim Biophys Acta. 1991;180:1330–1334. doi: 10.1016/s0006-291x(05)81341-5. [DOI] [PubMed] [Google Scholar]
- 34.Matsue T, Shiku H, Yamada H, Uchida I. Permselectivity of voltage-gated ion channel studied by microamperometry. J Phys Chem. 1994;98:11001–11003. [Google Scholar]
- 35.Gonsalves M, et al. Scanning electrochemical microscopy as a local probe of oxygen permeability in cartilage. Biophys J. 2000;78:1578–1588. doi: 10.1016/S0006-3495(00)76710-5. [DOI] [PMC free article] [PubMed] [Google Scholar]
- 36.Scott ER, White HS. Scanning electrochemical microscopy of a porous membrane. J Membr Sci. 1991;58:71–87. [Google Scholar]
- 37.Rudd NC, et al. Fluorescence confocal laser scanning microscopy as a probe of pH gradients in electrode reactions and surface activity. Anal Chem. 2005;77:6205–6217. doi: 10.1021/ac050800y. [DOI] [PubMed] [Google Scholar]
- 38.Davies CW. An Introduction to Splines for Use in Computer Graphics and Geometric Modeling. San Francisco, CA: Morgan Kaufmann; 1989. pp. 211–245. [Google Scholar]
- 39.Miller DM. Evidence that interfacial transport is rate-limiting during passive cell membrane permeation. Biochim Biophys Acta. 1991;1065:75–81. doi: 10.1016/0005-2736(91)90013-x. [DOI] [PubMed] [Google Scholar]
- 40.O'Neill SD, Leopold AC. An assessment of phase transitions in soybean membranes. Plant Physiol. 1982;70:1405–1409. doi: 10.1104/pp.70.5.1405. [DOI] [PMC free article] [PubMed] [Google Scholar]
- 41.Wightman RM, Wipf DO. In: Electroanalytical Chemistry. Bard AJ, editor. Vol 15. New York: Dekker; 1989. pp. 329–333. [Google Scholar]
- 42.Mueller P, Rudin DO, Tien HT, Wescott WC. Methods for the formation of single bimolecular lipid membranes in aqueous solution. J Phys Chem. 1963;67:534–535. [Google Scholar]
- 43.Tien HT. Bilayer Lipid Membranes (BLM): Theory and Practice. New York: Dekker; 1974. [Google Scholar]
- 44.Edwards MA, Martin S, Whitworth AL, Macpherson JV, Unwin PR. Scanning electrochemical microscopy: Principles and applications to biophysical systems. Physiol Measurements. 2006;27:R63–R108. doi: 10.1088/0967-3334/27/12/R01. [DOI] [PubMed] [Google Scholar]
- 45.Davies CW. Ion Association. London: Butterworths; 1962. p. 47. [Google Scholar]
Associated Data
This section collects any data citations, data availability statements, or supplementary materials included in this article.


