

Abstract
Like other protein-protein interaction domains, PDZ domains are involved in many key cellular processes. These processes often require that specific multi-protein complexes be assembled, a task that PDZ domains accomplish by binding to specific peptide motifs in target proteins. However, a growing number of experimental studies show that PDZ domains (like other protein-protein interaction domains) can engage in a variety of interactions and bind distinct peptide motifs. Such promiscuity in ligand recognition raises intriguing questions about the molecular and thermodynamic mechanisms that can sustain it. To identify possible sources of promiscuity and selectivity underlying PDZ domain interactions, we performed molecular dynamics simulations of 20 to 25 ns on a set of 12 different PDZ domain complexes (for the proteins PSD-95, Syntenin, Erbin, GRIP, NHERF, Inad, Dishevelled and Shank). The electrostatic, non-polar and configurational entropy binding contributions were evaluated using the MM/PBSA method combined with a quasi-harmonic analysis. The results revealed that PDZ domain interactions are characterized by overwhelmingly favorable non-polar contributions and almost negligible electrostatic components, a mix that may readily sustain promiscuity. In addition, despite the structural similarity in fold and in recognition modes, the entropic and other dynamical aspects of binding were remarkably variable not only across PDZ domains but also for the same PDZ domain bound to distinct ligands. This variability suggests that entropic and dynamical components can play a role in determining selectivity either of PDZ domain interactions with peptide ligands or of PDZ domains complexes with downstream effectors.
INTRODUCTION
Protein-protein interaction domains are one of the most remarkable features in protein recognition. Grouped in families of structurally homologous proteins, protein-protein interaction domains such as FYVE, PH, PB, SH3 or PDZ participate in a wide variety of biological functions 1. They do so by binding specific peptide sequence-motifs within target proteins, and assembling these proteins into supramolecular complexes generally endowed with a new biological function. However, one characteristic of protein-protein recognition is its degeneracy, i.e. the ability that certain protein-protein interaction domains have to bind more than one target sequence-motif 2. This property is also referred to in the literature as degenerate specificity, multivalent specificity, or simply promiscuity.
To investigate the thermodynamic aspects underlying the specific example of promiscuity in the protein-protein recognition function of such modules, we have chosen to focus on PDZ domains 3. Named after the combination of Post-synaptic density PSD-95, Discs large Dlg and Zona occludens-1 ZO-1 – the first proteins in which PDZ domains have been identified - these structurally conserved domains are among the most common protein-protein interaction domains 4-8. They consist of 80 to 100 amino acids, and have a tertiary structure formed by six β-strands, βA through βF, and two α-helices, αA and αB (Figure 1a).
Figure 1.
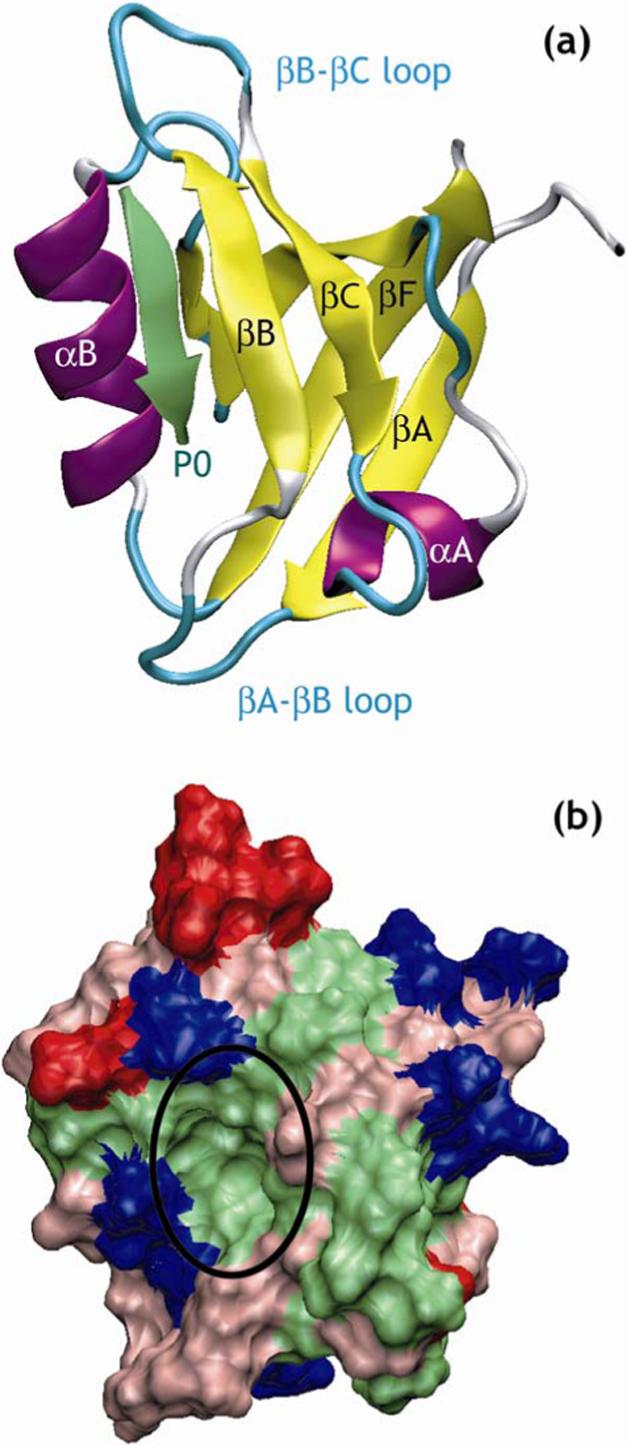
Representative structure of a PDZ domain in complex with its target peptide. (a) Ribbon representation of the crystal structure of PDZ3 of PSD-95 in complex with a peptide in its binding site 3.
The peptide is represented in green and the C-terminus of the peptide is indicated by P0 (b) Molecular surface representation of PDZ3 of PSD-95 with basic residues in blue, acidic residues in red, polar residues in pink and hydrophobic residues in green. The binding pocket for the peptide is indicated by a black circle. Figures created using VMD 92.
PDZ domains generally recognize peptide motifs located at the C-terminus of other proteins. These bind to PDZ domains by what appears to be a β-sheet augmentation mechanism observed for other protein-protein interaction domains as well 9-11. The canonical mode of peptide recognition by PDZ domains is shown on Figure 1a. One of the hallmarks of PDZ domain recognition is the carboxylate group of the last residue in the ligand protein (the P0 position) interacting through several hydrogen bonds with the main-chain amide protons of the βA-βB loop, also called the carboxylate-binding loop, that contains the conserved GLGF motif 3. Two main classes of PDZ domains have been defined 12-14: class I PDZ domains recognizing C-terminus peptides with a serine or threonine at P−2, within a peptide sequence-motif defined as -[X-S/T-X-Φ], where Φ is any hydrophobic amino acid and X is any amino acid; and class II PDZ domains that can bind peptides with any hydrophobic residue at P−2 within a peptide sequence-motif defined as -[X-Φ-X-Φ]. In addition, at least two more classes have been defined, which correspond to different sequence-motifs in the C-terminal peptides 4, 5, 15, but there is no consensus on this classification 16, 17.
The difficulties encountered in the various attempts at classifying PDZ domains are but an illustration of the remarkable promiscuity that seem to characterize PDZ domain interactions. Indeed, some PDZ domains have more than one biological target, such as the first NHERF PDZ domain which binds both the NDSLL and EDSFL peptide motifs located at the C-terminus of the β2-adrenergic and Platelet-derived Growth Factor receptors, respectively 18. Other PDZ domains exhibit promiscuity by binding to peptide sequence-motifs that belong to more than one class. For example, the PDZ domain of Erbin binds the class I C-terminus of p0071/delta-catenin protein 19, and the class II C-terminus of ErbB220.Similarly, the second PDZ domain of Syntenin, recognizes both the class I motif at the C-terminus of the IL5 receptor (α chain) and the class II motif at the C-terminus of syndecan 21. Other examples of this dual-class promiscuity include, PDZ3 and PDZ5 of CIPP1 16, 22, the PDZ domain of PICK1 23, PDZ3 of hINADL 17, PDZ1 of MINT1 and Par6 PDZ domains 16. Finally, it has been shown that the PDZ domain of syntrophin can recognize internal peptide sequences that lack a free carboxylate 24, 25, and a binding site distinct from the canonical binding site in the seventh PDZ domain of GRIP has also been proposed 26.
Much information is available from experiments concerning the binding of PDZ domains. But there is considerably less data from measurements of binding affinities for PDZ domains than for many of the other modular domains, such as the SH2 domains. Moreover, measured binding affinities for PDZ domains are often not comparable due to differences in experimental conditions. The study of the thermodynamics of recognition of C-terminal peptides by PDZ domains utilizing computational methods can therefore offer an important complementation to the sparse experimental data.
From the computational studies presented in this work, we aim to understand the origins of promiscuity and selectivity in peptide/PDZ domain recognition by examining various contributions to the energy in the binding interactions of known complexes of PDZ domains. In order to evaluate these energy contributions, namely the electrostatic, non-polar and configurational entropy components, a set of distinct PDZ domains complexes was subjected to molecular dynamics (MD) simulations and the resulting trajectories were analyzed using the MM/PBSA method (Molecular Mechanics/Poisson-Boltzmann Surface Area). This set includes a variety of same-class and inter-class pairs: eight different PDZ domains in complex with different target peptides, for a total of twelve different complexes for which 3D-structures were available. The traditional MM/PBSA approach was combined with a quasi-harmonic analysis to estimate the configurational entropies of molecules. In addition, some of the dynamic effects associated with binding that could not be captured in the MM/PBSA calculations because they are based exclusively on the MD trajectories of the PDZ/peptide complex, were estimated through the calculation of an “adaptation free energy” defined separately for each PDZ domain and each ligand as the difference in free energy between the bound and free state of each molecule 27, 28.Computing the adaptation free energy required separate MD simulations for each PDZ domain and each peptide ligand.
The results of these computational experiments show that non-polar contributions dominate the thermodynamics of the interaction between PDZ domains and their ligands. This was in marked contrast with the contribution of the electrostatic component that was almost consistently insignificant. The configurational entropy contribution, which reflects the degree to which the dynamics of the PDZ domain and the peptide ligand are coupled in the complex, was always unfavorable to binding. Moreover, it was found to be very variable across PDZ domains, even for complexes involving the same PDZ domain but different peptides. But when comparing complexes involving the same PDZ domain, the configurational entropy contribution did not usually alter the binding preferences set by the nonentropic free energy component (corresponding to the sum of non-polar and electrostatic contributions). Finally, the evaluation of the various configurational entropy contributions and adaptation free energies revealed several remarkable features about the events that make up the binding reaction. Notably, we found that upon binding all peptide ligands underwent significant ordering (loss of configurational entropy), but while an increase in configurational order was also observed for the majority of the PDZ domains; in 5 out of the 12 complexes, the PDZ domains were as ordered or less ordered in the bound state than in the free (apo) state.
Based on these findings we argue that the combined trends observed for the non-polar, electrostatic and configurational entropy contributions are poised to sustain the promiscuous interactions in which PDZ domains engage. Furthermore, it is proposed here that the remarkable variability in the degree to which the dynamics of the peptide and the cognate PDZ domain are coupled in the complex, as well as the varied ordering response of PDZ domains, suggest that entropic contributions could play a role in determining the specificity of the interactions between the PDZ domain and its target ligand or of the bound PDZ/peptide ligand towards a downstream effector.
MATERIALS AND METHODS
Molecular Systems
The PDZ domains selected for this study are listed in Table 1. For each domain, independent molecular dynamics (MD) simulations were performed for the apo (without a bound peptide) and holo (in complex with a peptide) forms of the PDZ domain, and for the isolated peptide ligand. Thus, a total of 12 holo systems, 12 isolated peptide ligands and 8 apo systems were prepared for MD simulations. The starting coordinates for all systems were taken from known 3D-structures of PDZ domains deposited in the Protein Databank 29, and subjected to a few modifications as detailed below. All 3D-structures were obtained from X-ray diffraction experiments except for Erbin 1N7T 30, which was a NMR structure (model 2 was used, as it is considered by the authors to be the “best representative structure” in the ensemble).
Table 1.
PDZ domains used for MD simulations.
| Protein | PDZ | Class | PDB code | Residue Ids | Ligand Length | Ligand Sequencea |
|---|---|---|---|---|---|---|
| NHERF |
PDZ1 |
Apo | 1G9O93 | A:10−94 | ||
| I | 1GQ518 | A:10−94/A:95−99 | 5 | -EDSFL (`a' pep.) | ||
| I | 1GQ418 | A:10−94/A:95−99 | 5 | -NDSLL (`b' pep.) | ||
| I |
1I9233 |
A:10−94/A:95−99 |
5 |
-QDTRL (`c' pep.) |
||
| PSD-95 |
PDZ3 |
Apo | 1BFE3 | A:306−415 | ||
| I |
1BE93 |
A:306−415/B:5−9 |
5 |
-KQTSV |
||
| Dishevelle d |
Apo | 1L6O32 | A:254−340 | |||
| |
I |
1L6O32 |
A:254−340/D:1−8 |
8 |
-SLKLMTTV |
|
| Shankb |
Apo | 1Q3O34 | A:584−686 | |||
| |
I |
1Q3P34 |
A:584−686/C:1−6 |
6 |
-EAQTRL |
|
| Syntenin |
PDZ2 |
Apo | 1NTE21 | A:197−270 | ||
| I | 1OBX21 | A:197−270/B:5−8 | 4 | -(ETLE)DSVF | ||
| II |
1OBY21 |
B:197−270/Q:1−6 |
6 |
-TNEFYA |
||
| Erbin |
Apo | 1MFG20 | A:1280−1367 | |||
| I | 1N7T30 | model 2 A:12−99/B:301−307 | 7 | -TGWETWV | ||
| |
II |
1MFG20 |
A:1280−1367/B:1247−1255 |
9 |
-EYLGLDVPV |
|
| GRIP |
PDZ6 |
Apo | 1N7E94 | A:668−753 | ||
| II |
1N7F94 |
A:668−753/B:1−8 |
8 |
-ATVRTYSC |
||
| Inad | PDZ1 | Apo | 1IHJ.31 | A:12−105 | ||
| II | 1IHJ.31 | A:12−105/D:3−7 | 5 | -(GK)TEFCA |
Residues in parenthesis are disordered in the crystal structure and were not included in the MD simulations.
The coordinates of residues 602 to 621 in the holo structure were taken from the crystal structure of the apo form of Shank (PDB code: 1Q3O), see “Molecular Systems” subsection in Materials and Methods.
When the sequence-length of the apo and holo forms differed in the crystal structures, a few residues at the N-and/or C-termini of the PDZ domains were deleted in order to maintain the same sequence in both forms. The simulated chains segments are defined in Table 1 for each system.
For the Erbin 20, Inad 31 and Dishevelled 32 PDZ domains, no apo structure was known; therefore, the starting structure for the apo simulations was built from the corresponding holo structure by deletion of the peptide. The three crystal structures of the NHERF PDZ domain used in this study contain a non-natural C-terminus which corresponds to the C-terminus of a known interacting protein 18, 33. This C-terminus is bound to the neighboring PDZ molecule in the crystal, thereby mimicking a peptide/PDZ domain interaction. Thus, the holo starting structures for the NHERF PDZ domains were reconstructed from the crystal symmetry by manually excising the peptide ligand from the C-terminus of a neighboring PDZ domain. In the Shank PDZ domain 34, the coordinates of residues 610 to 614, located in the βB-βC loop, are missing in the crystal structure of the holo form. In order to build the coordinates for these missing residues, the apo and holo forms of Shank were superimposed and residues 602 to 621 from the apo form were incorporated in the initial holo structure. Since the structure of the βB-βC loop differs in the apo and holo forms, residues flanking both sides of the missing segment were incorporated to include at least one structurally overlapping residue. Minimization and equilibration (see next section) were performed with positional restraints on the rest of the molecule in order to relax the resulting holo structure.
Finally, the starting structures for the simulations of the peptide ligands were extracted from the 3D-structure of the complexes. A charged ammonium group (NH +3) was added at the N-terminus of all peptide ligands in simulations of complexes and peptides alone. Note that, although the N-termini segments of some peptide ligands were disordered in the crystal structure, the coordinates for these missing residues were not reconstituted. This was the case for Syntenin's 1OBX 21 and Inad's 1IHJ 31, in which the coordinates of four and two residues, respectively, are missing. In order to understand whether the presence of the ammonium group could affect our analyses, we performed a control simulation on the Syntenin’s 1OBX complexed with a peptide capped by a neutral acetyl group instead of the charged ammonium group. We found that the resulting trajectory and the calculated energies were nearly identical to the simulation with the ammonium group (data not shown).
Molecular Dynamics Simulations
All MD simulations were performed with the GROMACS simulation package 35, 36 using the OPLS all-atom force-field 37. Each protein system was immersed in a pre-equilibrated cubic box of simple point-charge (SPC) water molecules 38. The distance between the edge of the box and any protein atom was at least 0.8 nm. When present, crystallographic waters were also included in the initial protein system. Sodium or chlorine counter-ions were added to neutralize the systems when necessary. All MD simulations were performed using periodic boundary conditions in the isobaric-isotherm ensemble, at 300 K and 1 bar. The temperature and the pressure were maintained using the Berendsen algorithm 39 with coupling constants of τT =0.1 ps and τP =1 ps for the temperature and pressure, respectively. Twin-range non-bonded cutoffs of 0.9 and 1.2 nm were used for the Lennard-Jones potentials. Electrostatic interactions were calculated using the Particle-Mesh Ewald (PME) summation method 40, 41 with a cutoff of 0.9 nm in the direct space. The pair-lists were updated every ten steps. The Lincs algorithm 42 was used to constrain the bond-lengths and bond-angles between atoms, thus allowing an integration time-step of 2 fs.
Initially, all heavy atoms were restrained to their crystallographic positions using a harmonic potential (force constant equal to 1000 kJ/mol/nm2), while surrounding water molecules were first minimized and then subjected to 50 ps of MD simulations (NPT, 300 K, 1 bar). Then, the resulting system was energy minimized, without any restraints, and the MD simulations were carried out for 20 or 25 ns depending on the equilibration time (see Results).
In the case of Shank (holo structure only), in order to relax and equilibrate the coordinates for residues 602 to 621 that had been manually incorporated (see previous section), the 50 ps restrained MD run was decomposed into five 10 ps-long restrained MD runs in which the restraining force constant for the heavy atoms in residues 602 to 621 was reduced by 250 kJ/mol/nm2 in each restrained MD run (initially set at 1000 kJ/molnm2 in the first run) while keeping the restraining force constant at 1000 kJ/mol/nm2 on the remaining heavy atoms.
Binding Free Energy
Binding free energies were approximated using the MM/PBSA approach 27, 43-47. The MM/PBSA method is an efficient way to evaluate the binding free energy of a complex from a classic MD simulation in explicit water. It has been applied to many different systems, including other protein recognition domains (e.g. the SH3 domains 48), and the affinities derived from the method have been compared successfully to experimental values 43, 49. A variant of this method, termed MM/GBSA, in which the implicit Generalized Born (GB) solvent model replaces the PB calculation, has been introduced recently 50.
In the MM/PBSA approach, the binding free energy, ΔGb , associated with the binding of a PDZ domain (P) to its cognate peptide ligand (L) to form a protein/ligand complex (P::L) is written:
| (1) |
Where < GMMPBSA > is an approximation of the free energy of a species in solution given by:
| (2) |
with < EMM >, the molecular mechanical energy of the species in vacuum averaged over snapshot structures extracted from a molecular dynamics trajectory; and , the non-polar and electrostatic contributions to the solvation free energy of the species also computed as averages over snapshot structures extracted from a molecular dynamics trajectory; and S , the entropy of the molecular species in vacuum (see “Computational Details” for estimate of the entropy).
Adaptation Free Energy
The adaptation free energy of a given molecule, either a PDZ domain or a peptide ligand, was defined as the difference in free energy between the bound (holo) and free (apo) states of that molecule 27, 28.Thus, for a given PDZ domain, the adaptation free energy associated with its binding reaction in aqueous solution was defined as:
| (3) |
and similarly for the peptide ligand:
| (4) |
Computational Details
Analysis of the results from the MD simulations was carried out with various algorithms implemented in the program METAPHORE (in-house software). All analyses were performed using the last 15 ns of the equilibrated trajectories. Equilibration was evaluated from the time-evolution of the radius of gyration and the root-mean-square deviation (RMSD) of the structures from their initial configuration.
Binding and adaptation free energy
All contributions to the free energy of binding and adaptation, with the exception of the corresponding entropy contributions, were calculated as averages of instantaneous values computed for snapshot structures extracted from the MD trajectories. The snapshot structures were taken every 10 ps over the last 15 ns of the trajectory (1500 structures for each molecular system: protein, ligand or protein/ligand complex).
Contributions to < EMM > were calculated using the potential energy terms of the OPLS force-field as implemented in the GROMACS package. The van der Waals, Evdw , and Coulomb, Ecoul , energies were calculated without periodic boundary conditions or cutoff for long-range interactions.
The solvation free energy terms were computed following the MM/PBSA approach. For each structure, the non-polar component of the solvation free energy ΔGnpsol was taken to be linearly dependent on the solvent accessible surface area, A , of the solute 51:
| (5) |
with γ=0.0054 kcal/mol and b=0.92 kcal/mol 27, 51. The solvent accessible surface area of the solute molecules was calculated using the MSMS program 52. The PARSE radii were used to define the atomic radii of the solutes, and the radius of the probe sphere was taken as 1.4 Å to be consistent with the electrostatic part of the solvation free energies (see below).
The electrostatic component of the solvation free energy, , was calculated with the program Delphi 53, 54, which solves the Poisson-Boltzmann equation numerically for a set of fixed charges in a cavity. We used the PARSE parameter set 27, 51 for the radii of the solute atoms used to define the solute cavity; the atomic charges were taken from the OPLS force-field (to be consistent with the calculation of Ecoul ). The interior dielectric constant for the protein was set to εi=4. The exterior dielectric constant was set to εsol=80 for water, and the dielectric boundary was calculated using a spherical probe with a 1.4 Å radius. The grid was chosen with 3 points per Å and the solute molecule occupied 80% of the box.
Configurational entropy
Only the configurational part of the entropy was included in the entropic contribution to the free energy. Thus, the entropic changes associated with binding and adaptation were calculated as for the binding, and and for the adaptation of the protein (P) and the ligand (L), respectively.
The configurational entropy of each system (protein, ligand, and protein/ligand complex) was estimated using the quasi-harmonic analysis 55, 56. This method has been used previously to evaluate the entropy of peptides and proteins 57. The quasi-harmonic analysis yields an upper bound approximation, Sho, to the real configurational entropy, S, of a molecule based on the all-atom covariance matrix that can be calculated from an MD trajectory. For a molecule of N atoms, Sho is given by the following equation:
| (6) |
where ,h is the Planck constant, kB is the Boltzmann constant, T is the temperature and λi are the eigenvalues of the all-atom mass-weighted covariance matrix of fluctuations (σij )ij,where .
Finally, when calculating the entropic contribution to the free energy of binding, − TΔSb , the structures used to compute the covariance matrix of fluctuations for each individual system (protein, ligand, protein/ligand complex) were all extracted from the MD trajectory of the corresponding protein/ligand complex (similarly as the MM/PBSA binding free energy calculations). This calculation does not take into account the loss or gain of self-entropy associated with the rotational, translational and conformational changes of each component upon binding. However, it yields the configurational entropy due to the motions of the peptide and the PDZ domain with respect to each other, and to the cross-terms from correlated motions between the PDZ domain and the peptide. Thus, a high entropic cost of binding indicates a high degree of coupling between the dynamics of the PDZ domain and the bound peptide.
RESULTS
MM/PBSA
The components of the binding free energies for the twelve complexes were calculated with the MM/PBSA method associated with a quasi-harmonic approximation for the configurational entropy. The snapshots structures used for these calculations were extracted from the equilibrated portions of Molecular Dynamics (MD) trajectories carried out in the presence of explicit solvent molecules. MD simulations were computed for 12 holo PDZ domains, 12 unbound peptide ligands and 8 apo PDZ domains, listed in Table 1. All simulations were performed using the same conditions and with the same protocol (see Materials and Methods).
The equilibration of the MD trajectories was monitored from the convergence of the plots of the radius of gyration as a function of time and the time dependence of the root-mean square deviation of Cα carbon atoms (Cα-RMSD) from their initial configuration. The equilibration time varied among systems but it was particularly slow, ranging from 3 to 10 ns, for the apo PDZ domains of Inad and Dishevelled for which the starting structures had been extracted from the crystal structure of the corresponding holo PDZ domain. These two apo systems were therefore simulated for 25 ns instead of 20 ns for all the other systems, in order to ensure an equilibrated portion of the MD trajectory of at least 15 ns long. All analyses were thus performed on the last 15 nanoseconds of the trajectories.
It should be noted that long simulations are rarely used to evaluate the binding free energy using surface area continuum solvent methods. To our knowledge, only one case has been reported of a MM/GBSA (with a solvation term calculated using Generalized Born and Surface Area) analysis over a 10 ns window of a 12 ns MD simulation of a protein-protein complex 50. That study showed that averaging over such a long time-window was necessary because of the large fluctuations observed in the computed free energies. We have performed similar convergence tests, and found in agreement with this previous study that long simulations were necessary to ensure better convergence of the calculated free energy components and that averages obtained over a short time-windows are unreliable (data not shown). We also found that long simulations were necessary to obtain sufficient convergence of the entropic part of the binding free energies.
For each system, in order to improve the precision of the computed contributions to the binding free energy, all the snapshot structures for the protein, the ligand and the protein/ligand complex were extracted from a single MD trajectory of the corresponding protein/ligand complex. This procedure provides only an approximation to the binding free energy because it does not take into account the possible conformational changes of the PDZ domain or the peptide in the process of binding. But we found that when snapshot structures were taken from separate trajectories, the standard deviation and the average values for the various free energy contributions had the same order of magnitude, thereby hampering the interpretation of the results. This is consistent with a previous study 58 which showed that taking separate trajectories of the components to evaluate binding free energies led to very large standard deviations on the averages.
Binding free energies of the twelve complexes calculated with MM/PBSA are presented in Table 2. While it is well-known that the binding free energies calculated with MM/PBSA do not reproduce experimental values accurately, MM/PBSA binding free energies have been shown to correlate with experiments well 43, 49. Although our purpose here is to use MM/PBSA calculations to reveal the forces governing binding through a decomposition of binding free energies, rather than to rank the different complexes, the ranking of binding free energies was tested for the Erbin and Syntenin systems for which the affinities were known experimentally.
Table 2.
Binding free energies of PDZ domains with their target peptides in kcal/mol calculated with the MM/PBSA methoda.
| Protein | ΔEvdw | ΔEcoul | ΔΔGsolele | ΔΔGsolnp | ΔGbeleb | ΔGbnpc | -TΔSbc | ΔGbe |
|---|---|---|---|---|---|---|---|---|
| NHERF a | −43.2 (4.3) | −56.6 (7.4) | 56.6 (6.5) | −5.9 (0.4) | 0.0 (1.7) | −49.1 (4.3) | 9 (2) | −40.1 (4.9) |
| NHERF b | −42.2 (4.0) | −36.4 (4.3) | 38.1 (3.3) | −5.7 (0.9) | 1.7 (1.7) | −47.9 (4.2) | 7 (3) | −39.1 (6.4) |
| NHERF c |
−43.8 (4.3) |
−40.2 (7.0) |
42.7 (6.1) |
−6.2 (0.4) |
2.5 (1.7) |
−50.0 (4.4) |
14 (2) |
−33.6 (5.6) |
| PSD-95 |
−42.1 (4.1) |
−87.1 (14.9) |
87.3 (13.1) |
−5.8 (0.2) |
0.2 (2.5) |
−47.9 (4.1) |
9 (3) |
−38.8 (6.2) |
| Dishevelle d |
−61.7 (4.3) |
−65.5 (9.2) |
68.2 (9.0) |
−7.5 (0.3) |
2.7 (1.5) |
−69.2 (4.3) |
22 (3) |
−44.4 (7.0) |
| Shank |
−36.4 (4.8) |
−38.4 (9.3) |
39.5 (8.1) |
−5.6 (1.0) |
1.1 (1.9) |
−42.0 (4.9) |
45 (2) |
+4.1 (5.8) |
| Syntenin I | −35.5 (4.5) | −37.3 (8.1) | 38.6 (6.5) | −5.0 (0.9) | 1.3 (2.2) | −40.4 (4.5) | 8 (1) | −31.1 (3.9) |
| Syntenin II |
−38.7 (3.8) |
−25.4 (3.8) |
27.4 (3.0) |
−5.0 (0.1) |
2.0 (1.4) |
−43.7 (3.8) |
5 (3) |
−36.7 (5.5) |
| Erbin I | −62.4 (5.1) | −39.8 (11.5) | 43.6 (9.1) | −7.4 (0.3) | 3.9 (3.1) | −69.8 (5.1) | 12 (2) | −53.9 (6.9) |
| Erbin II |
−50.9 (6.4) |
−44.3 (5.5) |
48.2 (4.9) |
−7.0 (1.0) |
3.9 (2.4) |
−57.9 (6.6) |
23 (2) |
−31.0 (7.4) |
| GRIP |
−46.2 (4.6) |
−60.0 (6.1) |
60.7 (5.3) |
−6.9 (0.5) |
0.8 (1.7) |
−53.1 (4.6) |
24 (4) |
−28.3 (7.9) |
| Inad |
−33.0 (3.7) |
−29.6 (3.8) |
32.2 (3.2) |
−4.5 (1.0) |
2.5 (1.6) |
−37.5 (3.8) |
5 (2) |
−30.0 (5.2) |
| Average | −44.7 (9.5) | −46.7 (17.5) | 48.6 (17.0) | −6.0 (1.0) | 1.9 (1.3) | −50.7 (10.4) | 15 (12) | −33.6 (13.9) |
Standard deviations of averages are shown in parentheses. The last line is the average of each column and its corresponding standard deviation.
ΔGbele =ΔEcoul + ΔΔGsolele.
ΔGbnp =ΔEvdw + ΔΔGsolnp.
(d) −TΔSb calculated with the quasi-harmonic approximation on the complex trajectory.
ΔGb = ΔGbelec + ΔGbnp −TΔS.
In agreement with the experimental finding that the Erbin PDZ domain binds class I peptides with higher affinity than class II ones 20, our MM/PBSA calculations showed that the binding free energy of the Erbin PDZ domain with the class I peptide was 23 kcal/mol more favorable than with the class II peptide. The exaggerated magnitude of this difference is obviously due to the approximations in the MM/PBSA method, but the trend is reassuringly correct. We also found that the Syntenin PDZ domain had a binding free energy that was more favorable by 5.5 kcal/mol for the class II peptide than for the class I peptide. This is also consistent with experiments 59 that show that the PDZ2 domain of Syntenin binds slightly better to the class I than to the class II peptide. Together, these results show that the MM/PBSA method is capable of reproducing the important preference trends in the comparison of class I/II binding.
Direct comparison of the other results with experiment is not straightforward, because, as mentioned in the introduction, few experimental binding affinities are currently available for PDZ domain complexes. Although some experimental binding affinities are in the literature, it is often not possible to compare them among themselves, because the assays are done under very different conditions. Moreover, comparison with our calculations would require the peptide sequences used in the binding assays to match those in our simulations which were imposed by the available crystal structures. Nevertheless, experimental data are available for some cognate systems. For example, for NHERF there are three different binding experiments showing that the NHERF PDZ domain binds strongly to the three peptides (a, b, and c), but slightly better to the b-peptide (Kd=18nM, ref:60) than to the a-peptide (Kd=26nM, ref:61), and that both a- and b-peptides bind better than the c-peptide (Kd=48nM, ref:62). In slight disagreement with the experiments, we found that the NHERF PDZ domain binds equally well to the a-peptide and to the b-peptide, but we agree with the experiments in finding the c-peptide to have the lowest affinity (6−7 kcal/mol less than the a- and b-peptides) for the NHERF PDZ domain. For PSD-95, binding assays were conducted 63 with the CRIPT peptide, but with a shorter or a longer sequence than the one we simulated (Kd=2µM for -YKQTSV and Kd=300µM for -QTSV). Experiments on the Dishevelled PDZ domain showed that its complex with the Dapper peptide, with a longer sequence (-SGSLKLMTTV) than the one in our simulations, has a dissociation constant Kd=16µM 64. Unfortunately, to our knowledge, no binding data are available for the Shank PDZ domain in complex with the GKAP peptide, for the GRIP PDZ domain with liprin alpha, or for the Inad PDZ in complex with NorpA. Our predictions of relative PDZ domain binding affinities from the computational study with MM/PBSA are currently the only quantitative information available for these systems.
The case of the Shank PDZ domain is noteworthy, because the total calculated binding free energy of the complex is slightly positive (+4.1 kcal/mol), but the complex exists in the crystal structure. It becomes clear from the energy decomposition (cf. Table 2) that the calculated unfavorable binding free energy is entirely due to a very high entropic cost (+45 kcal/mol), which is by far the largest entropic cost of all the studied systems. One possible explanation is that this effect is due to the modeling procedure required to prepare the starting structure for this particular system: in the crystal structure of the Shank complex residues are missing in the βB-βC loop and these residues were modeled based on the βB-βC loop of the apo form (see Methods). This procedure may have been responsible for an uncommon dynamic behavior of the complex, resulting in an exceptionally high entropic cost. However, another more intriguing explanation could be that this unfavorable or very small computed binding affinity reflects a true lack of affinity of the isolated/monomeric Shank PDZ domain, for its cognate peptide-ligand. This would be consistent with the recent suggestion 34 that the functional unit 15 of the Shank PDZ domain is a dimer rather than a monomer (the crystallographic unit does contain a dimer of Shank PDZ domains and we only simulated an isolated monomer).
PDZ domain binding interactions
One of the advantages of the MM/PBSA approach is that it enables a decomposition of the free energy into identifiable contributions. Thus, electrostatic(), non-polar or hydrophobic (), and entropic ( − TΔSb ) contributions were analyzed separately (Table 2).
Non-polar contributions
The decomposition (Table 2) of the binding free energies into electrostatic, non-polar and entropic components showed that non-polar contributions, and more specifically intermolecular van der Waals forces, dominate peptide/PDZ domain interactions. The absolute value of the non-polar component represented on average 77% of the sum of the absolute values of the three components (electrostatic, non-polar and entropy). The average value of ΔGnpb was −50.7 kcal/mol with a standard deviation of 10.4 kcal/mol. The highly favorable non-polar binding free energy probably reflects the great number of favorable interactions from the various hydrophobic pockets that cover the surface of the binding site in the PDZ domains (cf. Figure 1a).
Electrostatic contributions
In contrast to the non-polar components, the electrostatic interactions were found to make a very small contribution to the binding free energy. Values of ΔGeleb were on average of +1.9 kcal/mol with a standard error of 1.3 kcal/mol. They ranged from 0 kcal/mol for NHERF to about +4 kcal/mol for class I and II Erbin. The weakness of electrostatic interactions was surprising because the interaction between the conserved carboxylate binding loop with the C-terminal carboxyl group in the peptide ligand is one of the hallmarks of peptide/PDZ domain recognition, and also because the peptide ligands also comprise charged and polar residues that in some cases make distinct hydrogen-bonding interactions with residues in the PDZ domains receptor. However, decomposition of the free electrostatic contribution into its coulombic ΔEcoul and solvation ΔGelesol components showed that indeed the direct intermolecular electrostatic interactions were always favorable to the binding but their contributions could not compensate the large desolvation penalties associated with the binding event, thereby always leading to an unfavorable ΔGeleb . This compensation phenomenon has been previously observed in several studies of protein/ligand interactions in solution 45, 65-67
It should be noted that the electrostatic contributions were computed assuming a value of εi = 4 for the dielectric constant of the protein interior. This value is commonly used for proteins in this kind of study 45, 49, 68, 69. However, there is no consensus on what the value of the dielectric constant for proteins should be: εi values greater than 1 are typically used to include polarization effects (εi = 2) and/or structural reorganization of the protein (εi = 4) implicitly 70. To establish the effect of the value for the interior dielectric constant on the relative contribution of the electrostatic component to the total binding free energy, different (εi = 1, 2, 4, 10 and 20) interior dielectric constant values were tested. These tests showed that the absolute value of the electrostatic binding free energy is roughly inversely proportional to the value of the dielectric constant (data not shown) in agreement with a previous report 71. However, we found that using a different dielectric constant did not affect significantly our result of a relative small contribution of electrostatic interactions to binding free energies.
Entropic contributions
There is no explicit method to calculate the entropy contribution to the binding free energy in the MM/PBSA approach. This contribution is sometimes neglected 72, calculated with a normal mode analysis on a few minimized structures extracted from the simulations 43, 48-50, or computed using a quasi-harmonic approximation 50, 73. Because normal mode analysis is computationally very costly when used on a large number of configurations, we chose to use a quasi-harmonic analysis 55, 56 to calculate the configurational part of the entropy contribution to the free energy of binding, as described in Materials and Methods. It should be mentioned that another entropy approximation, the Schlitter entropy 74, which is also based on the assumption of quasi-harmonic behavior, has been extensively tested and used to evaluate the configurational entropy of peptides and proteins 75-77. When the quasi-harmonic approximation holds, the Schlitter entropy is an upper bound approximation to Sho and is considered a less accurate approximation to the real configurational entropy than the quasi-harmonic entropy 55.
The principal difficulty when evaluating the configurational entropy based on the quasi-harmonic approximation is that the covariance matrix of fluctuations needed for computing the entropy converges very slowly 78. A previous MM/GBSA study reported that convergence was not achieved even when using 10 ns-long simulations 50. In testing the approach for convergence by computing the entropy on cumulative blocks starting at 5 ns of MD, we found that the entropy of each molecule was not yet converged even after 20 ns of simulation. This is illustrated in Figure 2a for the apo and holo PDZ domain simulations of NHERF. However, we found that, despite the lack of convergence of the configurational entropy calculated for the individual molecules, differences taken between individual configurational entropies were sufficiently converged. The convergence of the entropic contribution to the binding free energy, , is illustrated in Figure 2b, which represents a plot of −TΔSb on cumulative blocks as a function of the length of the time-interval. We chose, therefore, to use the value of such entropy differences calculated from the last 15 ns of the trajectories (the last point on the graphs) as the configurational entropy difference, and evaluated the error on this value as the difference between the value calculated from the last 15 ns (the time-window from 5 to 20 ns of the trajectory, or 10−25 ns for the longer simulations) and the value calculated in a time-window of 10 ns (from 5 to 15 ns of the trajectory). This error is shown in parentheses in the entropy column of Tables 2 to 4.
Figure 2.
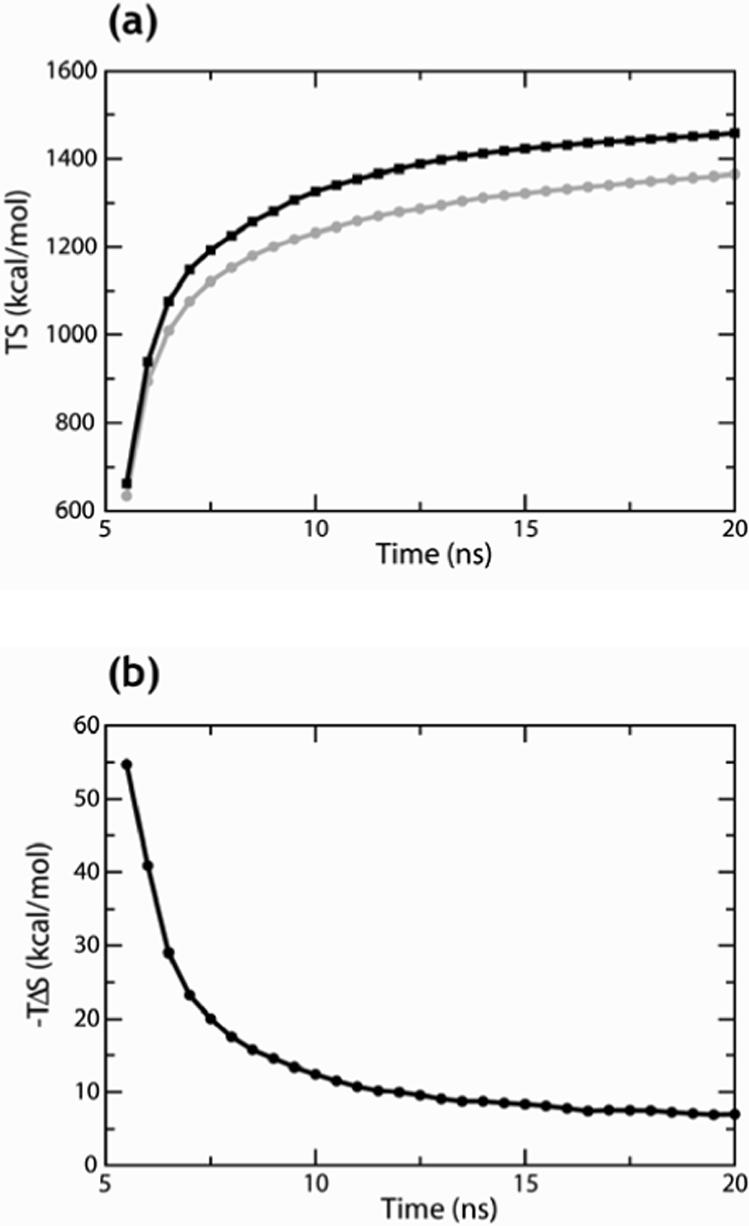
Representation of the convergence of entropy calculations using the quasi-harmonic approximation. (a) Entropy (TS) of the NHERF PDZ domain apo (black line) and holo in complex with the ‘b’ peptide (grey line) calculated on cumulative blocks, starting at 5 ns of MD simulations on intervals increasing by 0.5 ns. (b) Entropy part of the binding free energy (see Methods) calculated on cumulative blocks for the NHERF PDZ domain in complex with the ‘b’ peptide.
Table 4.
Adaptation free energy of the PDZ domains upon binding: ΔGadaptP in kcal/mola.
| Protein | ΔEintb | ΔGelec | ΔGnpd | −TΔSadapte | ΔG*adaptf | ΔGadaptg |
|---|---|---|---|---|---|---|
| NHERF a | −6.0 (41.5) | 4.0 (9.1) | 1.4 (32.2) | 95 (8) | −0.6 (42.3) | 94.4 (50.3) |
| NHERF b | −4.2 (40.5) | 3.3 (9.4) | −2.1 (34.0) | 85(3) | −3.0 (41.9) | 82.0 (44.9) |
| NHERF c |
−14.8 (41.3) |
3.1 (10.2) |
10.2 (31.8) |
95 (3) |
−1.5 (42.1) |
93.5 (45.1) |
| PSD-95 |
30.0 (47.1) |
−1.2 (10.4) |
7.5 (35.7) |
20 (10) |
36.3 (47.2) |
56.3 (57.2) |
| Dishevelle d |
−15.8 (41.2) |
−1.2 (8.2) |
44.3 (30.7) |
−17 (5) |
27.3 (41.1) |
10.3 (46.1) |
| Shank |
8.2 (44.6) |
0.1 (8.9) |
5.8 (32.3) |
−1 (3) |
14.1 (44.7) |
13.1 (47.7) |
| Syntenin I | 7.9 (38.0) | −0.6 (7.2) | 11.1 (26.7) | −15 (7) | 18.4 (36.8) | 3.4 (43.8) |
| Syntenin II |
−2.4 (37.2) |
3.6 (7.0) |
4.2 (26.8) |
15 (2) |
5.3 (36.8) |
20.3 (38.8) |
| Erbin I | 17.2 (42.0) | 6.2 (16.4) | 4.7 (31.3) | 4 (2) | 28.0 (45.2) | 32.0 (47.2) |
| Erbin II |
2.0 (41.4) |
3.3 (9.8) |
6.7 (32.2) |
0 (11) |
12.0 (41.9) |
12.0 (52.9) |
| GRIP |
10.0 (40.8) |
−3.1 (9.2) |
17.7 (32.4) |
10 (10) |
24.7 (43.2) |
34.7 (53.2) |
| Inad |
−0.8 (42.6) |
−0.2 (10.7) |
8.5 (34.2) |
15 (8) |
7.6 (43.6) |
22.6 (51.6) |
| Average | 2.6 (13.1) | 1.4 (2.8) | 10.0 (11.9) | 26 (42) | 14.1 (13.0) | 39.6 (33.5) |
Standard deviations of averages are shown in parentheses. The last line is the average of each column and its corresponding standard deviation.
Difference in internal energy (sum of the bond, angle and dihedral energies).
Difference in electrostatic free energy (sum of the intra-molecular electrostatic energy and the electrostatic solvation free energy).
Difference in non-polar free energy (sum of the van der Waals energy and the non-polar part of the solvation free energy).
−TΔSadaptP ≈ −T(SconfP_holo — SconfP_apo) where SconfP_holo and SconfP_apo are calculated with the quasi-harmonic approximation, respectively from the holo and the apo simulations. The error is calculated as |-TΔS(5−20ns)+TΔS(5−15ns)|.
ΔG*adapt = ΔEint+ ΔGele + ΔGnp.
ΔGadapt = ΔG*adapt −TΔSadapt.
Entropy convergence was tested further by performing multiple simulations on two systems: the PSD-95 complex and the Syntenin class I complex. These systems are the largest (PSD-95) and the smallest (Syntenin class I) complexes in total number of atoms. Four additional 20 ns MD simulations (one for PSD-95 and three for Syntenin) were performed with different seeds. For the PSD-95 complex the configurational binding entropy −TΔSb was 11+/−3 kcal/mol for the additional simulation and 9+/−3 kcal/mol for the simulation presented in Table 2. For the Syntenin class I complex the configurational binding entropies were 8+/−1, 10+/−2, and 9+/−1 kcal/mol for the additional simulations and 8+/−1 kcal/mol for the simulation presented in Table 2. These values are comparable within error and thus indicate that the entropy calculation is not simulation dependent. We conclude that the calculated differences in the values of configurational binding entropies for the various PDZ systems we study are not sampling artifacts.
It is important to note however that the quasi-harmonic approximation holds only in the case of a multivariate Gaussian probability distribution. Thus, when a system transits from a stable conformation (free energy well) to another stable conformation (free energy well) the quasi-harmonic approximation will overestimate the configurational entropy. These transitions can also lead to an overestimation of the configurational binding entropy. For example, we observed in the case of GRIP that a sudden change of conformation of the peptide interfered with the convergence of the configurational entropy difference. But, if the transition phases are removed from the trajectory (by cutting the trajectory into intervals during which the molecules are globally stable) the quasi-harmonic approximation holds and the convergence of the configurational entropy difference is restored.
The results in Table 2 show that the configurational entropy part is always unfavorable to binding. This is not unexpected because the entropies of the PDZ domain and the ligand, as well as the entropy of the complex, were calculated from a single simulation of the complex, and thus the entropy of the protein/ligand complex is by definition smaller than the sum of the entropies of its components, leading to an unfavorable entropy contribution to binding. In fact, as stated in the Methods section, the configurational entropy contribution to binding calculated with this protocol represents only the magnitude of correlated motions between the PDZ domain and the peptide ligand. And thus, our results indicate that in the bound state, the dynamics of the peptide and PDZ domain are generally tightly coupled.
However the magnitude of this dynamical coupling is very variable, as indicated by the variation in the configurational entropy contributions, −TΔSb, to the binding free energies in Table 2. Configurational entropy contributions ranged from +5 or +10 kcal/mol for Inad, class I and II Syntenin, PSD-95 and NHERF (with a- and b-peptides), to +45 kcal/mol for Shank. Overall, the standard deviation for −TΔSb was of 12 kcal/mol. This standard deviation is as large as that of the non-polar contribution (10.4 kcal/mol) and could suggest that the configurational entropy contributions could counterbalance non-polar contributions in determining the specificity peptide/PDZ domain interactions. But this counterbalancing effect was only observed when analyzing the energetics of NHERF bound to peptide ‘c’ vs. peptide ‘b’. In these complexes, the entropic contribution −TΔSb was twice as large (and unfavorable) for the ‘c’ peptide (+14 kcal/mol) than for the ‘b’ peptide (+7 kcal/mol). And this lead to a weaker affinity between NHERF and peptide ‘c’ (−33.6 kcal/mol) than between NHERF and peptide ‘b’ (−39.1 kcal/mol) although the non-entropic contribution () to the binding free energy was slightly more favorable in the complex of NHERF with peptide ‘c’ (−47.5 kcal/mol) than with peptide ‘b’ (−46.2 kcal/mol). Nevertheless, the entropic contributions were remarkably variable. Notably, it is noteworthy that the entropic contributions, −TΔSb, for peptides binding to the same PDZ domain were twice or almost twice as large in several complexes, including NHERF/peptide ‘c’ vs. NHERF/peptide ‘a’ or ‘b’, Syntenin/class I vs. Syntenin/class II, and Erbin/class II vs. Erbin/class I. This variability in the degree of coupling between the dynamics of the peptide and PDZ domain, while not influencing the affinity of the interaction (see above), is a property that could be exploited in interactions with downstream effectors.
In summary, the decomposition of binding free energies for the twelve different PDZ domains in complex with their target peptides indicated that non-polar interactions provided the largest unopposed contribution to the binding affinity. In contrast, electrostatic interactions, always unfavorable, did not contribute significantly to the binding affinity and entropic effects, always unfavorable to binding as well, did not counterbalance (with one exception) the magnitude of the affinity set by the non-polar interactions. However, the entropic effects were remarkable in their variability, notably when comparing distinct peptides bound to the same PDZ domain.
Adaptation free energies
In order to compare the free energy of the bound and unbound/free states of each molecule (peptide or PDZ domain) the free energies of the “free” state of the PDZ domain and of the “free” peptide were computed from MD trajectories obtained for each molecule individually. The free energies of the free states thus obtained were then subtracted from the already computed free energies of the bound state of each molecule (based on the MD trajectories of the complexes), and these differences were considered to represent “adaptation free energies” as presented previously elsewhere 27, 28. This sort of adaptation free energy incorporates some of the effects that are missing from the previous binding free energy calculations, which used structures extracted only from the protein/ligand complex trajectories.
The adaptation free energies for the PDZ domains,, and for the peptide ligands,, are reported in Tables 3 and 4, respectively. It should be noted that since the standard deviations associated with the adaptation free energies are very large, about 40−50 kcal/mol (the standard deviation of the free energy average for each simulation is about 20−25 kcal/mol), it was not possible to interpret these results precisely, but we could still identify some general features and compare the different PDZ domains. Notably, in order to distinguish between structural and dynamical features linked to the variations in adaptation free energy, the non-entropic ΔG*adapt and entropic −TΔSadapt contributions to the free energy of adaptation were analyzed separately. For the peptide ligands, the adaptation free energy was very unfavorable in all cases, ranging from approximately +21 kcal/mol in Inad to +85 kcal/mol in Erbin/class I (Table 3). Interestingly, the non entropic part of the adaptation free energy was negligible (+1.3 kcal/mol on average) in comparison to the entropic contribution (+51.3 kcal/mol on average). Thus, the cost of adaptation came almost exclusively from entropic contributions, indicating that ordering of the peptide within the binding site was a critical aspect of the binding event (from the peptide point of view).
Table 3.
Adaptation free energy of the peptides upon binding: ΔGadaptL in kcal/mola.
| Protein | ΔEintb | ΔGelec | ΔGnpd | −TΔSadapte | ΔG*adaptf | ΔGadaptg |
|---|---|---|---|---|---|---|
| NHERF a | 0.1 (11.6) | 0.5 (3.0) | 1.0 (7.3) | 57 (3) | 1.5 (11.7) | 58.5 (14.7) |
| NHERF b | −3.2 (11.1) | 1.2 (1.9) | −0.6 (5.8) | 59 (2) | −2.6 (10.8) | 56.4 (12.8) |
| NHERF c |
−5.8 (12.5) |
4.2 (2.1) |
−2.3 (7.0) |
32 (4) |
−3.9 (12.4) |
28.1 (16.4) |
| PSD-95 |
−3.3 (12.1) |
1.3 (2.3) |
1.8 (6.0) |
57 (2) |
−0.2 (11.7) |
56.8 (13.7) |
| Dishevelle d |
0.3 (14.7) |
0.8 (2.9) |
0.0 (8.0) |
70 (18) |
1.2 (14.6) |
71.2 (32.6) |
| Shank |
−2.2 (12.8) |
1.8 (2.7) |
−0.4 (7.7) |
25 (10) |
−0.8 (12.9) |
24.2 (22.9) |
| Syntenin I | 3.0 (10.6) | −0.3 (2.0) | 1.8 (5.5) | 30 (3) | 4.5 (10.1) | 34.5 (13.1) |
| Syntenin II |
3.7 (12.6) |
−2.6 (2.5) |
4.4 (6.9) |
63 (3) |
5.5 (12.5) |
68.5 (15.5) |
| Erbin I | 9.5 (12.4) | 0.5 (2.3) | 1.9 (7.4) | 73 (5) | 11.8 (12.7) | 84.8 (17.7) |
| Erbin II |
0.0 (13.8) |
0.9 (2.1) |
1.4 (9.2) |
55 (15) |
2.3 (14.4) |
57.3 (29.4) |
| GRIP |
−3.9 (13.8) |
−0.1 (2.3) |
1.6 (7.2) |
72 (1) |
−2.4 (13.5) |
69.6 (14.5) |
| Inad |
−1.1 (10.5) |
0.2 (1.5) |
−0.2 (5.6) |
22 (2) |
−1.1 (10.3) |
20.9 (12.3) |
| AVERAGE | −0.2 (4.1) | 0.7 (1.6) | 0.9 (1.7) | 51.3 (18.8) | 1.3 (4.3) | 52.6 (20.8) |
Standard deviations of averages are shown in parentheses. The last line is the average of each column and its corresponding standard deviation.
Difference in internal energy (sum of the bond, angle and dihedral energies).
Difference in electrostatic free energy (sum of the intra-molecular electrostatic energy and the electrostatic solvation free energy).
Difference in non-polar free energy (sum of the van der Waals energy and the non-polar part of the solvation free energy).
−TΔSadaptL ≈ −T(SconfL_bound - SconfL_free) where SconfL_bound and SconfL_free are calculated with the quasi-harmonic approximation, respectively from the complex and the free simulations. The error is calculated as |-TΔS[5−20ns] + TΔS[5−15ns]|.
ΔG*adapt = ΔEint + ΔGele + ΔGnp.
ΔGadapt= ΔG*-TΔSadapt.
For the PDZ domains, the total adaptation free energy was also always unfavorable (Table 4). and very variable among PDZ domains, with an average value of about +39.6 kcal/mol and a standard deviation of 33.5 kcal/mol over all systems. But the picture emerging from the decomposition of the adaptation free energy cost into entropic ( −TΔSadapt in Table 4) and non-entropic ( ΔG*adapt in Table 4) contributions was not as clear as for the peptide ligands: no general trend concerning the relative contribution of these two quantities ( ΔG*adapt vs. −TΔSadapt ) was readily apparent.
The values of the non-entropic part of the adaptation free energy for the PDZ domains, ( ΔG*adapt in Table 4) ranged from about 0 kcal/mol for the three NHERF PDZ domains, Inad and class II Syntenin, to +37 kcal/mol for the PDZ domain of PSD-95. These values indicate that some of the polar and non-polar internal interactions that stabilize the PDZ domain in the free state are lost in the bound state, leading to an unfavorable non-entropic free energy of adaptation, but for several PDZ domain complexes (5 out 12) these differences are only minor. Note that the non-entropic adaptation free energy cost did not correlate with the RMSD between the average structures (for the backbone atoms only) from the apo and holo simulations, a quantity that should reflect the degree of conformational change upon binding (data not shown). This lack of correlation suggests that, when present, the cost associated with the non-entropic part of the free energy of adaptation is probably related to subtle side-chain rearrangements, with concomitant packing and hydrogen-bonding or salt-bridge disruptions.
The values for the entropic part of the adaptation free energy for the PDZ domains ranged from −17 kcal/mol for Dishevelled to ∼90 kcal/mol for NHERF complexes. The limits of this wide range of values indicated not only that the degree of PDZ domain ordering upon binding was very variable, but that unlike what was observed for the peptides, the PDZ domains were not necessarily more ordered when bound than when free. Systems, such as the Erbin class I and class II and the Shank PDZ domains showed almost no entropic adaptation. But even more remarkable were systems such as the Syntenin class I and Dishevelled PDZ domains for which the binding event was associated with an entropic gain ( −TΔSadapt values of −15 and −17 kcal/mol, respectively) rather than an entropic cost. Overall, in 5 out of the 12 systems the holo state of the PDZ domain became less or equally ordered than the corresponding free/apo state. It is worth mentioning that this form of vibrational entropic gain represents a way to recover partially from the loss of rotational and translational degree of freedom associated with a binding event. Steinberg and Scheraga 79 first proposed to evaluate the magnitude of this entropic gain that arises from the creation of new internal/vibrational degrees of freedom in the complex. More recently, Tidor and Karplus 56 showed that these effects contribute −7.2 kcal/mol to the dimerization of insulin.
Finally, the contrasting behavior of the Syntenin PDZ domain when bound to class I and class II peptides is worth noting, since the computed values of −TΔSadapt indicate that upon binding the class II peptide the Syntenin PDZ domain becomes more ordered relative to its free state, but that upon binding the class I peptide the same Syntenin PDZ domain becomes less ordered. This behavior along with the remarkable variation in −TΔSadapt values is reminiscent of that observed in the previous section for the configurational entropy contribution and the class I/ class II pair in the Erbin PDZ domain, and it is again tempting to speculate that these variations in the entropic response to binding could play a biological role in the differential recognition by downstream effectors.
DISCUSSION
The set of complexes of PDZ domains with their target peptides used in this study includes a variety of same-class and inter-class pairs, so that sources of promiscuity or specificity in recognition could be expected to emerge from the comparisons of the various binding free energy contributions. We used a decomposition of the binding free energies, and calculations of adaptation free energies from molecular dynamics (MD) simulations to evaluate the relative contribution of various free energy components, namely the electrostatic, non-polar and configurational entropy components, in peptide/PDZ domain recognition.
The free energies of all molecules were calculated using the MM/PBSA method, combined with a quasi-harmonic approximation for the configurational entropy part. Statistically reliable averages for free energies were shown to require long simulations. Binding free energies were evaluated from a single trajectory of the peptide/PDZ domain complex, and the resulting absolute values often overestimated experimental affinities. This was done although using separate trajectories (from separate simulations of the PDZ domain and the peptide ligand alone, and of the complex) may seem a more appropriate way to evaluate binding free energies, as they would take into account the structural changes involved in binding. However, such a protocol led to very large standard errors.
The results we obtained from the single trajectory calculations reproduced correctly the experimental ranking of binding free energies, including the preference of the Erbin PDZ domain for the class I peptide, the preference of the Syntenin PDZ domain for the class II peptide, and the preference of the NHERF PDZ domain for the a- and b- peptides over the c-peptide. The paucity of experimental data available on affinities of PDZ domains complexes (see Results), and the need for comparisons of results from assays done under the same conditions, emphasize the importance of our computational study on binding free energies, and the results presented here.
Non-polar interactions dominate PDZ/peptide interactions
The decomposition of binding free energies into a non-polar part (sum of the van der Waals interactions and the non-polar part of the solvation binding free energy), an electrostatic part (sum of direct Coulomb interactions and electrostatic solvation binding free energy), and a configurational entropy part, showed that the non-polar contribution was the largest one, representing, on average, 77% of the total binding free energy. The dominance of non-polar interactions in PDZ/ligand binding is not surprising. PDZ domains interact mostly with hydrophobic ligands, and the typical PDZ domain binding pocket comprises many hydrophobic residues (Figure 1b). Non-polar interactions have been shown to dominate the thermodynamics of protein-ligand recognition for many ligand classes including small ligands 65, 80, peptides interacting with immune response proteins such as MHC class I 81, or other protein-protein interaction domains such as the SH3 domain 49, and even highly charged ligands such as RNA 28 or DNA molecules 82.
Electrostatic energies do not contribute significantly to PDZ/peptide interactions
In contrast, the results indicated a very small and unfavorable contribution of the electrostatic interactions (0 to +3 kcal/mol) to the binding free energy. This was somewhat surprising because each PDZ domain complex studied here, contains a bound peptide that carries a charged carboxylate ion, and this carboxylate ion is specifically recognized by the conserved GLGF sequence-motif present on each PDZ domain. Nevertheless, a number of studies have shown that electrostatic contributions often make small or unfavorable to the binding free energy even when the ligands contain charged groups 28, 82, 83.Generally, this relatively small or unfavorable contribution of electrostatic effects occurs because the direct intermolecular electrostatic interactions that are usually favorable cannot always compensate for the large desolvation penalties associated with ligand-binding 45, 49, 65, 66. It should be noted, however, that in some cases electrostatic interactions drive complex formation 84, 85.
Our results are consistent with experimental observations about the role of electrostatic effects in PDZ domain interactions. Notably, a recent experimental study on PDZ domain ligand recognition that examined the salt dependence of terminal and internal ligand recognition in the mouse alpha1-syntrophin PDZ domain concluded that the charge on the C-terminus does not play a significant in determining binding affinity 86.
Non polar and electrostatic contributions enable promiscuity in PDZ-ligand interactions
The relatively small thermodynamic importance of the electrostatic contribution together with the dominance of non-polar contributions indicates the thermodynamic basis for promiscuity in the PDZ domain interactions. This idea has been previously advanced by Harris and co-workers 15, 86. Together with their findings, the specifics of our proposition suggests that a given PDZ domain could bind with similar affinity a variety of peptides as long as these peptides can provide a certain threshold of non-polar interactions, i.e. by projecting individual residues into specific patches on the surface of PDZ domain binding pocket. This is not to say that any peptide could be recognized but that steric constraints 15, 86, rather than electrostatic ones seem to define the domain-specific interactions 87 between the PDZ receptor and its putative cognate-ligands. The suggestion that in contrast to their traditional role 88-91 electrostatic interactions do not seem to determine the specificity of peptide/PDZ interactions is probably a direct consequence of the recognition mechanism by β-sheet augmentation 10,11, since in this form of recognition it is the backbone atoms of the ligand and not the side chains that form most of the interactions with the PDZ domain. A similar MM/PBSA study on a SH3 domain also found that electrostatic contributions to binding were small and unfavorable (+1.6 to +2 kcal/mol) and that non-polar contributions played a primary role in determining affinity 48. It seems important, therefore, to determine whether this unequal balance between non-polar and electrostatic contributions may be a general thermodynamic mechanism for sustaining promiscuity in molecular recognition by protein-protein interaction domains.
Entropic contributions are poised for selectivity
We have tried to capture several dynamic and entropic effects by computing both configurational entropy contributions (Table 2) and adaptation free energy changes (Tables 3 and 4) associated with the binding process. We found that the configurational entropy contribution to the binding free energy was sufficiently converged after 20 ns of MD simulation. This convergence was confirmed by doing multiple simulations on the PSD-95 complex and the Syntenin class I complex.
The changes in these quantities sketch a dynamic picture of PDZ domain binding interactions. For the peptide-ligand, the binding event involves a large loss of vibrational entropy (−TΔSadapt in Table 3).This free energy loss relates to the significant loss of conformational freedom when the peptide is bound to the PDZ domain. This is a common observation in the binding of flexible ligands to protein receptors and suggests that pre-ordering of the ligand, as in a constrained peptide or peptide-mimetic, could significantly improve binding affinity.
In marked contrast, contributions from the PDZ domains do not share the uniformity seen in the behavior of the peptides. PDZ domains lost, but also gained configurational entropy upon binding the ligands (−TΔSadapt in Table 4). This variety of responses was surprising because PDZ domains share a common fold and the complexes studied here all follow the canonical mode of PDZ domain/peptide recognition. And thus, it was also surprising to see that the degree to which the dynamics of the peptide ligands were coupled to those of the PDZ domains varied greatly (−TΔSb in Table 2). For comparison, in SH3 domains 48, the entropic contribution was consistently evaluated at about 30 kcal/mol for all complexes. Moreover, the variability was not only observed when comparing complexes of distinct PDZ domains, but also when contrasting distinct complexes of the same PDZ domain (i.e. Erbin class I vs. Erbin class II in Table 2 and Syntenin class I vs. class II in Table 4).
Together, our results show that both dynamic and entropic responses are complex-specific, in spite of the commonality of fold and mode of recognition in PDZ domains. Such complex-specific dynamical or entropic responses may form the basis for selective interactions either of PDZ domains with specific peptide ligands or of PDZ domains complexes with downstream effectors. In support of this hypothesis a recent combined experimental and computational study has shown that the recognition of a peptide-loaded of MHC I molecule (Major Histocompatibility Complex class I) by the cognate T-cell receptor depends on the dynamics properties of the MHC I/peptide complex 57. It is thus tempting to speculate that such a role for the dynamic properties of the PDZ domains in the recognition of their cognate ligands may indicate an involvement of the dynamics in ensuing mechanisms triggered by the complexation. Such inferences can be probed with simulation approaches such as those used in this study.
ACKNOWLEDGMENT
The work was supported in part by NIH grants from the National Institute on Drug Abuse (K05-DA00060, P01-DA12923, and P01-DA12408), and by the Institute for Computational Biomedicine (ICB) at Weill Medical College of Cornell University. The computations were carried out with the resources of the ICB, which are gratefully acknowledged.
REFERENCES
- 1.Cesareni G, Gimona M, Sudol M, Yaffe M. Modular Protein Domains. Wiley; New York: 2004. [Google Scholar]
- 2.Sudol M. Oncogene. 1998;17:1469–74. doi: 10.1038/sj.onc.1202182. [DOI] [PubMed] [Google Scholar]
- 3.Doyle DA, Lee A, Lewis J, Kim E, Sheng M, MacKinnon R. Cell. 1996;85:1067–76. doi: 10.1016/s0092-8674(00)81307-0. [DOI] [PubMed] [Google Scholar]
- 4.Jelen F, Oleksy A, Smietana K, Otlewski J. Acta Biochim. Pol. 2003;50:985–1017. [PubMed] [Google Scholar]
- 5.Nourry C, Grant SG, Borg JP. Sci. STKE. 2003;2003:RE7. doi: 10.1126/stke.2003.179.re7. [DOI] [PubMed] [Google Scholar]
- 6.van Ham M, Hendriks W. Mol. Biol. Rep. 2003;30:69–82. doi: 10.1023/a:1023941703493. [DOI] [PubMed] [Google Scholar]
- 7.Sheng M, Sala C. Annu. Rev. Neurosci. 2001;24:1–29. doi: 10.1146/annurev.neuro.24.1.1. [DOI] [PubMed] [Google Scholar]
- 8.Kim E, Sheng M. Nat. Rev. Neurosci. 2004;5:771–81. doi: 10.1038/nrn1517. [DOI] [PubMed] [Google Scholar]
- 9.Cowburn D. Structure. 1996;4:1005–8. doi: 10.1016/s0969-2126(96)00106-2. [DOI] [PubMed] [Google Scholar]
- 10.Cowburn D. Curr. Opin. Struct. Biol. 1997;7:835–8. doi: 10.1016/s0959-440x(97)80155-8. [DOI] [PubMed] [Google Scholar]
- 11.Harrison SC. Cell. 1996;86:341–3. doi: 10.1016/s0092-8674(00)80105-1. [DOI] [PubMed] [Google Scholar]
- 12.Songyang Z, Fanning AS, Fu C, Xu J, Marfatia SM, Chishti AH, Crompton A, Chan AC, Anderson JM, Cantley LC. Science. 1997;275:73–7. doi: 10.1126/science.275.5296.73. [DOI] [PubMed] [Google Scholar]
- 13.Stricker NL, Christopherson KS, Yi BA, Schatz PJ, Raab RW, Dawes G, Bassett DE, Jr., Bredt DS, Li M. Nat. Biotechnol. 1997;15:336–42. doi: 10.1038/nbt0497-336. [DOI] [PubMed] [Google Scholar]
- 14.Tochio H, Zhang Q, Mandal P, Li M, Zhang M. Nat. Struct. Biol. 1999;6:417–21. doi: 10.1038/8216. [DOI] [PubMed] [Google Scholar]
- 15.Harris BZ, Lim WA. J. Cell. Sci. 2001;114:3219–31. doi: 10.1242/jcs.114.18.3219. [DOI] [PubMed] [Google Scholar]
- 16.Bezprozvanny I, Maximov A. FEBS Lett. 2001;509:457–62. doi: 10.1016/s0014-5793(01)03214-8. [DOI] [PubMed] [Google Scholar]
- 17.Vaccaro P, Dente L. FEBS Lett. 2002;512:345–9. doi: 10.1016/s0014-5793(02)02220-2. [DOI] [PubMed] [Google Scholar]
- 18.Karthikeyan S, Leung T, Ladias JA. J. Biol. Chem. 2002;277:18973–8. doi: 10.1074/jbc.M201507200. [DOI] [PubMed] [Google Scholar]
- 19.Laura RP, Witt AS, Held HA, Gerstner R, Deshayes K, Koehler MF, Kosik KS, Sidhu SS, Lasky LA. J. Biol. Chem. 2002;277:12906–14. doi: 10.1074/jbc.M200818200. [DOI] [PubMed] [Google Scholar]
- 20.Birrane G, Chung J, Ladias JA. J. Biol. Chem. 2003;278:1399–402. doi: 10.1074/jbc.C200571200. [DOI] [PubMed] [Google Scholar]
- 21.Kang BS, Cooper DR, Devedjiev Y, Derewenda U, Derewenda ZS. Structure (Camb) 2003;11:845–53. doi: 10.1016/s0969-2126(03)00125-4. [DOI] [PubMed] [Google Scholar]
- 22.Kurschner C, Mermelstein PG, Holden WT, Surmeier DJ. Mol. Cell. NeuroSci. 1998;11:161–72. doi: 10.1006/mcne.1998.0679. [DOI] [PubMed] [Google Scholar]
- 23.Madsen KL, Beuming T, Niv MY, Chang V, Dev KK, Weinstein H, Gether U. J. Biol. Chem. 2005 doi: 10.1074/jbc.M500577200. [DOI] [PubMed] [Google Scholar]
- 24.Hillier BJ, Christopherson KS, Prehoda KE, Bredt DS, Lim WA. Science. 1999;284:812–5. [PubMed] [Google Scholar]
- 25.Oschkinat H. Nat. Struct. Biol. 1999;6:408–10. doi: 10.1038/8203. [DOI] [PubMed] [Google Scholar]
- 26.Feng W, Fan JS, Jiang M, Shi YW, Zhang M. J. Biol. Chem. 2002;277:41140–6. doi: 10.1074/jbc.M207206200. [DOI] [PubMed] [Google Scholar]
- 27.Kollman PA, Massova I, Reyes C, Kuhn B, Huo S, Chong L, Lee M, Lee T, Duan Y, Wang W, Donini O, Cieplak P, Srinivasan J, Case DA, Cheatham TE., 3rd Acc. Chem. Res. 2000;33:889–97. doi: 10.1021/ar000033j. [DOI] [PubMed] [Google Scholar]
- 28.Reyes CM, Kollman PA. J. Mol Biol. 2000;297:1145–58. doi: 10.1006/jmbi.2000.3629. [DOI] [PubMed] [Google Scholar]
- 29.Berman HM, Westbrook J, Feng Z, Gilliland G, Bhat TN, Weissig H, Shindyalov IN, Bourne PE. Nucleic Acids Res. 2000;28:235–42. doi: 10.1093/nar/28.1.235. [DOI] [PMC free article] [PubMed] [Google Scholar]
- 30.Skelton NJ, Koehler MF, Zobel K, Wong WL, Yeh S, Pisabarro MT, Yin JP, Lasky LA, Sidhu SS. J. Biol. Chem. 2003;278:7645–54. doi: 10.1074/jbc.M209751200. [DOI] [PubMed] [Google Scholar]
- 31.Kimple ME, Siderovski DP, Sondek J. Embo J. 2001;20:4414–22. doi: 10.1093/emboj/20.16.4414. [DOI] [PMC free article] [PubMed] [Google Scholar]
- 32.Cheyette BN, Waxman JS, Miller JR, Takemaru K, Sheldahl LC, Khlebtsova N, Fox EP, Earnest T, Moon RT. Dev. Cell. 2002;2:449–61. doi: 10.1016/s1534-5807(02)00140-5. [DOI] [PubMed] [Google Scholar]
- 33.Karthikeyan S, Leung T, Ladias JA. J. Biol. Chem. 2001;276:19683–6. doi: 10.1074/jbc.C100154200. [DOI] [PubMed] [Google Scholar]
- 34.Im YJ, Lee JH, Park SH, Park SJ, Rho SH, Kang GB, Kim E, Eom SH. J. Biol. Chem. 2003;278:48099–104. doi: 10.1074/jbc.M306919200. [DOI] [PubMed] [Google Scholar]
- 35.Berendsen HJC, Vanderspoel D, Vandrunen R. Comp. Phys. Commun. 1995;91:43–56. [Google Scholar]
- 36.Lindahl E, Hess B, van der Spoel D. J. Mol. Mod. 2001;7:306–317. [Google Scholar]
- 37.Jorgensen WL, Maxwell DS, Tirado-Rives J. J. Am. Chem. Soc. 1996;118:11225–11236. [Google Scholar]
- 38.Berendsen HJC, Postma JPM, van Gunsteren WF, Hermans J. In: Intermolecular forces. Pullman B, editor. D. Reidel Publishing Company; Dordrecht: 1981. pp. 331–342. [Google Scholar]
- 39.Berendsen HJC, Postma JPM, van Gunsteren WF, Di Nola A, Haak JR. J. Chem. Phys. 1984;81:3684–3690. [Google Scholar]
- 40.Darden T, York D, Pedersen L. J. Chem. Phys. 1993;98:10089–10092. [Google Scholar]
- 41.Essman U, Perera L, Berkowitz ML, Darden T, Lee H, Pedersen L. J. Chem. Phys. 1995;103:8577–8592. [Google Scholar]
- 42.Hess B, Bekker H, Berendsen HJC, Fraaije JGEM. J. Comput. Chem. 1997;18:1463–1472. [Google Scholar]
- 43.Kuhn B, Kollman PA. J. Med. Chem. 2000;43:3786–3791. doi: 10.1021/jm000241h. [DOI] [PubMed] [Google Scholar]
- 44.Massova I, Kollman PA. J. Am. Chem. Soc. 1999;121:8133–8143. [Google Scholar]
- 45.Masukawa KM, Kollman PA, Kuntz ID. J. Med. Chem. 2003;46:5628–37. doi: 10.1021/jm030060q. [DOI] [PubMed] [Google Scholar]
- 46.Srinivasan J, Cheatham TE, Cieplak P, Kollman PA, Case DA. J. Am. Chem. Soc. 1998;120:9401–9409. [Google Scholar]
- 47.Srinivasan J, Miller J, Kollman PA, Case DA. J. Biomol. Struct. Dyn. 1998;16:671–82. doi: 10.1080/07391102.1998.10508279. [DOI] [PubMed] [Google Scholar]
- 48.Wang W, Lim WA, Jakalian A, Wang J, Luo R, Bayly CI, Kollman PA. J. Am. Chem. Soc. 2001;123:3986–94. doi: 10.1021/ja003164o. [DOI] [PubMed] [Google Scholar]
- 49.Wang J, Morin P, Wang W, Kollman PA. J. Am. Chem. Soc. 2001;123:5221–30. doi: 10.1021/ja003834q. [DOI] [PubMed] [Google Scholar]
- 50.Gohlke H, Case DA. J. Comput. Chem. 2004;25:238–50. doi: 10.1002/jcc.10379. [DOI] [PubMed] [Google Scholar]
- 51.Sitkoff D, Sharp KA, Honig B. J. Phys. Chem. 1994;98:1978–1988. [Google Scholar]
- 52.Sanner MF, Olson AJ, Spehner JC. Biopolymers. 1996;38:305–20. doi: 10.1002/(SICI)1097-0282(199603)38:3%3C305::AID-BIP4%3E3.0.CO;2-Y. [DOI] [PubMed] [Google Scholar]
- 53.Gilson MK, Honig B. Proteins. 1988;4:7–18. doi: 10.1002/prot.340040104. [DOI] [PubMed] [Google Scholar]
- 54.Honig B, Nicholls A. Science. 1995;268:1144–9. doi: 10.1126/science.7761829. [DOI] [PubMed] [Google Scholar]
- 55.Andricioaei I, Karplus M. J. Chem. Phys. 2001;115:6289–6292. [Google Scholar]
- 56.Tidor B, Karplus M. J. Mol. Biol. 1994;238:405–414. doi: 10.1006/jmbi.1994.1300. [DOI] [PubMed] [Google Scholar]
- 57.Pohlmann T, Bockmann RA, Grubmuller H, Uchanska-Ziegler B, Ziegler A, Alexiev U. J. Biol. Chem. 2004;279:28197–201. doi: 10.1074/jbc.C400128200. [DOI] [PubMed] [Google Scholar]
- 58.Swanson JM, Henchman RH, McCammon JA. Biophys. J. 2004;86:67–74. doi: 10.1016/S0006-3495(04)74084-9. [DOI] [PMC free article] [PubMed] [Google Scholar]
- 59.Kang BS, Cooper DR, Jelen F, Devedjiev Y, Derewenda U, Dauter Z, Otlewski J, Derewenda ZS. Structure (Camb) 2003;11:459–68. doi: 10.1016/s0969-2126(03)00052-2. [DOI] [PubMed] [Google Scholar]
- 60.Hall RA, Ostedgaard LS, Premont RT, Blitzer JT, Rahman N, Welsh MJ, Lefkowitz RJ. Proc. Natl. Acad. Sci. U. S. A. 1998;95:8496–501. doi: 10.1073/pnas.95.15.8496. [DOI] [PMC free article] [PubMed] [Google Scholar]
- 61.Maudsley S, Zamah AM, Rahman N, Blitzer JT, Luttrell LM, Lefkowitz RJ, Hall RA. Mol. Cell. Biol. 2000;20:8352–63. doi: 10.1128/mcb.20.22.8352-8363.2000. [DOI] [PMC free article] [PubMed] [Google Scholar]
- 62.Wang S, Raab RW, Schatz PJ, Guggino WB, Li M. FEBS Lett. 1998;427:103–8. doi: 10.1016/s0014-5793(98)00402-5. [DOI] [PubMed] [Google Scholar]
- 63.Niethammer M, Valtschanoff JG, Kapoor TM, Allison DW, Weinberg TM, Craig AM, Sheng M. Neuron. 1998;20:693–707. doi: 10.1016/s0896-6273(00)81009-0. [DOI] [PubMed] [Google Scholar]
- 64.Wong HC, Bourdelas A, Krauss A, Lee HJ, Shao Y, Wu D, Mlodzik M, Shi DL, Zheng J. Mol. Cell. 2003;12:1251–60. doi: 10.1016/s1097-2765(03)00427-1. [DOI] [PMC free article] [PubMed] [Google Scholar]
- 65.Miyamoto S, Kollman PA. Proc. Natl. Acad. Sci. U. S. A. 1993;90:8402–6. doi: 10.1073/pnas.90.18.8402. [DOI] [PMC free article] [PubMed] [Google Scholar]
- 66.Smith BJ, Colman PM, Von Itzstein M, Danylec B, Varghese JN. Protein Sci. 2001;10:689–96. doi: 10.1110/ps.41801. [DOI] [PMC free article] [PubMed] [Google Scholar]
- 67.Wang W, Kollman PA. J. Mol. Biol. 2000;303:567–82. doi: 10.1006/jmbi.2000.4057. [DOI] [PubMed] [Google Scholar]
- 68.Lee MR, Tsai J, Baker D, Kollman PA. J. Mol. Biol. 2001;313:417–30. doi: 10.1006/jmbi.2001.5032. [DOI] [PubMed] [Google Scholar]
- 69.Suenaga A, Hatakeyama M, Ichikawa M, Yu X, Futatsugi N, Narumi T, Fukui K, Terada T, Taiji M, Shirouzu M, Yokoyama S, Konagaya A. Biochemistry. 2003;42:5195–200. doi: 10.1021/bi034113h. [DOI] [PubMed] [Google Scholar]
- 70.Sharp KA, Honig B. Annu. Rev. Biophys. Biophys. Chem. 1990;19:301–32. doi: 10.1146/annurev.bb.19.060190.001505. [DOI] [PubMed] [Google Scholar]
- 71.Archontis G, Simonson T. J. Am. Chem. Soc. 2001;123:11047–56. doi: 10.1021/ja010716+. [DOI] [PubMed] [Google Scholar]
- 72.Laitinen T, Kankare JA, Perakyla M. Proteins. 2004;55:34–43. doi: 10.1002/prot.10399. [DOI] [PubMed] [Google Scholar]
- 73.Harris SA, Gavathiotis E, Searle MS, Orozco M, Laughton CA. J. Am. Chem. Soc. 2001;123:12658–63. doi: 10.1021/ja016233n. [DOI] [PubMed] [Google Scholar]
- 74.Schlitter J. Chem. Phys. Lett. 1993;215:617–621. [Google Scholar]
- 75.Schafer H, Daura X, Mark AE, van Gunsteren WF. Proteins. 2001;43:45–56. doi: 10.1002/1097-0134(20010401)43:1<45::aid-prot1016>3.0.co;2-n. [DOI] [PubMed] [Google Scholar]
- 76.Schafer H, Mark AE, van Gunsteren WF. J. Chem. Phys. 2000;113:7809–7817. [Google Scholar]
- 77.Schafer H, Smith LJ, Mark AE, van Gunsteren WF. Proteins. 2002;46:215–24. doi: 10.1002/prot.1166. [DOI] [PubMed] [Google Scholar]
- 78.Hess B. Phys. Rev. E. 2002;65 [Google Scholar]
- 79.Steinberg IZ, Scheraga HA. J. Biol. Chem. 1963;238:172–81. [PubMed] [Google Scholar]
- 80.Kuntz ID, Chen K, Sharp KA, Kollman PA. Proc. Natl. Acad. Sci. U. S. A. 1999;96:9997–10002. doi: 10.1073/pnas.96.18.9997. [DOI] [PMC free article] [PubMed] [Google Scholar]
- 81.Froloff N, Windemuth A, Honig B. Protein Sci. 1997;6:1293–301. doi: 10.1002/pro.5560060617. [DOI] [PMC free article] [PubMed] [Google Scholar]
- 82.Jayaram B, McConnell K, Dixit SB, Das A, Beveridge DL. J. Comput. Chem. 2002;23:1–14. doi: 10.1002/jcc.10009. [DOI] [PubMed] [Google Scholar]
- 83.Chong LT, Duan Y, Wang L, Massova I, Kollman PA. Proc. Natl. Acad. Sci. U. S. A. 1999;96:14330–5. doi: 10.1073/pnas.96.25.14330. [DOI] [PMC free article] [PubMed] [Google Scholar]
- 84.Lee LP, Tidor B. Nat. Struct. Biol. 2001;8:73–6. doi: 10.1038/83082. [DOI] [PubMed] [Google Scholar]
- 85.Sheinerman FB, Honig B. J. Mol. Biol. 2002;318:161–77. doi: 10.1016/S0022-2836(02)00030-X. [DOI] [PubMed] [Google Scholar]
- 86.Harris BZ, Lau FW, Fujii N, Guy RK, Lim WA. Biochemistry. 2003;42:2797–805. doi: 10.1021/bi027061p. [DOI] [PubMed] [Google Scholar]
- 87.Wiedemann U, Boisguerin P, Leben R, Leitner D, Krause G, Moelling K, Volkmer-Engert R, Oschkinat H. J. Mol. Biol. 2004;343:703–18. doi: 10.1016/j.jmb.2004.08.064. [DOI] [PubMed] [Google Scholar]
- 88.Hendsch ZS, Nohaile MJ, Sauer RT, Tidor B. J. Am. Chem. Soc. 2001;123:1264–5. doi: 10.1021/ja0032273. [DOI] [PubMed] [Google Scholar]
- 89.Hendsch ZS, Tidor B. Protein Sci. 1994;3:211–26. doi: 10.1002/pro.5560030206. [DOI] [PMC free article] [PubMed] [Google Scholar]
- 90.Hendsch ZS, Tidor B. Protein Sci. 1999;8:1381–92. doi: 10.1110/ps.8.7.1381. [DOI] [PMC free article] [PubMed] [Google Scholar]
- 91.Sindelar CV, Hendsch ZS, Tidor B. Protein Sci. 1998;7:1898–914. doi: 10.1002/pro.5560070906. [DOI] [PMC free article] [PubMed] [Google Scholar]
- 92.Humphrey W, Dalke A, Schulten K. J. Mol. Graph. 1996;14:33–8. 27–8. doi: 10.1016/0263-7855(96)00018-5. [DOI] [PubMed] [Google Scholar]
- 93.Karthikeyan S, Leung T, Birrane G, Webster G, Ladias JA. J. Mol. Biol. 2001;308:963–73. doi: 10.1006/jmbi.2001.4634. [DOI] [PubMed] [Google Scholar]
- 94.Im YJ, Park SH, Rho SH, Lee JH, Kang GB, Sheng M, Kim E, Eom SH. J. Biol. Chem. 2003;278:8501–7. doi: 10.1074/jbc.M212263200. [DOI] [PubMed] [Google Scholar]