

Abstract
Laboratory strains of Saccharomyces cerevisiae have been widely used as a model for studying eukaryotic cells and mapping the molecular mechanisms of many different human diseases. Industrial wine yeasts, on the other hand, have been selected on the basis of their adaptation to stringent environmental conditions and the organoleptic properties that they confer to wine. Here, we used a two-factor design to study the responses of a standard laboratory strain, CEN.PK113-7D, and an industrial wine yeast strain, EC1118, to growth temperatures of 15°C and 30°C in nitrogen-limited, anaerobic, steady-state chemostat cultures. Physiological characterization revealed that the growth temperature strongly impacted the biomass yield of both strains. Moreover, we found that the wine yeast was better adapted to mobilizing resources for biomass production and that the laboratory yeast exhibited higher fermentation rates. To elucidate mechanistic differences controlling the growth temperature response and underlying adaptive mechanisms between the strains, DNA microarrays and targeted metabolome analysis were used. We identified 1,007 temperature-dependent genes and 473 strain-dependent genes. The transcriptional response was used to identify highly correlated gene expression subnetworks within yeast metabolism. We showed that temperature differences most strongly affect nitrogen metabolism and the heat shock response. A lack of stress response element-mediated gene induction, coupled with reduced trehalose levels, indicated that there was a decreased general stress response at 15°C compared to that at 30°C. Differential responses among strains were centered on sugar uptake, nitrogen metabolism, and expression of genes related to organoleptic properties. Our study provides global insight into how growth temperature affects differential physiological and transcriptional responses in laboratory and wine strains of S. cerevisiae.
Saccharomyces cerevisiae is an important industrial microorganism. This yeast has been utilized for a long time in bakeries to raise dough and also in the production of alcoholic beverages, fermenting sugars derived from rice, wheat, barley, corn, and grape juice. More recently, it has been used as a cell factory for the production of pharmaceuticals (36), such as insulin (24) and polyketides (30). S. cerevisiae has also been extensively used as a model eukaryotic system (31).
S. cerevisiae S288c is the most widely used laboratory strain and the first sequenced eukaryote (16). S288c is a derivative of a natural diploid strain isolated from a rotting fig in California in 1938 (32). It may be a spoilage organism that originated from a wine yeast transported by insects from cellars into the field (43). The CEN.PK family of S. cerevisiae strains, which exhibit a high degree of genetic relatedness to the S288c strain (11), has become a widely employed platform for physiological as well as genetic studies in many laboratories (60).
Despite common origins, laboratory strains have distinct genetic characteristics that differ from genetic characteristics of diploid, aneuploid, or polyploid industrial wine yeasts (3, 9), which display a high level of chromosome length polymorphism (5, 46). Physiologically, laboratory yeasts are unable to completely transform all the sugar in grape must into ethanol under wine-making conditions, resulting in problematic (stuck) fermentations (43). Oenological criteria used to select commercial wine yeast strains, such as high ethanol tolerance, sugar exhaustion, high fermentation activity, growth in a wide temperature range, high osmotolerance, and low acetate production, among others (37, 42), must be at least in part responsible for the observed differences between laboratory and wine yeasts.
In the last decade, genomic techniques have been used to obtain quantitative descriptions of cellular processes. For example, DNA array technologies have had a tremendous impact on defining causal relationship and possible transcriptional regulation in cells under different physiological conditions or exposed to different environmental stimuli (15, 53, 55, 57). For wine yeast, recent studies using DNA microarrays have focused on characterizing the transcriptional program under wine-making conditions (2, 4, 18; for reviews, see references 45, 48, 49, and 61). While previous studies have provided an overview of global effects during the wine-making process, the interpretation of the results can be complicated, because shake flask or batch cultures were used. In such experiments, cultivation conditions (e.g., nutrient concentrations and growth rate) change continuously over time. It is therefore difficult to know which effects are wine yeast specific and which effects are environmental.
Temperature is a major control parameter in wine fermentation. Temperatures that are suboptimal for yeast growth (10 to 18°C) (67) are routinely used in production of white wine to enhance its sensory quality. A temperature that is suboptimal for yeast growth affects a variety of cellular processes and characteristics. Previous physiological studies, for example, have revealed that protein translation rates, cell membrane fluidity, RNA secondary structure stability, enzymatic activity, protein folding rates, and heat shock protein regulation are significantly affected (17, 21, 38, 50, 52). The yeast transcriptional program is also significantly impacted by low-temperature growth (50, 52, 57). Tai et al., for example, recently demonstrated that there was upregulation of genes encoding translational machinery at 12°C compared to the results obtained at 30°C (57). Moreover, they showed that there was a strong overlap between genes reported to be regulated by temperature change and genes controlled by the growth rate (8, 47).
Here, we used a two-factor design to characterize the differential responses of an industrial wine yeast strain, EC1118, and a laboratory yeast strain, CEN.PK113-7D, as well as the growth temperature responses at 30°C and 15°C in N-limited, anaerobic cultures. In contrast to previous studies using industrial wine yeasts, we employed continuous chemostat cultures. These cultures offered the unique opportunity to minimize variations in environmental conditions (changes in the chemical environment), as well as the variations related to the specific growth rate, by controlling the dilution rate (h−1) under tightly defined nutritional conditions (6, 44). Beyond identifying key strain-dependent and temperature-dependent physiological differences, we sought to correlate the physiological response with transcriptional and metabolic changes. For this purpose, DNA microarrays and a sensitive gas chromatography-mass spectrometry (GC-MS) method for quantification of intra- and extracellular metabolites (65) was used.
MATERIALS AND METHODS
Strains and growth conditions.
S. cerevisiae wild-type laboratory strain CEN.PK113-7D (Mata) (referred to below as the “lab yeast”) (60) and commercial wine strain S. cerevisiae var. bayanus EC1118 (Lallemand) (referred to below as the “wine yeast”) were grown at 30°C and 15°C in 2-liter chemostats (Braun Biotech, Germany) with a working volume of 1.0 liter as described by van den Berg et al. (59). Cultures were continuously fed using a defined mineral medium that limited growth by nitrogen with a constant residual carbon concentration. The dilution rate was set at 0.05 h−1. The pH was measured online and was kept constant at 5.0 by automatic addition of 2 M KOH. The stirrer speed was 300 rpm, and pure nitrogen gas was sparged aseptically at a rate of 0.5 liter·min−1. Norprene tubing and butyl rubber septa were used to minimize oxygen diffusion into the anaerobic cultures (66). The dissolved oxygen tension was measured online with an Ingold model 34 100 3002 probe and was less than the detection limit. Carbon dioxide was measured offline with a gas analyzer (Innova, Denmark) after the off-gas was cooled by a condenser connected to a cryostat set at 5°C. Steady-state samples were taken after ∼5 to 10 volume changes to avoid strain adaptation due to long-term cultivation (14). The dry weight, metabolite, dissolved oxygen, and gas profiles were constant for at least 3 residence times before samples used for RNA extraction were removed.
Media.
The composition of the defined mineral medium was based on the composition described by Verduyn et al. (63), and the medium contained 0.65 g·liter−1 (NH4)2SO4, corresponding to 137.8 mg N·liter−1. The target for the residual glucose concentration in the chemostat outlet was 17 g·liter−1 so that glucose repression could be sustained at the same level in all experiments (55). Briefly, for cells grown at 15°C, the feed glucose concentrations were 46 g·liter−1 and 54 g·liter−1 for the CEN.PK113-7D and EC1118 strains, respectively, and for cells grown at 30°C, the feed glucose concentrations were 74 g·liter−1 and 78 g·liter−1 for S. cerevisiae strains CEN.PK113-7D and EC1118, respectively. All media were supplemented with 420 mg·liter−1 Tween 80 and 10 mg·liter−1 ergosterol, as described previously (63).
Analytical methods.
Biomass was determined on dry weight basis by filtering a known volume of culture through a preweighed 0.45-μm nitrocellulose filter (Gelman Sciences). The filter was washed with distilled water, dried in a microwave oven at 150 W for 15 min, and weighed to determine the increase in dry weight.
The ammonia content was determined enzymatically by using the Boehringer ammonia/urea test. Intracellular trehalose and glycogen were extracted with 0.25 M Na2CO3 prior to enzymatic hydrolysis to glucose (39).
Metabolite sampling and analysis.
Culture samples (10 ml) used for determination of glucose, ethanol, glycerol, acetate, pyruvate, and succinate concentrations were immediately filtered through a 0.22-μm-pore-size cellulose acetate filter (CAMEO 25GAS 0.22; Osmonics, Minnetonka, MN), and the filtrates were stored at −80°C until they were analyzed. The concentrations of the metabolites were determined by high-pressure liquid chromatography using an Aminex HPX-87H column (Bio-Rad) as described by Zaldivar et al. (68) and by GC-MS analysis as described by Villas-Boas et al. (65). For GC-MS analysis, 3 ml of each extracellular sample was freeze-dried at a low temperature (−56°C) using a Christ-Alpha 1-4 freeze dryer. Samples were then derivatized before analysis (see below).
Intracellular metabolites were obtained by using the quenching method described by de Koning and van Dam (12), sterile 50-ml Falcon tubes, and 60% (vol/vol) buffered (12.5 mM Tricine, pH 7.4) cold methanol at −40 to −45°C. The temperature was controlled by addition of dry ice to a dry ice-ethanol bath monitored with a digital thermometer. The cells were rapidly plunged into the center of the methanol solution in order to avoid freezing on the sides of the tubes. Moreover, after they were capped, the tubes were inverted twice to prevent freezing at the bottoms of the tubes. After the quenching step, the cells were immediately centrifuged at 10,000 × g for 4 min in a rotor precooled to −20°C to separate the cells from the quenching solution. dl-p-Chlorophenylalanine (Sigma) and EDTA were used as internal standards and added prior to centrifugation. Extraction was performed by using two methods: (i) chloroform-methanol buffer extraction (64) with 3 mM Tricine (pH 7.4) used in place of the piperazine-N,N′-bis(2-ethanesulfoic acid) (PIPES) buffer and (ii) pure methanol extraction (64). However, samples were frozen using liquid nitrogen (rather than dry ice), and an additional freeze-thaw step was performed prior to the second centrifugation. Following extraction, the samples were freeze-dried at a low temperature (−56°C) using a Christ-Alpha 1-4 freeze dryer (65); the water content in the samples was ≥75% to ensure that they stayed frozen during the lyophilization process.
Derivatization and GC-MS analysis.
The freeze-dried samples were dissolved in 1% sodium hydroxide and derivatized as described previously (65). Following derivatization, samples were applied to a Finnegan FOCUS gas chromatograph coupled to single quadrupole mass selective detector (Thermo Electron Corporation, Waltham, MA) operated at 70 eV. The column used for analysis was a J&W DB1701 column (30 m by 250 μm [inside diameter]; film thickness, 0.15 μm; J&W, Folsom, CA). The mass spectrometer was operated in scan mode (start after 5.5 min; mass range, 38 to 550 atomic mass units at a rate of 7.5 scans/s). The analysis parameters used have been described by Villas-Boas et al. (65).
Analyses of GC-MS samples were carried out using Spectconnect (http://spectconnect.mit.edu/), a novel software program recently developed to reduce noise (54). Although all metabolites could not be identified, we obtained 84 unique metabolite level measurements (52 intracellular measurements and 32 extracellular measurements).
Sampling and RNA isolation.
Each sample used for RNA isolation was obtained by rapidly placing 20 ml of culture into a tube with 35 to 40 ml of crushed ice, which decreased the sample temperature to <2°C in less than 10 s. Cells were pelleted (4,500 rpm at 0°C for 2 min), instantly frozen in liquid nitrogen, and stored at −80°C until they were used. Total RNA was extracted using a FastRNA Pro RED kit (QBiogene, Inc., United States) according to manufacturer's instructions after samples were thawed on ice. Samples with good RNA integrity and quality, as assessed with an RNA 6000 Nano LabChip kit using an Agilent 2100 bioanalyzer, were hybridized.
Probe preparation and hybridization to arrays.
mRNA extraction, cDNA synthesis, cRNA synthesis and labeling, and hybridization to Affymetrix Yeast Genome 2.0 arrays were performed with a GeneChip one-cycle target labeling kit as described in the Affymetrix user's manual (1). Washing and staining of arrays were performed using a GeneChip fluidics station 400 and scanning with an Affymetrix GeneChip Scanner 3000.
Data acquisition and analysis.
Data for each growth condition were obtained by using three independently cultured replicates. Acquisition and primary analysis of array images were performed using the Affymetrix Microarray suite v5.0 and dChip 2005 software packages. dChip was used to normalize the data. All arrays were globally scaled to a target value of 100 using the invariant set normalization method. Probe summarization was accomplished using only the perfect match values. A filter was used to extract 5,814 unique S. cerevisiae open reading frames (ORFs) from the 10,765 transcript features on the Yeast Genome 2.0 arrays.
To determine the variation within triplicate measurements, the coefficient of variation (the standard deviation divided by the mean) was calculated for each transcript. When the genes were placed in order based on increasing average signal, the average coefficient of variation exhibited a sharp increase for the 150 genes with the lowest abundance. Because these genes could not be reliably measured, the value for each of them was set to the lowest reliably measured value for comparison analysis, a value of 10. The average coefficient of variation for the remaining 5,566 signals was used to represent the average error for each condition, which ranged from 0.09 to 0.34 (see the supplemental material).
Further statistical analyses were performed with the Microsoft Excel Significance Analysis of Microarrays (SAM) (v2.10) add-in (58) and the Reporter Metabolite and Subnetwork Analysis software (40). SAM assesses the difference between two mean values, taking into account the standard error of these means. The significance of the difference is estimated by comparing it to the possibility that it occurred by chance alone. A model of chance is generated by permutation of input data. The threshold for significance was set so that it tolerated a median of one false positive per analysis, for a false discovery rate (FDR) of < 0.14%. Genes were considered significant if their levels of expression were more than 1.5-fold different. To determine significantly enriched gene ontology (GO) process terms within the upregulated and downregulated temperature-dependent and strain-dependent genes, we used the Saccharomyces Genome Database-GO tools (http://db.yeastgenome.org/cgi-bin/GO/goTermFinder.pl0).
The Reporter Metabolite and Subnetwork Analysis software (40) is based on hypothesis-driven data analysis to reveal the transcriptional regulatory architecture of metabolic networks. Briefly, the Reporter Metabolite algorithm identifies key areas of metabolism with which changes in mRNA expression are significantly associated. The genome-scale model of yeast is used as a framework to generate a bipartite undirected graph. In this graph, each metabolite node has as neighbors the enzymes catalyzing the formation and consumption of the metabolite. The transcriptome data are mapped on the enzyme nodes using the significant values for gene expression determined by an unpaired, two-tailed, homocedastic t test, without a minimum-change requirement. The normal cumulative distribution function is used to convert the P values to a z score. Then each metabolite is assigned the average score of its k neighboring enzymes, and this score is corrected for the background by subtracting the mean and dividing by the standard deviation of average scores for 10,000 enzyme groups of size k selected from the same data set. The corrected scores are then converted back to P values by using the normal cumulative distribution function, and the most significant metabolites, the reporter metabolites, are ranked.
To search for the high-scoring metabolic subnetworks that describe highly coregulated significantly changing genes, we used the previously proposed simulated annealing algorithm and enzyme interaction graph of Patil and Nielsen (40). Briefly, the algorithm uses as input a list of P values (see above). P values are converted into z scores using the inverse cumulative distribution function. z scores are then mapped on the graph, and the score of subnetwork SG is calculated by determining the average sum of all node elements of SG, corrected for background and for the size of SG. In order to find the highest-scoring subnetwork, subnetwork SG1, a simulated annealing algorithm is used. Because finding the highest-scoring connected subnetwork is NP hard, the method is not guaranteed to find the overall maximum using this algorithm. Therefore, each network-data pair was analyzed 10 times, and the highest-scoring subnetwork, subnetwork SG1, was selected. Iterations could be carried out to find the highest-scoring subnetwork (subnetwork SG2) within subnetwork SG1.
Gene Expression Omnibus accession number.
The Gene Expression Omnibus accession number is GSE12232. The complete data set is available at http://www.ing.puc.cl/biotec_group/microarray.php.
RESULTS
Experimental design.
To characterize the differential responses of an industrial wine yeast, S. cerevisiae var. bayanus EC1118 (2, 48, 61), and a laboratory yeast, S. cerevisiae strain CEN.PK113-7D (Mata) (6, 55, 60), grown at 30°C and 15°C in nitrogen-limited, anaerobic chemostat cultures, we used a systems approach that correlated the physiological, transcriptional, and metabolomic responses. We set the dilution rate at 0.05 h−1 so that the specific growth rate would be less than the maximum specific growth rate at 15°C (data not shown). The culture medium was designed so that the steady-state glucose concentrations in the effluents were similar (Table 1), which allowed glucose repression to occur at similar levels in all experiments and also at same level that was used in previous studies (55). During each steady-state experiment, we collected physiological data, genome-wide transcription profiles using the Affymetrix GeneChip platform, and intracellular and extracellular metabolome profiles using a recently developed GC-MS platform.
TABLE 1.
Steady-state nutrient concentrations in chemostat culturesa
| S. cerevisiae strain | Temp (°C) | Dilution rate (h−1) | Biomass (g liter−1)b,c,e | Glucose
|
NH4+
|
||||
|---|---|---|---|---|---|---|---|---|---|
| Feed concn (g liter−1) | Residual concn (g liter−1) | Biomass yield on glucose (g [dry wt]/g Glc)b,c,d | Feed concn (g liter−1) | Residual concn (g liter−1) | Biomass yield on nitrogen (g [dry wt]/g NH4+)b,c,e | ||||
| CEN.PK113-7D | 15 | 0.049 ± 0.001 | 1.58 ± 0.06 | 48.4 ± 5.37 | 16.0 ± 0.5 | 0.066 ± 0.001 | 0.194 ± 0.015 | BDf | 11.26 ± 2.02 |
| 30 | 0.050 ± 0.001 | 3.05 ± 0.19 | 76.2 ± 4.05 | 18.3 ± 0.8 | 0.053 ± 0.000 | 0.194 ± 0.009 | BD | 15.72 ± 0.56 | |
| EC1118 | 15 | 0.047 ± 0.000 | 2.85 ± 0.22 | 54.6 ± 1.89 | 16.0 ± 0.6 | 0.074 ± 0.003 | 0.201 ± 0.003 | BD | 14.17 ± 1.39 |
| 30 | 0.049 ± 0.002 | 4.00 ± 0.44 | 83.4 ± 1.24 | 17.9 ± 1.9 | 0.054 ± 0.003 | 0.201 ± 0.001 | BD | 18.46 ± 0.25 | |
The data are the averages ± standard deviations for three independent chemostat steady states.
The means for S. cerevisiae CEN.PK113-7D cultures grown at 15°C and 30°C are statistically significantly different (P < 0.05) as determined by an unpaired homocedastic t test.
The means for S. cerevisiae EC1118 cultures grown at 15°C and 30°C are statistically significantly different (P < 0.05) as determined by an unpaired homocedastic t test.
The means for S. cerevisiae CEN.PK113-7D and EC1118 cultures grown at 15°C are statistically significantly different (P < 0.05) as determined by an unpaired homocedastic t test.
The means for S. cerevisiae CEN.PK113-7D and EC1118 cultures grown at 30°C are statistically significantly different (P < 0.05) as determined by an unpaired homocedastic t test.
BD, below the detection limit of the assay.
Physiology of S. cerevisiae strains during growth at different temperatures.
First, we investigated physiological differences under all conditions. Significant changes in the biomass concentrations were observed. At the same specific growth rate, incubation at the low temperature resulted in 30% and 50% decreases in the biomass concentrations for the wine and lab yeast cultures, respectively (Table 1). These results are consistent with the finding that yeast strains grow suboptimally at lower temperatures.
One of the most striking effects of yeast adaptation to growth at low temperature was the effect on nitrogen metabolism. Even though all fermentations consumed equivalent amounts of ammonia (Table 1), the biomass yield on nitrogen was significantly different in each of the four experiments (Table 1). A lower biomass yield was obtained at 15°C than at 30°C for both strains. Notably, at both temperatures, the biomass yields of the wine yeast were higher than the biomass yields of the lab yeast. This suggests that the former strain is better adapted to grow in nitrogen-limited media, conditions which mimic the wine-making process. The difference in biomass yields on nitrogen resulted from different biomass compositions (Table 2). Specifically, we observed increases in the protein and RNA contents and decreases in the storage carbohydrate contents (e.g., trehalose content) at the lower temperature (Table 2). Moreover, no amino acids were detected in the extracellular medium (Fig. 1). Even though trehalose accumulation is considered a trait associated with low-temperature adaptation, this stress response was not observed when cells were grown in chemostat cultures. This is consistent with previous results (57).
TABLE 2.
Glycogen, trehalose, RNA, and protein contents in biomassa
| S. cerevisiae strain | Temp (°C) | %
|
|||
|---|---|---|---|---|---|
| Trehaloseb,c | Glycogen | Proteinb,c | RNAb,c,d,e | ||
| CEN.PK113-7D | 15 | 0.35 ± 0.05 | 0.20 ± 0.15 | 49.5 ± 4.7 | 5.21 ± 0.19 |
| 30 | 5.99 ± 1.79 | 0.39 ± 0.12 | 35.0 ± 1.8 | 3.73 ± 0.07 | |
| EC1118 | 15 | 0.78 ± 0.24 | 0.60 ± 0.00 | 47.3 ± 1.2 | 6.85 ± 0.30 |
| 30 | 5.48 ± 2.86 | 0.38 ± 0.08 | 30.1 ± 2.5 | 3.34 ± 0.11 | |
The values were calculated by determining the gram/gram (dry weight) of cells and, unless indicated otherwise, are the averages ± standard deviations for three independent chemostat steady states.
The means for S. cerevisiae CEN.PK113-7D cultures grown at 15°C and 30°C are statistically significantly different (P < 0.05) as determined by an unpaired homocedastic t test.
The means for S. cerevisiae EC1118 cultures grown at 15°C and 30°C are statistically significantly different (P < 0.05) as determined by an unpaired homocedastic t test.
The means for S. cerevisiae EC1118 and CEN.PK113-7D cultures grown at 30°C are statistically significantly different (P < 0.05) as determined by an unpaired homocedastic t test.
The values are the averages ± standard deviations for duplicate chemostat steady states.
FIG. 1.

Metabolome analysis of the differences between strains and temperatures. The colors indicate the ratio of the level of a metabolite in the reference experiment to the level under the experimental conditions (red, higher level under the experimental conditions; green, higher level in the reference experiment; n.d., not detected in either sample). The rim of each circle indicates the statistical significance of the change, as assessed by a two-tailed, homocedastic, unpaired t test. The first column in each data set shows the results for intracellular measurements (IN), and the second column show the results for the extracellular determinations (EX). Abbreviations: LAC, lactic acid; PYR, pyruvic acid; CTM, citramalic acid; CIT, citric acid; AKG, α-ketoglutaric acid; SUC, succinic acid; MAL, malic acid; ALA, alanine; VAL, valine; LEU, leucine; PRO, proline; ASP, aspartic acid; GLU, glutamic acid; OLE, oleic acid; LAU, lauric acid; MYR, myristic acid; CEN.PK, CEN.PK113-7D.
Specific glucose uptake rates also changed significantly under all conditions tested (Table 3). Both strains exhibited a decreased uptake rate at 15°C, but the effect was greater in the wine yeast, in which there was a 21% decrease in the uptake rate compared to the 17% decrease in the lab yeast. An unpaired homocedastic t test determined that the difference is significant (P < 0.05).
TABLE 3.
Specific metabolite consumption and production ratesa
| S. cerevisiae strain | Temp (°C) | Specific metabolite consumption and production rates (mmol C g [dry wt]−1 h−1)
|
Carbon balance | ||||||
|---|---|---|---|---|---|---|---|---|---|
| Glucoseb,c,d,e | CO2c,d | Succinateb | Glycerolb | Acetateb,c,d | Ethanolb,c,d | Pyruvatec | |||
| CEN.PK113-7D | 15 | −24.42 ± 0.25f | 7.92 ± 0.17f | 0.01 ± 0.01 | 0.11 ± 0.01 | 0.17 ± 0.06 | 13.80 ± 0.61 | 0.02 ± 0.01 | 0.95 ± 0.05 |
| 30 | −31.61 ± 1.00 | 8.71 ± 0.48 | 0.08 ± 0.02 | 0.08 ± 0.00 | 0.08 ± 0.00 | 15.85 ± 0.33 | 0.03 ± 0.01 | 0.86 ± 0.02 | |
| EC1118 | 15 | −21.34 ± 0.70 | 7.10 ± 0.40 | 0.03 ± 0.01 | 0.09 ± 0.02 | 0.03 ± 0.01 | 11.98 ± 0.38 | 0.01 ± 0.00 | 0.99 ± 0.02 |
| 30 | −29.00 ± 0.51 | 8.84 ± 0.22f | 0.05 ± 0.00 | 0.09 ± 0.01 | 0.05 ± 0.02 | 14.56 ± 0.67 | 0.03 ± 0.00 | 0.88 ± 0.01 | |
Unless indicated otherwise, the data are the averages ± standard deviations for three independent chemostat steady states.
The means for S. cerevisiae CEN.PK 113-7D cultures grown at 15°C and 30°C are statistically significantly different (P < 0.05) as determined by an unpaired homocedastic t test.
The means for S. cerevisiae EC1118 cultures grown at 15°C and 30°C are statistically significantly different (P < 0.05) as determined by an unpaired homocedastic t test.
The means for S. cerevisiae CEN.PK113-7D and EC1118 cultures grown at 15°C are statistically significantly different (P < 0.05) as determined by an unpaired homocedastic t test.
The means for S. cerevisiae CEN.PK113-7D and EC1118 cultures grown at 30°C are statistically significantly different (P < 0.05) as determined by an unpaired homocedastic t test.
The data are the averages ± standard deviations for two independent chemostat steady states.
Another significant physiological change was observed when the yield of ethanol on glucose was examined. Under anaerobic conditions, yeasts produce the energy required for growth by fermenting glucose into ethanol. For both strains, a decrease in the growth temperature resulted in a significant increase in the yield of ethanol on glucose (from 0.50 ± 0.01 C mol of ethanol per C mol of glucose consumed at 30°C to 0.55 ± 0.01 C mol of ethanol per C mol of glucose consumed at 15°C). The fermentative capacity, expressed as the specific CO2 production rate, is correlated with ethanol production under anaerobic conditions. The ratio of the specific CO2 production rate to the specific ethanol production rate was not significantly different for the two temperatures for each strain, confirming that there was an increase in the flux toward ethanol at low temperatures. No differences in the ethanol yields on glucose between the strains were observed, suggesting that this energetic process is strain independent. The steady-state ethanol concentrations ranged from 2% and 2.3% at 15°C to 3% and 3.4% at 30°C for the lab yeast and the wine yeast, respectively.
Glycerol is the third most abundant extracellular metabolite that we measured after ethanol and CO2. It is a redox-balancing metabolite, whose biosynthesis consumes NADH generated during biomass and metabolite synthesis. For the wine yeast strain, similar specific production rates were observed at the two temperatures. Hence, glycerol accumulation correlates exclusively with biomass production for this strain (Table 3). On the other hand, the specific glycerol production rate for the lab yeast was 25% higher at 15°C than at 30°C. The altered glycerol production rates can be partially explained by a 2.6-fold increase in the specific rate of acetate synthesis (Table 3).
Functional analysis of temperature- and strain-dependent genes.
In addition to investigating physiological changes, we also determined genome-wide transcription profiles for each steady state using the Affymetrix GeneChip platform and measured the contents of intracellular and extracellular metabolites in order to understand the underlying adaptation mechanisms triggered in response to growth temperature in each strain. To test the quality of the arrays, we calculated the coefficient of variation for each transcript. With average coefficients of variation ranging from 0.09 to 0.34, we found a high level of reproducibility between the arrays (44).
Statistical Analysis of Microarray Data (SAM software) was used (58) to quantitatively determine genes whose expression had significantly changed. A four-way analysis was performed, which established differences in expression of genes between the strains at both growth temperatures and between temperatures for each strain. At an FDR of 0.14% (i.e., a median of one false positive per analysis was tolerated), the levels of expression of 1,529 genes were altered under least one condition with differences of more than 1.5-fold (Fig. 2). The levels of expression of 1,007 ORFs (17.6% of the genome) significantly changed with temperature in both strains. A total of 473 ORFs (8.3% of the genome) were differentially expressed in the strains, irrespective of the temperature. These findings revealed a robust set of significant genes as a result of intragroup variability deeemphasizing genes not significant in both cases.
FIG. 2.
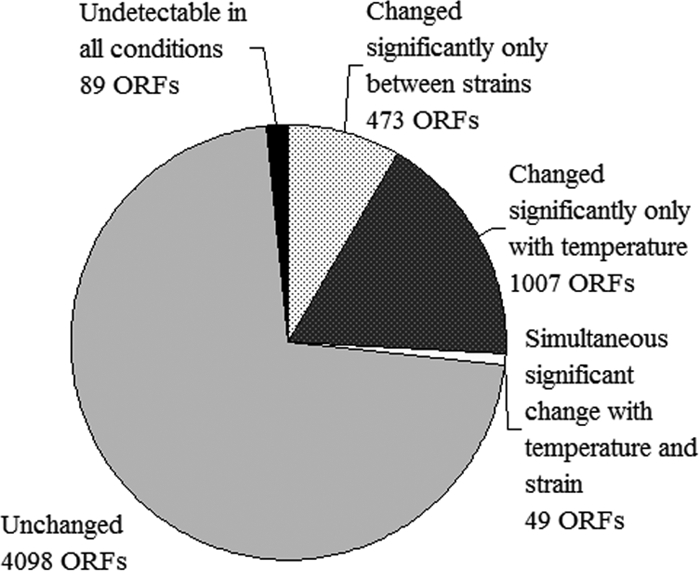
Summary of the global transcriptional response showing strain-dependent (EC1118 versus CEN.PK113-7D) and temperature-dependent (15°C versus 30°C) genes (FDR, <0.14%).
We also determined significantly enriched GO process terms within the upregulated and downregulated temperature-dependent and strain-dependent genes. This allowed us to obtain a better understanding of the transcriptional response and to identify strain-dependent genes responsible for the enhanced fitness of the wine yeast under nitrogen limitation conditions not determined in our initial analysis. For the query, we used the Saccharomyces Genome Database-GO tools (with significance at P ≤ 0.01). Consistent with the physiological results, ribosome biogenesis and assembly, RNA processing, and gene expression were the most significantly enriched GO processes among the gene processes upregulated when the temperature was decreased (Table 4). Among the 710 genes downregulated when the temperature was decreased, the most overrepresented GO terms were response to stimulus (166 genes), response to stress (112 genes), trehalose metabolism (9 genes), and biological regulation (202 genes). For a detailed description of cluster members see below. Collectively, these results are in agreement with the physiological data suggesting that RNA processing, trehalose metabolism, and the stress response are factors most affected by suboptimal temperatures. Moreover, they are consistent with previous studies examining the transcriptional program in yeast at different temperatures (57).
TABLE 4.
GO annotation based on the Biological Process ontology for temperature-regulated genes and genes differentially expressed in strainsa
| GO term | No. of ORFs | Cluster frequency (%) | P valueb |
|---|---|---|---|
| Genes downregulated at low temperatures | |||
| Response to stimulus | 166 | 21.0 | 4.53e-06 |
| Trehalose metabolic process | 9 | 1.1 | 0.00018 |
| Response to stress | 112 | 14.2 | 0.00031 |
| Biological regulation | 202 | 25.6 | 0.00618 |
| Genes upregulated at low temperatures | |||
| Ribosome biogenesis and assembly | 105 | 35.5 | 5.77e-56 |
| RNA processing | 75 | 25.3 | 1.23e-21 |
| Organelle organization and biogenesis | 120 | 40.5 | 1.00e-10 |
| Nucleobase, nucleoside, nucleotide, and nucleic acid metabolic process | 110 | 37.2 | 1.86e-10 |
| Gene expression | 91 | 30.7 | 1.47e-07 |
| RNA modification | 15 | 5.1 | 0.00134 |
| RNA 5′ end processing | 9 | 3.0 | 0.00249 |
| Genes downregulated in the EC1118 wine strain | |||
| Sexual reproduction, conjugation | 28 | 9. | 1.41e-09 |
| Reproduction | 39 | 13.3 | 7.48e-05 |
| Transposition, RNA mediated | 7 | 2.4 | 0.00113 |
| Cytokinesis, completion of separation | 6 | 2.0 | 0.00323 |
No significant ontology term could be found for input genes upregulated in the EC1118 wine strain. Of 173 input genes, 52 are directly annotated to the root term “biological process unknown.”
The significance of overrepresentation of a cluster is expressed as a P value.
Among the genes upregulated in the wine yeast compared to the laboratory yeast, no significantly enriched GO processes were found (Table 4). Moreover, 30% of the upregulated genes in the wine strain have no known function. These potential candidates could play a role in adaptation to growth at suboptimal temperatures. Among the 298 genes downregulated in the wine yeast compared to the lab yeast, the most overrepresented GO terms were related to mating genes, cytokinesis, and completion of separation (Table 4). More specifically, the levels of expression of the CTS1, DSE1, DSE2, and DSE4 genes were lower in the wine yeast than in the lab yeast. These genes encode daughter-specific glucanase-like proteins (DSE genes) and an endochitinase (CTS1) that participate in cell separation following cytokinesis (10).
Further analysis revealed that the differential expression of genes involved in the temperature response was in agreement with the decreased sugar uptake rates observed at 15°C. The level of expression of the low-affinity HXT1 transporter gene decreased twofold between 30°C and 15°C. Furthermore, the level of expression of the high-affinity transporter HXT6 and HXT7 genes decreased fourfold in the wine yeast and fivefold in the lab yeast. Another important cellular effect of growing yeast cells at low temperatures is that the levels of expression of several genes encoding RNA polymerase subunits were higher at 15°C; these genes included RPA34, RPA42, RPA49, RPC17, and RPC40 (1.6-, 2-, 2-, 1.7-, and 1.7-fold-higher levels of expression, respectively). Consistent with the expression profile, the RNA content almost doubled in cells grown at 15°C (from 3.5% to 6%) (Table 2). Tai et al. recently hypothesized that rRNA levels increase in low-temperature nitrogen-limited chemostats (57).
Among nonmetabolic genes, the levels of expression of the HSF1 transcription factor gene and the HMS2, HSP30, HSP60, HSP78, HSP82, HSP26, and HSP12 heat shock protein genes were higher at 30°C in both strains. Finally, we observed decreased transcription of stress response element-mediated, cyclic AMP-protein kinase A-activated genes at 15°C (e.g., TPS1 and TPS2), which correlated with significant changes in the levels of MSN4 transcripts (1.5-fold and 3.2-fold higher at 30°C for the lab yeast and the wine yeast, respectively) (29). Our results confirm that there is no low-temperature stress response in continuous cultures (57). Furthermore, our data indicate that there was a reduced temperature stress response at 15°C.
With regard to differential expression of genes among the strains, we observed that changes in mating gene expression were dominant when our initial significance threshold was used. For example, the levels of expression of the MATa-specific genes AGA1 and AGA2 (69) were 14.8-fold and 35-fold higher in the lab yeast, respectively, the level of expression of ASG7 was 22.8-fold higher (23), and the levels of expression of the mating-specific genes FUS1 (35), HO (34), and KAR4 (26) were 13.6-fold, 10.7-fold, and 3.1-fold higher, respectively. This result was expected since mating genes are repressed in the diploid wine yeast compared to the haploid lab yeast.
Since conventional transcriptome analysis did not provide adequate insight into strain differences which may cause the enhanced ability of the wine yeast to grown on nitrogen, we used a newly described network-based approach to describe the observed physiological changes.
Highly correlated subnetworks implicated in control of temperature- and strain-dependent genes.
Beyond the process term enrichment analysis, we sought to integrate the significance of change from transcriptome results with metabolic topology to reveal transcriptional regulatory architecture. First, we searched for subnetworks of significantly changing genes showing a highly coordinated response to strain- and temperature-dependent genes (40). Second, to identify metabolites with which mRNA changes are significantly associated, we used a newly described hypothesis-driven data analysis Reporter Metabolite algorithm (40). These approaches enable determination of regulatory patterns not identified by using a statistical test alone and are irrespective of changes (40).
The highly coregulated subnetwork of temperature-dependent metabolic genes comprised 205 genes, and 74 of these genes are involved in carbon, nucleotide, and amino acid metabolism (Fig. 3). Within this subnetwork, the levels of expression of the MEP1, MEP2, and BGL2 genes were twofold higher at 30°C; meanwhile, MEP2 and BGL2 were upregulated 50% at 30°C. The first two genes encode high-affinity ammonium permeases (28). MEP2 is under nitrogen catabolite repression control and is involved in regulation of pseudohyphal growth (27). These results confirm previous findings obtained in experiments performed at 12°C (57). BGL2 encodes a β-glucanase, a major cell wall protein involved in cell wall maintenance (33). These findings support the observation that for both yeast strains some cells had an elongated morphology at 15°C (Fig. 4). In contrast to previous results (57), no changes in the expression of the low-affinity permease MEP3 gene were observed. Interestingly, apart from the differences attributed to growth temperature, the expression of the high-affinity permease MEP1 gene was twofold higher in the lab yeast.
FIG. 3.

Subnetwork analysis of the genome-wide transcriptional response to temperature change. Light gray type indicates genes that are overexpressed at 15°C. Bold type indicates genes whose expression is higher at 30°C. Group members are identified, and general metabolic descriptions are included.
FIG. 4.

Morphological changes induced by growth temperature. Fresh samples were observed directly with a light microscope at a magnification ×400 using a Neubauer chamber. (Left panel) S. cerevisiae EC1118 grown in anaerobic continuous cultures at 30°C. (Right panel) S. cerevisiae EC1118 grown at 15°C.
For nitrogen metabolism, the coordinately regulated metabolic subnetwork included three DAL genes, DAL1, DAL4, and DAL5, whose levels of expression were significantly higher at 30°C (2.5-fold, 6.3-fold, and 1.6-fold higher, respectively) (Fig. 3). These genes are required for the degradation of allantoin, a metabolite involved in purine metabolism for nitrogen recycling (13). It is tempting to speculate that upregulation of nitrogen recycling helps the cells achieve higher biomass yields at 30°C.
Subnetwork analysis identified a coregulated structure for metabolism comprising 160 genes among strains, while using a statistical test resulted in only limited significant differences. The main genetic players in the network, with differential transcriptional responses in wine and laboratory strains, are summarized in Fig. 5. Low acetate production is one of the major oenological criteria for selection of industrial wine yeast strains. For acetate metabolism there were major differences in expression between the wine and lab yeasts (Table 5). During anaerobic growth on glucose, acetate is produced mainly by the cytosolic pyruvate dehydrogenase bypass via Ald6p and by a mitochondrial route involving Ald5p (51). Acetate is then converted to acetyl coenzyme A by a protein encoded by ACS2. Consistent with a higher level of acetate production (Table 3), the levels of expression of ALD5 were higher in the lab yeast. The level of expression of ALD6 was also twofold higher in the lab yeast, irrespective of the temperature. The ratio of ACS2 to ALD5/ALD6 was constant with temperature in both strains but was higher in the wine yeast. Other genes involved in redox metabolism whose levels of expression were higher in the lab yeast include the glutathione oxidoreductase genes GLR1 and GPX2. In this strain there were also significantly higher levels of expression of genes required for de novo NAD+ synthesis (BNA1 and BNA4) and of the NAD+ recycling gene NPT1, which may lead to increased NAD+ levels (Fig. 5). The latter finding may account for the increased acetate production rates in the lab yeast.
FIG. 5.

Subnetwork analysis of the genome-wide transcriptional strain differences in S. cerevisiae. Bold type indicates genes that are overexpressed in the lab yeast (CEN.PK113-7D). Light gray type indicates genes that are overexpressed in the wine yeast (EC1118). Group members are identified, and general metabolic functional categories are indicated.
TABLE 5.
Growth temperature- and strain-specific reporter metabolites for the transcriptional response of S. cerevisiae strains grown at different temperatures (30°C and 15°C)
| Metabolite | P valuea |
|---|---|
| Reporter metabolites for temperature change | |
| l-Alanine | 2.80E-03 |
| UDP | 7.33E-03 |
| α,α-Trehalose | 9.15E-03 |
| UDP-glucose | 1.43E-02 |
| α,α′-Trehalose-6-phosphate | 1.57E-02 |
| d-Glucose-1-phosphate | 2.11E-02 |
| Pseudouridine-5′-phosphate | 2.17E-02 |
| d-Ribose-5-phosphate | 2.93E-02 |
| NH3 | 2.94E-02 |
| Strain-specific reporter metabolites | |
| NADP+ | 6.30E-03 |
| α-Ketoglutarate | 7.10E-03 |
| NADPH | 9.40E-03 |
| Chitin | 1.00E-02 |
| Carbamoyl phosphate | 1.80E-02 |
| S-Adenosyl-l-methionine | 3.10E-02 |
| Acetate | 3.50E-02 |
| N-Acetyl-d-glucosamine-6-phosphate | 4.90E-02 |
The P value is the probability that the set of neighbor enzymes (involved directly in metabolite anabolism, catabolism, or transport) show the observed normalized transcriptional response by chance.
In the two strains, subnetwork analysis also identified highly coregulated genes involved in cell wall synthesis. For example, CHS1 encodes a chitin synthase whose level of expression was 2.4-fold higher in the lab yeast. The expression of EXG2, encoding an exoglucanase required for β-glucan assembly, was also upregulated in the lab yeast. This could be related to the observation that at 15°C a greater number of cells having an elongated morphology were found among the wine yeast cells than the lab yeast cells.
Four central carbon metabolic genes showed significant coordinated upregulated expression in the wine yeast. Contradicting physiological data, in the wine yeast the level of expression of the low-affinity hexose transporter HXT1 gene was 10-fold higher, irrespective of the temperature, while the levels of expression of the high-affinity transporter HXT6 and HXT7 genes were 1.6- and 1.2-fold higher in the wine yeast at 15 and 30°C, respectively. Meanwhile, the level of expression of the ENO1 glucose-repressed glycolytic gene (25) was 1.2-fold higher, and the level of expression of PDC5, encoding a minor isoform of pyruvate decarboxylase (20), was 1.8-fold higher in the wine yeast. As a group, these four genes should indicate that the wine strain has an increased glycolytic capacity compared to the lab yeast if there is no posttranscriptional regulation; however, physiological data showed that there were significantly higher glucose uptake rates and higher ethanol production rates in the lab yeast. On the other hand, the level of transcription of fructose-1,6-bisphosphatase, one of the key regulatory steps in gluconeogenesis control (25), was significantly higher at the low temperature in the wine yeast. Since almost no glycogen was produced at this temperature, the glycolytic flux could be controlled by regulating the concentration of fructose-1-phosphate and fructose-1,6-bisphosphate. A recent study revealed a dominant role for metabolic control as opposed to gene expression in the adaptation of glycolytic enzyme activity to different temperatures (56).
In both strains the largest subsets of coordinately regulated metabolic genes were related to nitrogen metabolism. We found differences in both anabolic and catabolic genes, but the gene subsets were different for the two strains. These differences suggest that different types of regulatory control evolved to control the transcriptional programs of the wine and lab yeasts and that specific differences may yield clues to why the wine yeast is more efficient in utilizing nitrogen for biomass. The wine yeast was characterized by having a higher level of expression of ARO3 (1.8-fold higher), whose product catalyzes a step in aromatic amino acid biosynthesis. The levels of expression of the CAR2 and PUT2 genes, belonging to the arginine degradation pathway (7), were 2.2- and 1.5-fold higher. Finally, the level of expression of ODC1, a gene involved in the export of α-ketoglutarate to the cytosol for lysine and glutamate biosynthesis, was 1.5-fold higher. Consistent with the gene expression data, we observed three- to fourfold increases in the level of α-ketoglutarate in the exometabolome of the wine yeast at 15°C and 30°C (Fig. 1). The genes whose levels of expression were higher in the lab yeast included TAT1 and AGP3, encoding low-affinity amino acid transporters (4.1- and 2.7-fold higher, respectively), the lysine biosynthetic gene LYS2, the arginine biosynthetic genes CPA2 and ARG3, and the high-affinity ammonium permease gene MEP1 (2-fold higher).
The most significant reporter metabolites are listed in Table 5. These metabolites participate in diverse metabolic pathways. Reporter metabolites for the temperature-dependent genes, for example, demonstrate the importance of transcriptional changes around trehalose, which was also shown to be important in the physiological analysis. Moreover, we observed a significant decrease in the levels of trehalose at low temperatures. For the strain-dependent genes, the transcriptional changes in metabolism around acetate, NADP+, and chitin described above were found to be among the most significant transcriptional changes.
DISCUSSION
To the best of our knowledge, our two-factor design is the first design to carefully control for and study the underlying mechanisms for temperature adaptation in wine yeasts compared to laboratory yeasts by using chemostat cultures. While the growth conditions do not perfectly mimic wine-making conditions, chemostat growth provided the opportunity to directly compare evolutionary differences between strains and to explore the impact of temperature. When grown at the lower temperature, both strains produced lower biomass yields on nitrogen. This was a consequence of an increase in the protein and RNA content (Table 2), a decrease in the cellular trehalose content, and altered nitrogen metabolism that led to an increased proportion of nitrogen-rich compounds in the cell. Wine strains, however, are better adapted to wine-making conditions, which results in the formation of more cells with the same amount of nitrogen and a smaller decrease in biomass yields at low temperatures.
Another important difference between the two yeast strains was the reduced sugar uptake rates when the temperature was decreased. This effect was greater in the wine yeast, which exhibited a 21% decrease in the uptake rate, than in the lab yeast (17% decrease). The higher specific (per cell) sugar consumption rates observed did not correlate to the transcriptional regulation of sugar transport. General downregulation of hexose transporters was observed at 15°C in both strains. Also, as shown previously (41), simultaneous expression of high- and low-affinity transporters was found. The levels of expression of both the low-affinity transporter HXT1 gene and the high-affinity transporter HXT6 and HXT7 genes were higher in the wine yeast than in the lab yeast, suggesting that there are other mechanisms for control of sugar uptake in this yeast. These differences may be a result of the selection process used for lab strains, which selects strains that exhibit fast growth in minimal media and under carbon limitation conditions (60) and therefore utilize carbon efficiently.
A decrease in sugar transport rates was also accompanied by decreased accumulation of storage carbohydrates at 15°C (Table 2). This finding is consistent with the increase in the biomass yield on glucose observed at this temperature. Less glucose is directed toward carbohydrate synthesis; therefore, a smaller amount of glucose is required to synthesize the same amount of biomass. The observed higher levels of expression of anabolic and catabolic glycogen and trehalose genes at 30°C presumably enhance the cell's ability to rapidly buffer and manage osmotic instability and energy reserves, thus increasing the cell's capacity to regulate the flux of carbohydrates into and out of its glycogen and trehalose stores (15).
The genes in the RPA, RPB, and RPC families encoding RNA polymerase subunits were upregulated at 15°C. These results are consistent with previous findings that showed that there was induction of RNA polymerases at low temperatures (50, 57). Low temperature has also been shown to lead to a decreased rate of translation and stabilization of RNA secondary structures in Escherichia coli (22). Thus, an increased rate of RNA synthesis, coupled to the stabilization of secondary RNA structures, may explain the observed increase in the total RNA content. Moreover, since reserve carbohydrates accounted for a small fraction of the dry cell weight at 15°C, the increased proportion of nitrogen-rich macromolecules (i.e., protein and RNA) may account for the decreased biomass yield on ammonium observed at the low temperature. No significant differences were observed in the RNA and protein contents of the lab and wine yeasts. However, irrespective of temperature, the wine yeast had higher biomass yields on nitrogen than the lab yeast, suggesting that the observed difference in yields could be attributed to the production of nitrogen-containing metabolites.
GCN4 transcript levels were significantly upregulated at 30°C, and no significant differences between the two strains were observed, confirming the reduced rate of protein synthesis observed at this temperature (19). The level of expression of DAL80 was high under all conditions, and there was no significant difference between the strains. This is consistent with the use of ammonia as the sole nitrogen source. We observed strong expression of DAL genes in both strains at both growth temperatures, confirming findings of a previous study in which DAL genes were proposed to be key markers of nitrogen limitation (6). Moreover, the levels of expression of the DAL1, DAL4, and DAL5 genes were higher at 30°C, suggesting that cells grown at this temperature are exposed to increased nitrogen limitation. This suggestion is supported by metabolome data showing that some amino acids accumulated in the cell at 15°C, partly relieving nitrogen limitation (Fig. 1). We propose not only that the DAL genes are markers of nitrogen limitation but also that their expression may indicate the status of “nitrogen stress” within the cell.
Nitrogen metabolism was found to be deregulated in the wine yeast. This yeast simultaneously transports all amino acids with various affinities, and ammonia consumption followed amino acid uptake in this strain (62). Deregulation of nitrogen catabolite repression-responsive genes may provide a competitive advantage to wine yeasts, allowing simultaneous uptake of different nitrogen sources, such as the uptake that occurs in wine fermentations. Transcription data showed that the levels of expression of high-affinity nitrogen transporters and amino acid biosynthetic genes were higher in the lab yeast, whereas in the wine yeast there was increased transcription of anabolic and catabolic genes involved in nitrogen metabolism, suggesting that the lab yeast is more starved for nitrogen than the wine yeast.
There have been previous studies of the influence of a suboptimal temperature on the yeast transcriptional program, but our analysis is the first analysis to use a two-factor design with different strains. We observed a decrease in the temperature stress response at 15°C and different mechanisms of adaptation to growth at suboptimal temperatures.
Conclusions.
Growth at a low temperature alters the biomass composition, increasing the content of nitrogen-rich macromolecules, which leads to a reduction in the biomass yield. In addition to a reduced biomass content, lower sugar uptake rates were observed at a low temperature; both of these factors reduce the fermentation efficiency. However, the two strains used in this study responded differently to growth at the low temperature. The lab yeast could use carbon sources better, as shown by higher fermentation rates, whereas the industrial wine yeast was better adapted for growth in nitrogen-limited media at both temperatures used due to alterations in nitrogen metabolism.
Supplementary Material
Acknowledgments
This research was supported by grants from the Danish Research Agency for Production and Technology and by the Chilean National Counsel for Scientific and Technologic Research (CONICYT project FONDECYT 1050688). M.C.J. was a recipient of an NSF International Research postdoctoral fellowship. A research stay for E.A. at DTU was funded by the Otto Mønsted fund. A research stay for F.J.P. at DTU was funded in part by the Center for Microbial Biotechnology, Biocentrum-DTU, and by DIPUC, Pontificia Universidad Católica de Chile.
Kianoush K. Hansen, Joel Moxley, and Lene Christiansen are recognized for providing technical support and discussions. We thank John Villadsen for fruitful discussions.
Footnotes
Published ahead of print on 22 August 2008.
Supplemental material for this article may be found at http://aem.asm.org/.
REFERENCES
- 1.Affymetrix. 2004. Affymetrix GeneChip expression analysis technical manual. Affymetrix, Santa Clara, CA. http://www.affymetrix.com/support/technical/manual/expression_manual.affx.
- 2.Backhus, L. E., J. DeRisi, P. O. Brown, and L. F. Bisson. 2001. Functional genomic analysis of a commercial wine strain of Saccharomyces cerevisiae under differing nitrogen conditions. FEMS Yeast Res. 1:111-125. [DOI] [PubMed] [Google Scholar]
- 3.Bakalinsky, A., and R. Snow. 1990. The chromosomal constitution of wine strains of Saccharomyces cerevisiae. Yeast 6:367-382. [DOI] [PubMed] [Google Scholar]
- 4.Beltran, G., M. Novo, V. Leberre, S. Sokol, D. Labourdette, J. M. Guillamon, A. Mas, J. Francois, and N. Rozes. 2006. Integration of transcriptomic and metabolic analyses for understanding the global responses of low-temperature winemaking fermentations. FEMS Yeast Res. 6:1167-1183. [DOI] [PubMed] [Google Scholar]
- 5.Bidenne, C., B. Blondin, S. Dequin, and F. Vezinhet. 1992. Analysis of the chromosomal DNA polymorphism of wine strains of Saccharomyces cerevisiae. Curr. Genet. 22:1-7. [DOI] [PubMed] [Google Scholar]
- 6.Boer, V. M., J. H. de Winde, J. T. Pronk, and M. D. Piper. 2003. The genome-wide transcriptional responses of Saccharomyces cerevisiae grown on glucose in aerobic chemostat cultures limited for carbon, nitrogen, phosphorus, or sulfur. J. Biol. Chem. 278:3265-3274. [DOI] [PubMed] [Google Scholar]
- 7.Brandriss, M. C., and B. Magasanik. 1979. Genetics and physiology of proline utilization in Saccharomyces cerevisiae: mutation causing constitutive enzyme expression. J. Bacteriol. 140:504-507. [DOI] [PMC free article] [PubMed] [Google Scholar]
- 8.Castrillo, J. I., L. A. Zeef, D. C. Hoyle, N. Zhang, A. Hayes, D. C. J. Gardner, M. J. Cornell, J. Petty, L. Hakes, and L. Wardleworth. 2007. Growth control of the eukaryote cell: a systems biology study in yeast. J. Biol. 6:4. [DOI] [PMC free article] [PubMed] [Google Scholar]
- 9.Codon, A., J. Gasent-Ramirez, and T. Benitez. 1995. Factors which affect the frequency of sporulation and tetrad formation in Saccharomyces cerevisiae baker's yeasts. Appl. Environ. Microbiol. 61:630-638. [DOI] [PMC free article] [PubMed] [Google Scholar]
- 10.Colman-Lerner, A., T. E. Chin, and R. Brent. 2001. Yeast Cbk1 and Mob2 activate daughter-specific genetic programs to induce asymmetric cell fates. Cell 107:739-750. [DOI] [PubMed] [Google Scholar]
- 11.Daran-Lapujade, P., J. M. Daran, P. Kotter, T. Petit, M. D. Piper, and J. T. Pronk. 2003. Comparative genotyping of the Saccharomyces cerevisiae laboratory strains S288C and CEN.PK113-7D using oligonucleotide microarrays. FEMS Yeast Res. 4:259-269. [DOI] [PubMed] [Google Scholar]
- 12.de Koning, W., and K. van Dam. 1992. A method for the determination of changes of glycolytic metabolites in yeast on a subsecond time scale using extraction at neutral pH. Anal. Biochem. 204:118-123. [DOI] [PubMed] [Google Scholar]
- 13.Dorrington, R. A., and T. G. Cooper. 1993. The DAL82 protein of Saccharomyces cerevisiae binds to the DAL upstream induction sequence (UIS). Nucleic Acids Res. 21:3777-3784. [DOI] [PMC free article] [PubMed] [Google Scholar]
- 14.Ferea, T. L., D. Botstein, P. O. Brown, and R. F. Rosenzweig. 1999. Systematic changes in gene expression patterns following adaptive evolution in yeast. Proc. Natl. Acad. Sci. USA 96:9721-9726. [DOI] [PMC free article] [PubMed] [Google Scholar]
- 15.Gasch, A., P. Spellman, C. Kao, O. Carmel-Harel, M. Eisen, G. Storz, D. Botstein, and P. Brown. 2000. Genomic expression programs in the response of yeast cells to environmental changes. Mol. Biol. Cell 11:4241-4257. [DOI] [PMC free article] [PubMed] [Google Scholar]
- 16.Goffeau, A., R. Aert, M. Agostini-Carbone, A. Ahmed, M. Aigle, L. Alberghina, K. Albermann, M. Albers, M. Aldea, and D. Alexandraki. 1997. The yeast genome directory. Nature 387:5. [Google Scholar]
- 17.Graumann, P., K. Schroder, R. Schmid, and M. A. Marahiel. 1996. Cold shock stress-induced proteins in Bacillus subtilis. J. Bacteriol. 178:4611-4619. [DOI] [PMC free article] [PubMed] [Google Scholar]
- 18.Hauser, N., K. Fellenberg, R. Gil, S. Bastuck, J. Hoheisel, and J. Perez-Ortin. 2001. Whole genome analysis of a wine yeast strain. Comp. Funct. Genomics 2:69-79. [DOI] [PMC free article] [PubMed] [Google Scholar]
- 19.Hinnebusch, A. 2005. Translational regulation of GCN4 and the general amino acid control of yeast. Annu. Rev. Microbiol. 59:407-450. [DOI] [PubMed] [Google Scholar]
- 20.Hohmann, S., and H. Cederberg. 1990. Autoregulation may control the expression of yeast pyruvate decarboxylase structural genes PDC1 and PDC5. Eur. J. Biochem. 188:615-621. [DOI] [PubMed] [Google Scholar]
- 21.Jones, P. G., and M. Inouye. 1994. The cold-shock response—a hot topic. Mol. Microbiol. 11:811-818. [DOI] [PubMed] [Google Scholar]
- 22.Jones, P. G., and M. Inouye. 1996. RbfA, a 30S ribosomal binding factor, is a cold-shock protein whose absence triggers the cold-shock response. Mol. Microbiol. 21:1207-1218. [DOI] [PubMed] [Google Scholar]
- 23.Kim, J., E. Bortz, H. Zhong, T. Leeuw, E. Leberer, A. K. Vershon, and J. P. Hirsch. 2000. Localization and signaling of Gβ subunit Ste4p are controlled by a-factor receptor and the a-specific protein Asg7p. Mol. Cell. Biol. 20:8826-8835. [DOI] [PMC free article] [PubMed] [Google Scholar]
- 24.Kjeldsen, T. 2000. Yeast secretory expression of insulin precursors. Appl. Microbiol. Biotechnol. 54:277-286. [DOI] [PubMed] [Google Scholar]
- 25.Klein, C., L. Olsson, and J. Nielsen. 1998. Glucose control in Saccharomyces cerevisiae: the role of MIG1 in metabolic functions. Microbiology 144:13-24. [DOI] [PubMed] [Google Scholar]
- 26.Kurihara, L. J., B. G. Stewart, A. E. Gammie, and M. D. Rose. 1996. Kar4p, a karyogamy-specific component of the yeast pheromone response pathway. Mol. Cell. Biol. 16:3990-4002. [DOI] [PMC free article] [PubMed] [Google Scholar]
- 27.Lorenz, M. C., and J. Heitman. 1998. The MEP2 ammonium permease regulates pseudohyphal differentiation in Saccharomyces cerevisiae. EMBO J. 17:1236-1247. [DOI] [PMC free article] [PubMed] [Google Scholar]
- 28.Marini, A. M., S. Soussi-Boudekou, S. Vissers, and B. Andre. 1997. A family of ammonium transporters in Saccharomyces cerevisiae. Mol. Cell. Biol. 17:4282-4293. [DOI] [PMC free article] [PubMed] [Google Scholar]
- 29.Martinez-Pastor, M. T., G. Marchler, C. Schuller, A. Marchler-Bauer, H. Ruis, and F. Estruch. 1996. The Saccharomyces cerevisiae zinc finger proteins Msn2p and Msn4p are required for transcriptional induction through the stress response element (STRE). EMBO J. 15:2227-2235. [PMC free article] [PubMed] [Google Scholar]
- 30.Maury, J., M. Asadollahi, K. Moller, A. Clark, and J. Nielsen. 2005. Microbial isoprenoid production: an example of green chemistry through metabolic engineering. Adv. Biochem. Eng. Biotechnol. 100:19-51. [DOI] [PubMed] [Google Scholar]
- 31.Miklos, G., and G. Rubin. 1996. The role of the genome project in determining gene function: insights from model organisms. Cell 86:521-529. [DOI] [PubMed] [Google Scholar]
- 32.Mortimer, R. K., and J. R. Johnston. 1986. Genealogy of principal strains of the yeast genetic stock center. Genetics 113:35-43. [DOI] [PMC free article] [PubMed] [Google Scholar]
- 33.Mrsa, V., F. Klebl, and W. Tanner. 1993. Purification and characterization of the Saccharomyces cerevisiae BGL2 gene product, a cell wall endo-beta-1,3-glucanase. J. Bacteriol. 175:2102-2106. [DOI] [PMC free article] [PubMed] [Google Scholar]
- 34.Nasmyth, K., and D. Shore. 1987. Transcriptional regulation in the yeast life cycle. Science 237:1162-1170. [DOI] [PubMed] [Google Scholar]
- 35.Nelson, B., A. B. Parsons, M. Evangelista, K. Schaefer, K. Kennedy, S. Ritchie, T. L. Petryshen, and C. Boone. 2004. Fus1p interacts with components of the Hog1p mitogen-activated protein kinase and Cdc42p morphogenesis signaling pathways to control cell fusion during yeast mating. Genetics 166:67-77. [DOI] [PMC free article] [PubMed] [Google Scholar]
- 36.Nielsen, J., and M. C. Jewett. 2008. Impact of systems biology on metabolic engineering of Saccharomyces cerevisiae. FEMS Yeast Res. 8:122-131. [DOI] [PubMed] [Google Scholar]
- 37.Nikolaou, E. S. E. H., E. Bouloumpasi, and N. Tzanetakis. 2006. Selection of indigenous Saccharomyces cerevisiae strains according to their oneological characteristics and vinification results. Food Microbiol. 23:205-211. [DOI] [PubMed] [Google Scholar]
- 38.Panoff, J. M., B. Thammavongs, M. Gueguen, and P. Boutibonnes. 1998. Cold stress responses in mesophilic bacteria. Cryobiology 36:75-83. [DOI] [PubMed] [Google Scholar]
- 39.Parrou, J., and J. Francois. 1997. A simplified procedure for a rapid and reliable assay of both glycogen and trehalose in whole yeast cells. Anal. Biochem. 248:186-188. [DOI] [PubMed] [Google Scholar]
- 40.Patil, K. R., and J. Nielsen. 2005. Uncovering transcriptional regulation of metabolism by using metabolic network topology. Proc. Natl. Acad. Sci. USA 102:2685-2689. [DOI] [PMC free article] [PubMed] [Google Scholar]
- 41.Perez, M., K. Luyten, R. Michel, C. Riou, and B. Blondin. 2005. Analysis of Saccharomyces cerevisiae hexose carrier expression during wine fermentation: both low- and high-affinity Hxt transporters are expressed. FEMS Yeast Res. 5:351-361. [DOI] [PubMed] [Google Scholar]
- 42.Perez-Coello, M. S., A. I. Briones Perez, J. F. Ubeda Iranzo, and P. J. Martin Alverez. 1999. Characteristics of wine fermented with different Saccharomyces cerevisiae strains isolated from La Mancha region. Food Microbiol. 14:247-254. [Google Scholar]
- 43.Perez-Ortin, J., J. Garcia-Martinez, and T. Alberola. 2002. DNA chips for yeast biotechnology. The case of wine yeasts. J. Biotechnol. 98:227-241. [DOI] [PubMed] [Google Scholar]
- 44.Piper, M. D., P. Daran-Lapujade, C. Bro, B. Regenberg, S. Knudsen, J. Nielsen, and J. T. Pronk. 2002. Reproducibility of oligonucleotide microarray transcriptome analyses. An interlaboratory comparison using chemostat cultures of Saccharomyces cerevisiae. J. Biol. Chem. 277:37001-37008. [DOI] [PubMed]
- 45.Pizarro, F., F. Vargas, and E. Agosin. 2007. A systems biology perspective of wine fermentations. Yeast 24:977-991. [DOI] [PubMed] [Google Scholar]
- 46.Rachidi, N., P. Barre, and B. Blondin. 1999. Multiple Ty-mediated chromosomal translocations lead to karyotype changes in a wine strain of Saccharomyces cerevisiae. Mol. Gen. Genet. 261:841-850. [DOI] [PubMed] [Google Scholar]
- 47.Regenberg, B., T. Grotkjær, O. Winther, A. Fausbøll, M. Åkesson, C. Bro, L. K. Hansen, S. Brunak, and J. Nielsen. 2006. Growth-rate regulated genes have profound impact on interpretation of transcriptome profiling in Saccharomyces cerevisiae. Genome Biol. 7:R107. [DOI] [PMC free article] [PubMed] [Google Scholar]
- 48.Rossignol, T., L. Dulau, A. Julien, and B. Blondin. 2003. Genome-wide monitoring of wine yeast gene expression during alcoholic fermentation. Yeast 20:1369-1385. [DOI] [PubMed] [Google Scholar]
- 49.Rossignol, T., O. Postaire, J. Storai, and B. Blondin. 2006. Analysis of the genomic response of a wine yeast to rehydration and inoculation. Appl. Microbiol. Biotechnol. 71:699-712. [DOI] [PubMed] [Google Scholar]
- 50.Sahara, T., T. Goda, and S. Ohgiya. 2002. Comprehensive expression analysis of time-dependent genetic responses in yeast cells to low temperature. J. Biol. Chem. 277:50015-50021. [DOI] [PubMed] [Google Scholar]
- 51.Saint-Prix, F., L. Bonquist, and S. Dequin. 2004. Functional analysis of the ALD gene family of Saccharomyces cerevisiae during anaerobic growth on glucose: the NADP+-dependent Ald6p and Ald5p isoforms play a major role in acetate formation. Microbiology 150:2209-2220. [DOI] [PubMed] [Google Scholar]
- 52.Schade, B., G. Jansen, M. Whiteway, K. D. Entian, and D. Y. Thomas. 2004. Cold adaptation in budding yeast. Mol. Biol. Cell 15:5492-5502. [DOI] [PMC free article] [PubMed] [Google Scholar]
- 53.Spellman, P. T., G. Sherlock, M. Q. Zhang, V. R. Iyer, K. Anders, M. B. Eisen, P. O. Brown, D. Botstein, and B. Futcher. 1998. Comprehensive identification of cell cycle-regulated genes of the yeast Saccharomyces cerevisiae by microarray hybridization. Mol. Biol. Cell 9:3273-3297. [DOI] [PMC free article] [PubMed] [Google Scholar]
- 54.Styczynski, M. P., J. Moxley, L. V. Tong, J. Walther, K. L. Jensen, and G. Stephanopoulos. 2007. Systematic identification of conserved metabolites in GC/MS data for metabolomics and biomarker discovery. Anal. Chem. 79:966-973. [DOI] [PubMed] [Google Scholar]
- 55.Tai, S. L., V. M. Boer, P. Daran-Lapujade, M. C. Walsh, J. H. de Winde, J. M. Daran, and J. T. Pronk. 2005. Two-dimensional transcriptome analysis in chemostat cultures. Combinatorial effects of oxygen availability and macronutrient limitation in Saccharomyces cerevisiae. J. Biol. Chem. 280:437-447. [DOI] [PubMed] [Google Scholar]
- 56.Tai, S. L., P. Daran-Lapujade, M. A. H. Luttik, M. C. Walsh, J. A. Diderich, G. C. Krijger, W. M. van Gulik, J. T. Pronk, and J. M. Daran. 2007. Control of the glycolytic flux in Saccharomyces cerevisiae grown at low temperature: a multi-level analysis in anaerobic chemostat cultures. J. Biol. Chem. 282:10243-10251. [DOI] [PubMed] [Google Scholar]
- 57.Tai, S. L., P. Daran-Lapujade, M. C. Walsh, J. T. Pronk, and J. M. Daran. 2007. Acclimation of Saccharomyces cerevisiae to low temperature: a chemostat-based transcriptome analysis. Mol. Biol. Cell 18:5100-5112. [DOI] [PMC free article] [PubMed] [Google Scholar]
- 58.Tusher, V. G., R. Tibshirani, and G. Chu. 2001. Significance analysis of microarrays applied to the ionizing radiation response. Proc. Natl. Acad. Sci. USA 98:5116-5121. [DOI] [PMC free article] [PubMed] [Google Scholar]
- 59.van den Berg, M. A., P. de Jong-Gubbels, C. J. Kortland, J. P. van Dijken, J. T. Pronk, and H. Y. Steensma. 1996. The two acetyl-coenzyme A synthetases of Saccharomyces cerevisiae differ with respect to kinetic properties and transcriptional regulation. J. Biol. Chem. 271:28953-28959. [DOI] [PubMed] [Google Scholar]
- 60.van Dijken, J. P., J. Bauer, L. Brambilla, P. Duboc, J. M. Francois, C. Gancedo, M. L. F. Giuseppin, J. J. Heinen, M. Hoare, H. C. Lange, E. A. Madden, P. Niederberger, J. Nielsen, J. L. Parrou, T. Petit, D. Porro, M. Reuss, N. van Riel, M. Rizzi, H. Y. Steensma, C. T. Verrips, J. Vindelov, and J. T. Pronk. 2000. An interlaboratory comparison of physiological and genetic properties of four Saccharomyces cerevisiae strains. Enzyme Microb. Technol. 26:706-714. [DOI] [PubMed] [Google Scholar]
- 61.Varela, C., J. Cardenas, F. Melo, and E. Agosin. 2005. Quantitative analysis of wine yeast gene expression profiles under winemaking conditions. Yeast 22:369-383. [DOI] [PubMed] [Google Scholar]
- 62.Varela, C., F. Pizarro, and E. Agosin. 2004. Biomass content governs fermentation rate in nitrogen-deficient wine musts. Appl. Environ. Microbiol. 70:3392-3400. [DOI] [PMC free article] [PubMed] [Google Scholar]
- 63.Verduyn, C., E. Postma, W. A. Scheffers, and J. P. Van Dijken. 1992. Effect of benzoic acid on metabolic fluxes in yeasts: a continuous-culture study on the regulation of respiration and alcoholic fermentation. Yeast 8:501-517. [DOI] [PubMed] [Google Scholar]
- 64.Villas-Boas, S. G., J. Hojer-Pedersen, M. Akesson, J. Smedsgaard, and J. Nielsen. 2005. Global metabolite analysis of yeast: evaluation of sample preparation methods. Yeast 22:1155-1169. [DOI] [PubMed] [Google Scholar]
- 65.Villas-Boas, S. G., J. F. Moxley, M. Akesson, G. Stephanopoulos, and J. Nielsen. 2005. High-throughput metabolic state analysis: the missing link in integrated functional genomics of yeasts. Biochem. J. 388:669-677. [DOI] [PMC free article] [PubMed] [Google Scholar]
- 66.Visser, W., W. A. Scheffers, W. H. Batenburg-van der Vegte, and J. P. van Dijken. 1990. Oxygen requirements of yeasts. Appl. Environ. Microbiol. 56:3785-3792. [DOI] [PMC free article] [PubMed] [Google Scholar]
- 67.Watson, K. 1987. Temperature relations, p. 41-71. In A. H. Rose and J. S. Harrison (ed.), The yeasts, vol. 2. Academic Press, London, United Kingdom. [Google Scholar]
- 68.Zaldivar, J., A. Borges, B. Johansson, H. P. Smits, S. G. Villas-Boas, J. Nielsen, and L. Olsson. 2002. Fermentation performance and intracellular metabolite patterns in laboratory and industrial xylose-fermenting Saccharomyces cerevisiae. Appl. Microbiol. Biotechnol. 59:436-442. [DOI] [PubMed] [Google Scholar]
- 69.Zhao, H., Z. M. Shen, P. C. Kahn, and P. N. Lipke. 2001. Interaction of α-agglutinin and a-agglutinin, Saccharomyces cerevisiae sexual cell adhesion molecules. J. Bacteriol. 183:2874-2880. [DOI] [PMC free article] [PubMed] [Google Scholar]
Associated Data
This section collects any data citations, data availability statements, or supplementary materials included in this article.