

Abstract
Molecular Recognition Features (MoRFs) are short, interaction-prone segments of protein disorder that undergo disorder-to-order transitions upon specific binding, representing a specific class of intrinsically disordered regions that exhibit molecular recognition and binding functions. MoRFs are common in various proteomes and occupy a unique structural and functional niche in which function is a direct consequence of intrinsic disorder. Example MoRFs collected from the Protein Data Bank (PDB) have been divided into three subtypes according to their structures in the bound state: α-MoRFs form α-helices, β-MoRFs form β-strands, and ι-MoRFs form structures without a regular pattern of backbone hydrogen bonds. These example MoRFs were indicated to be intrinsically disordered in the absence of their binding partners by several criteria. In this study we used several geometric and physiochemical criteria to examine the properties of 62 α-, 20 β- and 176 ι-MoRF complex structures. Interface residues were examined by calculating differences in accessible surface area between the complex and isolated monomers. The compositions and physiochemical properties of MoRF and MoRF partner interface residues were compared to the interface residues of homodimers, heterodimers, and antigen-antibody complexes. Our analysis indicates that there are significant differences in residue composition and several geometric and physicochemical properties that can be used to discriminate, with a high degree of accuracy, between various interfaces in protein interaction datasets. Implications of these findings for the development of MoRF-partner interaction predictors are discussed. In addition, structural changes upon MoRF-to-partner complex formation were examined for several illustrative examples.
Keywords: intrinsic disorder, molecular recognition, signaling, protein-protein interaction, MoRF
Protein-protein interaction sites have been intensively analyzed by different researchers to understand the molecular determinants of protein recognition and to identify specific characteristics of protein-protein interfaces.1–18 Different aspects of interaction sites, including residue propensities, residue pairing preferences, hydrophobicity, size, shape, solvent accessibility, and hydrogen bond protection, have all been examined. Although each of these parameters provides some information indicative of protein-protein interaction sites, none of them perfectly differentiates interaction sites from noninteracting protein surfaces. Protein interaction sites have been observed to be hydrophobic, planar, globular and protruding.1, 2, 4, 8, 9, 16 Furthermore, interfaces in different types of even the simplest protein complexes (e.g., homodimers, heterodimers) have different properties 9, 11, 15. Homocomplexes are often permanent and optimized, whereas many heterocomplexes are nonobligatory, associating and disassociating according to the environmental or external factors and involve proteins that must also exist independently.9 Subunit interfaces in stable oligomeric proteins tend to closely resemble the protein core with respect to hydrophobicity and residue composition. In contrast, the interfaces in transient protein-protein complexes were shown to be relatively close to the protein exterior in composition, with the residues usually being smaller and more polar than those in the interaction surfaces of stable oligomers.9, 16, 17
Despite the intensive scrutiny applied to protein-protein interactions, a model of sufficient quality to reliably predict protein-protein interactions from unbound structures remains elusive.19 To clarify, by interaction prediction we mean the prediction of low resolution information from sequence or structure, information such as identities of interacting partners or interacting residues from specific partners. The relevance of this problem increases daily, as the structures of mono- or homomultimeric proteins are continually produced by structural genomics centers.20
One reason for the lack of a good interaction model is the generally invalid assumption of a static protein backbone upon protein-protein complex formation. The static structure assumption has been ubiquitous in protein-protein docking, until recently, and in the prediction of interaction surface patches. Relaxing the static structure assumption indeed increases the accuracy of solutions to the unbound-unbound problem for structures with limited backbone mobility,21 but no methods that include flexibility in the prediction of interaction patches have been reported. Even methods that included consideration of backbone flexibility are not effective for proteins with large scale backbone movements, due to inefficient exploration of the large, accessible conformational space of these proteins.22
The complexity of the interaction prediction problem is compounded when intrinsically disordered proteins (IDPs) are considered. IDPs lack a stable three-dimensional structure in solution, with conformations that fluctuate over time and populations. These proteins are characterized by a lack of tertiary structure; by a lack of, or the transient formation of, secondary structure; and by a hydrodynamic radius corresponding to that of a random polymer in poor solvent,23 which falls between a random-walk polymer and a compact globule. Consequently, three-dimensional structure determination is simply inapplicable to such proteins, since no equilibrium structure exists, although advances have been made in deducing conformational biases within the ensemble of conformers.24 Although structure determination methods are inapplicable to IDPs in isolation, this is not necessarily the case when IDPs are bound to molecular partners. Many IDPs, such as those examined here, perform molecular recognition functions, undergoing a disorder-to-order transitions upon binding to their partners.25–27 This disorder-to-order phenomenon has recently been exploited to obtain the structure of an IDP that had previously failed in the high-throughput structure determination pipeline of structural genomics.28 The approach of crystallizing IDPs in the presence of their molecular binding partners promises to greatly increase the number of proteins amenable to the structural genomics methodology.
IDPs are prevalent in the proteomes of higher organisms29–31 and are thought to play a central role in molecular recognition,27 particularly in interaction-mediated signaling events.25 The advantages of IDPs in this role are many, including the decoupling of specificity and affinity,32 the ability to recognize multiple partners through adoption of different conformations,33 and faster on-rates34 due perhaps to the fly-casting35 or fishing36 mechanism. Clearly, the current approach to the computational unbound-unbound problem is intractable for IDPs and, given their relevance to a broad class of interaction-mediated signaling events, new methods are needed for prediction of the interaction complexes of IDPs.
Toward this goal, we have recently proposed an algorithm that is able to find a specific structural element that mediates many of the binding events of IDPs.32 These structural elements were termed α-helical Molecular Recognition Features (α-MoRFs) and consist of short regions – on the order of 20 residues – that undergo disorder-to-order transitions and that form α-helices upon binding to their partners. Furthermore, these regions are typically flanked with regions of intrinsic disorder.32 These α-MoRFs are members of a wider class of short, interaction-prone segments of protein disorder that undergo disorder-to-order transitions upon specific binding.
We have recently mined the PDB for proteins that fit the general MoRF model of disorder-mediated protein interactions.33 The resulting dataset consists of 372 examples that are very likely to be disordered prior to binding their protein partners, as shown by both sequence- and structure-based predictions33 Therefore, all or nearly all of these examples conform to the MoRF hypothesis. These MoRFs were separated into four major groups based on their secondary structure content: α-MoRFs, which form α-helices; β-MoRFs, which form β-strands or β-sheets; ι-MoRFs, which have irregular, non-repeating psi- and phi- angles; and complex-MoRFs, which have two or more secondary structure types of about equal abundance (see Figure 1). While many of the MoRFs contain regions of polyproline II (PPII) helix,33 this structural form does not represent the predominant secondary structure for any of the examples found to date. Thus, at least for now we have not been able to assemble a PPII-MoRF set.
Figure 1. Examples of types of MoRFs.
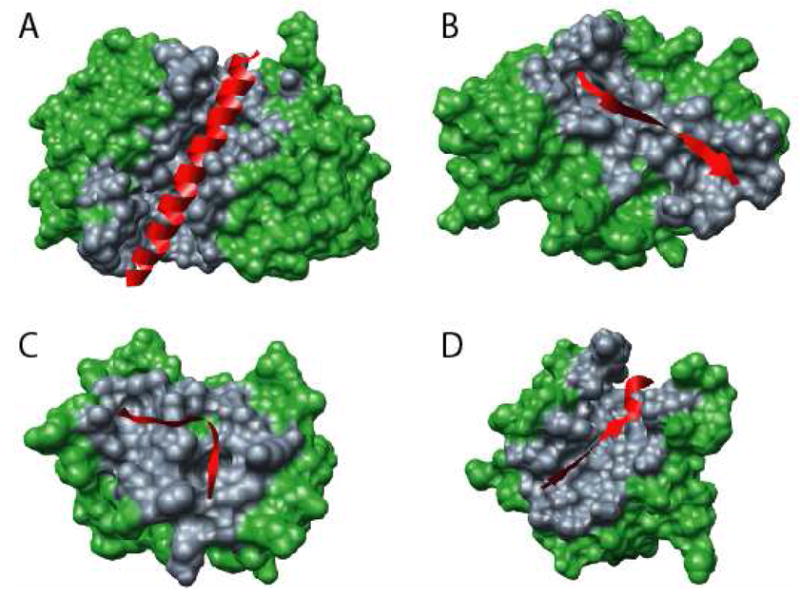
MoRFs (red ribbons) and partners (green surface) are shown (A) An α-MoRF, Proteinase Inhibitor IA3, bound to Proteinase A (PDB entry 1DP5). (B) A β-MoRF, viral protein pVIc, bound to Human Adenovirus 2 Proteinase (PDB entry 1AVP). (C) An ι-MoRF, Amphiphysin, bound to α-adaptin C (PDB entry 1KY7). (D) A complex-MoRF, β-amyloid precursor protein (βAPP), bound to the PTB domain of the neuron specific protein X11 (PDB entry 1X11). Partner interfaces (grey surface) are also indicated.
The goal of the present work is to investigate the properties of 62 α-, 20 β- and 176 ι-MoRF-partner interactions by identifying and characterizing the interactions sites in terms of residue composition, interface geometry, and physicochemical features, relative to well studied interfaces including homodimers, large and small protomers from hetero-complexes, and antigens in antigen-antibody complexes. The degree of similarity between the datasets was quantified, using a set of surface residues from monomeric protein structures as a control. We found that there were significant differences in residue composition and in several geometric and physicochemical properties between the interfaces in the various protein interaction datasets. In addition, the phenomenon of disorder-to-order transitions in both MoRFs and their partners was explored, as well as conformational changes induced in partners by MoRF binding. We conclude with a discussion of the implications of these findings on the future development of a MoRF-partner interaction predictor.
Materials and Methods
Datasets
The MoRF dataset was extracted from the Protein Data Bank37, as a non-redundant collection of protein segments more than 10 but less than 70 residues in length and bound to globular proteins. We used 10 as a lower bound to reduce the chance of including chameleon segments,38 the longest of which so far observed are 8 residues in length.39 Chameleon segments have identical local amino sequences but exist in unrelated proteins and typically have completely different secondary structures.38, 40 We used 70 as an upper bound because, above this length, the proteins are very often globular or very often contain globular domains.
Out of the 372 MoRF examples identified in our previous work33, 258 were classified as α-, β-, or ι-MoRFs, based on their secondary structure content, where classification was based on the secondary structure type having the largest percentage value. The remaining examples with no clear preponderance of one secondary structure type – i.e. nearly equal (±1%) values for the top two or more secondary structure types – were classified as complex-MoRFs and were not examined here. In order to understand how MoRF binding affects the structure of MoRF partners, PDB was searched for structures of MoRF partners with and without corresponding MoRFs and the 50 pairs found were further analyzed.
Non-redundant collections of homodimers, hetero- and antigen-antibody complexes were taken from studies by Jones and Thornton10, 11 and Lo Conte et al.13 and used as controls in the study of protein-protein interfaces. The dataset of monomeric proteins is a sample of monomeric structures from the Protein Quaternary Structure file server (http://pqs.ebi.ac.uk). A summary of the datasets is given in Table 1. Atom coordinates for proteins in all datasets were extracted from the September 2005 revision of the PDB.
Table 1.
Description of protein datasets.
| Dataset | Number | Average length (residues) |
|---|---|---|
| α-MoRFs | 62 | 33±16 |
| β-MoRFs | 20 | 25±19 |
| ι-MoRFs | 176 | 24±17 |
| α-MoRF partners | 62 | 231±154 |
| β-MoRF partners | 20 | 198±98 |
| ι-MoRF partners | 176 | 245±117 |
| Homodimers | 16 | 185±103 |
| Hetero-complex (large protomers) | 16 | 290±118 |
| Hetero-complex (small protomers) | 18 | 79±34 |
| Antibody-antigen complex | 12 | 154±81 |
| Monomeric proteins | 650 | 284±176 |
Identification of Surface and Interface Residues
Protein surfaces and interfaces were analyzed at the residue level. The Molecular Surface (MS) software from Biohedron (http://www.biohedron.com), which is an implementation of the Connolly surface algorithm,41 was run for individual chains and for complexes to determine the solvent accessible surfaces for each. Residues directly involved in interactions were identified from molecular structures as residues with the change in ASA on complex formation greater than 1 Å2(refs 10, 11). This process has been illustrated in Figure 2. All calculations used a probe radius of 1.4 Å, which roughly corresponds to the size of a water molecule.
Figure 2. Illustration of interface ΔASA and identification of contact residues.
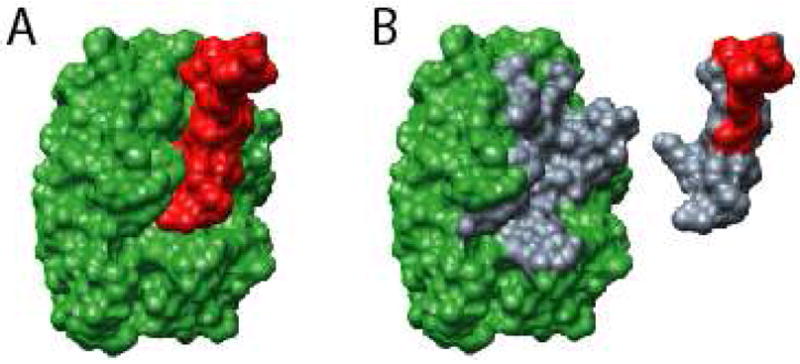
Shown for the purpose of illustration is an ι-MoRF, Bowman-Birk type Trypsin Inhibitor, (A, red surface) bound to Trypsinogen (A, green surface) taken from PDB entry 1G9I. ASA is calculated for the complex (A) and the artificial monomers (B) separately to obtain ΔASA of complex formation. ASA can be attributed to individual residues, thereby allowing determination of residues involved in binding (B, grey surfaces).
For examination of the solvent exposure of interface residues and the determination of surface residues, the relative accessible surface area (RASA) was used. This measure normalizes the observed ASA of a residue by the ASA of a residue X in an extended Ala-X-Ala tripeptide, Following the work of Miller at al., a residue was considered to be on the surface of a protein if the RASA of the residue was greater than 5%.42
Amino Acid Composition Profiles
Analysis of amino acid composition in the MoRF datasets was based on a modification of a previously described approach.43 The fractional difference between the composition of interface residues (ICX) from a given dataset and the composition of surface residues (SCmonomers) of monomeric proteins from PDB was calculated. Residue composition was estimated as the mean of the frequency of a particular residue in 100,000 pseudoreplicate datasets obtained by bootstrap sampling44 from the set of interface residues. The fractional difference was calculated as (ICX-SCmonomer)/SCmonomer. A plot of this value for each of the 20 amino acids gives an interface composition profile.
Relative Entropy
If we consider amino acid compositions of two samples of interaction sites P and Q to be generated independently, each by a separate stochastic process according to probability distributions p and q, we can express the similarities in residue compositions of different datasets using relative entropy, H (p||q). Using the frequencies of residues as the maximum likelihood estimate for the underlying probability distributions p and q, relative entropy of the sample P with respect to the sample Q is defined as:
| (1) |
where pk and qk are relative frequencies of the 20 amino acids in the two samples.45 Relative entropy is always greater than or equal to zero, with equality achieved only when residue compositions are identical.
Relative entropy was used as the test statistic to evaluate the statistical significance of differences in observed ICX distributions. P-values were estimated under the null hypothesis that residue compositions of the two interface types come from the same underlying distribution. In each bootstrap iteration, samples for the two sets were generated by pooling the two interface datasets and sampling whole interfaces from each with replacement. This procedure was repeated 100,000 times and the p-value was calculated as the number of occurrences of relative entropy values equal to or greater than the observed value.
In assessing the significance of results, the type I error rate – i.e. the rate at which the null hypothesis is incorrectly rejected – is controlled by the selection of alpha value, typically selected to be 0.05. This p-value cutoff implies that 1 out of 20 significance test will incorrectly reject the null hypothesis. When many significance tests are performed in a single experiment, this implies that many incorrect hypotheses will be accepted. In testing the significance of relative entropy values, 55 individual significance tests are performed, which means that one would expect that the null hypothesis would be rejected incorrectly at least twice. That is, the experiment-wise type I error rate becomes 2.25. Several methods are available to adjust the experiment-wise type I error rate to more reasonable levels. Here a conservative approach, the Bonferroni adjustment,46 is used to adjust the experiment-wise type I error rate to 0.05. This was done by dividing the alpha value of 0.05 by the number of individual significance tests, which gives a p-value cutoff of 9.1×10⁻⁴.
Geometry and Physicochemical Properties of Interfaces
In order to differentiate MoRF-partner from other protein-protein interactions, size, accessible surface area, and planarity were used to describe the geometry of binding sites. Aromatic content, total and net charge, hydrophobicity, surface exposure, interface propensity, and flexibility were used to describe the major physico-chemical properties of interface residues. The sizes of all sets of interfaces were calculated in terms of number of residues as well as the ASA of all residues participating in the interaction. The planarity of the interface is given by the RMSD of all the atoms in the interface to the least square error fitting to a plane. Aromatic content of an interface was based on the total number of aromatic residues (i.e., Phe, Trp, Tyr). Total and net charges were calculated from residue identities as the sum or difference, respectively, of the number of positive and negative residues. All counts were averaged over the number of residues comprising the interface. Other properties calculated were means of the values assigned to interface residues by various scales: the surface exposure index of Janin and co-workers,47 the flexibility index of Vihinen and co-workers,48 the hydropathy scale of Fauchere and Pliska,49 and the residue interface propensity of Jones and Thornton.9
Classification of Interface Types
Classification of interface types was performed using a naïve Bayes classifier, a simple probabilistic classifier which assumes conditional independence between attributes. Despite this relatively strong assumption that often does not hold in practice, it is an optimal linear classifier under zero-one loss even when the attribute independence assumption is violated by a huge margin.50 In our initial experiments, Bayes was found to perform better than logistic regression or support vector classifiers (results not shown). Naïve Bayes was implemented in Matlab, where kernel density estimates were used to model parameter distributions. Classification was made on a one-versus-all (OVA) basis, where a positive dataset made up one class and the remaining datasets were assigned to a negative class. This was repeated for all datasets and prediction accuracy was evaluated by leave-one-out cross validation, which is a standard validation method when one of the classes has very few examples. In the leave-one-out procedure, the following is repeated for each interface: an interface was removed from the dataset, the model was trained, and the prediction accuracy for the left-out example was assessed. Since the training sets were not balanced in the number of positive and negative examples, both the sensitivity and specificity are reported, in addition to the overall accuracy. In this context, sensitivity is the fraction of correct predictions for the interface type in question and specificity is the fraction of correct predictions for all other interface types.
Prior to classifier training, a subset of features was selected by a two-sample t-test between values of individual parameters in the positive and negative classes. 33 possible attributes were considered in the selection process: interface ASA, relative interface ASA, fraction of the protein surface occupied by the interface, interface size in terms of number of residues, fraction of all residues which participate in the interface, interface planarity, hydrophobicity, flexibility, interface propensity, surface exposure, net and total charge, aromatic content and 20 attributes representing amino acid content of the interfaces defined as fractions of all interface residues. Only features with p-value lower than 0.5 were kept.
Results
Datasets
Previous observations indicated that the structural and sequence properties of different MoRF subtypes might be significantly different from each other.32, 33 Accordingly, the previously compiled MoRF dataset33 was broken into the α-, β-, and ι-MoRF subsets (Table 1), based on a predominant content of helix, strand, or irregular structure, respectively (see Materials and Methods). Non-redundant collections of homodimers, hetero- and antigen-antibody complexes were used as controls, allowing for the comparison of MoRF interfaces with previously studied interface types.
Analysis of amino acid compositions
The composition of the interface residues of all datasets were examined relative to amino acid composition of surface residues from monomeric proteins (Figure 3), which here provides the background amino acid distribution. Fractional relative compositions are shown arranged from left to right by increasing surface exposure in globular proteins, according to the Janin scale.47 On this scale, the dividing line between mostly buried and mostly exposed residues occurs between tryptophan and histidine.
Figure 3. Compositional profiles of the interface residues of MoRFs.
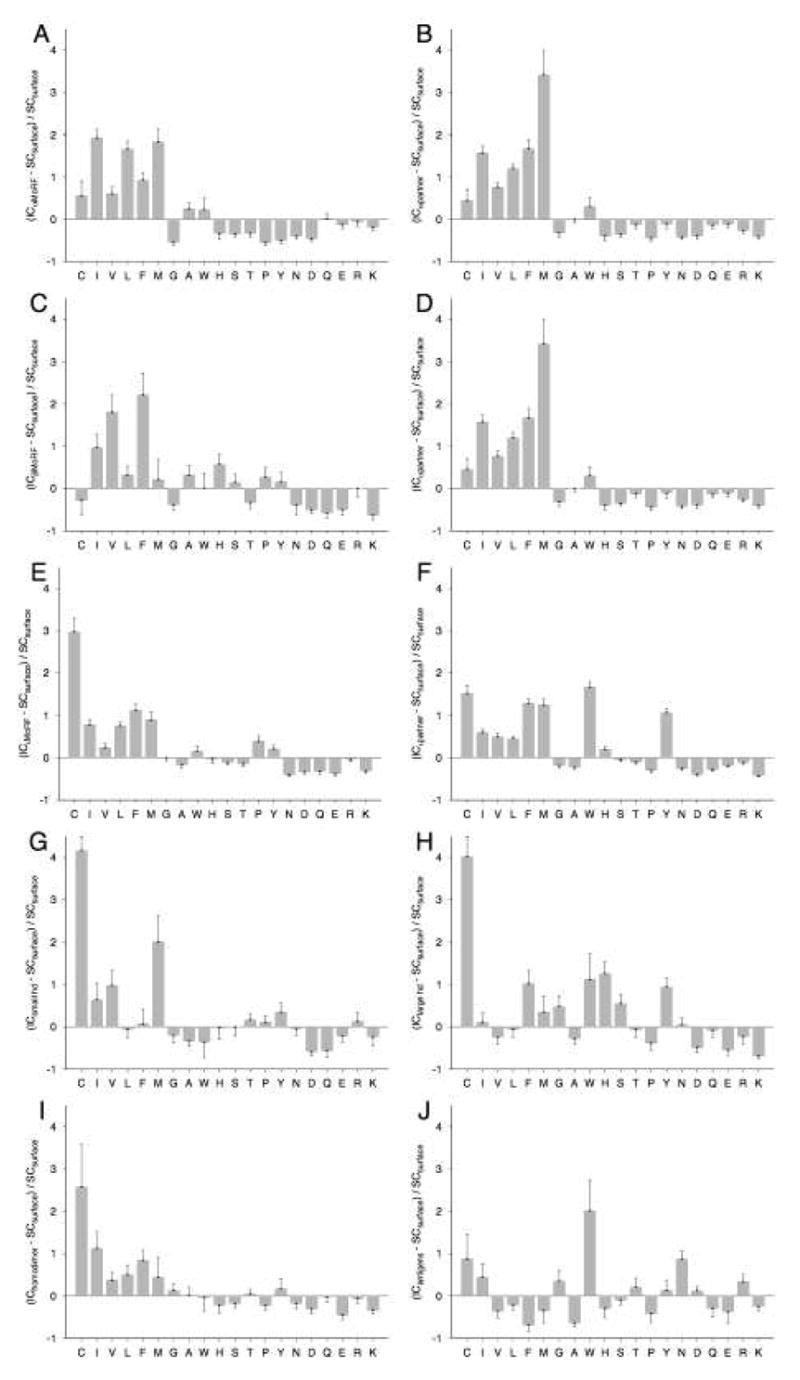
The interface composition (IC) profiles of (A) α-MoRF, (B) α-MoRF partner, (C) β-MoRF, (D) β-MoRF partner, (E) ι-MoRF, (F) ι-MoRF partner, (G) small protomer from heterodimers, (H) large protomer from heterodimers, (I) homodimer, and (J) antigen interfaces are shown relative to surface residues of monomeric structures. Error bars give one standard deviation estimated by 100,000 bootstrap iterations. Amino acids are arranged in the order of increasing surface exposure, from the residues most buried in globular proteins on the left-hand side to the most exposed ones on the right-hand side 47.
There are several general trends in the compositional biases among the datasets. All MoRF interfaces (Figures 3A-F) are generally depleted in the six most highly exposed residues, enriched in the six most highly buried residues, and have variable or small biases in residues with intermediate exposure. These trends may be indicative of the propensity of these residues towards interaction, although all datasets deviate from this generality to some extent. Also, the compositions of MoRFs and their partners appear to be strikingly similar, although results given in later sections show that there are some significant differences. Homodimers and heterodimers (Figures 3G, H, and I) are enriched in buried residues and depleted in exposed residues similar to MoRF complexes. However, these enrichments and depletions are not generally as pronounced as for MoRFs and their partners, where heterodimers show this trend at best sporadically. Unlike the other interface datasets, antigens are depleted in buried residues and show no general trend for exposed residues. However, antigen biases are also the weakest among all the datasets (Figure 3J), suggesting that they are more similar to monomer surfaces than other interfaces.
There are several notable deviations from these overall compositional trends. In MoRF interfaces, β- and ι-MoRFs are enriched in proline, which contrasts with α-MoRFs likely due to the helix breaking nature of proline. Both α-MoRFs and their partners are depleted in tyrosine and histidine and both β-MoRFs and their partners are depleted in tryptophan. Also, β-MoRFs are depleted in cysteine but their partners are significantly enriched in this amino acid. In general, the differences between the datasets seem to be more pronounced on the buried part of the scale. The largest relative differences were in the cysteine content of ι-MoRFs, β– MoRF partners, and heterocomplexes and in the methionine content of α-MoRF partners. With the exception of antigens, much of the variability in compositional biases among all datasets is in the eight residues with intermediate exposure. For example, tryptophan is enriched in α-MoRF complexes, ι-MoRF complexes, and small protomers of heterodimers, but depleted in β-MoRF complexes, homodimers, and large protomers from heterocomplexes.
Relative Entropy
The difference in amino-acid compositions of all interaction site datasets was quantified by calculation of the relative entropy45 between the compositions of all pairs of interface datasets (Table 2), as described in Materials and Methods. Most pair-wise comparisons show statistically significant differences between the interface compositions of the 10 datasets; only 8 of the 55 pair-wise comparisons are insignificant using the conservative – i.e. Bonferroni adjusted46 – alpha value of 9.1×10⁻⁴. Of the tests that give insignificant results, 5 involve comparisons to homodimers, indicating that homodimers may have more generalized interface compositions than other sets.
Table 2.
Relative entropy between residue compositions of the datasets.
| β-MoRF | ι-MoRF | α-Partner | β-Partner | ι-Partner | |
|---|---|---|---|---|---|
| α-MoRF | 0.248 (< 10−5) | 0.146 (< 10−5) | 0.040 (0.0047) | 0.123 (< 10−5) | 0.162 (< 10−5) |
| β-MoRF | 0.153 (< 10−5) | 0.192 (< 10−5) | 0.109 (0.0233) | 0.158 (2.0×10⁻⁵) | |
| ι-MoRF | 0.106 (< 10−5) | 0.109 (< 10−5) | 0.062 (< 10−5) | ||
| α-Partner | 0.086 (< 10−5) | 0.095 (< 10−5) | |||
| β-Partner | 0.110 (< 10−5) | ||||
| Homodimers | Large Hetero | Small Hetero | Antigens | PDB Monomers | |
|
| |||||
| α-MoRF | 0.141 (< 10−5) | 0.470 (< 10−5) | 0.258 (< 10−5) | 0.496 (< 10−5) | 0.204 (< 10−5) |
| β-MoRF | 0.176 (6.4×10⁻⁴) | 0.320 (< 10−5) | 0.263 (5.0×10⁻⁵) | 0.545 (< 10−5) | 0.228 (< 10−5) |
| ι-MoRF | 0.035 (0.3432) | 0.179 (< 10−5) | 0.091 (0.0116) | 0.319 (< 10−5) | 0.086 (< 10−5) |
| α-Partner | 0.098 (1.4×10⁻⁴) | 0.361 (< 10−5) | 0.198 (< 10−5) | 0.449 (< 10−5) | 0.186 (< 10−5) |
| β-Partner | 0.087 (0.0129) | 0.275 (< 10−5) | 0.156 (3.7×10⁻⁴) | 0.485 (< 10−5) | 0.197 (< 10−5) |
| ι-Partner | 0.067 (0.0033) | 0.134 (< 10−5) | 0.112 (4.2×10⁻⁴) | 0.284 (< 10−5) | 0.101 (< 10−5) |
| Homodimers | 0.168 (1.9×10⁻⁴) | 0.104 (0.0863) | 0.250 (2.0×10⁻⁵) | 0.061 (0.0042) | |
| Large Hetero | 0.242 (1.0×10⁻⁵) | 0.291 (< 10−5) | 0.193 (< 10−5) | ||
| Small Hetero | 0.321 (1.0×10⁻⁵) | 0.136 (1.0×10⁻⁵) | |||
| Antigens | 0.176 (< 10−5) | ||||
The interface compositions of MoRFs and partners are in general very different from the interface compositions of other hetero-complexes, with the exception of ι-MoRFs, which suggests that MoRF interaction surfaces are distinct from those of other complexes. Also, the interfaces of antigens show significant divergence from all other interfaces, with the difference being most pronounced between antigens and MoRFs and their partners. The relative entropies between α-, β- and ι-MoRFs and their respective partners are among the smallest observed of all pairs of datasets, where the difference between α- and β-MoRFs and their respective partners is not found to be statistically significant. This compositional symmetry of MoRFs and their partners is also apparent in Figure 3. Interfaces of α- and β-MoRFs are different in residue composition from all datasets other than their respective partners, and there is also a significant difference between the two. Interfaces of ι-MoRFs are also significantly different from most other datasets. These results imply that the interfaces of MoRFs and their binding partners can be discriminated based on the residue composition, and suggest that MoRF and partner classifiers can be constructed. This possibility has been investigated with the inclusion of additional attributes as discussed below.
Analysis of Geometric and Physiochemical Parameters
Size of Binding Site and ASA
The sizes of interfaces were compared in terms of total residue count and total accessible surface area, ASA (Figure 4A–F). The absolute number of residues involved in the interface (Figure 4A) of all three types of MoRFs (average of 17±1 residues) shows that MoRFs are generally smaller than all other interaction types (average of 28±2 residues). However, the absolute interface ASA (Figure 4B) of MoRFs (average of 1141±110 A2) is slightly larger than other interface types (average of 948±72 A2).
Figure 4. Characterization of interface sizes and surface areas.
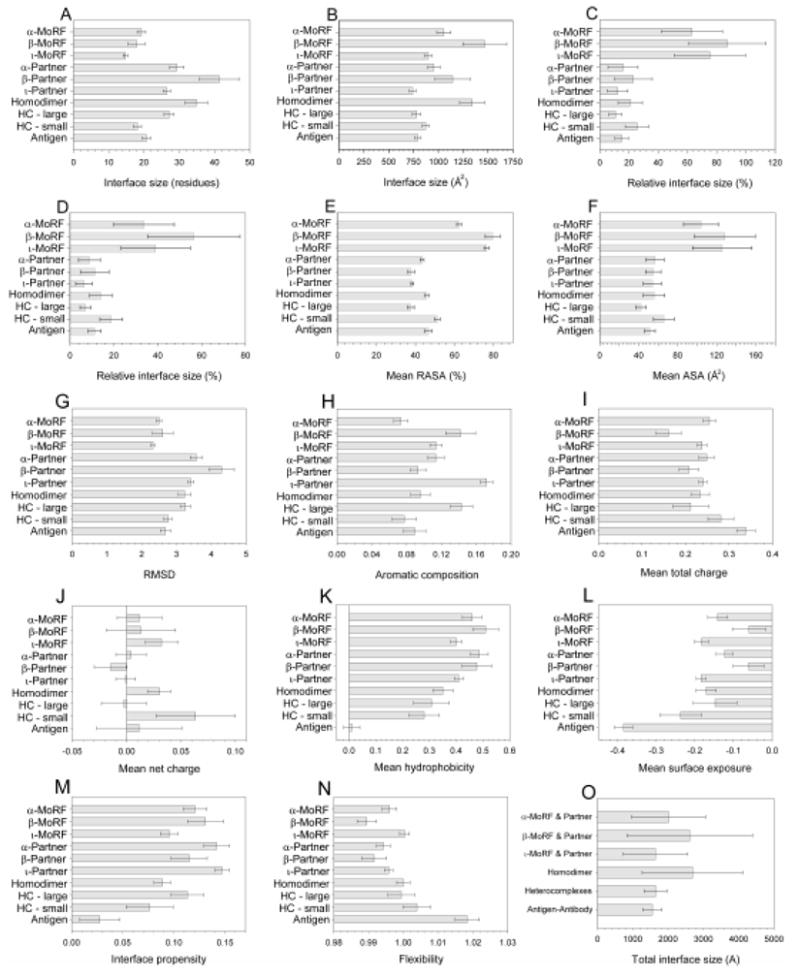
Means and one standard deviation, estimated by 100,000 bootstrap iterations, are shown for each of the datasets for all metrics: (A) number of interface residues, (B) ASA of interface residues (C) proportion of residues involved in the interface, (D) proportion of ASA involved in the interface, (E) RASA of interface residues, (F) total ASA per residue, (G) planarity, (H) aromatic residue composition, (I) total and (J) net charge, (K) hydrophobicity, (L) surface exposure, (M) interface propensity, and (N) flexibility. In addition, surface buried on complex formation as mean ΔASA (O) are shown for all complex types.
Since MoRFs are generally shorter than members of other datasets (Table 1), these size measures were normalized in order to obtain the relative averaged size of a binding site and the relative averaged accessible surface area. Normalization of interface size by residue (Figure 4C) shows that the binding interfaces of the three MoRF datasets (average of 75±24% of residues) involve much more of the sequence than the interfaces of other datasets (average of 18±8% of residues). Normalized ASA (Figure 4D) also demonstrates that the interfaces of the MoRF dataset (average of 43±17% of ASA) involve much more of the protein surface than the interfaces of other types of complexes (average of 11±4% of ASA).
To provide an alternative view of the participation of interface residues, the average relative ASA of interface residues was calculated (Figure 4E). MoRF interfaces show a significantly higher RASA (73±2%) compared to all other datasets (43±1%).
Buried Surface Area
The ΔASA of an interface is frequently used as a metric for the size of an interface13, 14 and is calculated as the sum of the ASA of the isolated components minus that of the complex.2 Protein-protein complexes have been observed to bury surface areas in the range of 1600±400 Å2, which represents the “standard size” of the interface area.13 Similarly, interfaces burying less than 1200 Å2 and more than 2000 Å2 are considered to be small and large interfaces, respectively.
Calculation of ΔASA for MoRFs and their binding partners (Figure 4O) shows that most complexes examined here fall into the standard size interface category, with fewer in the small and large interface categories. Complexes of α- and β-MoRFs with their binding partners and homodimers are characterized by many large interfaces, where -MoRF, hetero-, and antigen-antibody complexes are closer to the standard size.
Planarity of Binding Surfaces
Several researchers observed that the interfaces of protein-protein complexes tend to be flat.1, 9, 11, 14 One measure of the flatness of an interface is planarity, calculated as the root mean squared deviations (RMSDs) of all the atoms in interface from the least squares plane fitted to the atoms. A lower RMSD indicates a closer agreement to the best-fit plane, and therefore that the interface is flatter. The planarity was calculated for each interface (Figure 4G) and all three types of MoRF interfaces are flatter (average RMSD of 2.47±0.14) than other protein-protein interaction interfaces (average RMSD of 2.98±0.5). MoRF partner interfaces (3.76±0.21) are significantly less flat than MoRFs, possibly indicating that MoRFs may protrude into the partner, thereby including residues that are not well solvent exposed. This idea is supported by the relatively low RASA of interface residues of MoRF partners (Figure 4E). These results also suggest that the flatness of the interface as measured relative to the MoRF may be due in part to the small overall size of the MoRF compared to the sized of the globular protein partner.
Physicochemical Properties of Binding Surfaces
Aromatic Content, Total Charge and Net Charge
The charged residues – particularly arginine – and the aromatic residues – particularly tyrosine, tryptophan and histidine – are relatively abundant in protein-protein interaction sites.11 The role of these residues in the formation of complexes between MoRFs and their binding partners was investigated and compared to other protein-protein complexes. Aromatic content, total charge and net charge were calculated and averaged over the number of residues comprising the interface (Figures 4H, I, and J). α-MoRFs are effectively depleted in aromatic residues, whereas β-MoRFs and ι-MoRF partners are enriched in these residues. There is a notable asymmetry in the aromatic content in all MoRF-partner pairs, where one member of the complex has a larger composition of aromatic residues than the other. This same asymmetry is also observed for heterocomplexes, where the larger partner is enriched in aromatic residues and the smaller partner is depleted in these residues. These observations suggest that specific interactions involving aromatic amino acids might play a crucial role in the formation and stabilization of the MoRF-partner complexes.
In terms of mean total charge (Figure 4I), most datasets are similar, with β-MoRFs having the lowest mean total charge and antigens and small subunits of heterocomplexs having the largest mean total charge. Similarly, most datasets have a mean net charge (Figure 4J) not significantly different from zero, showing little bias toward positive or negative charge. The exceptions are ι-MoRFs, homodimers, and the small subunits of heterocomplexes, which are biased towards net positive charge.
Hydrophobicity
Calculation of the Fauchere-Pliska hydrophobicity for the complexes (Figure 4K) shows that the interfaces of MoRFs and their partners are somewhat more hydrophobic than the interfaces of other complex types. This supports the hypothesis that hydrophobic interactions might play a crucial role in formation of these complexes.
Surface Exposure
The surface exposure was calculated for each interface dataset using the Janin scale (Figure 4L), where the calculated values indicate the propensity of interfaces to be exposed in the context of a folded protein. The α- and ι-MoRFs and their partners have an intermediate propensity toward surface exposure, similar to homodimers and the large subunits of heterocomplexes. The β-MoRFs and their partners show a much lower propensity toward surface exposure.
Interface Propensity
The binding site propensities for each of the interfaces in all the datasets were calculated using the scale of Jones and Thornton9, 11 (Figure 4M). Compared to the interfaces of other complexes, the binding sites of MoRFs and their partners are comprised of residues with comparable or higher interface propensity. The α-MoRFs and ι-MoRFs have a lower interface propensity than their respective partners, whereas the β-MoRFs have a higher interface propensity than their partners. The ι-MoRFs have the lowest interface propensities among the MoRF complexes, comparable to homodimers and small subunits from heterocomplexes.
Flexibility
The mean flexibility of interface residues was calculated using the scale of Vihinen et al. 48 and the flexibility distributions of each interface type was summarized (Figure 4N). By this measure, ι-MoRFs are the most flexible whereas the β-MoRFs are the least flexible among MoRFs and their binding partners. MoRF interfaces are comparably or less flexible by the this scale than other interface types, which is surprising given previous evidence that suggests that MoRFs are IDPs.33 Evidently, the non-interface residues of the MoRFs contribute substantially to the lack of folding prior to binding.
Classification of Interface Types
To investigate the possibility that a combination of multiple geometric and physicochemical parameters can be used to accurately differentiate between different types of interfaces, naïve Bayes classifiers were trained on a subset of properties that show significant discrimination power between a particular interface type and the combination of all other interface types. The number of selected parameters and the top 5 parameters, judged by the smallest p-values of the selection t-test, are shown for each interface class (Table 3). The top 5 parameters generally reflect the differences observed in comparisons of datasets by individual features (Figures 3 and 4). For example, hydrophobicity is the most significant parameter for antigens, which would be expected from its relative distribution (Figure 4K). The top features selected for MoRFs are generally distributed in two groups: (1) geometric features that distinguish MoRFs from other interface types (e.g. relative interface size), and (2) compositional features that distinguish the various MoRF types (e.g., lysine in α-MoRFs, valine in β-MoRFs, and proline in ι-MoRFs).
Table 3.
Summary of selected parameters for each dataset.
| Interface type | Number of selected features | Top 5 features | |
|---|---|---|---|
| Name | p-value | ||
| α-MoRF | 28 | Lysine composition
Interface size (% residues) Interface size (% ASA) Tyrosine composition Aromatic composition |
9.83·10−13
2.92·10−08 2.12·10−07 1.23·10−06 1.90·10−06 |
| β-MoRF | 27 | Interface size (% ASA)
Interface size (% residues) Valine composition Interface RASA Interface ASA |
5.19·10−16
1.01·10−09 1.08·10−08 6.68·10−08 2.23·10−06 |
| ι-MoRF | 27 | Interface RASA
Interface size (% residues) Interface size (% ASA) Planarity Interface size (# of residues) |
1.77·10−79
1.41·10−76 8.22·10−54 5.64·10−20 1.01·10−19 |
| α-partner | 27 | Interface size (% residues)
Interface size (% ASA) Interface RASA Planarity Interface size (# of residues) |
5.55·10−10
5.67·10−09 1.38·10−06 6.83·10−06 4.74·10−05 |
| β-partner | 26 | Interface size (# of residues)
Planarity Interface RASA Interface size (% ASA) Surface exposure |
1.79·10−09
1.57·10−07 1.60·10−04 0.0127 0.0190 |
| ι-partner | 26 | Interface size (% residues)
Interface RASA Interface size (% ASA) Aromatic composition Tyrosine composition |
8.02·10−49
5.24·10−46 9.39·10−46 2.86·10−16 5.15·10−13 |
| Homodimers | 16 | Interface size (# of residues)
Interface size (absolute ASA) Interface size (% residues) Interface RASA Interface size (% ASA) |
0.0005
0.0012 0.0207 0.0756 0.1006 |
| Hetero- complex (large protomers) | 23 | Interface size (% residues)
Interface RASA Interface size (% ASA) Serine composition Histidine composition |
0.0003
0.0005 0.0015 0.0048 0.0055 |
| Hetero- complex (small protomers) | 25 | Cysteine composition
Aromatic compositions Phenylalanine composition Lysine composition Hydrophobicity |
0.0068
0.0188 0.0256 0.0271 0.0317 |
| Antibodies | 26 | Hydrophobicity
Asparagine composition Flexibility Surface exposure Interface propensity |
8.56·10−08
1.14·10−07 9.51·10−06 1.88·10−04 0.0016 |
Total prediction accuracies are good across all datasets (see Table 4), with none less than 75%. MoRF prediction accuracies fall in the 83.8±1.0 to 93.6±1.4 range, whereas for MoRF partners values are between 76.4±2.3 and 88.0±2.4. Note that in the current framework, a prediction accuracy of 50% is expected for random assignment. Sensitivities are generally lower than specificities, which is a consequence of the use of unbalanced datasets in the one-versus-all procedure. In conclusion, these results support the idea that all these interfaces can be distinguished based on geometric and physiochemical features along with amino acid compositions.
Table 4.
Results of OVA classification of interface types.
| Interface type | Sensitivity (%) | Specificity (%) | Accuracy (%) |
|---|---|---|---|
| α-MoRF | 75.8±2.3 | 90.6±1.1 | 89.0±1.2 |
| β-MoRF | 57.9±5.6 | 94.8±1.1 | 93.6±1.4 |
| ι-MoRF | 77.8±1.3 | 86.5±0.9 | 83.8±1.0 |
| α-partner | 79.0±2.1 | 76.0±2.3 | 76.4±2.3 |
| β-partner | 73.7±4.5 | 88.5±2.3 | 88.0±2.4 |
| ι-partner | 91.5±0.6 | 74.7±1.4 | 79.8±1.2 |
| Homodimers | 40.0±6.2 | 88.2±2.7 | 87.0±2.9 |
| Hetero-complex (large protomers) | 62.5±5.9 | 85.5±3.1 | 84.9±3.2 |
| Hetero-complex (small protomers) | 55.6±5.8 | 92.5±1.6 | 91.3±1.9 |
| Antibodies | 83.3±4.0 | 94.7±1.5 | 94.4±1.5 |
Binding Induced Folding of MoRFs
MoRFs represent short interaction-prone segments of protein disorder that can undergo disorder-to-order transition upon specific binding.33 The ability of α-MoRFs to fold upon interaction with binding partners was illustrated by several exemplifying cases described in our recent paper detailing the development of a preliminary α-MoRF predictor.32 Figures 5A and B illustrate examples of β-MoRFs and ι-MoRFs, respectively that have been shown experimentally to undergo a disorder-to-order transition upon binding to partners. Also shown are the PONDR VLXT43 and PONDR VSL151 predictions for the entire length of the parent sequences of these MoRFs in order to illustrate the context in which these MoRFs occur.
Figure 5. Examples of disorder-to-order transitions in β- and ι-MoRFs.
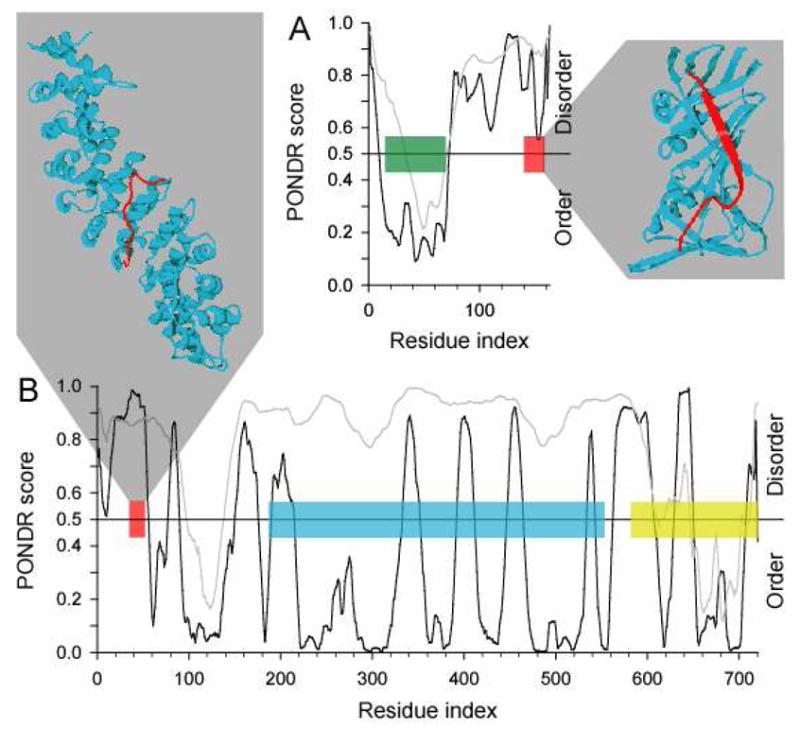
The structures of MoRFs (red ribbons) bound to their respective partners (blue ribbons) are shown. PONDR VL-XT predictions for the entire proteins in which these MoRFs are found are also shown, where the position of the MoRFs in these sequences are indicated (red boxes). (A) A β-MoRF example from p21 bound to PCNA (PDB entry 1AXC), where the position of the CDK inhibitor domain is indicated (green box). (B) An ι-MoRF example from Nup2p bound to karyopherin Kap60 (PDB entry 1UN0), where the positions of the FXF(G) repeat region (blue box) and the Ran binding domain (yellow box) are indicated.
β-MoRFs
The p21 protein (Figure 5A), and a family of related proteins, directly blocks cell cycle progression in response to DNA damage through inhibition of cyclin-dependent protein kinases by a conserved N-terminal domain.52 Unlike related proteins, p21 contains a C-terminal domain that can block DNA replication directly, through the disruption of interactions between proliferating cell nuclear antigen (PCNA) and polymerases; PCNA anchors polymerases to template DNA and the C-terminus of p21 functions through the disruption of this interaction by blocking PCNA-polymerase interaction sites.53 The p21 protein carries out these various functions without pre-formed structure,54 undergoing a disorder-to-order transition upon binding to partners. The C-terminal domain is an example of a verified β-MoRF, which functions though physically blocking other protein-protein interactions. The N-terminal domain is also likely to be a MoRF; although the bound structure of the N-terminal domain has not been determined, its sequence in this region is highly similar to p27, for which a CDK-cyclin complex structure has been determined.52 Furthermore, the N-terminal domain and C-terminal domains correspond to predictions of order and sharp drops in disorder predictions, respectively. PONDR VL-XT plots with these characteristics have been shown previously to correlate with segments that undergo disorder-to-order transitions.32, 55, 56
ι-MoRF
Nuclear import is mediated by greater than 30 nucleoporins (Nups) that comprise the nuclear pore.57 In yeast, Kap60p binds to nuclear localization signals (NLS) of cytosolic proteins. This complex in turn binds to Kap95p and to importins α and β. The entire Kap60p/Kap95p/importin α/importin β complex is then translocated into the nucleus. The relatively tight binding of NLSs to Kap60p requires a mechanism for dissociation of this interaction once translocation is complete. Nup2p (Figure 5B), which is localized to the nuclear face of the nuclear pore, competes with NLSs for binding to Kap60p through overlapping binding sites, thereby accelerating release of the cargo protein.58 Nup2p also has low affinity interactions with RanGTP through a N-terminal domain59 and with Kap95p mediated by Nup2p’s FXF(G) central repeat domain.58
The entire Nup2p sequence has been shown to be disordered in isolation.60 Therefore the Nup2p-Kap60p interaction is an example of a verified ι-MoRF that undergoes a disorder-to-order transition upon complex formation. Unlike p21, the Nup2p MoRF region is predicted to be disordered (Figure 5B). Also, although the Nup2p is known to be entirely disordered in solution, PONDR VLXT predicts much of the sequence to be ordered with several, relatively short, predictions of disorder. This prediction may reflect the many, and varied, binding activities of Nup2p.55 In contrast, PONDR VSL1 better reflects the highly disordered nature of this protein, likely due to its more sophisticated architecture and large training set relative to PONDR VLXT.
Structural Changes, Folding and Unfolding Induced in MoRF-Binding Proteins
Binding-Induced Small-Scale Displacements in MoRF Partners. A small-scale structural alteration induced by MoRF binding is illustrated by the binding of the MoRF region of FliM to CheYD13K/Y106W (Figure 6A). Chemotaxis in motile bacteria is controlled by the response regulator protein CheY,61 which functions through association with the flagellar motor switch protein, FliM. This interaction reverses the direction of rotation of the flagellar motor from counterclockwise (smooth-swimming phenotype) to clockwise (tumbling phenotype).62, 63 The binding of CheY to FliM is modulated by phosphorylation of CheY, where phosphoryl-CheY binds FliM with approximately 20-fold higher affinity than non-phosphorylated CheY.64 Several CheY mutants, including CheYD13K/Y106W also know as CheY**, cause both a hyperactive (increased tumbling) phenotype in vivo and increased FliM-binding in vitro.65
Figure 6. Structural changes in partners.
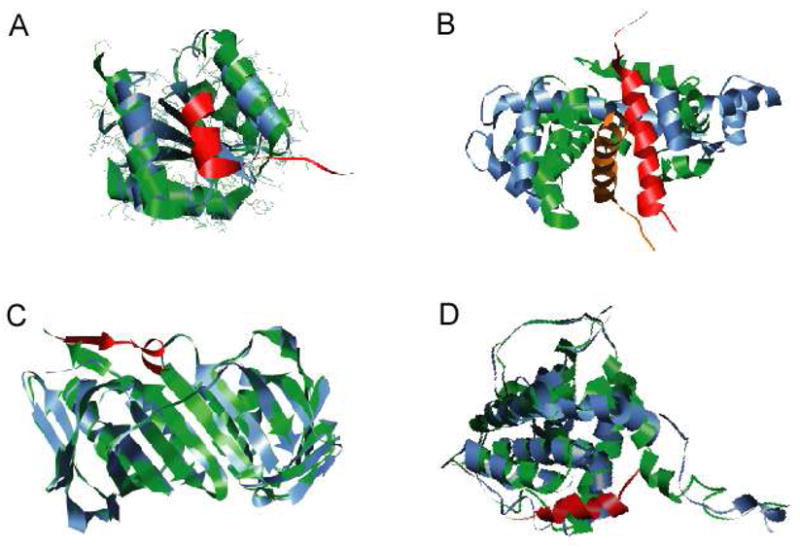
Ribbon representation MoRF partners shown unbound (blue ribbons) and bound (green ribbons) to MoRFs (red ribbons). (A) Small scale structural alterations in CheY induced by binding of the MoRF region of FliM (PDB entries: unbound - 1U8T and bound – 1F4V). (B) Large scale structural alterations in calmodulin induced by binding to the MoRF of GAD (PDB entries: unbound - 1CLL and bound - 1NWD). (C) Partial disorder-to-order transition in PCNA induced by binding to the MoRF of FEN-1 (PDB entries: unbound - 1RWZ and bound - 1RXZ). (D) Partial order-to-disorder transition in Bcl-xL induced by binding to the MoRF of Bim (PDB entries: unbound - 1PQ0 and bound - 1PQ1)
Binding of the MoRF region of FliM to CheY** causes small but noticeable changes in the overall CheY** strucutre. At the quaternary level, FliM binding induces large change in the rotameric orientations of Trp106 and Ile95 of CheY**.65 Superposition of the complex and the free CheY** structures revealed that Trp106 in the unbound structure sterically clashes with Ile11 of the FliM in the bound structure. Similarly, Ile95 in the unbound structure hinders access of FliM to its binding site via steric conflict with Ile11. Both of these residues alter their conformation to allow for the binding of FliM. All this indicates that the FliM binding requires notable conformational rearrangement in CheY**.65
Large-Scale Movements of Secondary Structure Elements in MoRF Partners
Of the 50 examples of MoRF induced structural changes that we examined, calmodulin undergoes the most dramatic example of structural changes induced by MoRF binding (Figure 6B). Calmodulin (CaM) is one of the most extensively studied Ca2+ sensors; i.e. proteins containing the Ca2+-binding EF-hand motif. CaM is an acidic, 148 residue protein containing four EF-hands and is known to bind to and regulate dozens, if not hundreds, of different target proteins, including kinases, phosphatases, and ion channels.66, 67
Figure 6B compares calmodulin in the free and bound states, where CaM binds to a dimer of MoRFs from glutamate decarboxylase (GAD). CaM undergoes a dramatic change in order to accommodate the dimeric helical GAD target. The two CaM domains in GAD-bound CaM adopt an orientation markedly different from the unbound CaM and structures seen in other CaM–target complexes.68 The massive structural changes observed in CaM are due primarily to the solution instability of the helix that connects the N- and C- terminal EF-hand domains. The NMR-determined structure of CaM reveals that the central helix is disordered in solution.69 Disorder in this helix allows CaM to attain the varied conformations observed in the structures of CaM bound to various partners. The helix observed in the crystal structure is apparently an artifact of crystallization.68
Binding-Induced Folding of MoRF Partners
The binding of a MoRF region in Flap endonuclease-1 (FEN-1) to PCNA is an example of partial folding induced by MoRF binding. FEN-1 is a structure-specific nuclease that is central to both the DNA replication and repair processes. During DNA replication and repair, a complex that includes FEN-1 and PCNA removes RNA primers or damaged DNA and synthesizes replacement strands.70–72
The binding of PCNA to a MoRF from FEN-1 is illustrated in Figure 6C, which shows that the interaction with a MoRF induces partial folding in its partner. The residues from the unstructured C-termini of PCNA and FEN-1 interact to form ordered β-strands, creating an intermolecular β-zipper interface 73. The formation of this interface therefore represents a bi-lateral disorder-to-order transition upon MoRF binding.
Binding-Induced Partial Unfolding of MoRF Partners
The MoRF of Bim induces partial unfolding in its partner Bcl-xL as a result of complex formation (Figure 6D).74 Both Bcl-XL and Bim are members of the Bcl-2 family of proteins, known to either inhibit or promote apoptosis.75 Bcl-XL, like other anti-apoptotic members of the family contain regions of homology known as BH1, 2, 3, and 4, but Bim, along with some other pro-apoptotic proteins, contain only homology region BH3, which is essential for the death-dealing activities of this subgroup of proteins.76
The BH3 region of Bim is hypothesized to be a MoRF and the structures of Bcl-XL both unbound and bound to this MoRF region are illustrated (Figure 6D). The comparison of crystal structures of MoRF bound and unbound mouse Bcl-XL revealed the existence of significant flexibility at one of the ends of the Bcl-XL binding grove. Binding of the MoRF of Bim causes the third α–helix of Bcl-XL to partially unfold, and also displaces the remaining helix by about 4 Å away from the Bim binding site. Conversely, the binding of Bim causes the fourth α-helix of Bcl-XL to move about 4 Å toward the bound Bim.74 Thus, the interaction of the apoptosis regulator Bcl-xL with its MoRF, Bim, is accompanied by the melting of one of the Bcl-xL α-helices.
Discussion
We have focused on structural analysis and disorder prediction in our identification of MoRFs, which we previously called molecular recognition elements or MoREs (Oldfield et al., Biochemistry 44: 12454 (2005)). MoRF is more descriptive because such elements “morph” from disorder to order upon binding. Using standard molecular biology approaches, DePaoli-Roach and coworkers identified similar regions in disordered inhibitors of protein phosphatase 1 and called them simply “interaction sites” (Yang et al., J. Biol. Chem. 275: 22635–22644 (2000) or “inhibitory domains” (Park and DePaoli-Roach J. Biol. Chem. 269: 28919–28928 (1994)). Using NMR to study 4E-BP1, Fletcher and Wagner (Protein Sci 7:1639–1642 (1998)) demonstrated an “extreme induced fit” for a disordered region as it became ordered upon binding eIF4E; they called this segment the “short central region.” The same segment of the same protein was called the “recognition motif” by Marcotriqiano et al. Mol. Cell. 3: 707–716 (1999)). Luisi and coworkers used approaches similar to ours but named the interaction-prone regions regions of increased structural propensity (RISPs) (Callaghan et al., J. Mol. Biol. 340: :965–979 (2004)). Csizmok et al. (Biochemistry 44: 3955–3964 (2005) called such regions “primary contact sites.” Others used sequence analysis rather than structural analysis and prediction to define regions of interaction. Their analysis also suggested that many of these sites are located in regions of disorder (Neduva et al., PLoS Biol. 3: e405 (2005). This group has called these regions ELMs (eukaryotic linear motifs) and have developed a very elegant and useful server for their identification from sequence (Punterval et al., Nucleic Acids Research 31:3625–3630 (2003)). Recent studies suggest that these ELMs typically contain a few residues favoring structural order within an otherwise highly flexible or disordered region, thus linking ELMs and MoREs (herein called MoRFs) (Fuxreiter et al., Bioinformatics; In Press (2007)). Thus, the results found in this study are likely to be applicable far beyond the relatively small number of examples characterized here.
The residue compositions, geometry, and physico-chemical features of the interfaces between MoRFs and their partners, and other types of complexes have been examined. Overall, many of these features offer insights into the nature of MoRFs and MoRF interfaces. Also, many of these features are useful in distinguishing interface types. The nature of MoRF-partner interactions were explored by examining specific examples and the various transitions that MoRFs and partners undergo during complex formation. The implications of these results for the development of predictions of MoRF-partner interactions are discussed.
Comparative Interface Features
Interface Compositions
Analysis of amino acid compositions provides insight into the physical basis of protein behavior, particularly for the case of intrinsically disordered proteins 43. Since a very different control set has been used to calculate these compositional profiles, the analysis carried out here (Figure 3) is not directly comparable to previous analyses of MoRF sequence compositions. The previous analysis showed that MoRFs have amino acid compositions much more similar to disordered proteins than to ordered proteins.33 The current analysis shows that MoRF interfaces generally have compositions that are very different from the compositions of the overall surfaces of monomers (Figure 3), where MoRFs are generally enriched in residues that are typically buried within structured proteins and depleted in residues that are typically exposed. These compositional results seemingly conflict with the high degree of surface exposure of MoRF interface residues (Figures 4E and F), which is likely an indication of a high propensity of these segments to form complexes and thereby bury these residues. This is supported by the observed high propensity toward both surface exposure (Figure 4L) and interface participation (Figure 4M) of MoRF interface residues.
A notable aspect of the compositional profiles of MoRF interfaces is the discrepancy in proline composition between α-MoRFs and β- and ι-MoRFs. That is, α-MoRFs are depleted in proline whereas β- and ι-MoRFs are enriched in proline, relative to monomer surfaces. This is particularly notable since proline in β- and ι-MoRF interfaces is the only significant enrichment seen for any highly exposed residue type. The likely explanation for this differential composition in proline is the final structure of the bound MoRFs. Proline is only very rarely found in α-helices, usually producing a pronounced bend in the helical axis and so is generally considered a helix-breaking residue. α-MoRFs should therefore be depleted in proline, since the presence of this residue would bias the unbound conformational ensemble away from the bound, helical conformation, and could even prevent the α-MoRF from attaining the correct conformation for binding. The enrichment in proline in the other two MoRF types could be rationalized in two complementary ways. First, proline may help maintain disorder in the MoRF when in the unbound state and can be present since it does not necessarily interfere with the bound conformation of the β- or ι-MoRF. Second, proline may be useful in biasing the conformational ensemble of the unbound MoRF away from helical conformations, which would enrich the conformational ensemble in conformations similar to the bound conformation. Therefore, proline may play a large role in the modulation of affinity in β- and ι-MoRFs.
Another notable aspect of the compositional profile analysis is the ubiquitous enrichment of methionine across all MoRF types and also across their partners. Methionine is of particular interest in protein recognition because it plays a large role in non-specific hydrophobic interactions that may lead to generalized partner recognition. The promiscuity and importance in molecular recognition of methionine is thought to arise from its unbranched side chain, it greater-than-expected flexibility, and the polarizability of sulfur, which leads to increased strength of van der Waals forces.77 The high content of methionine in MoRF partners may indicate that these partners recognize multiple, different MoRFs. Current work is focused on examination of multiple recognitions in MoRF sequences, and the roles of methionine in these MoRF-partner interactions will be investigated.
Relative entropy analysis revealed that, in general, the compositions of interface types are very different from each other and different from the compositions of monomer surface residues, with a few exceptions. Homodimers seem to be an exception to this in that they are neither significantly different from the four other interface types nor from monomeric surfaces, which suggest that homodimer interfaces are general in a way that other interface types are not. The most surprising result of this analysis is the similarity between the compositions of the interfaces of each MoRF type and the interfaces of their respective partners. Specifically, the interfaces of α- and β-MoRFs are not significantly different from the interfaces of their respective partners, and the interfaces of ι-MoRFs, although found to be significantly different from the interfaces of their partners, have compositions close to those of their partners, as indicated by the small observed relative entropy between them. In the latter case, the statistical significance may be due in considerable measure to the larger number of ι-MoRF examples, since p-values are generally inversely proportional to sample size. This compositional symmetry is not observed between the compositions of large and small protomers of heterocomplexes. There is no immediately obvious explanation for this compositional symmetry between MoRFs and their partners, and further insights are required. However, this observation may prove useful for the ultimate goal of predicting MoRF-partner interactions.
Interface Geometric and Physiochemical Features
In terms of geometric properties, MoRFs were significantly different from their partners and other types of interfaces. Although MoRF interfaces generally involved a relatively small number of residues, MoRF interfaces were the same size or larger than other interface types, which was due to the larger solvent exposure of the interface residues prior to association. This is also true for the molecules as a whole, as indicated by the larger ASA per residue of MoRF monomers (average of 119±26 Å2) relative to other datasets (average of 55±8 Å2). These observations are consistent with previous results33, 78 with the conclusion that intrinsically disordered proteins in general - and MoRFs in particular - are characterized by large functional sites, where the entire MoRF molecule could be considered as a single binding site.
In addition, the large extent of solvent exposure of interface residues is consistent with previous observations suggesting the MoRFs are disordered in the absence of binding partners. That is, a structure without a significant amount of self-buried surface area cannot maintain a specific three-dimensional structure, since it lacks the non-covalent interactions that are required to maintain a structure. These observations support the general hypothesis that intrinsic disorder is a prevalent mediator of protein interactions27 and the idea that intrinsic disorder is required for efficient protein interactions.79 That is, an interaction mediated by an intrinsically disordered region requires far fewer amino acids overall to form a binding site as compared to an interaction mediated by an intrinsically ordered protein. This enables a disordered protein to have far more interaction partners than an ordered protein of similar size.79
Previous observations had caused us to speculate whether the surface of the partner proteins was the driving force behind the MoRF-partner interactions. Extreme cases of such one-sided interactions are antibody-antigen complexes, where the antibody is tailored to the antigen, and the antigen gives little or no indication of it propensity for the interaction. The physiochemical properties indicate, however, that the MoRF interface residues are generally as, or even more, interaction prone than other interface types. We therefore conclude that MoRFs are generally not passive in their interactions with partners. This conclusion provides support for the idea that MoRFs, since they are linear sequence elements,80 should generally be predictable from sequence and predictability may not be limited to a particular sub-class of MoRFs.32
One of the indicators of the interaction-prone nature of MoRFs, their relatively high hydrophobicity, deserves more scrutiny. Firstly, IDPs are generally highly hydrophilic81 and the high hydrophobicity of MoRF interfaces suggests that MoRF sequences evolved in such a way that a high fraction of the hydrophobic residues partition into the interface. This idea has several implications for the identification of MoRFs from sequence and the identification of MoRF interaction sites on their partners. The partitioning of hydrophobic residues into the MoRF interface is likely a functional basis of the previously developed α-MoRF predictor,32 which predicted the location of MoRFs in a given sequence by locating short predictions of order within longer predictions of disorder. Similarly, MoRF interaction sites on the surfaces of partner proteins may be identifiable in part by looking for highly hydrophobic surface patches.
Secondly, previous studies have indicated that transient protein interfaces are significantly more polar than interior of globular proteins9, 16, 17. This higher polarity of protein interfaces is thought to grant specificity to protein interactions, since polar interactions are much more sensitive to atomic details than van der Waals interactions or the hydrophobic effect. The higher hydrophobicity of the interior of globular proteins is necessary to drive protein folding and maintain a globular structure. In these terms, the high hydrophobicity of MoRF interfaces suggests that the hydrophobic interactions are necessary to induce folding in MoRFs upon binding to their partners and that MoRF-partner interactions may be less specific than other protein-protein interactions.
Classification
We have found that all examined interface types are distinguishable to a high degree of accuracy, which suggests that it may be possible to predict interfaces based on known surfaces – in the case of ordered proteins – or sequence – in the case of disordered proteins. Sequence-based predictors may be applicable in the case of disordered proteins since their interface sites are generally contiguous in terms of sequence or at least involve a supermajority of residues in a contiguous stretch of sequence. Therefore a potential interface for an intrinsically disordered protein is any contiguous stretch of sequence, and interface-forming subsequences within generalized regions of disorder may be distinguished by particular sets of physiochemical potentials.
Further development and elaboration of the models of protein interfaces developed in this study will be focused on identification of interface sites on protein surfaces. The identification of interaction prone surface patches has been pursued by several researchers.10, 82 The current analysis suggests that an improvement in surface patch prediction may be achieved by the prediction of types of interaction sites, rather than general interaction sites. Segregation of interface types might lower the variance of the feature distribution of interface sites, which would aid in the identification of novel sites from protein surfaces. Such analysis is limited to the partners of MoRFs and other interface types – since MoRFs are disordered in the absence of their partners – and is further limited to only those partners that undergo, at most, only small changes upon MoRF binding.
Binding Induced Structural Alterations of MoRF Partners
The structural changes undergone by MoRF partners vary widely, from small scale movements to large scale movements and from partial folding to partial unfolding. Previous observations provide some rationale for this wide variety of structural alterations. In previous studies, complexes with ΔASA values in the range of 1200–2000 Å2 have been found to undergo only minor structural alterations during complex formation, whereas formation of complexes with ΔASA values of 2000–4660 Å2 is generally accompanied by large structural alterations.13 In comparison, 42% of α-MoRF, 42% of β-MoRF, and 22% of ι-MoRF complexes have ΔASA values in excess of 2000 Å2. This suggests that the interaction of a MoRF with its partner is quite likely to be accompanied by a significant conformational change in the partner. The bound-unbound MoRF partner pairs examined in detail herein support this idea. The prevalence of structural changes during complex formation has crucial implications for the prediction of MoRF-partner interactions. Also, comparing these structural changes with those induced by tethering83 would be quite interesting. This comparison would provide insight regarding natural versus artificial structural changes upon binding.
Implications for the Prediction of Protein Interactions
This work has identified several difficulties that must be overcome for successful prediction of MoRF-partner interactions, as well as identified several potential avenues for predictor development. Typically, partner prediction has been limited to genome-based methods – such as Rosetta Stone84, gene neighborhood85, or correlated co-evolution86 – which are quite effective in detecting well conserved protein-protein interactions. However, given that intrinsically disordered regions can evolve at an accelerated rate87 and that modulation of protein interactions seems prevalent in higher organisms,27 these methods might not be generally applicable for the prediction of MoRF-partner interactions. Our future efforts will be focused on identifying MoRF regions and regions likely to bind to MoRFs from sequence and known structure. Knowledge of these may be used to supplement interacting pair prediction using interaction site information.
Prediction of MoRF interactions must necessarily consider that MoRFs are disordered in the unbound state, and so unbound structures will not be available for surface analysis. Previously, a subset of MoRFs have been predicted from sequence,32 and results of the compositional and physiochemical feature analysis suggest that other types of MoRFs will also be amenable to this strategy. The relatively large number of MoRF examples in the current dataset should allow for the development of more sophisticated sequence-based MoRF predictors.
For partners, initial efforts will be focused on prediction of surfaces that interact with MoRFs, similar to previous efforts in prediction of interaction prone surface patches.10, 82 The largest hurdle that must be overcome in the prediction of MoRF binding surfaces is the conformational changes of MoRF binding partners. A subset of partners may be amenable to approaches using rigid body assumptions, but our examination of bound and unbound partners suggests that the majority of MoRF partners likely undergo significant structural alterations on binding to MoRFs. An initial approach to this problem may be to consider structural alterations as discrete classes, such as (1) displacements and (2) partial induction of order. In the first case, surfaces can be examined after computationally removing a portion of the structure, for example the fourth α-helix of Bcl-XL, which is displaced by the MoRF of Bim. This approach will require development of a efficient search strategy, possibly through local sequence similarity of MoRF and partner. In the second case, a strategy similar to that proposed for MoRF prediction may be applicable. That is, disordered regions, or highly flexible regions, of the three dimensional structure could be treated as sequence and examined for compatibility with MoRF binding.
Finally, the large size of MoRF-partner interfaces may facilitate prediction of interaction sites and interaction partners. In protein interactions, attractive forces between individual residues are weak and only through the accumulation of many weak interactions are protein complexes formed. From a computational perspective, predicting one contact correctly is very difficult, because a single contact contains very little information. But predicting a large set of contacts between two partners at low resolution may be much easier, since there will be very few sets of contacts that are cumulatively favorable. By this logic, larger interfaces should be more amenable to prediction since there are fewer acceptable solutions.
Acknowledgments
This work was supported by grants from the National Institutes of Health LM007688-0A1 (A.K.D and V.N.U.) and GM071714-01A2 (A.K.D and V.N.U.), and by the Indiana Genomics Initiative (INGEN) (A. K. D.). INGEN is supported in part by Lilly Endowment Inc. The Programs of the Russian Academy of Sciences for the “Molecular and cellular biology” and “Fundamental science for medicine” provided partial support to V. N. U.
References
- 1.Argos P. An investigation of protein subunit and domain interfaces. Protein Eng. 1988;2:101–113. doi: 10.1093/protein/2.2.101. [DOI] [PubMed] [Google Scholar]
- 2.Chothia C, Janin J. Principles of protein-protein recognition. Nature. 1975;256:705–708. doi: 10.1038/256705a0. [DOI] [PubMed] [Google Scholar]
- 3.Tsai CJ, Lin SL, Wolfson HJ, Nussinov R. Studies of protein-protein interfaces: a statistical analysis of the hydrophobic effect. Protein Sci. 1997;6:53–64. doi: 10.1002/pro.5560060106. [DOI] [PMC free article] [PubMed] [Google Scholar]
- 4.Janin J, Chothia C. The structure of protein-protein recognition sites. J Biol Chem. 1990;265:16027–16030. [PubMed] [Google Scholar]
- 5.Korn AP, Burnett RM. Distribution and complementarity of hydropathy in multisubunit proteins. Proteins. 1991;9:37–55. doi: 10.1002/prot.340090106. [DOI] [PubMed] [Google Scholar]
- 6.Vakser IA, Aflalo C. Hydrophobic docking: a proposed enhancement to molecular recognition techniques. Proteins. 1994;20:320–329. doi: 10.1002/prot.340200405. [DOI] [PubMed] [Google Scholar]
- 7.Young L, Jernigan RL, Covell DG. A role for surface hydrophobicity in protein-protein recognition. Protein Sci. 1994;3:717–729. doi: 10.1002/pro.5560030501. [DOI] [PMC free article] [PubMed] [Google Scholar]
- 8.Jones S, Thornton JM. Protein-protein interactions: a review of protein dimer structures. Prog Biophys Mol Biol. 1995;63:31–65. doi: 10.1016/0079-6107(94)00008-w. [DOI] [PubMed] [Google Scholar]
- 9.Jones S, Thornton JM. Principles of protein-protein interactions. Proc Natl Acad Sci U S A. 1996;93:13–20. doi: 10.1073/pnas.93.1.13. [DOI] [PMC free article] [PubMed] [Google Scholar]
- 10.Jones S, Thornton JM. Prediction of protein-protein interaction sites using patch analysis. J Mol Biol. 1997;272:133–143. doi: 10.1006/jmbi.1997.1233. [DOI] [PubMed] [Google Scholar]
- 11.Jones S, Thornton JM. Analysis of protein-protein interaction sites using surface patches. J Mol Biol. 1997;272:121–132. doi: 10.1006/jmbi.1997.1234. [DOI] [PubMed] [Google Scholar]
- 12.Larsen TA, Olson AJ, Goodsell DS. Morphology of protein-protein interfaces. Structure. 1998;6:421–427. doi: 10.1016/s0969-2126(98)00044-6. [DOI] [PubMed] [Google Scholar]
- 13.Lo Conte L, Chothia C, Janin J. The atomic structure of protein-protein recognition sites. J Mol Biol. 1999;285:2177–2198. doi: 10.1006/jmbi.1998.2439. [DOI] [PubMed] [Google Scholar]
- 14.Chakrabarti P, Janin J. Dissecting protein-protein recognition sites. Proteins. 2002;47:334–343. doi: 10.1002/prot.10085. [DOI] [PubMed] [Google Scholar]
- 15.Glaser F, Steinberg DM, Vakser IA, Ben-Tal N. Residue frequencies and pairing preferences at protein-protein interfaces. Proteins. 2001;43:89–102. [PubMed] [Google Scholar]
- 16.Janin J, Miller S, Chothia C. Surface, subunit interfaces and interior of oligomeric proteins. J Mol Biol. 1988;204:155–164. doi: 10.1016/0022-2836(88)90606-7. [DOI] [PubMed] [Google Scholar]
- 17.Valdar WS, Thornton JM. Protein-protein interfaces: analysis of amino acid conservation in homodimers. Proteins. 2001;42:108–124. [PubMed] [Google Scholar]
- 18.Fernandez A, Scheraga HA. Insufficiently dehydrated hydrogen bonds as determinants of protein interactions. Proc Natl Acad Sci U S A. 2003;100:113–118. doi: 10.1073/pnas.0136888100. [DOI] [PMC free article] [PubMed] [Google Scholar]
- 19.Janin J, Henrick K, Moult J, Eyck LT, Sternberg MJ, Vajda S, Vakser I, Wodak SJ. CAPRI: a Critical Assessment of PRedicted Interactions. Proteins. 2003;52:2–9. doi: 10.1002/prot.10381. [DOI] [PubMed] [Google Scholar]
- 20.Burley SK. An overview of structural genomics. Nat Struct Biol. 2000;7(Suppl):932–934. doi: 10.1038/80697. [DOI] [PubMed] [Google Scholar]
- 21.Smith GR, Sternberg MJ, Bates PA. The relationship between the flexibility of proteins and their conformational states on forming protein-protein complexes with an application to protein-protein docking. J Mol Biol. 2005;347:1077–1101. doi: 10.1016/j.jmb.2005.01.058. [DOI] [PubMed] [Google Scholar]
- 22.Gray JJ. High-resolution protein-protein docking. Curr Opin Struct Biol. 2006;16:183–193. doi: 10.1016/j.sbi.2006.03.003. [DOI] [PubMed] [Google Scholar]
- 23.Uversky VN. What does it mean to be natively unfolded? Eur J Biochem. 2002;269:2–12. doi: 10.1046/j.0014-2956.2001.02649.x. [DOI] [PubMed] [Google Scholar]
- 24.Choy WY, Forman-Kay JD. Calculation of ensembles of structures representing the unfolded state of an SH3 domain. J Mol Biol. 2001;308:1011–1032. doi: 10.1006/jmbi.2001.4750. [DOI] [PubMed] [Google Scholar]
- 25.Dunker AK, Obradovic Z. The protein trinity--linking function and disorder. Nat Biotechnol. 2001;19:805–806. doi: 10.1038/nbt0901-805. [DOI] [PubMed] [Google Scholar]
- 26.Dyson HJ, Wright PE. Coupling of folding and binding for unstructured proteins. Curr Opin Struct Biol. 2002;12:54–60. doi: 10.1016/s0959-440x(02)00289-0. [DOI] [PubMed] [Google Scholar]
- 27.Uversky VN, Oldfield CJ, Dunker AK. Showing your ID: intrinsic disorder as an ID for recognition, regulation and cell signaling. J Mol Recognit. 2005;18:343–384. doi: 10.1002/jmr.747. [DOI] [PubMed] [Google Scholar]
- 28.Strong M, Sawaya MR, Wang S, Phillips M, Cascio D, Eisenberg D. Toward the structural genomics of complexes: crystal structure of a PE/PPE protein complex from Mycobacterium tuberculosis. Proc Natl Acad Sci U S A. 2006;103:8060–8065. doi: 10.1073/pnas.0602606103. [DOI] [PMC free article] [PubMed] [Google Scholar]
- 29.Dunker AK, Obradovic Z, Romero P, Garner EC, Brown CJ. Intrinsic protein disorder in complete genomes. Genome Inform Ser Workshop Genome Inform. 2000;11:161–171. [PubMed] [Google Scholar]
- 30.Ward JJ, Sodhi JS, McGuffin LJ, Buxton BF, Jones DT. Prediction and functional analysis of native disorder in proteins from the three kingdoms of life. J Mol Biol. 2004;337:635–645. doi: 10.1016/j.jmb.2004.02.002. [DOI] [PubMed] [Google Scholar]
- 31.Oldfield CJ, Cheng Y, Cortese MS, Brown CJ, Uversky VN, Dunker AK. Comparing and combining predictors of mostly disordered proteins. Biochemistry. 2005;44:1989–2000. doi: 10.1021/bi047993o. [DOI] [PubMed] [Google Scholar]
- 32.Oldfield CJ, Cheng Y, Cortese MS, Romero P, Uversky VN, Dunker AK. Coupled folding and binding with alpha-helix-forming molecular recognition elements. Biochemistry. 2005;44:12454–12470. doi: 10.1021/bi050736e. [DOI] [PubMed] [Google Scholar]
- 33.Mohan A, Radivojac P, Oldfield CJ, Vacic V, Cortese MS, Dunker AK, Uversky VN. Analysis of molecular recognition features (MoRFs) J Mol Biol. 2006 doi: 10.1016/j.jmb.2006.07.087. Submitted. [DOI] [PubMed] [Google Scholar]
- 34.Pontius BW. Close encounters: why unstructured, polymeric domains can increase rates of specific macromolecular association. Trends Biochem Sci. 1993;18:181–186. doi: 10.1016/0968-0004(93)90111-y. [DOI] [PubMed] [Google Scholar]
- 35.Shoemaker BA, Portman JJ, Wolynes PG. Speeding molecular recognition by using the folding funnel: the fly-casting mechanism. Proc Natl Acad Sci U S A. 2000;97:8868–8873. doi: 10.1073/pnas.160259697. [DOI] [PMC free article] [PubMed] [Google Scholar]
- 36.Evans PR, Owen DJ. Endocytosis and vesicle trafficking. Curr Opin Struct Biol. 2002;12:814–821. doi: 10.1016/s0959-440x(02)00395-0. [DOI] [PubMed] [Google Scholar]
- 37.Berman HM, Westbrook J, Feng Z, Gilliland G, Bhat TN, Weissig H, Shindyalov IN, Bourne PE. The Protein Data Bank. Nucleic Acids Res. 2000;28:235–242. doi: 10.1093/nar/28.1.235. [DOI] [PMC free article] [PubMed] [Google Scholar]
- 38.Minor DL, Jr, Kim PS. Context-dependent secondary structure formation of a designed protein sequence. Nature. 1996;380:730–734. doi: 10.1038/380730a0. [DOI] [PubMed] [Google Scholar]
- 39.Jacoboni I, Martelli PL, Fariselli P, Compiani M, Casadio R. Predictions of protein segments with the same aminoacid sequence and different secondary structure: a benchmark for predictive methods. Proteins. 2000;41:535–544. doi: 10.1002/1097-0134(20001201)41:4<535::aid-prot100>3.0.co;2-c. [DOI] [PubMed] [Google Scholar]
- 40.Kabsch W, Sander C. Dictionary of protein secondary structure: pattern recognition of hydrogen-bonded and geometrical features. Biopolymers. 1983;22:2577–2637. doi: 10.1002/bip.360221211. [DOI] [PubMed] [Google Scholar]
- 41.Connolly ML. Solvent-accessible surfaces of proteins and nucleic acids. Science. 1983;221:709–713. doi: 10.1126/science.6879170. [DOI] [PubMed] [Google Scholar]
- 42.Miller S, Janin J, Lesk AM, Chothia C. Interior and surface of monomeric proteins. J Mol Biol. 1987;196:641–656. doi: 10.1016/0022-2836(87)90038-6. [DOI] [PubMed] [Google Scholar]
- 43.Romero P, Obradovic Z, Li X, Garner EC, Brown CJ, Dunker AK. Sequence complexity of disordered protein. Proteins. 2001;42:38–48. doi: 10.1002/1097-0134(20010101)42:1<38::aid-prot50>3.0.co;2-3. [DOI] [PubMed] [Google Scholar]
- 44.Efron B, Tibshirani RJ. An Introduction to the Bootstrap. Chapman and Hall; New York: 1993. [Google Scholar]
- 45.Cover TM, Thomas JA. Elements of Information Theory. Wiley; New York: 1991. [Google Scholar]
- 46.Bland JM, Altman DG. Multiple significance tests: the Bonferroni method. Bmj. 1995;310:170. doi: 10.1136/bmj.310.6973.170. [DOI] [PMC free article] [PubMed] [Google Scholar]
- 47.Janin J. Surface and inside volumes in globular proteins. Nature. 1979;277:491–492. doi: 10.1038/277491a0. [DOI] [PubMed] [Google Scholar]
- 48.Vihinen M, Torkkila E, Riikonen P. Accuracy of protein flexibility predictions. Proteins. 1994;19:141–149. doi: 10.1002/prot.340190207. [DOI] [PubMed] [Google Scholar]
- 49.Fauchere JL, Pliska V. Hydrophobic parameters pi of amino acid side chains from the partitioning of N-acetyl-amino acid amides. Eur J Med Chem. 1983;18:369–375. [Google Scholar]
- 50.Domingos P, Pazzani M. On the optimality of the simple Bayesian classifier under zero-one loss. Machine Learning. 1997;29:103–137. [Google Scholar]
- 51.Obradovic Z, Peng K, Vucetic S, Radivojac P, Dunker AK. Exploiting heterogeneous sequence properties improves prediction of protein disorder. Proteins. 2005;61(Suppl 7):176–182. doi: 10.1002/prot.20735. [DOI] [PubMed] [Google Scholar]
- 52.Russo AA, Jeffrey PD, Patten AK, Massague J, Pavletich NP. Crystal structure of the p27Kip1 cyclin-dependent-kinase inhibitor bound to the cyclin A-Cdk2 complex. Nature. 1996;382:325–331. doi: 10.1038/382325a0. [DOI] [PubMed] [Google Scholar]
- 53.Gulbis JM, Kelman Z, Hurwitz J, O’Donnell M, Kuriyan J. Structure of the C-terminal region of p21 (WAF1/CIP1) complexed with human PCNA. Cell. 1996;87:297–306. doi: 10.1016/s0092-8674(00)81347-1. [DOI] [PubMed] [Google Scholar]
- 54.Kriwacki RW, Hengst L, Tennant L, Reed SI, Wright PE. Structural studies of p21Waf1/Cip1/Sdi1 in the free and Cdk2-bound state: conformational disorder mediates binding diversity. Proc Natl Acad Sci U S A. 1996;93:11504–11509. doi: 10.1073/pnas.93.21.11504. [DOI] [PMC free article] [PubMed] [Google Scholar]
- 55.Garner E, Romero P, Dunker AK, Brown C, Obradovic Z. Predicting Binding Regions within Disordered Proteins. Genome Inform Ser Workshop Genome Inform. 1999;10:41–50. [PubMed] [Google Scholar]
- 56.Callaghan AJ, Aurikko JP, Ilag LL, Gunter Grossmann J, Chandran V, Kuhnel K, Poljak L, Carpousis AJ, Robinson CV, Symmons MF, Luisi BF. Studies of the RNA degradosome-organizing domain of the Escherichia coli ribonuclease RNase E. J Mol Biol. 2004;340:965–979. doi: 10.1016/j.jmb.2004.05.046. [DOI] [PubMed] [Google Scholar]
- 57.Rout MP, Aitchison JD, Suprapto A, Hjertaas K, Zhao Y, Chait BT. The yeast nuclear pore complex: composition, architecture, and transport mechanism. J Cell Biol. 2000;148:635–651. doi: 10.1083/jcb.148.4.635. [DOI] [PMC free article] [PubMed] [Google Scholar]
- 58.Rexach M, Blobel G. Protein import into nuclei: association and dissociation reactions involving transport substrate, transport factors, and nucleoporins. Cell. 1995;83:683–692. doi: 10.1016/0092-8674(95)90181-7. [DOI] [PubMed] [Google Scholar]
- 59.Denning D, Mykytka B, Allen NP, Huang L, Al B, Rexach M. The nucleoporin Nup60p functions as a Gsp1p-GTP-sensitive tether for Nup2p at the nuclear pore complex. J Cell Biol. 2001;154:937–950. doi: 10.1083/jcb.200101007. [DOI] [PMC free article] [PubMed] [Google Scholar]
- 60.Denning DP, Uversky V, Patel SS, Fink AL, Rexach M. The Saccharomyces cerevisiae nucleoporin Nup2p is a natively unfolded protein. J Biol Chem. 2002;277:33447–33455. doi: 10.1074/jbc.M203499200. [DOI] [PubMed] [Google Scholar]
- 61.Matsumura P, Rydel JJ, Linzmeier R, Vacante D. Overexpression and sequence of the Escherichia coli cheY gene and biochemical activities of the CheY protein. J Bacteriol. 1984;160:36–41. doi: 10.1128/jb.160.1.36-41.1984. [DOI] [PMC free article] [PubMed] [Google Scholar]
- 62.Parkinson JS. Signal transduction schemes of bacteria. Cell. 1993;73:857–871. doi: 10.1016/0092-8674(93)90267-t. [DOI] [PubMed] [Google Scholar]
- 63.Appleby JL, Parkinson JS, Bourret RB. Signal transduction via the multi-step phosphorelay: not necessarily a road less traveled. Cell. 1996;86:845–848. doi: 10.1016/s0092-8674(00)80158-0. [DOI] [PubMed] [Google Scholar]
- 64.McEvoy MM, Bren A, Eisenbach M, Dahlquist FW. Identification of the binding interfaces on CheY for two of its targets, the phosphatase CheZ and the flagellar switch protein fliM. J Mol Biol. 1999;289:1423–1433. doi: 10.1006/jmbi.1999.2830. [DOI] [PubMed] [Google Scholar]
- 65.Dyer CM, Quillin ML, Campos A, Lu J, McEvoy MM, Hausrath AC, Westbrook EM, Matsumura P, Matthews BW, Dahlquist FW. Structure of the constitutively active double mutant CheYD13K Y106W alone and in complex with a FliM peptide. J Mol Biol. 2004;342:1325–1335. doi: 10.1016/j.jmb.2004.07.084. [DOI] [PubMed] [Google Scholar]
- 66.Chin D, Means AR. Calmodulin: a prototypical calcium sensor. Trends Cell Biol. 2000;10:322–328. doi: 10.1016/s0962-8924(00)01800-6. [DOI] [PubMed] [Google Scholar]
- 67.Radivojac P, Vucetic S, O’Connor TR, Uversky VN, Obradovic Z, Dunker AK. Calmodulin signaling: analysis and prediction of a disorder-dependent molecular recognition. Proteins. 2006;63:398–410. doi: 10.1002/prot.20873. [DOI] [PubMed] [Google Scholar]
- 68.Yap KL, Yuan T, Mal TK, Vogel HJ, Ikura M. Structural basis for simultaneous binding of two carboxy-terminal peptides of plant glutamate decarboxylase to calmodulin. J Mol Biol. 2003;328:193–204. doi: 10.1016/s0022-2836(03)00271-7. [DOI] [PubMed] [Google Scholar]
- 69.Zhang M, Tanaka T, Ikura M. Calcium-induced conformational transition revealed by the solution structure of apo calmodulin. Nat Struct Biol. 1995;2:758–767. doi: 10.1038/nsb0995-758. [DOI] [PubMed] [Google Scholar]
- 70.Bambara RA, Murante RS, Henricksen LA. Enzymes and reactions at the eukaryotic DNA replication fork. J Biol Chem. 1997;272:4647–4650. doi: 10.1074/jbc.272.8.4647. [DOI] [PubMed] [Google Scholar]
- 71.Maga G, Villani G, Tillement V, Stucki M, Locatelli GA, Frouin I, Spadari S, Hubscher U. Okazaki fragment processing: modulation of the strand displacement activity of DNA polymerase delta by the concerted action of replication protein A, proliferating cell nuclear antigen, and flap endonuclease-1. Proc Natl Acad Sci U S A. 2001;98:14298–14303. doi: 10.1073/pnas.251193198. [DOI] [PMC free article] [PubMed] [Google Scholar]
- 72.Matsumoto Y. Molecular mechanism of PCNA-dependent base excision repair. Prog Nucleic Acid Res Mol Biol. 2001;68:129–138. doi: 10.1016/s0079-6603(01)68095-4. [DOI] [PubMed] [Google Scholar]
- 73.Chapados BR, Hosfield DJ, Han S, Qiu J, Yelent B, Shen B, Tainer JA. Structural basis for FEN-1 substrate specificity and PCNA-mediated activation in DNA replication and repair. Cell. 2004;116:39–50. doi: 10.1016/s0092-8674(03)01036-5. [DOI] [PubMed] [Google Scholar]
- 74.Liu X, Dai S, Zhu Y, Marrack P, Kappler JW. The structure of a Bcl-xL/Bim fragment complex: implications for Bim function. Immunity. 2003;19:341–352. doi: 10.1016/s1074-7613(03)00234-6. [DOI] [PubMed] [Google Scholar]
- 75.Adams JM, Cory S. The Bcl-2 protein family: arbiters of cell survival. Science. 1998;281:1322–1326. doi: 10.1126/science.281.5381.1322. [DOI] [PubMed] [Google Scholar]
- 76.Petros AM, Olejniczak ET, Fesik SW. Structural biology of the Bcl-2 family of proteins. Biochim Biophys Acta. 2004;1644:83–94. doi: 10.1016/j.bbamcr.2003.08.012. [DOI] [PubMed] [Google Scholar]
- 77.Gellman SH. On the role of methionine residues in the sequence-independent recognition of nonpolar protein surfaces. Biochemistry. 1991;30:6633–6636. doi: 10.1021/bi00241a001. [DOI] [PubMed] [Google Scholar]
- 78.Gunasekaran K, Tsai CJ, Nussinov R. Analysis of ordered and disordered protein complexes reveals structural features discriminating between stable and unstable monomers. J Mol Biol. 2004;341:1327–1341. doi: 10.1016/j.jmb.2004.07.002. [DOI] [PubMed] [Google Scholar]
- 79.Gunasekaran K, Tsai CJ, Kumar S, Zanuy D, Nussinov R. Extended disordered proteins: targeting function with less scaffold. Trends Biochem Sci. 2003;28:81–85. doi: 10.1016/S0968-0004(03)00003-3. [DOI] [PubMed] [Google Scholar]
- 80.Linding R, Russell RB, Neduva V, Gibson TJ. GlobPlot: Exploring protein sequences for globularity and disorder. Nucleic Acids Res. 2003;31:3701–3708. doi: 10.1093/nar/gkg519. [DOI] [PMC free article] [PubMed] [Google Scholar]
- 81.Uversky VN, Gillespie JR, Fink AL. Why are “natively unfolded” proteins unstructured under physiologic conditions? Proteins. 2000;41:415–427. doi: 10.1002/1097-0134(20001115)41:3<415::aid-prot130>3.0.co;2-7. [DOI] [PubMed] [Google Scholar]
- 82.Fernandez-Recio J, Totrov M, Skorodumov C, Abagyan R. Optimal docking area: a new method for predicting protein-protein interaction sites. Proteins. 2005;58:134–143. doi: 10.1002/prot.20285. [DOI] [PubMed] [Google Scholar]
- 83.Arkin MR, Randal M, DeLano WL, Hyde J, Luong TN, Oslob JD, Raphael DR, Taylor L, Wang J, McDowell RS, Wells JA, Braisted AC. Binding of small molecules to an adaptive protein-protein interface. Proc Natl Acad Sci U S A. 2003;100:1603–1608. doi: 10.1073/pnas.252756299. [DOI] [PMC free article] [PubMed] [Google Scholar]
- 84.Marcotte EM, Pellegrini M, Ng HL, Rice DW, Yeates TO, Eisenberg D. Detecting protein function and protein-protein interactions from genome sequences. Science. 1999;285:751–753. doi: 10.1126/science.285.5428.751. [DOI] [PubMed] [Google Scholar]
- 85.Dandekar T, Snel B, Huynen M, Bork P. Conservation of gene order: a fingerprint of proteins that physically interact. Trends Biochem Sci. 1998;23:324–328. doi: 10.1016/s0968-0004(98)01274-2. [DOI] [PubMed] [Google Scholar]
- 86.Tan SH, Zhang Z, Ng SK. ADVICE: Automated Detection and Validation of Interaction by Co-Evolution. Nucleic Acids Res. 2004;32:W69–72. doi: 10.1093/nar/gkh471. [DOI] [PMC free article] [PubMed] [Google Scholar]
- 87.Brown CJ, Takayama S, Campen AM, Vise P, Marshall TW, Oldfield CJ, Williams CJ, Dunker AK. Evolutionary rate heterogeneity in proteins with long disordered regions. J Mol Evol. 2002;55:104–110. doi: 10.1007/s00239-001-2309-6. [DOI] [PubMed] [Google Scholar]