

Abstract
Toxicity induced by nitric oxide (NO•) has been extensively investigated in many in vitro and in vivo experimental models. Recently, our laboratories found that both concentration and cumulative total dose are critical determinants of cell death caused by NO•. Here, we report results of studies designed to define total dose thresholds and threshold effects for several NO•-induced toxicity and cellular responses and to determine impacts of p53 on them. We exposed human lymphoblastoid TK6 cells harboring wild-type p53 and isogenic p53-null NH32 cells to NO• delivered by a membrane delivery system. Cells were exposed at a steady state concentration of 0.6 μM for varying lengths of time to deliver increasing cumulative doses (expressed in units of μM min), and several endpoints of cytotoxicity and mutagenesis were quantified. Threshold doses for NO•-induced cytotoxicity were 150 μM min in TK6 cells and 300 μM min in NH32 cells, respectively. Threshold doses for NO•-induced apoptosis were identical to those for cytotoxicity, but mitochondrial depolarization thresholds were lower than those for cytotoxicity and apoptosis in both cell types. To gain insight into underlying mechanisms, cells of both types were exposed to sublethal (33% of cytotoxicity threshold), cytotoxicity threshold or toxic (twice the cytotoxicity threshold) doses of NO•. In TK6 cells (wild-type p53), the sublethal threshold dose induced DNA double-strand breaks, but nucleobase deamination products (xanthine, hypoxanthine and uracil) in DNA were increased only modestly (<50%) by toxic doses. Increased mutation frequency at the TK1 locus was observed only at the toxic dose of NO•. Treatment of NH32 cells with NO• at the threshold or toxic dose elevated mutagenesis of the TK1 gene, but did not cause detectable levels of DNA double-strand breaks. At similar levels of cell viability, the frequency of DNA recombinational repair was higher in p53-null NH32 cells than in wild-type TK6 cells. NO• treatment induced p53-independent cell cycle arrest predominately at the S phase. Akt signaling pathway and antioxidant proteins were involved in the modulation of toxic responses of NO•. These findings indicate that exposure to doses of NO• at or above the cytotoxicity threshold dose induces DNA double-strand breaks, mutagenesis, and protective cellular responses to NO• damage. Further, recombinational repair of DNA may contribute to resistance to NO• toxicity and potentially increase the risk of mutagenesis. The p53 plays a central role in these responses in human lymphoblastoid cells.
Keywords: nitric oxide, cytotoxicity, genotoxicity, threshold, human lymphoblastoid cells
Introduction
At low concentrations, nitric oxide (NO•)1 acts as a signaling molecule with regulatory roles in many physiological processes. However, high levels of NO•, such as those occurring during inflammation, can damage DNA, RNA, lipids, and proteins, leading to mutations and altered cell physiology that are hallmarks of the process of carcinogenesis (1, 2). Recently, our laboratories have found that both concentration and cumulative total dose are critical in initiating NO• toxicity (3). The threshold NO• concentration for cell death in human lymphoblastoid TK6 cells harboring wild-type p53 was ∼0.5 μM, while the comparable cumulative dose threshold was ∼150 μM min. If neither or only one threshold was exceeded, the cells grew and proliferated normally; when both thresholds were exceeded, the number of viable cells declined in a dose-dependent manner, indicating that both steady-state NO• levels and cumulative total doses above the cytotoxic thresholds are required for induction of cell death (3, 4). Wink and co-workers also found that different concentration thresholds of NO• released from donor drugs elicited a discrete set of signal transduction pathways associated with cell growth and apoptosis in human breast cancer MCF7 cells (5). At low steady-state concentrations (<50 nM), NO•-induced extracellular signal-regulated kinase (ERK) phosphorylation via a guanylate cyclase-dependent mechanism; hypoxic inducible factor 1 (HIF-1) accumulation was associated with an intermediate amount of NO• (>100 nM); whereas p53 serine 15 phosphorylation occurred at considerably higher levels (>300 nM). The dose-dependent effects of synthetic NO• donors were mimicked by activated macrophages co-cultured with MCF7 cells at varying ratios (5). These findings suggest that thresholds, which may be different for various cellular markers, are critical determinants in triggering physiological and toxic responses of NO•.
The p53 tumor suppressor gene is known as a critical cellular gatekeeper for growth and division through its involvement in damage-induced G1 arrest, DNA repair, apoptosis, and gene amplification (6). Our group and others have found that p53 status strongly affected NO•-induced cellular stress, DNA damage, mutagenesis, and apoptotic signaling pathways (7-10). The p53-null human lymphoblastoid cells NH32 cells were much more resistant to NO•-induced cell killing compared with wild-type TK6 cells (3, 4). Preliminary evidence revealed that p53 normally suppressed homologous recombination events that might otherwise contribute to genomic instability (11). Furthermore, we showed that repair processes that involved homologous recombination were pivotal in preventing NO•-induced toxicity, at least in E. coli (12, 13). Consequently, one possibility is that in the absence of normal p53, the levels of homology directed repair may rise, contributing both to resistance to toxicity and potentially increasing the risk of deleterious sequence rearrangements. Although homologous recombination induced by NO• has been observed in mouse embryonic stem cells (14), the role of p53 in modulating the susceptibility of cells to NO•-induced homologous recombination events has not been reported. Furthermore, it was not known how p53 status would affect the threshold exposures required to elicit cellular toxicity and/or homologous recombination repair.
In this study, we first determined the thresholds for NO•-induced cytotoxicity, mitochondrial depolarization, and apoptosis in human lymphoblastoid TK6 and NH32 cells. Three NO• doses for each cell type were established, namely, 33% of the threshold for cytotoxicity (designated sublethal), the cytotoxicity threshold, and twice the cytotoxicity threshold (toxic). These doses were then used in further experiments to investigate other dose-related endpoints of cellular response, as well as the role of p53 in these processes. A key feature was the use of a NO• delivery system specifically designed to provide controlled, steady-state concentrations of NO• and molecular oxygen (O2) mimicking the chemical environment thought to exist in inflamed tissues (3, 4, 15, 16). NO• and O2 are delivered into culture medium by diffusion through semipermeable Silastic® tubing to achieve constant and physiologically relevant levels of both gases (3, 4, 15, 16). Cells of the TK6 lymphoblastoid line, derived from a human spleen nearly thirty years ago, (17, 18) have been used extensively in mutagenicity and genotoxicity studies (3, 4, 8-10), and in some studies were used in conjunction with NH32 cells, an isogenic derivative of TK6 cells in which both alleles of the p53 gene were knocked out (19, 3, 4). We found that the NO• cytotoxicity threshold is associated with DNA double-strand breaks, mutagenesis, and protective cellular responses to NO•–induced damage, and that recombinational DNA repair may contribute both to resistance to NO• toxicity and potentially increase the risk of mutagenesis, in which p53 plays a central role.
Materials and Methods
Chemicals and Cells
TK6 cells were kindly provided by Dr. W.G. Thilly (Massachusetts Institute of Technology), and NH32 cells by Dr. C. C. Harris (National Cancer Institute). Cell culture reagents were purchased from Cambrex (Walkersville, MD). All gases were purchased from BOC Gases (Edison, NJ), and Silastic® tubing (0.058 inches i.d., 0.077 inches o.d.) from Dow Corning (Midland, MI). Propidium iodide, nuclease P1, alkaline phosphatase, trifluorothymidine, BrdU, and demecolcine were purchased from Sigma Chemical Co.; phosphodiesterase I from USB Corporation (Cleveland, Ohio); MTT assay kit and RNase from Roche Diagnostics GmbH (Mannheim, Germany); JC-1 (5,5′,6,6′-tetrachloro-1,1′,3,3′-tetraethylbenzimidazolylcarbocyanine iodide) from Molecular Probes (Eugene, OR); annexin V-FITC apoptotic assay kit from Clontech Laboratories (Palo Alto, CA); Puregene genomic DNA purification kit from Gentra Systems, Inc. (Minneapolis, MN); and supersignal ultrachemiluminescence kit from Pierce (Rockford, IL). Primary monoclonal anti-human Cu/Zn-superoxide dismutase (SOD1) antibody and monoclonal anti-human glutathione peroxidase (GPX) antibody were purchased from MBL (Woburn, MA); polyclonal anti-human catalase antibody from Calbiochem (San Diego, CA); monoclonal anti-p53 antibody (Ab-6) from Oncogene; PTEN antibody from Upstate (Lake Placid, NY); and anti-Akt antibody, anti-NF-κB antibody, PI3 kinase antibody and phosphor-Akt (Ser 473) antibody were from Cell Signaling Technology (Beverly, MA). Secondary goat or rabbit anti-mouse IgG conjugated to horseradish peroxidase was provided by Bio-Rad (Hercules, CA), and anti-actin antibody by Oncogene (Cambridge, MA).
Cell Culture and NO• Treatment
TK6 and NH32 cells were maintained in exponentially growing suspension cultures at 37 °C in a humidified, 5% CO2 atmosphere in RPMI medium1640 supplemented with 10% heat-inactivated donor calf serum, 100 units/ml penicillin, 100 μg/ml streptomycin, and 2 mM L-glutamine. Cell suspensions at a density of 5 x 10⁵ cells/ml in 115 ml of RPMI medium 1640 with calf serum were exposed, at 37 °C, to 1% NO•, delivered by diffusion through permeable Silastic® tubing at a steady state concentration of 0.6 μM, as reported previously (3, 4). A mixture of 50% O2 and 5% CO2 was delivered through a second tubing loop to maintain the liquid O2 level near air saturation. The total NO• dose delivered into the medium was controlled by varying the exposure time and expressed as μM min. Cells exposed to argon gas under the same conditions served as negative controls. For sister chromatid exchange assays, cells were exposed to 10% NO•, at a steady state concentration of 1.8 μM.
Cell Viability Analysis
Cell viability 48 h after treatment was determined by both trypan blue exclusion (8, 9) and MTT assay following the manufacturer's instructions. After determination of the thresholds for NO•-induced cell death, three NO• doses for each cell type, namely, sublethal, threshold and toxic as defined above were used in further experiments to investigate other dose-associated endpoints.
Cell Cycle Analysis
Cells were harvested 20 h after NO• treatment, washed twice in PBS and fixed in 70% cold ethanol overnight. Cells were suspended in 1% BSA (bovine serum albumin)-PBS solution containing 50 μg/ml propidium iodide and 50 μg/ml RNase incubated at 37 °C for 30 min and analyzed on a Becton Dickinson FACScan. Cell fit analysis determined the percentage of cells in a specific stage of the cell cycle.
Mitochondrial Membrane Potential and Apoptosis Analysis
Mitochondrial depolarization and apoptosis in the cells harvested 48 h after NO• treatment were quantitatively evaluated by a Becton Dickinson FACScan equipped with CellQuest software following JC-1 or annexin V-FITC and propidium iodide staining, respectively, according to methods reported previously (8, 9).
Analysis of DNA Double-strand Breaks (Neutral Comet Assay)
Following NO• treatment, cells at a density of 1 x 10⁵ cells/ml were combined with molten LMAgarose (at 42 °C) at a ratio of 1:10, and 50 μl was immediately pipetted onto CometSlides (Trevigen, Gaithersburg, MD) (8, 9). After incubation in lysis buffer (2.5 M sodium chloride, 100 mM EDTA pH 10, 10 mM Tris base, 1% sodium lauryl sarcosinate, and 0.01% Triton X-100), slides were electrophoresed, photographed, and analyzed with the Komet 4.2 Single Cell Gel Electrophoresis Analysis (Kinetic Imaging Limited, Liverpool, UK). Olive tail moment, defined as the product of percentage DNA in the tail and displacement between the position of the mean centers of mass in the heads and tails (20), was determined for at least 40 cells per sample. Cells treated with argon gas were used as negative controls, and cells treated with 100 μM H2O2 in RPMI medium1640 for 20 min at 4 °C as positive controls.
Sister Chromatid Exchange (SCE) Assay
SCE assay was performed following the method reported previously (21). Immediately after NO• treatment, aliquots of cell suspensions, were incubated with 20 μM BrdU in RPMI medium 1640 for 39 h (2 cell replication cycles), followed by further incubation with 0.1 μg/ml of demecolcine for an additional 6 h. The cells were subsequently harvested, resuspended, and incubated for 15 min at 37 °C in hypotonic solution (0.2% potassium chloride, 0.2% sodium citrate, and 10% fetal bovine serum) and fixed in Carnoy's solution. To produce “harlequin” chromosomes, slides were stained in Hoechst 33258 (5 μg/ml) for 20 min, mounted in 0.067 M Sorensen's buffer with a coverslip, and exposed to a General Electric 15-watt black light bulb at 65°C in 20 x SSC for 20 min. After staining with 5% Giemsa solution, twenty metaphase spreads were counted for each sample.
LC/MS/MS Quantification of DNA Base Deamination Lesions
Deoxynucleoside deamination products in cells treated with NO• were quantitatively evaluated by LC/MS/MS immediately after exposure using a previously reported LC/MS method (16) adapted to LC/MS/MS. Genomic DNA was isolated using a Puregene genomic DNA purification kit according to manufacturer's instructions, with deaminase inhibitors coformycin and tetrahydrouridine added into cell lysis buffer at final concentrations of 5 μg/ml and 125 μg/ml, respectively. Genomic DNA (50 μg) was hydrolyzed with nuclease P1, phosphodiesterase I, and alkaline phosphatase in the presence of deaminase inhibitors and appropriate amounts of isotope-labeled internal standards. The resulting deoxynucleoside mixture was resolved by C18 reversed phase HPLC and the fractions containing 2′-deoxyxanthosine (dX), 2′-deoxyinosine (dI) and 2′-deoxyuridine (dU) were collected for subsequent LC/MS/MS quantification in an API 3000 triple quadrupole mass spectrometer (Applied Biosystems, Foster City, CA, USA).
Determination of Mutant Fraction
After NO• treatment, cells were grown for 6-10 days to allow phenotypic expression and then plated in selective medium to determine mutant fraction (MF) at the TK1 locus (19, 22). A total of 24 x 106 TK6 cells from each treatment group were transferred to ten 96-well plates at densities of 40,000 cells per well in medium containing 2 μg/ml of trifluorothymidine (TFT) to select TK1 mutants. In the pilot experiments, TK1 mutants in NH32 cells were not measurable due to the large number of surviving cells under the experimental conditions used for TK6 cells and optimal conditions for studies with NH32 cells were determined to be plating at a density of 20,000 cells per well in medium containing 4 μg/ml of TFT. Cells from each culture were also plated at 1 cell per 100 μl per well in the absence of TFT to determine plating efficiency. After two weeks of incubation, colonies were counted and MF was calculated with the Poisson distribution (19, 22). The spontaneous mutation rate was estimated from the argon-treated cells, and the cells treated with 4-nitroquinoline 1-oxide (4-NQO; 140 ng/ml for 1.5 h) used as a positive control.
Western Blot Analysis
Cells were harvested at the indicated times after NO• treatment and 20 μg aliquots of whole cell lysate proteins were denatured, resolved on 15% SDS-PAGE gels, and electrotransferred at 180 mA for 1 h onto a polyvinylidene difluoride membrane (Bio-Rad). Blots were probed with primary antibodies overnight at 4°C, followed by a secondary goat anti-rabbit or anti-mouse IgG conjugated to horseradish peroxidase (1:3000 dilution), and determination of supersignal ultrachemiluminescence by exposure to Hyperfilm ECL (Amersham Pharmacia, Piscataway). To control for protein loading, membranes were stripped and re-probed with anti-actin antibody (1:3000 dilution) (Oncogene, Cambridge, MA). All primary antibodies were diluted to 1:1000, except for anti-human glutathione peroxidase antibody (1:500 dilution) and anti-human catalase antibody (1μg/ml).
Statistical Analysis
All experiments were repeated two to four times after experimental conditions were optimized. Statistical analysis was performed using a two-tailed Student's t-test, and p < 0.05 was considered to be statistically significant.
Results
Using a recently developed controlled NO• delivery system (3, 4, 15, 16), TK6 and NH32 cells were exposed to steady-state concentration of 0.6 μM NO• and 180 μM O2 for 1 to 24 h, which resulted in cumulative total NO• doses ranging from 35 to 920 μM min. As shown in Figure 1, NO• induced cell death in a dose-dependent manner in both cell lines; both the trypan blue exclusion and MTT assays produced similar results with 48 h cytotoxicity (data not shown). However, NH32 cells were more resistant to NO•-induced growth inhibition or killing than TK6 cells. For example, when treated with 600 μM min of NO•, cell viability 48 h after exposure was approximately 5% in TK6 cells, whereas it was nearly 50% in NH32 cells, compared to argon-treated controls. Thresholds for NO•-induced cell death were shown to be approximately 150 μM min in TK6 cells and 300 μM min in NH32 cells, respectively. NO• treatment at doses below these cytotoxicity threshold levels did not lead to detectable cell death in either cell type and argon treatment had no effect on cell survival (data not shown). These results are essentially consistent with our earlier findings (3).
Figure 1.

Cell viability in TK6 and NH32 cells 48 h after NO• treatment, as determined by MTT assay. Data represent the mean of two to four duplicate experiments. Standard deviations were less than 15% (not shown).
Next, we assessed the relationship of mitochondrial depolarization and apoptosis to the NO• cytotoxicity threshold. As shown in Figure 2, NO• treatment of TK6 and NH32 cells resulted in a dose-dependent mitochondrial membrane potential loss (MMP loss) and apoptosis in both cell lines 48 h after exposure, although TK6 cells were comparatively more sensitive to mitochondrial damage and apoptosis. The threshold doses for NO•-induced apoptosis were identical to the cytotoxicity thresholds in both cell lines (150 μM min in TK6 cells, and 300 μM min in NH32 cells). Thresholds for mitochondrial depolarization (35 μM min in TK6 cells, and 225 μM min in NH32 cells) were lower than the cytotoxicity and apoptosis thresholds in both cell types. Further studies were then performed using three NO• doses relative to cell death threshold for each cell type, namely, 33% of the threshold (sublethal), the threshold, and twice the threshold dose (toxic). Cell cycle changes were measured in TK6 and NH32 cells 20 h after exposure to these doses, with results shown in Table 1. While NO• treatment induced cell cycle arrest, mainly at the S phase, in TK6 cells treated with toxic dose (300 μM min), this response was observed in NH32 cells at the lower sublethal dose (150 μM min). Exposure of NH32 cells to the toxic NO• dose (600 μM min) caused arrest at both S and G2/M phases. Cell cycle behavior of argon-exposed controls was not significantly different from unexposed cells (data not shown).
Figure 2.

NO• dose-dependent mitochondrial membrane potential loss (MMP loss) and apoptosis in TK6 and NH32 cells 48 h after exposure. The threshold doses for NO-induced MMP loss and apoptosis were approximately 35 and 150 μM min in TK6 cells, and 225 and 300 μM min in NH32 cells. Data represent the mean ± SD of three independent experiments, each was done in duplicate.
Table 1. Effects of NO• on Cell Cycle in TK6 and NH32 Cells 20 h after Treatment (N = 4).
| Total NO• dose
(μM min) |
% Distribution (Mean ± SD)
|
||
|---|---|---|---|
| G1/G0 | S | G2/M | |
| TK6 Cells | |||
| Argon | 32.0 ± 4.1 | 50.5 ± 7.9 | 17.6 ± 4.6 |
| 50 | 37.0 ± 0.9 | 42.3 ± 0.4 | 20.7 ± 0.6 |
| 150 (threshold) | 40.6 ± 0.5 | 40.6 ± 1.0 | 18.8 ± 1.4 |
| 300 | 30.4 ± 2.3 | 59.8 ± 1.6* | 9.9 ± 3.8 |
|
| |||
| NH32 Cells | |||
| Argon | 43.5 ± 3.3 | 42.6 ± 4.8 | 13.9 ± 3.2 |
| 150 | 27.2 ± 1.7 | 53.2 ± 2.3* | 19.6 ± 1.4 |
| 300 (threshold) | 37.1 ± 3.5 | 52.2 ± 3.1* | 10.8 ± 2.7 |
| 600 | 9.6 ± 1.0 | 57.4 ± 2.0* | 33.0 ± 1.8** |
p < 0.05, and
p < 0.01, compared with argon controls.
Induction of DNA double-strand breaks by NO• was evaluated by neutral comet assay immediately after NO• treatment, with the results shown in Figure 3. The Olive tail moment was significantly increased in TK6 cells treated with NO• at threshold (150 μM min) (14 ± 16) or toxic (300 μM min) (26 ± 36) doses, compared with argon-treated control (2.7 ± 2.1) (p < 0.01). In contrast, DNA double-strand breaks did not show significant changes in NH32 cells treated with NO• at any dose. As a positive control, 100 μM H2O2 treatment increased significantly DNA tail moment in TK6 cells (8.7 ± 2.9 vs. 2.7 ± 2.1, p < 0.01), but not in NH32 cells (8.4 ± 6.3 vs. 5.8 ± 4.1) (p > 0.05).
Figure 3.

Box-and-whisker plots of Olive tail moments from neutral comet assays of TK6 and NH32 cells right after NO• treatment. At least 40 cells were analyzed in each sample. Cells treated with argon (Ar) gas or with H2O2 were used as negative and positive controls, respectively. Data from H2O2 treatment were not shown. * p < 0.01, compared with argon-treated control.
To test the hypothesis that p53-regulated DNA recombination repair is responsible for the differences in DNA double-strand breaks and mutagenesis between TK6 and NH32 cells, SCE was measured in both cell types treated with NO• at 300 and 600 μM min (Table 2). Exposure to 300 μM min NO• did not increase SCE frequency in either cell type, but it was significantly elevated in both TK6 and NH32 cells treated with 600 μM min of NO•, compared with argon-treated cells. TK6 and NH32 cells showed similar SCE frequency when treated with argon gas. As seen in Figure 1, TK6 cells treated with 300 μM min of NO• and NH32 cells treated with 600 μM min of NO• had a similar cell viability of about 50%, however, SCE frequency was greater in NH32 cells than in TK6 cells under the equivalently cytotoxic conditions (p < 0.01).
Table 2. Sister Chromatid Exchange (SCE) Induced by NO• in TK6 and NH32 Cells (N = 4).
| NO• dose
(μM min) |
SCE (x 10-2/chromosome) (mean ± SD)
|
|
|---|---|---|
| TK6 Cells | NH32 Cells | |
| Argon | 7.3 ± 0.8 | 7.9 ± 0.5 |
| 300 | 8.4 ± 0.4 | 8.8 ± 0.2 |
| 600 | 19.8 ± 3.7* | 24.7 ± 1.9** |
p < 0.01, and
p < 0.05, compared with argon controls.
Under the same experimental conditions, we analyzed nucleobase deamination in TK6 and NH32 cells immediately after NO• treatment. NO• treatment led to elevated formation of dU, dX, and dI in DNA of TK6 and NH32 cells in a dose-dependent fashion, but the rise was independent of p53 status (Figure 4). The only statistically significant increase in a DNA deamination products over controls occurred with dU in NH32 cells treated with 600 μM min of NO• (70.9 ± 15.2 lesions per 106 nt) (p <0.05) (Figure 4).
Figure 4.
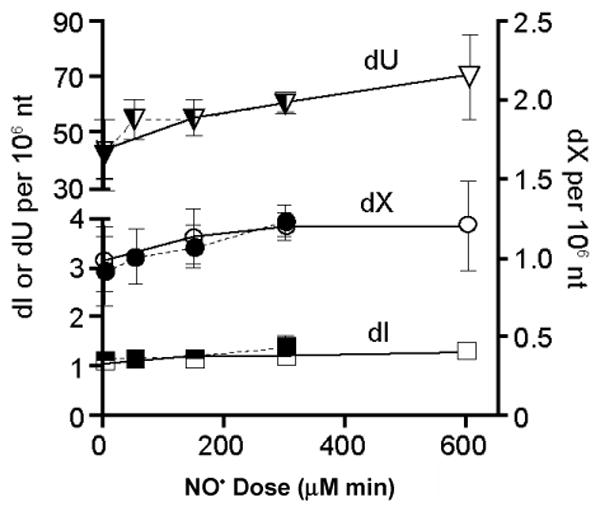
Formation of dU, dX, and dI in DNA of TK6 (solid) and NH32 (open) cells exposed to NO• at the sublethal, threshold and toxic doses (50, 150 and 300 μM min for TK6 cells; 150, 300 and 600 μM min for NH32 cells), respectively. The only statistically significant increase in a DNA deamination product over control occurred with dU in NH32 cells treated with 600 μM min NO• (p <0..05). Data represent the mean ± SD for N = 4.
NO•-induced changes in MF at the TK1 locus in TK6 and NH32 cells are summarized in Table 3. MF in TK6 cells increased 2.8-fold when treated with the toxic NO• dose (300 μM min) compared with argon-treated cells (p < 0.01), whereas the sublethal (50 μM min) and threshold (150 μM min) doses were ineffective (p > 0.05). NH32 cells treated with NO• at the threshold (300 μM min) or toxic doses (600 μM min) showed increases in MF of 1.7-fold compared with argon-treated cells (p < 0.05); the sublethal dose (150 μM min) was ineffective (p > 0.05). Spontaneous as well as NO•- and 4-NQO-induced MF were significantly higher in NH32 cells than in TK6 cells (p < 0.05, or p < 0.01) when compared at the corresponding sublethal, threshold, and toxic doses, or the same dose levels.
Table 3. Mutagenesis in the TK1 Gene of TK6 and NH32 Cells Exposed to NO• (N = 4).
| NO• dose
(μM min) |
MF × 10-6 (Mean ± SD) |
NO• dose
(μM min) |
MF × 10-6 (Mean ± SD) |
|---|---|---|---|
| TK6 Cells | NH32 Cells | ||
| Argon | 6.8 ± 0.6 | Argon | 16.6 ± 2.3 |
| 50 | 7.2 ± 0.1 | 150 | 18.9 ± 0.5 |
| 150 (threshold) | 7.9 ± 0.6 | 300 (threshold) | 28.6 ± 2.5** |
| 300 | 19.3 ± 0.7* | 600 | 28.4 ± 1.8** |
| 4-NQO | 26.1 ± 3.7* | 4-NQO | 71.2 ± 7.8 * |
p < 0.01, and
p < 0.05, compared with argon controls.
We next assessed changes in levels of the antioxidant proteins SOD1, catalase, and GPX in response to NO• treatment. SOD1 protein in argon-treated control cells was higher in TK6 cells than in NH32 cells; after NO• treatment, levels were significantly reduced in TK6 cells treated with the toxic dose (300 μM min) (p < 0.05), but increased in NH32 cells treated with threshold (300 μM min) or toxic doses (600 μM min) (p < 0.05) (Figure 5A). Expression of catalase protein was slightly lower in TK6 cells than in NH32 cells treated with argon gas, but levels were substantially upregulated only in TK6 cells (p < 0.05) after NO• treatment (Figure 5B). Under the same conditions, GPX levels were unchanged in both cell types (Figure 5C). The prosurvival and antiapoptotic protein Akt (23), transcription factor NF-κB p50 and p65 proteins (24) were prominently expressed in argon-treated TK6 and NH32 cells. Levels of Akt and NF-κB p65 were significantly suppressed following NO• treatment, even at the sublethal dose (50 μM min) in TK6 cells (p < 0.05, or p < 0.01)), but not at any dose in NH32 cells (Figure 6).
Figure 5.
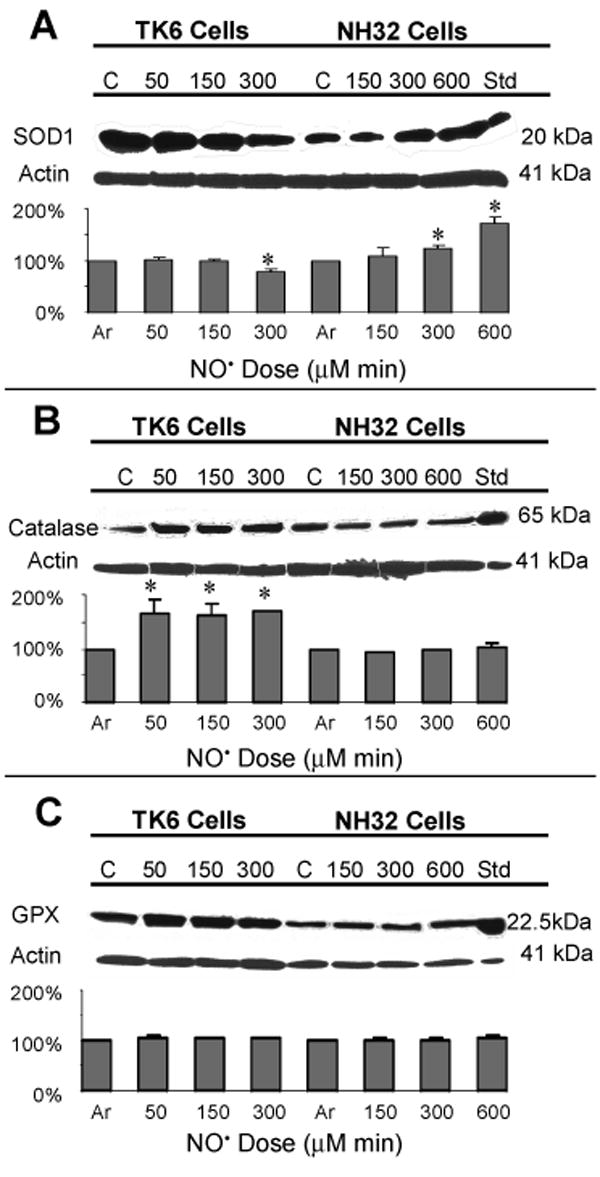
Immunoblot analysis of levels of SOD1, catalase and glutathione peroxidase (GPX) proteins in TK6 and NH32 cells following various doses of NO• treatment. Jurkat cells treated with 4 μM staurosporine were used as positive controls for SOD1 and catalase, and HL60 cells for GPX. Lower panels show changes from argon-treated negative controls. Values are mean quantitative densitometric values and 95% confidence intervals from two to three independent experiments. * p < 0.05, compared with argon-treated controls.
Figure 6.
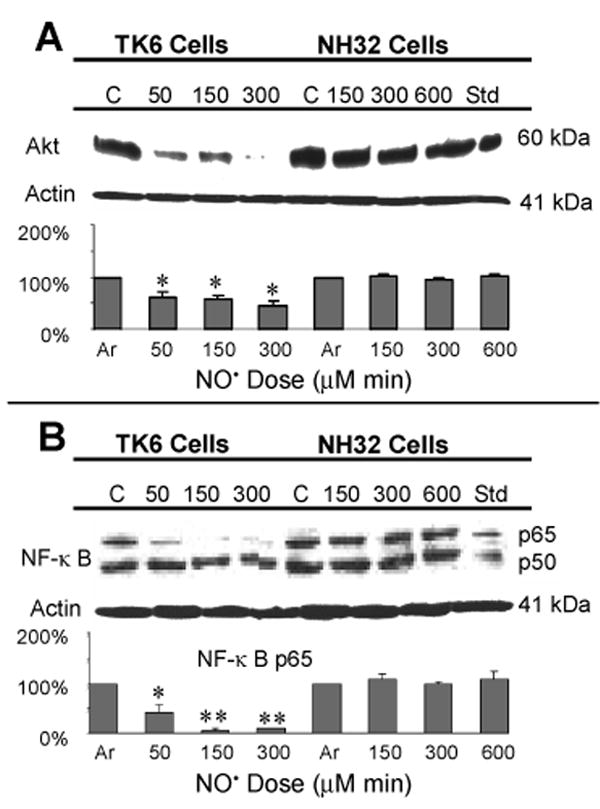
Immunoblot analysis of Akt and NF-κB p50 and p65 proteins in TK6 and NH32 cells following various doses of NO• treatment. Jurkat cells treated with 4 μM staurosporine were used as positive controls and densitometric analyses were as indicated in Figure 5. Values are mean quantitative densitometric values and 95% confidence intervals from two to three independent experiments. * p < 0.05 and ** p < 0.01, compared with argon-treated controls. Changes in levels of NF-κB p50 protein were not statistically significant (p > 0.05) and the densitometric values not shown.
Components of the Akt signaling pathway were characterized following treatment with the toxic doses of NO• in TK6 (300 μM min) and NH32 (600 μM min) cells. p53 protein levels increased progressively in TK6 cells through 48 h after exposure, reaching a maximum elevation of 228% compared with argon-treated cells; p53 protein was undetectable in NH32 cells (Figure 7A). PTEN tumor suppressor protein, known to be up-regulated by p53 (25), was virtually undetectable in argon-treated TK6 cells, but after NO• treatment, levels increased 130% at 24 h, declining to 117% at 48 h. As expected, while PTEN was expressed in argon-treated NH32 cells, it remained unchanged after NO• exposure (Figure 7B). PI3 kinase protein, negatively regulated by PTEN (26), was undetectable in TK6 cells treated with argon or NO•. Very low levels of PI3 kinase protein were detected in argon-treated NH32 cells and its level increased to 115% at 24 h and 123% at 48 h after treatment (Figure 7C). Phosphorylated Akt protein was prominently expressed in argon-treated TK6 and NH32 cells; and its levels decreased 25–38% from control levels over a 48 h period in TK6 cells after NO• treatment, but showed no change in NH32 cells during the same period (Figure 7D).
Figure 7.
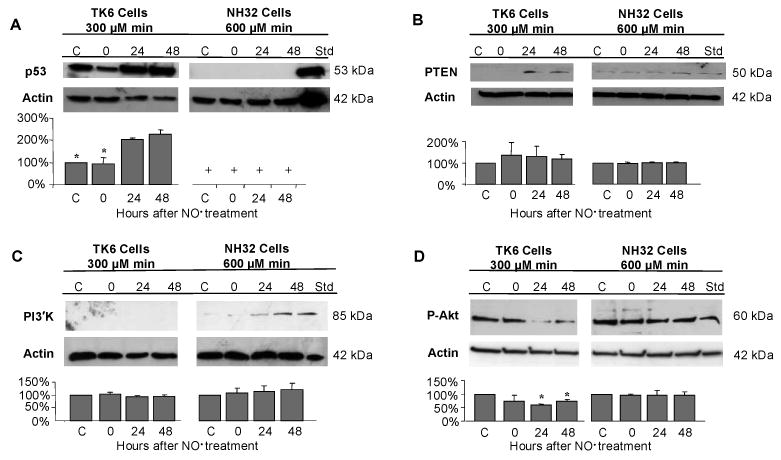
Immunoblot analysis of p53 (A), PTEN (B), PI3 kinase (PI3'K) (C) and phosphorylated Akt (p-Akt) (D) in TK6 (300 μM min) and NH32 cells (600 μM min) following treatment of toxic doses of NO•. Jurkat cells treated with 4 μM staurosporine were used as positive controls and densitometric analysis were as indicated in Figure 5. Values are mean quantitative densitometric values and 95% confidence intervals from two to three independent experiments. + p53 protein was not detectable in NH32 cells. * p < 0.05, compared with argon-treated controls.
Discussion
The goal of this study was to determine relationships between the threshold for NO•-induced cytotoxicity and more mechanistically informative biological endpoints such as genotoxicity, apoptosis, DNA repair and cell signaling parameters. A key feature was the controlled delivery of NO• under conditions designed to mimic the in vivo situation found in inflamed tissues. In earlier related investigations, we found that both concentration and cumulative total dose were critical in initiating NO• toxicity (3, 4). Here we confirmed that at a steady state concentration of 0.6 μM, the thresholds for NO•-induced cell death were approximately 150 μM min in TK6 cells and 300 μM min in NH32 cells. If the thresholds were not exceeded, cells proliferated normally. When the doses were increased above the threshold values, NO• induced dose-dependent cellular toxicity and death. Interestingly, the thresholds for NO•-induced apoptosis were identical to the cytotoxicity thresholds; whereas the thresholds for mitochondrial depolarization were lower in both cell types, suggesting that mitochondria were relatively sensitive to damage by NO•. We measured necrosis in TK6 and NH32 cells 48 h after NO• treatment with the sublethal, threshold and toxic doses, by flow cytometry following propidium iodide staining and found that necrosis did not constitute a significant part of cell loss (data not shown). Apoptosis accounted for only a small percentage of reduced cell viability in both cell lines. For example, treatment of TK6 cells with 300 μM min of NO• resulted in approximately 55% cell viability compared with argon-treated control cells, yet apoptosis was responsible for only 9% of the cell loss seen (Figure 1 and 2). The remainder of the cell loss was accounted for by NO•-induced p53-independent cytostasis and cell cycle arrest at the S phase or both S and G2/M phases (Table 1). Other investigators have reported that NO• produced from DETA-NONOate at a steady-state concentration of 0.5 μM induced cytostasis and cell cycle arrest at G1 phase in human breast cancer cells and that down-regulation of cyclin D1 played an important role in these processes (27). Cell cycle arrest induced by DNA damaging agents is presumed to provide the cell time to repair potentially mutagenic and cytotoxic DNA damage (28). The S phase arrest is thought to result from damage in DNA replicons, suppressing DNA synthesis or elongation (29, 30). If the cell can repair the damage, replication resumes, with the production of replacement cells; if damage is unrepairable, apoptosis may be initiated to eliminate irreversible injured cells (28, 30). Our findings derived from cell cycle, apoptosis and necrosis analyses, in comparison with the cell viability data, suggest that cytostasis and mitochondria-dependent apoptosis are responsible for NO•-induced cell viability loss at biologically-relevant exposure conditions.
We found that cytotoxicity threshold and higher doses of NO• induced a significant number of DNA double-strand breaks in wild-type TK6 cells, but not in p53-null NH32 cells, implying that p53 is required for most, if not all, NO•-induced DNA double-strand breaks, a potent inducer of apoptosis (31). Substantial evidence has demonstrated that NO•-induced DNA double-strand breaks are caused mainly by enzymatic processing of the primary lesions created by NO• exposure (32, 33). The majority are base lesions, most of which are repaired via the base excision repair (BER) pathway (13, 34). During excision repair, single strand breaks are formed as intermediates, which can lead to formation of double-strand breaks, possibly during DNA replication (12, 13, 21). We observed that NO• induced DNA base deamination in a dose-dependant fashion, but independent of p53 status. It is noteworthy that these are steady-state levels of dI, dX and dU and many DNA base lesions have probably been repaired by the BER system or removed shortly after formation, potentially by DNA glycosylase (13, 35). p53 has been shown to modulate the efficiency of BER in mammalian cells (36) and yet to interact directly with proteins and DNA intermediates that are formed during homologous recombination (37- 39), which is a major pathway for DNA double-strand break repair (40, 41).
Our SCE analysis showed that under equivalently cytotoxic conditions, p53-null NH32 cells are susceptible to NO• damage-induced recombination events. Since DNA double-strand breaks are potent inducers of homologous recombination (30, 31, 34, 40), it is paradoxical that the levels of DNA double-strand breaks and SCEs are opposite to the expected relationship in these data: high DNA double-strand breaks coincide with low SCEs in the wild type cells, and vice versa in the p53-null cells. A possible explanation is that p53 plays a major role in modulating cell cycle arrest and apoptosis, and suppression of either activity could potentially increase the frequency of homologous recombination – e.g., without arrest, forks hit more lesions and recombine more; without apoptosis, cells loaded with recombinogenic damage that would have been killed by damage survive instead. The latter hypothesis may apply here. Because the recombinational repair of DNA double-strand breaks is replication-dependent (41), SCEs can be analyzed only in cells that are able to go through two rounds of replication (21) after NO• exposure. As noted, a large number of TK6 cells containing lethal amounts DNA double-strand breaks may go through apoptosis as a result of their functional p53 before they can complete two cycles of cell division. On the other hand, NH32 cells do not die through apoptosis, but rather keep dividing due to lack of p53. As a result, SCE frequency is higher in NH32 cells relative to TK6 cells. Alternatively, p53-regulated non-homologous end joining (42) may be a potential repair mechanism of DNA double-strand breaks in these human lymphoblasts. High recombinational activity between misaligned sequences in p53 dysfunctional cells may have led to inappropriate DNA repair and thus increased mutagenesis (43-45), as confirmed in this investigation: a higher mutagenesis at the TK1 locus was induced by NO• treatment in NH32 cells than in TK6 cells.
We further probed underlying causes of the reduced toxicity and reduced DNA double-strand breaks observed in the p53-null cells and found striking differences between the wild-type and p53-null cells in the levels of key proteins involved in regulation of cell survival/death and in defending against reactive oxygen and nitrogen species. NO• treatment diminished levels of the prosurvival and antiapoptotic proteins Akt and NF-κB (23, 24, 46) only in TK6 cells. Increased protein levels of catalase, which detoxifies hydrogen peroxide, may be an important cellular defense response to NO•-induced oxidative stress in TK6 cells, whereas this protective mechanism is deficient in p53-null NH32 cells. SOD1 plays a fundamental role in modulating NO• toxicity by acting as an antioxidant, dismutating superoxide. Cells producing an increased amount of SOD1 are less sensitive to NO•-mediated toxicity (47). Conversely, decreased SOD1 levels lead to NO•-mediated apoptotic cell death (48). Reduced SOD1 protein levels in TK6 cells treated with the toxic dose may therefore be a promoter of NO•-induced toxicity, whereas increased expression of SOD1 protein in NH32 cells may contribute to decreased sensitivity to NO•-induced cell killing in this cell type. Unexpectedly, NO• treatment did not affect levels of GPX protein in either TK6 or NH32 cells, conflicting with an earlier report that GPX is a p53 down-regulated gene (49), and suggesting that GPX modulation by activated p53 may be cell type- and/or inducer-dependent.
Taking into account presently accepted models of cell survival and apoptosis, the present findings, along with our previous characterization of p53/mitochondria- and Fas-dependent apoptotic signaling pathways activated by NO• treatment (8, 10), suggest that p53 status is a dominant factor in modulating NO• toxicity and toxic responses in human lymphoblastoid cells. As proposed in Figure 8, NO•-induced DNA damage is followed by activation of p53, which upregulates PTEN, leading to PI3′K/Akt-dependent cell survival suppression (46, 23) and increased apoptosis. Phosphorylated Akt protein levels were diminished in TK6 cells following NO• exposure, but expression of PI3 kinase protein was not affected, implying that PI3 kinase may not be the only kinase to phosphorylate Akt protein. Interaction between Akt and NF-κB signaling has been reported in anti-apoptotic responses by other groups (50, 51). Although p53-dependent cell cycle arrest at the G1/S checkpoint has been well-documented (6, 52), we observed a p53-independent S phase arrest after NO• treatment, resulting in cells entering a program of cytostasis or apoptosis. Activated p53 inhibits DNA recombinational repair and reduces mutagenesis derived from inappropriate repair. Thus, absence of wild-type p53 in NH32 cells leads to a higher threshold dose of NO• required for cell death, and fewer DNA double-strand breaks and higher mutagenesis due to increased DNA recombinational repair in this model.
Figure 8.
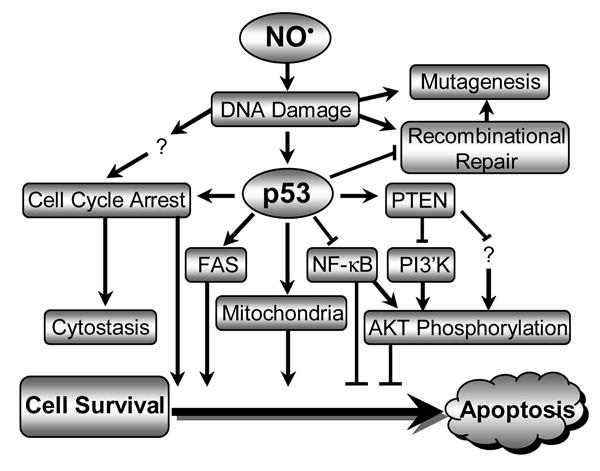
Schematic summary of NO•-induced toxicity pathways in human lymphoblastoid cells, in which p53 plays a central role.
Acknowledgments
This work was supported by Program Project Grant 5 P01 CA26731 from the National Cancer Institute and Center Grant ES02109 from NIEHS. The authors thank Dr. H. Liber for his valuable communication on mutagenesis measurement in NH32 cells, Dr. K. Taghizadeh for her support in DNA base deamination analysis, and Ms. D. MacPhail for her expert technical support in figure preparation.
Footnotes
Abbreviations: dI, 2′-deoxyinosine; dU, 2′-deoxyuridine; dX, 2′-deoxyxanthosine; GPX, glutathione peroxidase; MF, mutant fraction; MMP, mitochondrial membrane potential; NO•, nitric oxide; SCE, sister chromatid exchange; SOD1, Cu/Zn-superoxide dismutase; TK1, thymidine kinase gene.
References
- 1.Li CQ, Wogan GN. Nitric oxide as a modulator of apoptosis. Cancer Lett. 2005;226:1–15. doi: 10.1016/j.canlet.2004.10.021. [DOI] [PubMed] [Google Scholar]
- 2.Dedon PC, Tannenbaum SR. Reactive nitrogen species in the chemical biology of inflammation. Arch Biochem Biophys. 2004;423:12–22. doi: 10.1016/j.abb.2003.12.017. [DOI] [PubMed] [Google Scholar]
- 3.Wang C, Trudel LJ, Wogan GN, Deen WM. Thresholds of nitric oxide-mediated toxicity in human lymphoblastoid cells. Chem Res Toxicol. 2003;16:1004–1013. doi: 10.1021/tx0340448. [DOI] [PubMed] [Google Scholar]
- 4.Li CQ, Wright TL, Dong M, Dommels YEM, Trudel LJ, Dedon PC, Tannenbaum SR, Wogan GN. Biological role of glutathione in nitric oxide-induced toxicity in cell culture and animal models. Free Radic Biol Med. 2005;39:1489–1498. doi: 10.1016/j.freeradbiomed.2005.07.011. [DOI] [PubMed] [Google Scholar]
- 5.Thomas DD, Espey MG, Ridnour LA, Hofseth LJ, Mancardi D, Harris CC, Wink DA. Hypoxic inducible factor 1alpha, extracellular signal-regulated kinase, and p53 are regulated by distinct threshold concentrations of nitric oxide. Proc Natl Acad Sci U S A. 2004;101:8894–8899. doi: 10.1073/pnas.0400453101. [DOI] [PMC free article] [PubMed] [Google Scholar]
- 6.Stewart ZA, Pietenpol JA. p53 Signaling and cell cycle checkpoints. Chem Res Toxicol. 2001;14:243–263. doi: 10.1021/tx000199t. [DOI] [PubMed] [Google Scholar]
- 7.Hofseth LJ, Saito S, Hussain SP, Espey MG, Miranda KM, Araki Y, Jhappan C, Higashimoto Y, He P, Linke SP, Quezado MM, Zurer I, Rotter V, Wink DA, Appella E, Harris CC. Nitric oxide-induced cellular stress and p53 activation in chronic inflammation. Proc Natl Acad Sci USA. 2003;100:143–148. doi: 10.1073/pnas.0237083100. [DOI] [PMC free article] [PubMed] [Google Scholar]
- 8.Li CQ, Trudel LJ, Wogan GN. Nitric oxide-induced genotoxicity, mitochondrial damage, and apoptosis in human lymphoblastoid cells expressing wild-type and mutant p53. Proc Natl Acad Sci U S A. 2002;99:10364–10369. doi: 10.1073/pnas.162356399. [DOI] [PMC free article] [PubMed] [Google Scholar]
- 9.Li CQ, Trudel LJ, Wogan GN. Genotoxicity, mitochondrial damage, and apoptosis in human lymphoblastoid cells exposed to peroxynitrite generated from SIN-1. Chem Res Toxicol. 2002;15:527–535. doi: 10.1021/tx010171x. [DOI] [PubMed] [Google Scholar]
- 10.Li CQ, Robles AI, Hanigan CL, Hofseth LJ, Trudel LJ, Harris CC, Wogan GN. Apoptotic signaling pathways induced by nitric oxide in human lymphoblastoid cells expressing wild-type or mutant p53. Cancer Res. 2004;64:3022–3029. doi: 10.1158/0008-5472.can-03-1880. [DOI] [PubMed] [Google Scholar]
- 11.Janz C, Wiesmuller L. Wild-type p53 inhibits replication-associated homologous recombination. Oncogene. 2002;21:5929–5933. doi: 10.1038/sj.onc.1205757. [DOI] [PubMed] [Google Scholar]
- 12.Spek EJ, Wright TL, Stitt MS, Taghizadeh NR, Tannenbaum SR, Marinus MG, Engelward BP. Recombinational repair is critical for survival of Escherichia coli exposed to nitric oxide. J Bacteriol. 2001;183:131–138. doi: 10.1128/JB.183.1.131-138.2001. [DOI] [PMC free article] [PubMed] [Google Scholar]
- 13.Spek EJ, Vuong LN, Matsuguchi T, Marinus MG, Engelward BP. Nitric oxide-induced homologous recombination in Escherichia coli is promoted by DNA glycosylases. J Bacteriol. 2002;184:3501–3507. doi: 10.1128/JB.184.13.3501-3507.2002. [DOI] [PMC free article] [PubMed] [Google Scholar]
- 14.Kiziltepe T, Yan A, Dong M, Jonnalagadda VS, Dedon PC, Engelward BP. Delineation of the chemical pathways underlying nitric oxide-induced homologous recombination in mammalian cells. Chem Biol. 2005;12:357–369. doi: 10.1016/j.chembiol.2004.12.011. [DOI] [PubMed] [Google Scholar]
- 15.Wang C, Deen WM. Nitric oxide delivery system for cell culture studies. Ann Biomed Eng. 2003;31:65–79. doi: 10.1114/1.1533072. [DOI] [PubMed] [Google Scholar]
- 16.Dong M, Wang C, Deen WM, Dedon PC. Absence of 2′- deoxyoxanosine and presence of abasic sites in DNA exposed to nitric oxide at controlled physiological concentrations. Chem Res Toxicol. 2003;16:1044–1055. doi: 10.1021/tx034046s. [DOI] [PubMed] [Google Scholar]
- 17.Levy JL, Virolainen M, Defendi V. Human lymphoblast lines from lymph node and spleen. Cancer. 1968;22:517–524. doi: 10.1002/1097-0142(196809)22:3<517::aid-cncr2820220305>3.0.co;2-a. [DOI] [PubMed] [Google Scholar]
- 18.Skopek TR, Liber HL, Penman BW, Thilly WG. Isolation of a human lymphoblastoid line heterozygous at the thymidine kinase locus: possibility for a rapid human cell mutation assay. Biochem Biophys Res Commun. 1978;84:411–416. doi: 10.1016/0006-291x(78)90185-7. [DOI] [PubMed] [Google Scholar]
- 19.Chuang YY, Chen Q, Brown JP, Sedivy JM, Liber HL. Radiation-induced mutations at the autosomal thymidine kinase locus are not elevated in p53-null cells. Cancer Res. 1999;59:3073–3076. [PubMed] [Google Scholar]
- 20.Olive PL, Banath JP, Durand RE. Heterogeneity in radiation-induced DNA damage and repair in tumor and normal cells measured using the “comet” assay. Radiat Res. 1990;122:86–94. [PubMed] [Google Scholar]
- 21.Sobol RW, Kartalou M, Almeida KH, Joyce DF, Engelward BP, Horton JK, Prasad R, Samson LD, Wilson SH. Base excision repair intermediates induce p53-independent cytotoxic and genotoxic responses. J Biol Chem. 2003;278:39951–39959. doi: 10.1074/jbc.M306592200. [DOI] [PubMed] [Google Scholar]
- 22.Liber HL, Thilly WG. Mutation assay at the thymidine kinase locus in diploid human lymphoblasts. Mutat Res. 1982;94:467–485. doi: 10.1016/0027-5107(82)90308-6. [DOI] [PubMed] [Google Scholar]
- 23.Luo HR, Hattori H, Hossain MA, Hester L, Huang Y, Lee-Kwon W, Donowitz M, Nagata E, Snyder SH. Akt as a mediator of cell death. Proc Natl Acad Sci U S A. 2003;100:11712–11717. doi: 10.1073/pnas.1634990100. [DOI] [PMC free article] [PubMed] [Google Scholar]
- 24.Kawai H, Yamada Y, Tatsuka M, Niwa O, Yamamoto K, Suzuki F. Down-regulation of nuclear factor kappaB is required for p53-dependent apoptosis in X-ray-irradiated mouse lymphoma cells and thymocytes. Cancer Res. 1999;59:6038–6041. [PubMed] [Google Scholar]
- 25.Stambolic V, MacPherson D, Sas D, Lin Y, Snow B, Jang Y, Benchimol S, Mak TW. Regulation of PTEN transcription by p53. Mol Cell. 2001;8:317–325. doi: 10.1016/s1097-2765(01)00323-9. [DOI] [PubMed] [Google Scholar]
- 26.Cantley LC, Neel BG. New insights into tumor suppression: PTEN suppresses tumor formation by restraining the phosphoinositide 3-kinase/Akt pathway. Proc Natl Acad Sci U S A. 1999;96:4240–4245. doi: 10.1073/pnas.96.8.4240. [DOI] [PMC free article] [PubMed] [Google Scholar]
- 27.Pervin S, Singh R, Chaudhuri G. Nitric oxide-induced cytostasis and cell cycle arrest of a human breast cancer cell line (MDA-MB-231): potential role of cyclin D1. Proc Natl Acad Sci U S A. 2001;98:3583–3588. doi: 10.1073/pnas.041603998. [DOI] [PMC free article] [PubMed] [Google Scholar]
- 28.Stewart ZA, Westfall MD, Pietenpol JA. Cell-cycle dysregulation and anticancer therapy. Trends Pharmacol Sci. 2003;24:139–145. doi: 10.1016/S0165-6147(03)00026-9. [DOI] [PubMed] [Google Scholar]
- 29.D'Ambrosio SM, Gibson-D'Ambrosio RE, Brady T, Oberyszyn AS, Robertson FM. Mechanisms of nitric oxide-induced cytotoxicity in normal human hepatocytes. Environ Mol Mutagen. 2001;37:46–54. doi: 10.1002/1098-2280(2001)37:1<46::aid-em1005>3.0.co;2-6. [DOI] [PubMed] [Google Scholar]
- 30.Sancar A, Lindsey-Boltz LA, Unsal-Kacmaz K, Linn S. Molecular mechanisms of mammalian DNA repair and the DNA damage checkpoints. Annu Rev Biochem. 2004;73:39–85. doi: 10.1146/annurev.biochem.73.011303.073723. [DOI] [PubMed] [Google Scholar]
- 31.Jackson SP. Sensing and repairing DNA double-strand breaks. Carcinogenesis. 2002;23:687–696. doi: 10.1093/carcin/23.5.687. [DOI] [PubMed] [Google Scholar]
- 32.Tamir S, Burney S, Tannenbaum SR. DNA damage by nitric oxide. Chem Res Toxicol. 1996;9:821–827. doi: 10.1021/tx9600311. [DOI] [PubMed] [Google Scholar]
- 33.Burney S, Caulfield JL, Niles JC, Wishnok JS, Tannenbaum SR. The chemistry of DNA damage from nitric oxide and peroxynitrite. Mutat Res. 1999;424:37–49. doi: 10.1016/s0027-5107(99)00006-8. [DOI] [PubMed] [Google Scholar]
- 34.Kow YW. Repair of deaminated bases in DNA. Free Radic Biol Med. 2002;33:886–893. doi: 10.1016/s0891-5849(02)00902-4. [DOI] [PubMed] [Google Scholar]
- 35.Smith SA, Engelward BP. In vivo repair of methylation damage in Aag 3-methyladenine DNA glycosylase null mouse cells. Nucleic Acids Res. 2000;28:3294–3300. doi: 10.1093/nar/28.17.3294. [DOI] [PMC free article] [PubMed] [Google Scholar]
- 36.Zhou J, Ahn J, Wilson SH, Prives C. A role for p53 in base excision repair. EMBO J. 2001;20:914–923. doi: 10.1093/emboj/20.4.914. [DOI] [PMC free article] [PubMed] [Google Scholar]
- 37.Romanova LY, Willers H, Blagosklonny MV, Powell SN. The interaction of p53 with replication protein A mediates suppression of homologous recombination. Oncogene. 2004;23:9025–9033. doi: 10.1038/sj.onc.1207982. [DOI] [PubMed] [Google Scholar]
- 38.Kumari A, Schultz N, Helleday T. p53 protects from replication-associated DNA double-strand breaks in mammalian cells. Oncogene. 2004;23:2324–2329. doi: 10.1038/sj.onc.1207379. [DOI] [PubMed] [Google Scholar]
- 39.Boehden GS, Baumann C, Siehler S, Wiesmuller L. Wild-type p53 stimulates homologous recombination upon sequence-specific binding to the ribosomal gene cluster repeat. Oncogene. 2005;24:4183–4192. doi: 10.1038/sj.onc.1208592. [DOI] [PubMed] [Google Scholar]
- 40.Alberts B. DNA replication and recombination. Nature. 2003;421:431–435. doi: 10.1038/nature01407. [DOI] [PubMed] [Google Scholar]
- 41.Liang F, Han M, Romanienko PJ, Jasin M. Homology-directed repair is a major double-strand break repair pathway in mammalian cells. Proc Natl Acad Sci U S A. 1998;95:5172–5177. doi: 10.1073/pnas.95.9.5172. [DOI] [PMC free article] [PubMed] [Google Scholar]
- 42.Okorokov AL, Warnock L, Milner J. Effect of wild-type, S15D and R175H p53 proteins on DNA end joining in vitro: potential mechanism of DNA double-strand break repair modulation. Carcinogenesis. 2002;23:549–557. doi: 10.1093/carcin/23.4.549. [DOI] [PubMed] [Google Scholar]
- 43.Honma M, Zhang LS, Hayashi M, Takeshita K, Nakagawa Y, Tanaka N, Sofuni T. Illegitimate recombination leading to allelic loss and unbalanced translocation in p53-mutated human lymphoblastoid cells. Mol Cell Biol. 1997;17:4774–4781. doi: 10.1128/mcb.17.8.4774. [DOI] [PMC free article] [PubMed] [Google Scholar]
- 44.Lu X, Lozano G, Donehower LA. Activities of wildtype and mutant p53 in suppression of homologous recombination as measured by a retroviral vector system. Mutat Res. 2003;522:69–83. doi: 10.1016/s0027-5107(02)00261-0. [DOI] [PubMed] [Google Scholar]
- 45.Mekeel KL, Tang W, Kachnic LA, Luo CM, DeFrank JS, Powell SN. Inactivation of p53 results in high rates of homologous recombination. Oncogene. 1997;14:1847–1857. doi: 10.1038/sj.onc.1201143. [DOI] [PubMed] [Google Scholar]
- 46.Gottlieb TM, Leal JF, Seger R, Taya Y, Oren M. Cross-talk between Akt, p53 and Mdm2: possible implications for the regulation of apoptosis. Oncogene. 2002;21:1299–1303. doi: 10.1038/sj.onc.1205181. [DOI] [PubMed] [Google Scholar]
- 47.Brockhaus F, Brune B. Overexpression of CuZn superoxide dismutase protects RAW 264.7 macrophages against nitric oxide cytotoxicity. Biochem J. 1999;338:295–303. [PMC free article] [PubMed] [Google Scholar]
- 48.Ciriolo MR, De Martino A, Lafavia E, Rossi L, Carri MT, Rotilio G. Cu,Zn-superoxide dismutase-dependent apoptosis induced by nitric oxide in neuronal cells. J Biol Chem. 2000;275:5065–5072. doi: 10.1074/jbc.275.7.5065. [DOI] [PubMed] [Google Scholar]
- 49.Mirza A, Wu Q, Wang L, McClanahan T, Bishop WR, Gheyas F, Ding W, Hutchins B, Hockenberry T, Kirschmeier P, Greene JR, Liu S. Global transcriptional program of p53 target genes during the process of apoptosis and cell cycle progression. Oncogene. 2003;22:3645–3654. doi: 10.1038/sj.onc.1206477. [DOI] [PubMed] [Google Scholar]
- 50.Meng F, Liu L, Chin PC, D'Mello SR. Akt is a downstream target of NF-kappa B. J Biol Chem. 2002;277:29674–29680. doi: 10.1074/jbc.M112464200. [DOI] [PubMed] [Google Scholar]
- 51.Romashkova JA, Makarov SS. NF-kappaB is a target of Akt in anti-apoptotic PDGF signalling. Nature. 1999;401:86–90. doi: 10.1038/43474. [DOI] [PubMed] [Google Scholar]
- 52.Willers H, McCarthy EE, Wu B, Wunsch H, Tang W, Taghian DG, Xia F, Powell SN. Dissociation of p53-mediated suppression of homologous recombination from G1/S cell cycle checkpoint control. Oncogene. 2000;19:632–639. doi: 10.1038/sj.onc.1203142. [DOI] [PubMed] [Google Scholar]