

Abstract
It has been established that the large conductance Ca2+-activated K+ channel contains two types of high-affinity Ca2+ binding sites, termed the Ca2+ bowl and the RCK1 site. The affinities of these sites, and how they change as the channel opens, is still a subject of some debate. Previous estimates of these affinities have relied on fitting a series of conductance–voltage relations determined over a series of Ca2+ concentrations with models of channel gating that include both voltage sensing and Ca2+ binding. This approach requires that some model of voltage sensing be chosen, and differences in the choice of voltage-sensing model may underlie the different estimates that have been produced. Here, to better determine these affinities we have measured Ca2+ dose–response curves of channel activity at constant voltage for the wild-type mSlo channel (minus its low-affinity Ca2+ binding site) and for channels that have had one or the other Ca2+ binding site disabled via mutation. To accurately determine these dose–response curves we have used a series of 22 Ca2+ concentrations, and we have used unitary current recordings, coupled with changes in channel expression level, to measure open probability over five orders of magnitude. Our results indicate that at −80 mV the Ca2+ bowl has higher affinity for Ca2+ than does the RCK1 site in both the opened and closed conformations of the channel, and that the binding of Ca2+ to the RCK1 site is voltage dependent, whereas at the Ca2+ bowl it is not.
INTRODUCTION
Large-conductance Ca2+-activated potassium (BKCa) channels are important for the modulation of many physiological processes, such as neuronal firing, smooth muscle contraction, and neurotransmitter release (Storm, 1987; Roberts et al., 1990; Sah and McLachlan, 1992; Robitaille et al., 1993; Nelson and Quayle, 1995; Brenner et al., 2000; Hu et al., 2001; Wang et al., 2001; Semenov et al., 2006). They are uniquely suited to regulate these processes because they are sensitive to both intracellular Ca2+ and membrane voltage. This is seen as a leftward shift in the BKCa channel's conductance–voltage (G-V) relation as the internal Ca2+ concentration is increased. Biophysical studies have shed considerable light on the mechanisms by which voltage influences channel opening (Cui et al., 1997; Stefani et al., 1997; Diaz et al., 1998; Horrigan and Aldrich, 1999, 2002; Horrigan et al., 1999; Rothberg and Magleby, 2000; Bao and Cox, 2005); however, the mechanisms by which Ca2+ influences channel opening remain less well understood.
Unlike K+ channels gated solely by voltage, the BKCa channel's pore-forming α subunit (four per functional channel) contains a large intracellular domain that confers Ca2+ sensitivity on a voltage-gated structure (Wei et al., 1994; Schreiber and Salkoff, 1997; Schreiber et al., 1999). The structure of this domain remains a matter of debate; however, it is generally agreed that within this domain there are three distinct Ca2+ binding sites, one of low affinity (millimolar dissociation constants) and two of high affinity (micromolar dissociation constants) (Bao et al., 2002; Shi et al., 2002; Xia et al., 2002; Magleby, 2003). Mutations at these sites together eliminate the BKCa channel's characteristic Ca2+-dependent G-V shift (Xia et al., 2002). The first of these sites to be identified, the Ca2+ bowl, is an aspartate-rich region near the carboxy terminus (Schreiber and Salkoff, 1997). Considered high affinity, this site contributes to the channel's Ca2+ sensitivity in the micromolar range (Bao et al., 2002; Xia et al., 2002). Mutations within the Ca2+ bowl such as D897-901N (referred to as D5N5) or D898A/D900A (referred to here as D2A2) can eliminate the contribution of this site to the channel's Ca2+ sensitivity (Bian et al., 2001; Bao et al., 2004). The second high-affinity site, termed here the RCK1 site, resides in a domain thought to be similar in structure to the ligand binding RCK domains of bacterial potassium channels and transporters (Schreiber and Salkoff, 1997; Jiang et al., 2001; Bao et al., 2002; Jiang et al., 2002; Xia et al., 2002; Zeng et al., 2005). Although the residues that coordinate Ca2+ at this site have yet to be determined, the mutation D367A has been shown to eliminate the contribution of this second high-affinity site to Ca2+ sensing (Xia et al., 2002). The BKCa channel's low-affinity Ca2+ binding site is also thought to reside in the channel's RCK1 domain, and its influence can be eliminated by the mutation E399N (Shi et al., 2002; Xia et al., 2002).
The binding properties of the BKCa channel's two high-affinity Ca2+ binding sites are uncertain. Bao et al. (2002) estimated the Ca2+ bowl's Ca2+ dissociation constant to be 3.5 μM when the channel is closed (KC) and 0.8 μM when it is open (KO) (Bao et al., 2002), whereas Xia et al. (2002) estimated KC to be 4.5 μM and KO to be 2.0 μM (Xia et al., 2002). These numbers may seem similar, but according to allosteric theory the ratio KC/KO is equivalent to the factor by which Ca2+ binding at a given site alters the equilibrium constant for channel opening. The estimates of Bao et al. (2002) yield a KC /KO value of 4.4, whereas those of Xia et al. (2002) yield a KC /KO value of 2.2. Thus, for a single binding event the two groups predict effects of Ca2+ on the equilibrium constant for channel opening that differ by a factor of two, and if there are four Ca2+ bowl–related sites—as there appears to be (Niu and Magleby, 2002)—then when all four sites are occupied, the difference is 14-fold. Further, there are larger differences between the two groups' estimates of KC and KO for the channel's other type of high-affinity Ca2+ binding site, the RCK1 site. The estimates of Bao et al. (2002) are considerably smaller than those of Xia et al. (2002) and more like those of the Ca2+ bowl (Bao et al. [2002]: KC = 3.8 μM and KO = 0.9 μM; Xia et al. [2002]: KC = 17.2 μM and KO = 4.6 μM).
One likely reason for these discrepancies is that both groups made their estimates by fitting gating models to a series of G-V relations determined for a series of [Ca2+], and to make these estimates they necessarily had to assume some model of the voltage-sensing mechanism of the channel. The two groups used different voltage-sensing models. More generally, however, a better way to estimate the affinity constants of the channel's Ca2+ binding sites would be to study the effect of Ca2+ on channel opening at many [Ca2+] but at a single voltage, such that the effect of voltage on channel opening can be treated as a constant.
Here, we have taken this approach. We have used mutations at each type of Ca2+ binding site and high-resolution Ca2+ dose-response curves to characterize the binding properties of each of the BKCa channel's high-affinity Ca2+ binding sites at both −80 and 0 mV. Our results indicate that the two sites have substantially different affinities, as suggested by Xia et al. (2002), at both these potentials, and that Ca2+ binding at the RCK1 site is voltage dependent, whereas at the Ca2+ bowl it is not.
MATERIALS AND METHODS
Heterologous Expression of BKCa Channels in TSA 201 Cells
TSA201 cells (modified human embryonic kidney cells) were transiently transfected with expression vectors (pcDNA 3; Invitrogen) encoding the α subunit of the BKCa channel from mouse (mSlo-mbr5) (Butler et al., 1993), enhanced green fluorescent protein (eGFP-N1; BD Biosciences), and the empty pcDNA 3.1+ vector (Invitrogen) to control for total amount of transfected DNA. Cells were transiently transfected using the Lipofectamine 2000 reagent (Invitrogen). The enhanced green fluorescent protein was used to monitor successfully transfected cells. For transfection, cells at 80–90% confluence in 35-mm falcon dishes were incubated with a mixture of the plasmids (total of 4 μg DNA) Lipofectamine and Optimem (Invitrogen) according to the manufacturer's instructions. In brief, the mixture was left on the cells 4–8 h after which the cells were replated into recording Falcon 3004 dishes in standard tissue culture media: DMEM with 1% fetal bovine serum, 1% l-glutamine, and 1% penicillin-streptomycin solution (all from Invitrogen). The cells were patch-clamped 1–3 d after transfection.
Electrophysiology
All recordings were performed in the inside-out patch-clamp configuration (Hamill et al., 1981). Patch pipettes were made of borosilicate glass (VWR micropipettes) with 0.8–5-MΩ resistances that were varied for different recording purposes. The tips of the patch pipettes were coated with sticky wax (KerrLab) and fire polished. Data were acquired using an Axopatch 200B patch clamp amplifier and a Macintosh-based computer system equipped with an ITC-16 hardware interface (InstruTECH) and Pulse acquistion software (HEKA electronik). For macroscopic current recordings, data were sampled at 50 kHz and filtered at 10 kHz. In most macroscopic current recordings, capacity and leak current were subtracted using a P/5 subtraction protocol with a holding potential of −120 mV and leak pulses in opposite polarity to the test pulse, but with BKCa currents recorded with >100 μM Ca2+, no leak subtraction was performed.
Unitary current recordings acquired at −80 mV were sampled at 100 KHz and filtered at 10 KHz. Unitary current recordings acquired at 0 mV were sampled at 100 kHz and filtered at 2 kHz. All experiments were performed at room temperature, 22–24°C.
Solutions
The pipette solution for macroscopic current recordings contained the following: 118 mM KMeSO3, 20 mM N-methyl-glucamine-MeSO3, 2 mM KCl, 2 mM MgCl2, 2 mM HEPES, pH 7.20. The pipette solution for current recordings at 0 mV contained the following: 3 mM KMeSO3, 135 mM N-methyl-glucamine-MeSO4, 2 mM KCl, 2 mM MgCl2, 2 mM HEPES, pH 7.20. 10 μM GdCl3 was added to both pipette solutions to block endogenous stretch-activated channels. GdCl3 did not block BKCa currents (not depicted) (Yang and Sachs, 1989; Qian and Magleby, 2003). The bath solution for all recordings contained the following: 118 mM KMeSO3, 20 mM N-methyl-glucamine-MeSO3, 2 mM KCl, 2 mM HEPES, pH 7.20. 1 mM EGTA (Fluka) was used as the Ca2+ buffer for solutions containing 3–500 nM free [Ca2+]. 1 mM HEDTA (Sigma-Aldrich) was used as the Ca2+ buffer for solutions containing 0.8–20 μM free [Ca2+], and no Ca2+ chelator was used in solutions containing between 20 μM and 2.5 mM free Ca2+. 50 μM (+)-18-crown-6-tetracarboxylic acid (18C6TA) was added to all internal solutions to prevent contaminant Ba2+ block at high voltages. Both internal and external solutions were brought to pH 7.20.
The appropriate amount of total Ca2+ (100 mM CaCl2 standard solution; Orion Research, Inc.) to add to the buffered solutions to yield the desired approximate free Ca2+ concentrations of 3 nM to 2.5 mM was calculated using the program MaxChelator (see Online Supplemental Material), and the solutions were prepared as described previously (Bao et al., 2002). The Ca2+ concentrations reported are averages of three independent measurements determined with an Orion Ca2+-sensitive electrode. The solutions bathing the intracellular side of the patch were changed by means of a DAD valve–controlled pressurized superfusion system (ALA Scientific Instruments).
Data Analysis
All data analysis was performed with Igor Pro graphing and curve-fitting software (WaveMetrics Inc.), and the Levenberg-Marquardt algorithm was used to perform nonlinear least-square curve fitting. Values in the text are given ± SEM.
G-V Curves
G-V relations were determined from the amplitude of tail currents measured 200 μs after repolarizations to −80 mV following voltage steps to the test voltage. Each G-V relation was fitted with a Boltzmann function,
 |
and normalized to the maximum of the fit.
Single-Channel Analysis
Under conditions where the open probability (Popen) is small (<10−2), single-channel openings were observed in patches containing hundreds of channels and IK was measured from steady-state recordings 30 s in duration. NPopen was determined from all-points histograms by measuring the fraction of time spent (PK) at each open level (k) using a half-amplitude criteria and summing their contributions, NPopen = Σ kPK., where N is the number of channels in the patch.
Popen Versus Ca2+ Curves
The effect of Ca2+ on Popen was determined from the ratio of NPopen at a given Ca2+ to NPopen at 5.3 μM Ca2+ for all Ca2+ concentrations tested on a given patch. The (NPopen/NPopen5.3 μM) versus [Ca2+] relation from each patch was then plotted and averaged across many patches. The mean (NPopen/NPopen5.3 μM) versus [Ca2+] relation was then adjusted such that at 3 nM Ca2+ log (NPopen/NPopenmin) = 0. In some cases Popen, rather than being normalized (NPopen/NPopenmin), was reported as a function of [Ca2+]. This was done by determining Popen for each channel type at a single [Ca2+] in separate experiments, and then adjusting the average log (NPopen/NPopenmin) versus log [Ca2+] curve vertically, such that Popen was correct at the [Ca2+] at which Popen was known. At 0 mV, the calibrated Popen was determined at 2.5 mM from patches whose channel content was apparent (n = 1–4). At −80 mV, the calibrating Popen was determined at 5.3 μM [Ca2+] from unitary current measurements of NPopen from a series of patches in which N was calculated from the maximal current measured at +80 mV and separate Popen measurements taken at +80 mV for single channels.
Online Supplemental Material
The amount of Ca2+ to add to internal solutions to yield the desired free Ca2+ concentrations was calculated using the program MaxChelator, which was downloaded from http://www.stanford.edu/∼cpatton/maxc.html and is included as executable files here. The online supplemental material is available at http://www.jgp.org/cgi/content/full/jgp.200810094/DC1.
RESULTS
The Effect of Ca2+ with Both Sites Intact
The BKCa channel is both Ca2+ and voltage sensitive, and the effects of these stimuli are often displayed as a series of G-V relations determined at several Ca2+ concentrations (Barrett et al., 1982). Such a series, determined from BKCa channels exogenously expressed in TSA-201 cells, is shown in Fig. 1 B. The data are from excised inside-out macropatches (Fig. 1 A). Increasing intracellular Ca2+ shifts the channel's G-V curve leftward, an effect that is known under wild-type conditions to be due to three types of Ca2+ binding sites, two of high affinity and one of low affinity. The channels in the patches of Fig. 1, however, contained the mutation E399N, which eliminates low-affinity Ca2+ sensing (Shi et al., 2002; Xia et al., 2002) and thereby allows one to examine high-affinity Ca2+ sensing in isolation. We refer to the mouse Slo (mSlo) channel carrying this mutation as ΔE. Increasing Ca2+ from 3 nM to 2.5 mM shifts the ΔE G-V relation ∼−200 mV.
Figure 1.

Macroscopic currents and normalized conductance versus voltage curves (G-V) determined for the mSlo mutant E399N (ΔE). (A) Shown are averaged macroscopic current families. Each family displayed is the average of three consecutive families recorded from a single TSA 201 inside-out macropatch exposed to 1.4, 5.3, and 113 μM [Ca2+]. Membrane voltages were as follows: For 1.4 μM [Ca2+] and 5.3 μM [Ca2+], VH was −80 mV, test potentials were to between −80 and +200 mV, and tail potentials were −80 mV; for 113 μM [Ca2+], VH was −150 mV, test potentials were to between −100 and +150 mV in 10-mV steps, and tail potentials were −80 mV. (B) G-V relations were determined from data like that in A at the following [Ca2+]: 0.003, 0.36, 1.4, 5.3, 113, and 2,500 μM. Each curve represents the average between 7 and 13 individual curves. Error bars indicate SEM. The data have been fitted (solid lines) with a Boltzmann function (G/Gmax = 1/(1+e q-F(V-V1/2)/RT). The Boltzmann fits have the following parameters: 3 nM Ca2+: Q = 1.21 e, V1/2 = 183 mV; 360 nM Ca2+: Q = 1.18 e, V1/2 = 151 mV; 1.4 μM Ca2+: Q = 1.47 e, V1/2 = 101 mV; 5.3 μM Ca2+: Q = 1.38 e, V1/2 = 59 mV; 113 μM Ca2+: Q = 1.00 e, V1/2 = 13 mV; 2.5 mM Ca2+: Q = 1.04 e, V1/2 = −5.7 mV.
Previous estimates of the affinities of the BKCa channel's high-affinity Ca2+ binding sites have been based on fitting gating models to data like that shown in Fig. 1 B. This necessarily requires that one assume some model of voltage-dependent gating, and the resulting Ca2+ binding parameters produced by the fits are then dependent on this choice (Bao et al., 2002; Xia et al., 2002). To circumvent this necessity, and thereby more directly determine the BKCa channel's high-affinity Ca2+ binding constants, here we have studied the effects of Ca2+ at constant voltage.
Fig. 2 A shows unitary ΔE currents recorded from a single membrane patch at −80 mV and four different [Ca2+]. Corresponding amplitude histograms are shown in Fig. 2 B. Although the patch contained hundreds of channels, each channel's open probability (Popen) is low in the absence of Ca2+, such that activity is observed as the infrequent and brief opening of single channels. Application of Ca2+ then caused a large increase in Popen that resulted in multi-channel openings. From data like these we derived the ΔE channel's Popen versus [Ca2+] relation (Fig. 2 C). So that all parts of the curve could be well determined, Popen was measured over five orders of magnitude with 22 Ca2+ concentrations. To do this, many patches were used and normalized by their values of NPopen at 5.3 μM, where N is the number of channels in a given patch. The data were then averaged at each [Ca2+], and the whole curve was adjusted vertically to match the BKCa channel's Popen at 5.3 μM and −80 mV, which was determined in separate experiments (see Materials and methods).
Figure 2.

The Ca2+ dependence of Popen for mutant ΔE. (A) Inward potassium currents recorded at −80 mV and filtered at 10 kHz from a macropatch exposed to the indicated [Ca2+] demonstrate that Popen increases in a Ca2+-dependent manner when voltage is constant. The corresponding all-points amplitude histograms are plotted in B on a semi-log scale and were constructed from 30-s recordings at each [Ca2+]. The dose–response relation for the effect of Ca2+ on Popen at negative voltage (−80 mV) is shown in C. For determination of Popen see Materials and methods. Each point represents the average of between 7 and 17 patches at each Ca2+ concentration tested. Error bars represent SEM.
These data were then analyzed as follows. If one assumes that there are four of each type of Ca2+ binding site and that each site influences channel opening by altering the equilibrium constant of a single conformational change between closed and open—as much evidence suggests (McManus and Magleby, 1991; Cox et al., 1997; Cui et al., 1997; Horrigan and Aldrich, 1999, 2002; Horrigan et al., 1999; Rothberg and Magleby, 1999, 2000; Cox and Aldrich, 2000)—and that there are no interactions between binding sites, then at constant voltage the channel's open probability as a function of voltage can be written as:
 |
(1) |
where KC1 and KC2 represent the dissociation constants of binding sites 1 and 2 in the closed conformation. KO1 and KO2 represent the dissociation constants of binding sites 1 and 2 in the open conformation, and M represents the closed-to-open equilibrium constant when no Ca2+ is bound. As relates to the BKCa channel, M is voltage dependent and incorporates all effects of voltage on opening.
In the absence of Ca2+, Eq. 1 reduces to:
 |
(2) |
which can be rearranged to:
 |
(3) |
Thus, M can be determined directly from Popen in the absence of Ca2+. From Fig. 2 C we can estimate M to be ∼2.5 × 10⁻⁶. However, better still, when Popen is small over the entire Ca2+ dose-response curve, as is the case here, Eq. 1 reduces to Eq. 4 below (Horrigan and Aldrich, 2002):
 |
(4) |
and then dividing through by Popen at 0 [Ca2+] yields:
 |
(5) |
This eliminates M and leaves a curve whose properties are determined solely by the channel's Ca2+ binding constants (Horrigan and Aldrich, 2002). Thus, the curve in Fig. 2 C was normalized by its minimum value to yield a Popen (Ca2+)/Popen (0) versus [Ca2+] curve (Fig. 3) and then fitted with Eq. 5. Properties of this curve of note are: (1) Ca2+ increases Popen by a factor of 2.8 × 10⁴; (2) Popen saturates at high [Ca2+], ∼100 μM; and (3) the curve has a shallow quality suggestive of multiple binding sites with differing affinities. Indeed the fit (solid line) yielded the following dissociation constants: SITE 1, KC1 = 3.7 ± 2.1 μM, KO1 = 0.7 ± 0.14 μM; SITE 2, KC2 = 51 ± 42 μM, KO2 = 21 ± 24 μM.
Figure 3.

The Ca2+ binding affinity of mutant ΔE at −80 mV. The mean log ratio of NPopen in the presence and absence of Ca2+ determined from the data shown in Fig. 2. Log (NPopen / NPopenmin) spans the entire [Ca2+] range and is fit (solid line) by Eq. 5 yielding values of KO1 = 0.7 μM, KC1 = 3.7 μM, KO2 = 21 μM, and KC2 = 51 μM. Also shown is the fit (dashed line) assuming both types of binding sites have the same affinity for Ca2+ (KO = 1.9 μM and KC = 6.4 μM). Error bars represent SEM.
Further, when we forced both types of binding sites to have the same affinities, a substantially worse fit was obtained (dashed line, KC = 6.1 ± 0.4 μM; KO = 1.9 ± 0.31 μM). Thus, this analysis suggests that one of the BKCa channel's high-affinity Ca2+ binding sites has substantially higher affinity for Ca2+ than the other, both in the open and closed conformations, although noise in the data introduces some uncertainty about the fitted values.
Mutations That Eliminate Ca2+ Sensing
To measure the affinities of each type of high-affinity Ca2+ binding site individually, we used mutations that selectively eliminate the effect of Ca2+ at each type of site. D367A eliminates Ca2+ sensing via RCK1 sites (Xia et al., 2002), and D897N/D898N/D899N/D900N/D901N (D5N5) or D898A/D900A (D2A2) eliminate Ca2+ sensing via the Ca2+ bowls (Schreiber and Salkoff, 1997; Bian et al., 2001; Bao et al., 2004). Before using these mutations, however, it was important to confirm that in conjunction with E399N they eliminate all Ca2+ sensing. Shown in Fig. 4 A are currents recorded at various [Ca2+] from a patch expressing the triple mutant (E399N)(D367A)(D897N/D898N/D899N/D900N/D901N), which we refer to as ΔEΔRΔB(D5N5). Corresponding amplitude histograms are superimposed in Fig. 4 B, and in Fig. 4 C the ΔEΔRΔB(D5N5) channel's Ca2+ dose-response relation is plotted at −80 mV. As is evident, the triple mutant shows virtually no response to Ca2+, which demonstrates that the three sites targeted by these mutations can together account for all of the channel's Ca2+ sensing.
Figure 4.

Mutation of all three types of Ca2+ binding sites eliminates the Ca2+ dependence of Popen. (A) Inward K+ currents recorded for mutant ΔEΔRΔB(D5N5) at −80 mV and filtered at 10 kHz from a macropatch in the indicated [Ca2+] demonstrate that Popen does not increase in a Ca2+-dependent manner when voltage is constant. The corresponding all-points amplitude histograms are plotted in B on a semi-log scale and were constructed from 30-s recordings. (C) Dose–response relations for the effect of Ca2+ on Popen at negative voltage (−80 mV) obtained by plotting the mean log ratio of NPopen in the presence and absence of Ca2+. For both mutant ΔEΔRΔB(D5N5) (filled circles) and mutant ΔEΔRΔB(D2A2), log (NPopen/NPopenmin) spans the entire [Ca2+] range but cannot be fitted because Popen does not vary with [Ca2+]. Each point represents the average of between 6 and 8 patches at each [Ca2+] tested. Error bars represent SEM.
Ca2+ Binding at the Ca2+ Bowl
We then used the mutant (E399N)(D367A), which we refer to as ΔEΔR, to examine Ca2+ sensing via the Ca2+ bowl. Fig. 5 A compares BKCa currents at various [Ca2+] recorded from a single ΔEΔR patch at −80 mV. The corresponding amplitude histograms are shown in Fig. 5 B. As with ΔE, Popen is low in the absence of Ca2+, and activity is observed as the infrequent and brief opening of single channels. Application of Ca2+ then increases Popen, but the increase is not as great (∼102-fold) as it is with the ΔE channel (∼104-fold), presumably because the ΔEΔR channel has lost half of its high-affinity binding sites. A Ca2+ dose–response relation for the ΔEΔR channel at −80 mV is shown in Fig. 5 C. The affinities of the intact Ca2+ bowl site were then determined from a fit (solid line) with Eq. 6 below, which is analogous to Eq. 5, but represents the case where there is only one type of Ca2+ binding site (Horrigan and Aldrich, 2002).
 |
(6) |
Figure 5.

The Ca2+ binding affinities of the Ca2+ bowl site at −80 mV. (A) Inward K+ currents recorded from mutant ΔEΔR at −80 mV and filtered at 10 kHz from a macropatch exposed to the indicated [Ca2+] demonstrate that Popen increases in a Ca2+-dependent manner when voltage is constant. The corresponding all-point amplitude histograms are plotted in B on a semi-log scale and were constructed from 30-s recordings as in Fig. 2. The dose–response relation for the effect of [Ca2+] on Popen (left axis) and NPopen/NPopenmin (right axis) at negative voltage (−80 mV) is shown in C. Each point represents the average of between 6 and 11 patches at each [Ca2+] tested. Log (NPopen/NPopenmin) spans the entire [Ca2+] range and is fit (solid line) by Eq. 6 yielding values of KO = 0.88 μM and KC = 3.13 μM. Error bars represent SEM.
Of importance here, Eq. 6 contains only the channel's open- and closed-state Ca2+ dissociation constants as free parameters, and in the limit of high [Ca2+], Eq. 6 becomes:
 |
(7) |
or equivalently:
 |
(8) |
Thus, the change in log (Popen) from 0 to saturating [Ca2+], which is the distance along the vertical axis spanned by the data in Fig. 5 C, depends only on the ratio of the open and closed conformation Ca2+ dissociation constants. This means that measuring Popen precisely at both the top and the bottom of the curve—as we have done here with unitary current recordings—places an important constraint on the fitting. Indeed, because the amplitude of the curve is determined by C, this leaves only one parameter free to determine the shape of the curve, either KC or KO. Thus, in fitting with Eq. 6, the fit is highly constrained, and it is therefore remarkable how well Eq. 6 fits the data (solid line). The fit yields the following Ca2+ dissociation constants for the Ca2+ bowl (KO = 0.88 ± 0.06 μM; KC = 3.13 ± 0.22 μM; C = 3.55)(see also Table I), and it is of note that they are similar to the KC1 and KO1 values estimated from the ΔE data in Fig. 3.
TABLE I.
BKCa Channel Ca2+ Binding Parameters
| Binding Site | Membrane Potential (mV) |
KC (μM) | KO (μM) | M | f | C |
|---|---|---|---|---|---|---|
| Ca2+ Bowl | ||||||
| ΔEΔR | −80 | 3.1 ± 0.2 | 0.88 ± 0.06 | 3.55 | ||
| ΔEΔR | 0 | 3.1 | 0.88 | 3.55 | ||
| RCK1 | ||||||
| ΔEΔB(D2A2) | −80 | 23.2 ± 2.6 | 4.9 ± 0.6 | 4.75 | ||
| ΔEΔB(D5N5) | −80 | 26.8 ± 3.8 | 5.6 ± 0.8 | 4.75 | ||
| ΔEΔB(D2A2) + Cooperativity | −80 | 13.7 ± 2.3 | 2.8 ± 0.5 | 0.45 ± 0.1 | ||
| ΔEΔB(D5N5)+ Cooperativity | −80 | 9.4 ± 1.8 | 1.8 ± 0.2 | 0.27 ± 0.05 | ||
| ΔEΔB(D2A2) | 0 | 15.8 ± 3.1 | 2.10 ± 0.4 | 1.8 × 10⁷ | 7.52 |
Ca2+ Binding at the RCK1 Site
Similarly, to determine the affinities of the RCK1 site, we examined the effect of Ca2+ on the open probability of the mutant (E399N)(D898A/D900A), which we refer to as ΔEΔB(D2A2). The two D→A mutations render the Ca2+ bowl nonfunctional (Bao et al., 2004). Fig. 6 A shows unitary ΔEΔB(D2A2) currents recorded at −80 mV with various [Ca2+] from a patch that contained hundreds of channels. Corresponding amplitude histograms are shown in Fig. 6 B, and the Ca2+ dose–response relation we acquired for the ΔEΔB(D2A2) channel at −80 mV is shown in Fig. 6 C (open squares). In fact, both ΔEΔB(D2A2) and another Ca2+ bowl mutation, (D897N/D898N/D899N/D900N/D901N) (ΔEΔB(D5N5)), were analyzed (Fig. 6 C, closed squares), and both mutations behave similarly. The affinity of the RCK1 site was then estimated by fitting Eq. 6 to the two datasets in Fig. 6 C. The fits yielded similar values (KO = 4.9 ± 0.6 μM; KC = 23.2 ± 2.6 μM; C = 4.75) for ΔEΔB(D2A2) and (KO = 5.6 ± 0.8 μM; KC = 26.8 ± 3.8 μM; C = 4.75) for ΔEΔB(D5N5) (see Table I). Thus, the RCK1 site binds Ca2+ more weakly than does the Ca2+ bowl site, both when the channel is open and when it is closed (Ca2+ bowl: KO = 0.88 ± 0.06 μM; KC = 3.13 ± 0.22 μM; C = 3.55 from Fig. 5), but it has a 36% larger C value and thus a bigger effect on opening at saturating [Ca2+]. This is illustrated graphically in Fig. 7, where the ΔEΔR (closed triangles) and ΔEΔB(D2A2) (closed squares) Ca2+ dose–response curves are overlaid.
Figure 6.

The Ca2+ binding affinities of the high-affinity RCK1 site at −80 mV. (A) Inward K+ currents recorded from mutant ΔEΔB(D2A2) at −80 mV and filtered at 10 kHz from a macropatch in the indicated [Ca2+] demonstrate that Popen increases in a Ca2+-dependent manner when voltage is constant. The corresponding all-points amplitude histograms are plotted in B on a semi-log scale and were constructed from 30-s recordings. The dose–response relation for the effect of Ca2+ on Popen (left axis) and NPopen/NPopenmin (right axis) at negative voltage (−80 mV) is shown in C. Each point represents the average of between 6 and 16 patches at each Ca2+ concentration tested. For mutant ΔEΔB(D2A2) (open squares), log (NPopen/NPopenmin) spans the entire [Ca2+] range and is fitted (dotted line) by Eq. 6 yielding values of KO = 4.9 μM of KC = 23.2 μM. For mutant ΔEΔB(D5N5) (closed squares), the fit (dashed line) yields values of KOB = 5.6 μM and KCB = 26.8 μM. (D) The data were also fitted with Eq. 7, which incorporates an interaction between binding sites. For mutant ΔEΔB(D2A2) (open squares), the fit yielded values of KO = 2.8 μM, KC = 13.7 μM, and f = 0.45. For mutant ΔEΔB(D5N5) (closed squares), the fit (dashed line) yielded KO = 1.8 μM, KC = 9.4 μM, and f = 0.27. Error bars represent SEM.
Figure 7.

The two binding sites are less than additive. The mean log ratio of NPopen at −80 mV in the presence and absence of Ca2+ for mutants ΔE (solid circles), ΔEΔR (solid triangles), and ΔEΔB(D2A2) (solid squares) are plotted versus [Ca2+]. Various fits of log (NPopen/NPopenmin) are superimposed on the data. The fit of ΔEΔR also displayed in Fig. 2 is shown as a short dashed curve. The fit of ΔEΔB(D2A2) also displayed in Fig. 3 is shown as a long dashed curve. We simulated the log (NPopen/NPopenmin) relation (dark solid line) predicted by the affinities determined from each of the mutants using Eq. 5. The parameters of the fit were: KO1 = 0.88 μM, KC1 = 3.13 μM, KO2 = 4.88 μM, and KC2 = 23.2 μM. Also plotted (gray curve) is a fit that incorporates cooperativity between the binding sites. The equation for the fit was log (NPopen/NPopenmin) = ((1+(KO1+ KO2)+KO1KO2b)4) / ((1+(KC1+ KC2)+KC1KC2a)4). The parameters of the fit were: KO1 = 0.88 μM, KC1 = 3.13 μM, KO2 = 4.88 μM, KC2 = 23.2 μM, a = 1, and b = 0.75. Error bars represent SEM.
With regard to Figs. 5 and 6, however, it is interesting to note that Eq. 6 fits the data from the ΔEΔR channel (Fig. 5) better than it does those from the ΔEΔB(D5N5) and ΔEΔB(D2A2) channels (Fig. 6 C). That is, the idea represented by Eq. 6 does not appear to be as good an approximation of reality for the RCK1 site as it does the Ca2+ bowl site. To try to improve the fit, we have added a cooperativity factor by which the binding at one site influences binding at sites on adjacent subunits. If we call this factor f, and suppose for simplicity that f is the same for the opened and closed channel, then Eq. 9 below represents this idea (Cox et al., 1997, scheme III and discussion page 269).
 |
(9) |
Fitting the ΔEΔB(D2A2) data in Fig. 6 with Eq. 9 did produce better fits (Fig. 6 D) and yielded f = 0.45 ± 0.1, KC = 13.7 ± 2.3 μM, and KO = 2.8 ± 0.5 μM for the ΔEΔB(D2A2) channel and f = 0.27 ± 0.05, KC = 9.4 ± 1.8 μM, and KO = 1.8 ± 0.2 μM for the ΔEΔB(D5N5) channel (see Table I). The fact that f is <1 for both fits suggests that, if this explanation is correct, Ca2+ binding at one RCK1 site negatively influences Ca2+ binding at other RCK1 sites on adjacent subunits.
To improve the fit to the ΔEΔB data we also considered a ring model. It has been proposed that the BKCa channel has a gating ring that hangs below the channel and expands upon Ca2+ binding, and that this expansion pulls open the channel (Jiang et al., 2002; Kim et al., 2008). If ring expansion and channel opening are strictly coupled, such that one does not occur without the other, this idea is mathematically equivalent to the simple MWC-like allosteric models we have used thus far. If, however, ring expansion favors opening, but is not obligate for opening, they are not equivalent. A model for this situation is as follows:
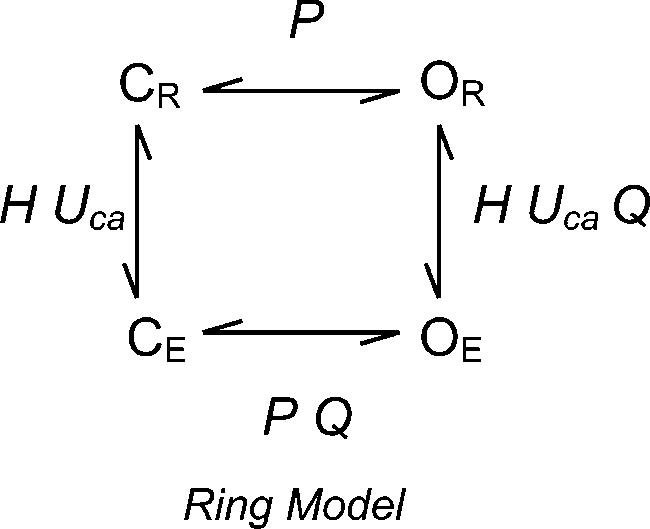 |
where P represents the equilibrium constant for channel opening when the ring is relaxed. H represents the equilibrium constant for ring expansion when the channel is closed, and no Ca2+ is bound. Q represents the factor by which ring expansion favors channel opening, and UCa represents the Ca2+-dependent factor by which Ca2+ binding favors ring expansion. Then, for Popen we have:
 |
(10) |
where
 |
(11) |
or
 |
(12) |
and (Popen/Popenmin) at low open probabilities is:
 |
(13) |
Thus, we fit the data in Fig. 6 with Eq. 13. In the fitting, however, we found that to get an acceptable fit, H had to be small (at most 0.001) and Q had to be large (at least 1,000), and when this is the case, the ring model becomes mathematically equivalent to the MWC-like model we used above, and it yields the same fits. Thus, we could not improve the fit via a ring model, and we view the fact that the best ring model fits were obtained with small values of H and large values of Q as evidence that, if the BKCa channel has a gating ring, its expansion is tightly coupled to channel opening such that one seldom occurs without the other.
The Two Sites Are Less Than Additive
Can the affinities measured for each binding site in isolation, when combined, explain the effect of Ca2+ when both binding sites are intact? To answer this question we calculated the predicted Popen(Ca2+)/Popen(0) versus [Ca2+] curve for the ΔE channel based on the affinities measured for each high-affinity Ca2+ binding site in Figs. 5 C and 6 C. In Fig. 7 this prediction (dark solid curve) is compared with the ΔE data (filled circles). Of most interest, the predicted curve, although similar to the data, does not everywhere overlay the data, but rather it predicts a larger response to Ca2+ than is observed. We might consider two possible reasons for this outcome. The first is that one or the other of the mutations we have used is not completely selective. That is, in addition to eliminating Ca2+ sensing via one type of Ca2+ binding site, a given mutation may also affect Ca2+ binding at the other site. We do not favor this explanation, however, because in order for it to explain the data, the mutation would have to eliminate Ca2+ binding at one site while augmenting it at the other. Although this cannot be ruled out, it seems unlikely. The second potential explanation is that there is negative cooperativity between Ca2+ binding sites, such that their individual influences are naturally less than what is observed when they are combined. Pursuing this idea further we have calculated that a cooperativity factor between the RCK1 and Ca2+ bowl Ca2+ binding sites on the same subunit of 1, when the channel is closed (no cooperativity), and 0.75, when the channel is open (negative cooperativity), could explain this effect (Fig. 7, gray curve).
Do These Results Explain the G-V Shifts with [Ca2+]?
Another question of interest is do the binding affinities we have measured at a single voltage (−80 mV) explain the BKCa channel's sensitivity to Ca2+ over a range of voltages? Fig. 8 A shows the mSlo G-V relation at a series of [Ca2+] fit simultaneously with the BKCa-gating model of Horrigan and Aldrich (2002) (the HA model) but modified to include two sets of Ca2+ binding sites, four per set. There were no free parameters in this fit, but rather gating parameters determined from these and previous experiments (Bao and Cox, 2005) were used. The parameters were as follows: KO1 = 0.88 μM; KC1 = 3.13 μM; KO2 = 4.88 μM; KC2 = 23.2 μM; LO = 2e-06; zL= 0.41 e; Vhc = 151 mV; Vho = 27 mV; and ZJ = 0.58 e. The allosteric factors E1 and E2 were set to 1 to simulate no interaction between voltage–sensor movement and Ca2+ binding at either site. The fit is poor. The model responds to Ca2+ less than is required to move the model G-V relation along with the data. Interestingly, however, when we let E1 and E2 vary freely, that is, we allowed interactions between binding sites and voltage sensors, the fit markedly improved (Ei = 1.43; E2 = 1.73) (Fig. 8 B). This suggests that voltage-sensor movement may alter Ca2+ binding and vice versa.
Figure 8.

Voltage likely affects the affinity of the BKCa channel for Ca2+. Shown are a series of mSlo1α G-V relations determined at the following [Ca2+]: 0.003, 0.070, 0.130, 0.360, 0.8, 10, and 100 μM and fitted simultaneously with the HA model modified to include two Ca2+ binding sites (Bao et al., 2002; Horrigan and Aldrich, 2002). Using values determined from this and previous experiments in our laboratory (Bao and Cox, 2005), the parameters were held as follows: KO1 = 0.88 μM, KC1 = 3.18 μM, KO2 = 4.88 μM, KC2 = 23.2 μM, LO = 2.2 × 10⁻⁶, zL= 0.41 e, Vhc = 151 mV, Vho = 27 mV, and zJ = 0.58 e. In A, the values of allosteric factors E1 and E2 were held to a value of 1 for both Ca2+ binding sites A and B. In B, the values of E1 and E2 were allowed to vary. The best fit values of E1 and E2 were 1.43 and 1.73, respectively.
Voltage Affects Ca2+ Binding
To test this hypothesis directly, we repeated the experiments so far described, but changed the voltage from −80 to 0 mV. We reasoned that at −80 mV few voltage sensors would be active (5% or less) (Stefani et al., 1997; Horrigan and Aldrich, 1999, 2002; Bao and Cox, 2005), and thus there would be very little influence of voltage-sensor movement on Ca2+ binding. But at 0 mV, where the channels' voltage sensors are active 35% of the time when the channels are open (Horrigan and Aldrich, 1999, 2002; Bao and Cox, 2005), if voltage-sensor movement affects Ca2+ binding, some influence of the change in voltage should be observed. Shown in Fig. 9 (A and C) are the Popen(Ca2+)/Popen(0) versus [Ca2+] curves derived from these experiments (open symbols) along with their counterparts determined at −80 mV (filled symbols). Examining first the ΔEΔR channel (Fig. 9 A), we see that its 0- and −80-mV Popen(Ca2+)/Popen(0) versus [Ca2+] curves superimpose. This indicates that voltage-sensor movement does not affect Ca2+ binding at the Ca2+ bowl, but rather a change in voltage simply slides the Popen versus [Ca2+] curve up the Popen axis (see Fig. 9 B). Conversely, there is a substantial effect of voltage on Ca2+ binding at the RCK1 sites (Fig. 9, C and D). The maximal effect of Ca2+ on the open probability of the ΔEΔB(D2A2) channel is ∼10-fold larger at 0 mV than it is at −80 mV (Fig. 9 C), and fitting the 0 mV curve in Fig. 9 C with Eq. 6 yields Ca2+ dissociation constants of 15.6 ± 2.5 μM and 2.1 ± 0.3 μM (C = 7.39), as compared with 23.2 ± 2.6 μM and 4.9 ± 0.6 μM (C = 4.75) at −80 mV.
Figure 9.

The Ca2+ dependence of Popen for the RCK1 site is affected by voltage. However, voltage does not alter the binding at the Ca2+ bowl site. (A) The mean log ratio of NPopen/NPopenmin versus [Ca2+] for mutant ΔEΔR is shown for patches held at 0 mV (open circles) or at −80 mV (solid circles). Each point represents the average of between 6 and 13 patches at each Ca2+ concentration tested. Shown is the fit (dashed curve) of NPopen/NPopenmin based on Eq. 6 and previously shown in Fig. 5. The values determined from the fit are: KO = 0.88 μM and KC = 3.13 μM. (B) The mean log Popen versus [Ca2+] relation for mutant ΔEΔR at both 0 and −80 mV are well fitted with the HA model using the Ca2+ binding constants determined. The values for the parameters were held as follows: KO = 0.88 μM, KC = 3.18 μM, LO = 6.3 × 10⁻⁶, zL= 0.41 e, Vhc = 151 mV, Vho = 27 mV, zJ = 0.58 e, and E = 1. (C) The NPopen/NPopenmin versus [Ca2+] relation for mutant ΔEΔB(D2A2) is shown for patches held at 0 mV (open circles) or at −80 mV (solid circles). Each point represents the average of between 6 and 14 patches at each [Ca2+] tested. The NPopen/NPopenmin versus Ca2+ relations are fitted with Eq. 6. The values of the fit parameters are: ΔEΔB(D2A2): −80 mV, KO = 4.9 μM and KC = 23.2 μM; ΔEΔB(D2A2): 0 mV, KO = 2.1 μM and KC = 15.6 μM. (D) The mean log Popen versus [Ca2+] relation for mutant ΔEΔB(D2A2) at both 0 and −80 mV. First, the 0 mV data were fitted by Eq. 14 to yield the values: KO = 2.1 μM and KC = 15.8 μM. The data were also fitted with the HA model. The parameters were held as follows: KO = 4.9 μM, KC = 23.2 μM, LO = 1.2 × 10⁻⁶, zL = 0.41 e, Vhc = 151 mV, Vho = 27 mV, zJ = 0.58 e, and E = 6.03.
It is not rigorously correct, however, to fit the 0 mV ΔEΔB(D2A2) data in Fig. 9 C with Eq. 6, as an assumption underlying this equation is that Popen is never greater than ∼10−2. Although this is the case for the ΔEΔR and ΔEΔB channels at −80 mV, as shown in Fig. 9 D, it is not the case for the ΔEΔB(D2A2) channel at 0 mV. Thus, to determine the dissociation constants of the RCK1 sites at 0 mV, we fit the ΔEΔB(D2A2) Popen versus [Ca2+] curve in Fig. 9 D with Eq. 14 below, which does not require this assumption.
 |
(14) |
This yielded (Fig. 9 D, solid curve) KC = 15.8 ± 3.1 μM, KO = 2.10 ± 0.4 μM (C = 7.52), and M = 1.8 × 10⁻⁵ ± 0.5 × 10⁻⁵ (see Table I). Thus, changing the voltage from −80 mV to 0 mV decreases KC at the RCK1 Ca2+ binding site by a factor of 0.7 (23.2→15.8). It decreases KO by a factor of 0.4 (4.88→2.10), and it increases C by a factor of 1.8. This increase in C makes the efficacy of the RCK1 sites an order of magnitude larger than the efficacy of the Ca2+ bowl sites at 0 mV. This is highlighted in Fig. 10, where the 0 mV Ca2+ dose-response curves for the two sites are superimposed. Also evident, at 0 mV, as we saw at −80 mV, the ΔE channel's Ca2+ dose-response curve spans a smaller range of open probabilities than is predicted (Fig. 10, dark solid curve) by the combination of the fits to each individual dose-response curve. And again, we can explain this effect by supposing negative cooperativity between the RCK1 and the Ca2+ bowl sites in each subunit. A cooperativity factor of 1 when the channel is closed (no cooperativity) and 0.65 when the channel is open (negative cooperativity) produced the best fit (Fig. 10, gray curve).
Figure 10.

The two binding sites are less than additive at 0 mV. The mean log ratio of NPopen at 0 mV in the presence and absence of Ca2+ for mutants ΔE (open circles), ΔEΔR (open triangles), and ΔEΔB(D2A2) (open squares) are plotted versus [Ca2+]. Each point represents the average of between 6 and 14 patches at each [Ca2+] tested. Various fits of log (NPopen/NPopenmin) are superimposed on the data. The fit of ΔEΔR (short dashed line) with Eq. 6 yielded values of KO = 0.63 μM and KC = 2.28 μM. The fit of ΔEΔB(D2A2) (long dashed curve) yielded values of KO = 1.56 μM and KC = 12.7 μM. Using the same equation, we simulated the log (NPopen/NPopenmin) versus Ca2+ relation (dark solid line) predicted by the affinities determined for each site in isolation. The parameters of the fit were: KO1 = 0.63 μM, KC1 = 2.28 μM, KO2 = 1.56 μM, and KC2 = 12.7 μM. Also plotted (gray curve) is a log (NPopen/NPopenmin) versus [Ca2+] fit that incorporates cooperativity between binding sites. The equation for the fit was log (NPopen/NPopenmin) = ((1+(KO1+KO2)+ KO1KO2b)4) / ((1+(KC1+ KC2)+ KC1KC2a)4). The parameters of the fit were: KO1 = 0.63 μM, KC1 = 2.28 μM, KO2 = 1.56 μM, KC2 = 12.7, a = 1, and b = 0.65. Error bars represent SEM.
We could explain the effect of voltage on Ca2+ binding at the RCK1 sites in terms of the HA model by supposing that as the channel's voltage sensors move to their active conformation, they alter the affinity of the channel's RCK1 sites by a factor E (Horrigan and Aldrich, 2002). To estimate E, we fit the Popen versus [Ca2+] curves at both −80 and 0 mV in Fig. 9 D simultaneously with the HA model. We held the voltage sensing parameters: Vhc Vho zJ and zL to values previously determined for the mSlo channel (Bao and Cox, 2005). We held KC and KO to the values we determined in this study at −80 mV. We set L(0) to the value determined by the bottom of the Popen versus [Ca2+] curve at −80 mV, and we allowed only E to vary. Remarkably, both RCK1 site Ca2+ dose-response curves, −80 and 0 mV, could be fitted fairly well with the same parameters with E equal to 6.03 (Fig. 9 D, dotted line).
The value of E estimated in this way, however, is dependent on the voltage-sensing parameters of the model (Vho Vhc, zL and zJ), parameters that we have taken from previous experiments with wild-type mSlo channels. As here, however, we are using the mutant E399N as our background channel. It may be that this mutation alters one or more of these parameters and thereby renders this method inaccurate. Indeed, differences between the mSlo and E399N G-V curves in the absence of Ca2+ (unpublished data) make us think this may be the case. Thus, another approach we have taken to determining E for the wild-type mSlo channel's RCK1 site is to fit the wild-type channel's G-V relation as a function of [Ca2+] with a two-Ca2+ binding site HA model that includes a voltage sensor–Ca2+ binding site interaction factor E for only one of the high-affinity binding sites, the one with lower affinities. That is:
 |
(15) |
where
 |
 |
 |
 |
 |
 |
 |
We held all parameters but E to values that have been independently determined either here or previously (Bao and Cox, 2005) and allowed only E to vary. The resulting best fit from this approach is shown in Fig. 11. It shows that even with these severe constraints, the two-site HA model with our newly determined Ca2+ binding constants can approximate the shifting of the mSlo channel's G-V relation as a function of [Ca2+], and remarkably the fit yields E = 2.8, a value that is very similar to the value of E (2.4) estimated independently by Horrigan and Aldrich (2002) from measurements of the channel's gating charge movement as a function of voltage at 0 and 70 μM [Ca2+]. Thus, we currently favor this estimate.
Figure 11.

A modified HA model can explain the effect of Ca2+ on the steady-state gating properties of the BKCa channel. Shown are series of mSlo1α G-V relations determined at the following [Ca2+]: 0.003, 0.070, 0.130, 0.360, 0.8, 10, and 100 μM and fit simultaneously with the modified model that includes two types of Ca2+ binding sites, one type interacts with the voltage sensor, and the other type is independent. The data are the same as shown in Fig. 8. The parameters were held as follows: KO1 = 0.88 μM, KC1 = 3.18 μM, KO2 = 4.88 μM, KC2 = 23.2 μM, LO = 2.2 × 10⁻⁶, zL = 0.41 e, Vhc = 151 mV, Vho = 27 mV, and zJ = 0.58 e. The value of E coupling voltage sensor activation and Ca2+ binding at one type of site was allowed to vary. Shown is the best fit obtained. The value of E was calculated to be 2.84 ± 0.13.
DISCUSSION
Here, we have measured the Ca2+ binding constants of the BKCa channel's two types of high-affinity Ca2+ binding sites. To be as accurate as possible, we used unitary current recordings from patches containing from a few hundred to just a few channels. This allowed us to determine Popen over five orders of magnitude. To be as model-independent as possible, as pioneered by Horrigan and Aldrich (2002), we have made measurements at constant voltage and low Popen, such that the amplitudes and shapes of the resulting Ca2+ dose-response curves were dependent only on the channel's Ca2+ binding parameters. Further, to prevent potential interactions between Ca2+ binding sites and voltage sensors from complicating our analysis, our initial experiments were done at −80 mV, where the BKCa channel's voltage sensors are very seldom active. The essential assumptions we made in fitting our data were as follows: (1) that there is a single conformational change between open and closed that can occur with any number of Ca2+ bound (this idea is consistent with a great many single-channel and macroscopic BKCa channel studies and all current models) (McManus and Magleby, 1991; Cox et al., 1997; Cui et al., 1997; Horrigan and Aldrich, 1999, 2002; Horrigan et al., 1999; Rothberg and Magleby, 1999, 2000; Cox and Aldrich, 2000); and (2) that there are four of each type of high-affinity site. This has been established for the Ca2+ bowl (Niu and Magleby, 2002), and given the fourfold symmetry of the channel, it seems likely to be the case for the RCK1 site as well.
Of primary interest, we found that the Ca2+ bowl's dose-response curve at −80 mV could be well fitted by supposing that each Ca2+ bowl independently influences opening, and that each site has an affinity of 3.13 ± 0.22 μM when the channel is closed and 0.88 ± 0.06 μM when the channel is open. These values produce a C value of 3.55, which allows us to calculate that each bound Ca2+ at a Ca2+ bowl decreases the energy difference between open and closed by 3.1 KJ/mol. These numbers may be compared with previous estimates of KC and KO for this site. Xia et al. (2002) estimated KC = 4.5 ± 1.7 μM and KO = 2.0 ± 0.7 (C = 2.25), and Bao et al. (2002) estimated KC = 3.8 ± 0.2 and KO = 0.94 ± 0.06 (C = 4.0). Thus, our current estimates are quite close to those of Bao et al. (2002) and similar as well to those of Xia et al. (2002), although their larger value of KO (2.0 μM) reduces C to 2.2, too low to be compatible with our data. Further, we found no change in the binding properties of this site when the membrane voltage was changed from −80 to 0 mV.
At the RCK1 site we found the ΔEΔB(D2A2) dose-response curve at −80 mV could be fitted with a KC of 23.2 ± 2.6 μM and a KO of 4.9 ± 0.55 μM (C = 4.75), which yields a change in the energy difference between open and closed per bound Ca2+ of −3.8 KJ/mol. However, in this case the fit was improved by supposing some negative cooperativity between sites. The best fit was achieved with a cooperativity factor of 0.45 ± 0.1, now with KC = 13.7 ± 2.3 μM and KO = 2.8 ± 0.5 μM. With either method of fitting, however, the RCK1 site has a substantially lower affinity for Ca2+ than does the Ca2+ bowl in both the closed and in the open conformation. These numbers may be compared with the previous estimates of Xia et al. (2002), KC = 17.2 ± 4.0 μM and KO = 4.6 ± 1.0 μM, C = 3.74, which are similar to what we have found, and those of Bao et al. (2002), KO = 3.8 ± 0.2 μM and KC = 0.94 ± 0.06 μM, C = 4.0, which are higher affinity than what we have found (but see next paragraph). Interestingly, and of relevance here, we have found that Ca2+ binding at the RCK1 site is voltage dependent. The Ca2+ binding affinities in both the closed and open conformation increased as the voltage was depolarized. Moving the membrane voltage from −80 to 0 mV decreased KC from 23.2 ± 2.6 μM to 15.8 ± 3.1 μM and KO from 4.9 ± 0.6 μM to 2.1 ± 0.4 μM. This increased C from 4.75 to 7.52. Thus, as the voltage is depolarized, Ca2+ ions bind more tightly to the RCK1 site in both the closed and open conformations of the channel, and the factor by which each binding event increases the equilibrium constant for opening increases ∼1.5-fold.
In light of this result, one might suppose that the binding properties of the BKCa channel's two types of high-affinity Ca2+ binding sites will come closer together as the membrane voltage is further depolarized and the RCK1 sites' Ca2+ dissociation constants become progressively smaller. Although we have not done experiments at membrane voltages more positive than 0 mV and therefore cannot here confirm this hypothesis, such an idea could explain why Qian et al. (2006), in experiments with hybrid channels containing differing numbers of functional RCK1 or Ca2+ bowl sites, found that channels with either just four Ca2+ bowl sites or just four RCK1 sites showed almost identical Ca2+ dose-response curves at +50 mV. Further, it may also account, at least in part, for the estimates of Bao et al. (2002) being higher affinity than what we have found here for the RCK1 site, as Bao et al.'s estimates were based on the behavior of the mutant channel's full G-V relation as a function of Ca2+, and therefore they necessarily took into account Popen measurements at high voltage.
We have also observed that the effects of Ca2+ binding at each site, when measured individually, sum to more than what is observed when both sites are intact. We are unsure of the cause of this lack of strict independence, but we can explain it by supposing negative cooperativity between the Ca2+ bowl and RCK1 sites within the same subunit. In fact, all that is required is weak negative cooperativity between sites when the channel is open (b = 0.75 [−80 mV] or b = 0.65 [0 mV]) and no cooperative interaction between sites when the channel is closed. Thus, perhaps as the BKCa channel opens, a negative interaction between binding sites develops. In contrast to this result, however, in a study of single hybrid BKCa channels that contained two RCK1 sites and two Ca2+ bowl sites either on the same or on different subunits, Qian et al. (2006) found that there was positive rather than negative cooperativity between binding sites in the same subunit. The reason for these differing conclusions is not clear to us; however, as their study was done at +50 mV and ours at lower voltages, this difference may be the most relevant factor. What we can say, however, is that the Ca2+ binding constants reported by Qian et al. (2006) at +50 mV are not compatible at either site with our Ca2+ dose-response curves recorded at −80 and 0 mV.
Finally, one might ask what is the physical mechanism by which a change in voltage influences Ca2+ binding at the RCK1 sites? And why does this not occur at the Ca2+ bowl sites. We do not yet know the answers to these questions, but our current hypothesis is that the RCK1 sites lie in close proximity to the channel's voltage-sensing domains, and that as a given voltage sensor moves, it alters the structure of its nearby RCK1 Ca2+ binding site, while having no such interaction at the Ca2+ bowl. An allosteric interaction between the BKCa channel's low-affinity Ca2+ binding sites (those disabled by the E399N mutation) and its voltage sensors has already been firmly established (Hu et al., 2001; Cui et al., 1997, Yang and Sachs, 1989; Cui et al., 1997; Horrigan and Ma, 2008), and like the high-affinity RCK1 sites we have investigated here, these low-affinity sites are also thought to reside in the channel's RCK1 domains. Alternatively, one might suppose that Ca2+ binding is voltage dependent because Ca2+ binds within the electric field of the membrane; however, the RCK1 domains of the channel are thought to be suspended below the channel and thus they are not likely within the membrane's electric field.
Acknowledgments
This work was supported by grant P01-HL077378 from the National Institutes of Health.
Edward N. Pugh served as editor.
Abbreviations used in this paper: BKCa channel, large-conductance Ca2+-activated potassium channel; G-V, conductance–voltage; mSlo, mouse Slo.
References
- Bao, L., and D.H. Cox. 2005. Gating and ionic currents reveal how the BKCa channel's Ca2+ sensitivity is enhanced by its beta1 subunit. J. Gen. Physiol. 126:393–412. [DOI] [PMC free article] [PubMed] [Google Scholar]
- Bao, L., A.M. Rapin, E.C. Holmstrand, and D.H. Cox. 2002. Elimination of the BK(Ca) channel's high-affinity Ca(2+) sensitivity. J. Gen. Physiol. 120:173–189. [DOI] [PMC free article] [PubMed] [Google Scholar]
- Bao, L., C. Kaldany, E.C. Holmstrand, and D.H. Cox. 2004. Mapping the BKCa channel's “Ca2+ bowl”: side-chains essential for Ca2+ sensing. J. Gen. Physiol. 123:475–489. [DOI] [PMC free article] [PubMed] [Google Scholar]
- Barrett, J.N., K.L. Magleby, and B.S. Pallotta. 1982. Properties of single calcium-activated potassium channels in cultured rat muscle. J. Physiol. 331:211–230. [DOI] [PMC free article] [PubMed] [Google Scholar]
- Bian, S., I. Favre, and E. Moczydlowski. 2001. Ca2+-binding activity of a COOH-terminal fragment of the Drosophila BK channel involved in Ca2+-dependent activation. Proc. Natl. Acad. Sci. USA. 98:4776–4781. [DOI] [PMC free article] [PubMed] [Google Scholar]
- Brenner, R., G.J. Perez, A.D. Bonev, D.M. Eckman, J.C. Kosek, S.W. Wiler, A.J. Patterson, M.T. Nelson, and R.W. Aldrich. 2000. Vasoregulation by the beta1 subunit of the calcium-activated potassium channel. Nature. 407:870–876. [DOI] [PubMed] [Google Scholar]
- Butler, A., S. Tsunoda, D.P. McCobb, A. Wei, and L. Salkoff. 1993. mSlo, a complex mouse gene encoding “maxi” calcium-activated potassium channels. Science. 261:221–224. [DOI] [PubMed] [Google Scholar]
- Cox, D.H., and R.W. Aldrich. 2000. Role of the beta1 subunit in large-conductance Ca(2+)-activated K(+) channel gating energetics. Mechanisms of enhanced Ca(2+) sensitivity. J. Gen. Physiol. 116:411–432. [DOI] [PMC free article] [PubMed] [Google Scholar]
- Cox, D.H., J. Cui, and R.W. Aldrich. 1997. Allosteric gating of a large conductance Ca-activated K+ channel. J. Gen. Physiol. 110:257–281. [DOI] [PMC free article] [PubMed] [Google Scholar]
- Cui, J., D.H. Cox, and R.W. Aldrich. 1997. Intrinsic voltage dependence and Ca2+ regulation of mslo large conductance Ca-activated K+ channels. J. Gen. Physiol. 109:647–673. [DOI] [PMC free article] [PubMed] [Google Scholar]
- Diaz, L., P. Meera, J. Amigo, E. Stefani, O. Alvarez, L. Toro, and R. Latorre. 1998. Role of the S4 segment in a voltage-dependent calcium-sensitive potassium (hSlo) channel. J. Biol. Chem. 273:32430–32436. [DOI] [PubMed] [Google Scholar]
- Hamill, O.P., A. Marty, E. Neher, B. Sakmann, and F.J. Sigworth. 1981. Improved patch-clamp techniques for high-resolution current recording from cells and cell-free membrane patches. Pflugers Arch. 391:85–100. [DOI] [PubMed] [Google Scholar]
- Horrigan, F.T., and R.W. Aldrich. 1999. Allosteric voltage gating of potassium channels II. Mslo channel gating charge movement in the absence of Ca(2+). J. Gen. Physiol. 114:305–336. [DOI] [PMC free article] [PubMed] [Google Scholar]
- Horrigan, F.T., and R.W. Aldrich. 2002. Coupling between voltage sensor activation, Ca2+ binding and channel opening in large conductance (BK) potassium channels. J. Gen. Physiol. 120:267–305. [DOI] [PMC free article] [PubMed] [Google Scholar]
- Horrigan, F.T., and Z. Ma. 2008. Mg2+ enhances voltage sensor/gate coupling in BK channels. J. Gen. Physiol. 131:13–32. [DOI] [PMC free article] [PubMed] [Google Scholar]
- Horrigan, F.T., J. Cui, and R.W. Aldrich. 1999. Allosteric voltage gating of potassium channels I. Mslo ionic currents in the absence of Ca(2+). J. Gen. Physiol. 114:277–304. [DOI] [PMC free article] [PubMed] [Google Scholar]
- Hu, H., L.R. Shao, S. Chavoshy, N. Gu, M. Trieb, R. Behrens, P. Laake, O. Pongs, H.G. Knaus, O.P. Ottersen, and J.F. Storm. 2001. Presynaptic Ca2+-activated K+ channels in glutamatergic hippocampal terminals and their role in spike repolarization and regulation of transmitter release. J. Neurosci. 21:9585–9597. [DOI] [PMC free article] [PubMed] [Google Scholar]
- Jiang, Y., A. Pico, M. Cadene, B.T. Chait, and R. MacKinnon. 2001. Structure of the RCK domain from the E. coli K+ channel and demonstration of its presence in the human BK channel. Neuron. 29:593–601. [DOI] [PubMed] [Google Scholar]
- Jiang, Y., A. Lee, J. Chen, M. Cadene, B.T. Chait, and R. MacKinnon. 2002. Crystal structure and mechanism of a calcium-gated potassium channel. Nature. 417:515–522. [DOI] [PubMed] [Google Scholar]
- Kim, H.J., H.H. Lim, S.H. Rho, L. Bao, J.H. Lee, D.H. Cox, H. Kim, and C.S. Park. 2008. Modulation of the conductance-voltage relationship of the BK Ca channel by mutations at the putative flexible interface between two RCK domains. Biophys. J. 94:446–456. [DOI] [PMC free article] [PubMed] [Google Scholar]
- Magleby, K.L. 2003. Gating mechanism of BK (Slo1) channels: so near, yet so far. J. Gen. Physiol. 121:81–96. [DOI] [PMC free article] [PubMed] [Google Scholar]
- McManus, O.B., and K.L. Magleby. 1991. Accounting for the Ca(2+)-dependent kinetics of single large- conductance Ca(2+)-activated K+ channels in rat skeletal muscle. J. Physiol. 443:739–777. [DOI] [PMC free article] [PubMed] [Google Scholar]
- Nelson, M.T., and J.M. Quayle. 1995. Physiological roles and properties of potassium channels in arterial smooth muscle. Am. J. Physiol. 268:C799–C822. [DOI] [PubMed] [Google Scholar]
- Niu, X., and K.L. Magleby. 2002. Stepwise contribution of each subunit to the cooperative activation of BK channels by Ca2+. Proc. Natl. Acad. Sci. USA. 99:11441–11446. [DOI] [PMC free article] [PubMed] [Google Scholar]
- Qian, X., and K.L. Magleby. 2003. Beta1 subunits facilitate gating of BK channels by acting through the Ca2+, but not the Mg2+, activating mechanisms. Proc. Natl. Acad. Sci. USA. 100:10061–10066. [DOI] [PMC free article] [PubMed] [Google Scholar]
- Qian, X., X. Niu, and K.L. Magleby. 2006. Intra- and intersubunit cooperativity in activation of BK channels by Ca2+. J. Gen. Physiol. 128:389–404. [DOI] [PMC free article] [PubMed] [Google Scholar]
- Roberts, W.M., R.A. Jacobs, and A.J. Hudspeth. 1990. Colocalization of ion channels involved in frequency selectivity and synaptic transmission at presynaptic active zones of hair cells. J. Neurosci. 10:3664–3684. [DOI] [PMC free article] [PubMed] [Google Scholar]
- Robitaille, R.E., M. Adler, and M.P. Charlton. 1993. Calcium channels and calcium-gated potassium channels at the frog neuromuscular junction. J. Physiol. (Paris). 87:15–24. [DOI] [PubMed] [Google Scholar]
- Rothberg, B.S., and K.L. Magleby. 1999. Gating kinetics of single large-conductance Ca2+-activated K+ channels in high Ca2+ suggest a two-tiered allosteric gating mechanism. J. Gen. Physiol. 114:93–124 (published erratum appears in J. Gen. Physiol. 1999. 114:337). [DOI] [PMC free article] [PubMed] [Google Scholar]
- Rothberg, B.S., and K.L. Magleby. 2000. Voltage and Ca2+ activation of single large-conductance Ca2+-activated K+ channels described by a two-tiered allosteric gating mechanism. J. Gen. Physiol. 116:75–99. [DOI] [PMC free article] [PubMed] [Google Scholar]
- Sah, P.E., and M. McLachlan. 1992. Potassium currents contributing to action potential repolarization and the afterhyperpolarization in rat vagal motoneurons. J. Neurophysiol. 68:1834–1841. [DOI] [PubMed] [Google Scholar]
- Schreiber, M., and L. Salkoff. 1997. A novel calcium-sensing domain in the BK channel. Biophys. J. 73:1355–1363. [DOI] [PMC free article] [PubMed] [Google Scholar]
- Schreiber, M., A. Yuan, and L. Salkoff. 1999. Transplantable sites confer calcium sensitivity to BK channels. Nat. Neurosci. 2:416–421. [DOI] [PubMed] [Google Scholar]
- Semenov, I., B. Wang, J.T. Herlihy, and R. Brenner. 2006. BK channel beta1-subunit regulation of calcium handling and constriction in tracheal smooth muscle. Am. J. Physiol. Lung Cell. Mol. Physiol. 291:L802–L810. [DOI] [PubMed] [Google Scholar]
- Shi, J., G. Krishnamoorthy, Y. Yang, L. Hu, N. Chaturvedi, D. Harilal, J. Qin, and J. Cui. 2002. Mechanism of magnesium activation of calcium-activated potassium channels. Nature. 418:876–880. [DOI] [PubMed] [Google Scholar]
- Stefani, E., M. Ottolia, F. Noceti, R. Olcese, M. Wallner, R. Latorre, and L. Toro. 1997. Voltage-controlled gating in a large conductance Ca2+-sensitive K+channel (hslo). Proc. Natl. Acad. Sci. USA. 94:5427–5431. [DOI] [PMC free article] [PubMed] [Google Scholar]
- Storm, J.F. 1987. Action potential repolarization and a fast after-hyperpolarization in rat hippocampal pyramidal cells. J. Physiol. 385:733–759. [DOI] [PMC free article] [PubMed] [Google Scholar]
- Wang, Z., W.O. Saifee, M.L. Nonet, and L. Salkoff. 2001. SLO-1 potassium channels control quantal content of neurotransmitter release at the C. elegans neuromuscular junction. Neuron. 32:867–881. [DOI] [PubMed] [Google Scholar]
- Wei, A., C. Solaro, C. Lingle, and L. Salkoff. 1994. Calcium sensitivity of BK-type KCa channels determined by a separable domain. Neuron. 13:671–681. [DOI] [PubMed] [Google Scholar]
- Xia, X.M., X. Zeng, and C.J. Lingle. 2002. Multiple regulatory sites in large-conductance calcium-activated potassium channels. Nature. 418:880–884. [DOI] [PubMed] [Google Scholar]
- Yang, X.C., and F. Sachs. 1989. Block of stretch-activated ion channels in Xenopus oocytes by gadolinium and calcium ions. Science. 243:1068–1071. [DOI] [PubMed] [Google Scholar]
- Zeng, X.H., X.M. Xia, and C.J. Lingle. 2005. Divalent cation sensitivity of BK channel activation supports the existence of three distinct binding sites. J. Gen. Physiol. 125:273–286. [DOI] [PMC free article] [PubMed] [Google Scholar]