Abstract
Mesoporous porous silicon (PSi) microcavity sensors are used to conduct conventional solid-phase peptide synthesis. The sensor optical response provides a convenient means to monitor the synthesis reaction in a nondestructive manner. Measurements indicate that peptide synthesis occurs only when the PSi sensor/scaffold is amine-terminated using, for example, the amino silane or deprotected acid-labile Rink linker. Equivalent coupling efficiencies of the first amino acid to both amine terminations are observed. Kinetic studies indicate that coupling reactions are 90% complete in 1 h. Quantitative analysis of the optical response following the synthesis of homo-oligopeptides (4-mers) suggests that coupling efficiencies and/or optical thickness changes depend on the peptide length. The synthesis of the cell adhesive oligopeptide (RGD) was monitored by the optical sensor response and validated by the cell culture of primary dermal fibroblasts. Secondary ion mass spectrometry (SIMS) analysis successfully detected peptide on the silicon wafer adjacent to the PSi. Our findings suggest the potential to exploit the high surface area, efficient coupling, and intrinsic optical detection properties of PSi for label-free high-throughput screening.
1. Introduction
Many commercially important chemical reactions take place on solid phases. In some applications, the solid is a heterogeneous catalyst, and in others, it is an insoluble support to which the product remains tethered until cleavage. Examples of the latter include solid-phase peptide, oligonucleotide, and carbohydrate synthesis.1–3 Tethered synthesis greatly simplifies product purification and enables large-scale automated synthesis. However, quantitative analysis of the reaction time course or endpoint detection requires the destructive analysis of a sample aliquot. This step can be time-consuming, and it decreases product yield. Because solid-phase synthesis reactions are typically run in an extreme excess of reagents, monitoring the time course by measuring the consumption of reagents in solution is error-prone. These limitations have spurred efforts to develop semi-online monitoring techniques employing MALDI-MS4 and electrical conductivity analysis.5
In recent years, porous silicon (PSi) optical devices, produced by the electrochemical dissolution of single-crystal silicon, have been demonstrated in diagnostic biosensing6–8 and immobilized enzyme bioreactor applications.9,10 These applications exploit many of the technologically important attributes of PSi, including its exceedingly high internal surface area (>50 m2/g) and the ability to tailor its morphology over a wide range of pore diameters (10–1000 μm) and porosities (30–90%). In this article, we investigate the feasibility of exploiting both the high binding capacity and the optical properties of a PSi scaffold/sensor as a novel solid phase support to synthesize peptide and monitor the reaction steps’ nondestructive label-free format.
Solid-phase peptide synthesis is ideally suited to prototype this application for several reasons. First, the chemical reagents are widely available, and the reaction steps are straightforward, consisting of a cyclical sequence of coupling and deprotection steps. Second, on the basis of the fundamental operating principle of a PSi microcavity sensor,11 peptide synthesis can be detected through variations in the local refractive index that result when scaffold porosity changes as a result of amino acid binding. Third, short oligopeptides (3–20 amino acids) can act as efficient biorecognition elements. For example, sequences are known that resemble the epitope of microorganisms,12 assist in cell membrane permeation,13 mimic binding sites of extracellular matrix (ECM) proteins,14,15 bind metal ions,16–18 enable recombinant protein purification,19 and serve as important immune system modulators.20,21 In this study, we chose to synthesize RGD-containing peptides, which is a well-known ECM integrin binding motif22 commonly exploited in tissue engineering to enhance cell adhesion to biomaterial surfaces.23,24 Here we demonstrate peptide synthesis by measuring systematic changes in the optical sensor response. Secondary ion mass spectrometry (SIMS) measurements and cell culture studies of normal human fibroblast adhesion on modified PSi samples are presented as secondary methods to validate peptide synthesis. Our results suggest the possibility to exploit PSi scaffold/sensor technology in the directed synthesis of spatially addressable oligopeptide arrays. These have become powerful tools in high-throughput biomedical and pharmaceutical research.25,26 Our technology offers the possibility of label-free detection of the biorecognition events.
2. Materials and Methods
2.1. Porous Silicon Microcavity Scaffold/Sensor
Porous silicon optical microcavity scaffold/sensors are fabricated using p-type silicon wafers (SHE America), which are 525-μm-thick with a resistivity of 0.01 Ω cm using previously described procedures.27–29 Briefly, a silicon wafer is diced into approximately 1 in2 chips and dipped into a 5% HF aqueous solution for 5 s to remove the native oxide layer. The microcavity sensors are etched using an electrolyte solution containing 30% HF (48% aqueous) and 70% ethanol (EtOH). A prelayer is etched with a current density of j = 60 mA/cm2 for 0.4 s with a 2 s pause (j = 0 mA/cm2) before the next current cycle begins. This is followed by etching a Bragg mirror consisting of seven bilayers of alternating porosity (P) etched with current densities of j = 30 mA/cm2 (P = 70%) and 60 mA/cm2 (P = 80%) for 4.95 and 4.75 s, respectively. (Each layer is also followed by a 2 s pause time.) Next, a microcavity defect layer is etched using a current density of 45 mA/cm2 (P = 75%) for 90 s, followed by a pause time of 5 s. After the defect layer, a second Bragg mirror is fabricated containing the same seven bilayers of alternating porosity in mirror one. These etch conditions produce mesoporous silicon with pore diameters ranging from 15 to 30 nm (Figure 1a).
Figure 1.
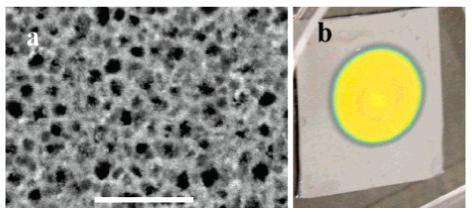
(a) SEM image of the PSi scaffold/sensor surface, scale bar 200 nm. (b) PSi scaffold/sensor (1.3 cm diameter) attached to a silicon wafer substrate.
Immediately after etching, each sensor is rinsed with EtOH and DI water and dried in a stream of N2 gas. The sensors are then thermally oxidized in a 900 °C Lindberg furnace under a constant flow of oxygen for 3 min. This procedure generates an ∼10-μm-thick PSi scaffold/sensor (Figure 1b) with an internal surface area of ∼1400 cm2, as predicted from a simple geometric model.30 Assuming that peptides are spaced 3 nm apart, we estimate that the porous scaffold (1.3 cm diameter) contains ∼30 nmol of peptide binding sites (0.02 nmol/cm2). Typically, sensors are diced into quadrants prior to synthesis.
2.2. Peptide Synthesis
Peptide synthesis on the PSi scaffold/sensor attached to the wafer was carried out using standard fluorenylmethoxycarbonyl (Fmoc) chemistry. Reagents were purchased from Novabiochem and Sigma-Aldrich and used without further purification. Peptide synthesis was initiated by first activating the scaffold/sensor with surface amine groups using a silane coupling agent. A stock solution of 2% APTMS (3-aminopropyltrimethoxysilane, Gelest SIA0610.0) was made comprising 200 μL of APTMS, 4.8 mL of EtOH, 5 mL of DI water, and 40 μL of glacial acetic acid. The PSi sample was treated with 30 μL of the silane solution for 15 min. The sample was washed in a stream of EtOH and then DI water, dried in a stream of N2, and then placed into a 100 °C oven for 20 min. Peptides were synthesized either directly onto the amine-terminated PSi or onto a deprotected acid-labile Rink linker coupled using carbodiimide chemistry. The Rink linker provides a mechanism for detaching the peptide for quantitative purposes. Diisopropyl carbodiimide (DIC) coupling reactions were conducted in 60-mm-diameter glass Petri dishes that contained 10 mL of dimethylformamide (DMF), 14 mg of HOBt-hydrate, 16 μL of DIC, and 10-50 mg of amino acid (AA). We estimate that this corresponds to an ∼104 molar excess of AA relative to the estimated number of peptide binding sites on the PSi sensor/scaffold (∼30 nmol). After coupling, the sample was removed from the reaction vessel and treated with a standard wash sequence of DMF, dichloromethane (DCM), and EtOH. The PSi scaffold/sensor was then dried in a stream of N2. Deprotection of the Fmoc group was achieved with 20% piperidine in DMF for 30 min. Amino acids may also contain additional acid-labile protecting groups (e.g., Pbf and OTB). These protecting groups and the Rink linker are cleaved using 95% trifluoroacetic acid (TFA) and 2.5% triethylsilane. When conducting peptide synthesis, it is desired but not always possible to complete all steps without delay. Studies reveal that samples can be stored at room temperature for several days with intact Fmoc protecting groups or free amines, after which continued amino acid coupling is successful.
2.3. Microcavity Optical Characterization
Optical characteristics of the sensor were checked before and after each synthesis step by white light reflection using an Ocean Optics HR2000 and an Avantes, Inc. AvaSpec-3648-USB2-RM spectrophotometer. The reflection probe is a bidirectional fiber bundle in which white light is illuminated down the central fiber and normal reflected light is collected in six radial fibers. Each fiber diameter is 400 μm with a numerical aperture of 0.22. The white-light source illuminates a sample spot size of ∼2 mm diameter. Prior to recording optical shifts, the PSi scaffold/sensor was washed and dried in a stream of N2. Removing solvents and excess reagents from the porous scaffold enables the measurement of local refractive index changes due to the tethered peptide and eliminates the background signal from bulk effects. Optical shift measurements were recorded at three separate locations on each sensor to determine an average sensor shift. Results from different sensors are then averaged to assess chip-to-chip variability.
2.4. Cell Culture Studies
Cell culture studies were conducted as a second means to validate RGD synthesis. Normal dermal fibroblast (FB) cells were isolated from human foreskin specimens using collagenase B (Boehringer Mannheim Biochemicals) according to the manufacturer-recommended procedures. Cells were grown in 75 cm2 tissue culture plates (Falcon Plastics) in culture media containing Dulbecco’s modified eagle medium (DMEM, Invitrogen) supplemented with 10% fetal bovine serum (FBS, Invitrogen). Cultures were maintained at 37 °C in a humidified incubator with 5% CO2and were used in experiments prior to their 10th passage. Fibroblasts were harvested for experiments by incubating a confluent culture with 2 mL of 0.25% trypsin/EDTA (Gibco) for ∼5 min when 1 mL of FBS was added to quench proteolysis. The cells were pelted by centrifugation, resuspended in 5 mL of DMEM + 10% FBS (cell stock solution), and counted with a bright-line hemacytometer (Hausser Scientific) to yield typically ∼106 cells/mL. PSi samples were diced to fit easily into 12-well (3.8 cm2) tissue culture plates (Falcon Plastics). Approximately 2 mL of culture medium was placed into each well containing a PSi sample and incubated at 37 °C for 1 h prior to adding cells. Next, each well was inoculated with 50 μL of the FB cell stock solution to yield a final cell coverage of ∼1 × 10⁴ cells/cm2. Alternatively, a dilute cell stock solution ( ∼2 × 10⁴ cells/mL) was prepared, and 2 mL was added directly to each well containing a PSi scaffold/sensor. Cells were allowed to grow for 48 h. No difference in results was observed between the two cell seeding methods. Fluorescence microscopy was used to provide a qualitative measure of cell proliferation according to the following procedure. Culture medium was aspirated out of the wells, and cells were fixed at 4 °C in methanol for 5 min, rinsed twice in 1 × PBS, and stained at room temperature with propidium iodide (∼0.5 μg/mL in PBS) or FITC— phalloidin (∼1 μm/mL in PBS) for 10 min. After being stained, the samples were rinsed two times in 1 × PBS, air dried, and observed under a fluorescence microscope.
2.5. Second Ion Mass Spectrometry
Secondary ion mass spectrometry (SIMS) measurements were also conducted as a secondary means to validate the solid-phase synthesis of peptide. Experiments were performed using time-of-flight (TOF) SIMS described in detail elsewhere.31 The system is housed in an ultrahigh vacuum chamber equipped with a fast load-lock for sample entry and removal. The investigated surface is bombarded with primary ions generated by a focused beam of mass-selected 40 keV C60+ cluster ions (Ionoptika C60-40). The available beam current delivered by this source was about 20 pA onto a spot size of roughly 1 μm diameter. The ion beam was directed to the target at an angle of incidence of 40° with respect to the surface normal. Secondary ion mass spectra are obtained by operating the primary ion beam in a pulsed mode with pulse lengths of about 50 ns. Secondary ions removed from the surface due to ion impact are extracted into a reflectron-type TOF mass spectrometer by means of a pulsed extraction field. This pulse is switched on ∼100 ns after the primary ion pulse, ensuring that the sample is at ground potential during ion bombardment. The TOF spectrometer is operated at a mass resolution of about m/Δm = 2500 and is equipped with a microchannel plate detector with 15 keV post-acceleration. Positive ion SIMS spectra were recorded in a manner very similar to that reported recently.32
To prepare samples for SIMS analysis, an RGDS peptide was synthesized on both the wafer and PSi areas using the procedure described in section 2.2. To aid in the detection of the target, peptides were synthesized on a Rink linker and exposed to gas-phase TFA for 35 min prior to SIMS analysis. This procedure clips and deprotects the peptide from the substrate without changing its lateral position on the chip. In addition to synthesizing RGDS for positive ion SIMS analysis, several control samples were synthesized and analyzed on both the wafer and PSi areas, including APTMS, APTMS—Rink, APTMS—Rink—R, APTMS—Rink—RG, and APTMS—Rink—RGD. A positive control sample was also prepared using commercially obtained RGDS (American Peptide Company). Here, ∼50 μL of an ∼8 mM solution of RGDS (400 nmol) in 1 × PBS was applied directly to one-quarter of an oxidized PSi sample (∼1 nmol/cm2) and allowed to evaporate at room temperature.
3. Results and Discussion
3.1. Optical Detection of Peptide Synthesis on the PSi Scaffold/Sensor
Porous silicon optical microcavity sensors detect changes in optical thickness (OT = ηd), where η is the refractive index and d is the thickness of a layer.29 The Bruggeman effective medium theory is used to relate porosity to refractive index.33 Changes in porosity result when molecules bind to the internal surface area of the porous scaffold/sensor matrix. This increases the optical thickness, causing a red shift in the color of light reflected from the sensor as previously described.30 A unique advantage of the PSi sensor is that the optical response varies linearly with pore filling.34 This property is exploited for quantitative analysis purposes.35,36
The optical response from a PSi scaffold/sensor following a typical series of peptide synthesis steps is illustrated in Figure 2. The baseline optical response from the oxidized sensor is shown in black. An ∼21.2 nm red shift is observed following aminosilane treatment (red). Additional red shifts of ∼18.9 and ∼17.7 nm result following the coupling and deprotection steps for the Rink linker (blue) and Arg-(Pbf) (green), respectively. A detailed view of the changes in the magnitude of the sensor optical response following each step in the synthesis of an RGDR peptide on an aminosilane PSi scaffold/sensor (PSi-APTMS) is illustrated in Figure 3. Each coupling step produces a large red shift (>15 nm) depending upon the specific Fmoc—amino acid. An optical blue shift results following each Fmoc deprotection step, indicating a decrease in the optical path length (loss of Fmoc). The magnitude of the optical shifts for the synthesis of RGD averaged over several different PSi scaffold/sensor samples is indicated in Table 1. The red shifts correspond to coupling of the fully protected amino acid. The magnitudes of the blue shifts correspond to the deprotection of Fmoc only.
Figure 2.
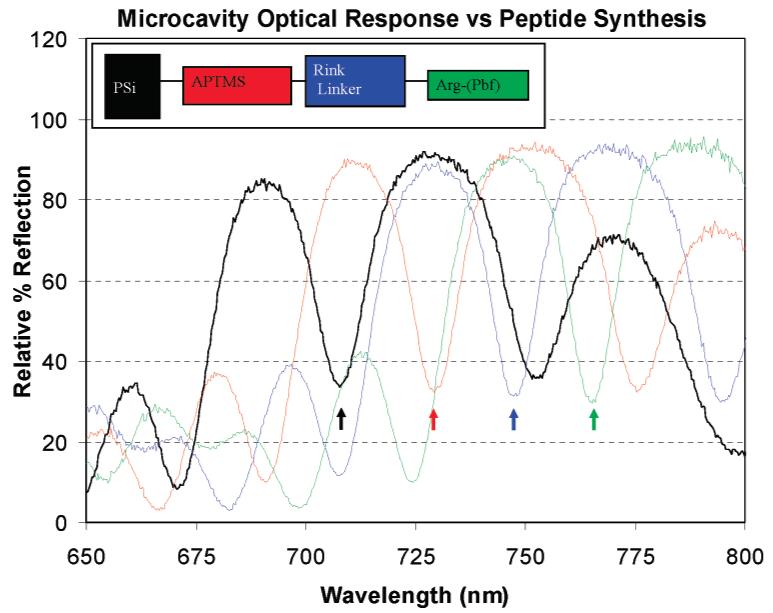
White-light reflection spectrum illustrating optical red shifts relative to the baseline (black) following each sequence of synthetic coupling and Fmoc-deprotection steps: APTMS (red), Rink linker (blue), and Arg-(Pfb) (green). The PSi sensor/scaffold was washed and dried prior to recording optical measurements. Optical shifts result from changes in local RI caused by surface modifications that decrease porosity. The scaffold/sensor is dried before measurements to eliminate bulk RI change due to solvent in the PSi matrix.
Figure 3.
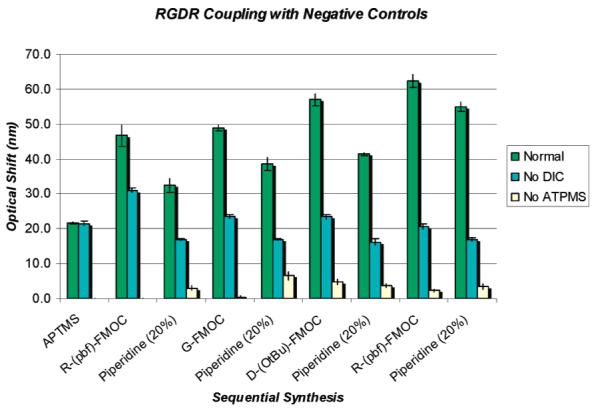
Optical sensor response following RGDR peptide synthesis steps on the PSi scaffold/sensor including two synthesis controls: (1) No APTMS treatment and (2) synthesis excluding the DIC reagent. The results illustrate on the normal APTMS-treated sample a cyclical trend of sensor optical red shift following each amino acid coupling step and sensor optical blue shift after each Fmoc deprotection in piperidine. After the RGDR coupling and Fmoc deprotection steps are completed, there is a cumulative red shift of >33 nm beyond the APTMS baseline indicating peptide synthesis. A cumulative optical sensor red shift does not result on either of the negative control samples. When DIC is eliminated from the synthesis, some nonspecific binding is observed after the coupling step, but exposure to piperidine returns the sensor to the baseline value. The data shows that peptide synthesis occurs only when DIC and free amines are present.
Table 1.
Molecular Weight and Average Wavelength Shifts for Linker and Coupling of the Indicated Amino Acid
| solid-phase RGD synthesis step |
reagent MW |
red shift (nm) AA coupling |
no. of samples |
blue shift (nm) Fmoc deprotection |
MW ratio Fmoc/Fmoc-A (%) |
WSS ratio deprotection/coupling (%) |
no. of samples |
|---|---|---|---|---|---|---|---|
| APTMS (2%) | 279.6 | 21.4 ± 0.5 | 8 | na | na | na | na |
| acid liable rink link | 539.6 | 42.7 ± 7.1 | 8 | -22.9 ± 4.9 | 41 | 54 ± 3 | 9 |
| FMOC—Arg(Pbf)—OH | 648.8 | 26.3 ± 7.4 | 11 | -13.1 ± 4.5 | 34 | 50 ± 9 | 12 |
| FMOC—Gly—OH | 297.3 | 17.8 ± 2.2 | 10 | -15.0 ± 3.0 | 75 | 84 ± 10 | 10 |
| FMOC—Asp(OtBu)—OH | 411.5 | 23.0 ± 2.9 | 12 | -16.4 ± 2.5 | 54 | 73 ± 15 | 8 |
| FMOC | 222.2 | ||||||
| Cummulative Shift |
|||||||
| RGD FMOC | 15.8 ± 2.7 | 4 | |||||
| deprotected only | |||||||
As described above, a wavelength shift corresponds to an optical thickness change (ηd), the magnitude of which we hypothesize depends on the thickness (or mass) of the adsorbed species assuming that the refractive index does not change substantially between amino acids. If the magnitude of a red shift is proportional to the mass linked in the coupling step, then the magnitude of the blue shift following Fmoc deprotection should scale with the molecular weight (MW) ratio of Fmoc to the Fmoc-protected amino acid (Fmoc—AA). In Table 1, the ratio of the wavelength blue shift to red shift (WSR) confirms this correlation; however, the WSRs are on average ∼14% larger than expected on the basis of the MW ratio, suggesting that excess mass is lost in the deprotection step. The origin of this discrepancy is not fully understood, but studies (section 3.2, Figure S1, and Table S1) suggest that it is associated with the nonspecific adsorption of coupling chemicals, primarily HOBt, which detaches during the piperidine step. Piperidine exposure itself may also contribute slightly. Exposing oxidized and APTMS-functionalized PSi sensors to various concentrations of piperidine (20–80%) in DMF for 30 min produces a small blue shift (2.9 ± 0.6 nm). The magnitude of the blue shift does not increase following longer exposures (2 h) to 20% piperidine. Nevertheless, the cumulative red shift (Figure 3) measured following the completion of a series of coupling and Fmoc deprotection steps indicates oligopeptide synthesis.
To validate peptide synthesis, the optical response for two negative control samples was recorded following treatment with an identical sequence of peptide synthesis steps (Figure 3). The first negative control excludes the initial aminosilane step. The results clearly show that cumulative shifts do not result in the absence of starting surface amine terminations. The second negative control eliminates the DIC reagent during the coupling steps. In this reaction, some nonspecific binding of the reagents is observed, most notably following the first arginine coupling step, but here piperidine deprotection returns the sensor to its baseline value. Piperidine is basic, and it may decrease the magnitude of nonspecific binding by neutralizing surface charge on the amine terminations. These results together provide definitive evidence that peptide synthesis occurs only when DIC and free amines are present.
It is of interest to contrast the amino acid coupling efficiency to an APTMS-treated surface relative to the APTMS—Rink linker. The magnitude of the optical sensor response following coupling of the indicated amino acids as a function of surface linking chemistry is illustrated in Figure 4. Within experimental error, nearly equivalent red shifts are measured for coupling directly onto both terminations, suggesting comparable coupling efficiencies. It is important to note, however, that when synthesizing homooligomers (4-mers) the magnitude of the red shift for successive couplings of Fmoc-deprotected amino acids decreases by 5.3 nm per arginine, 3.4 nm per aspartic acid, and only 0.1 nm per glycine (Figure S2). It is plausible that the coupling efficiency within the porous matrix decreases with peptide length; however, the molecular weight of a four amino acid peptide (<2000 MW) is far below where steric crowding effects in PSi (>20 kDa) are anticipated.27,36 Therefore, we attribute the progressively smaller change in optical thickness (OT = ηd) to either an effect of peptide folding (smaller than expected d) or, as the peptide chain extends further away from the PSi surface, an incrementally smaller refractive index change that is produced. Literature precedent exists for nonlinearities to arise in the optical response of sensors used to detect multilayer stacking of polyelectrolyte layers37 and the self-assembly of metal-ion-associated multilayers.38 However, kinetic factors in the synthesis cannot be excluded, and future studies must be specifically designed to elucidate insight into this observation.
Figure 4.
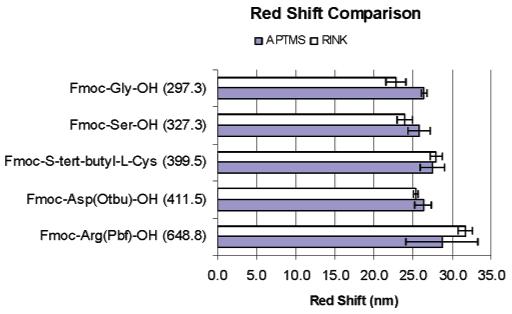
Bar chart contrasting the magnitude of the red shift for the corresponding amino acid coupled onto the amino-terminated APTMS-PSi surface and the acid-labile Rink linker. The amino acid molecular weight is indicated in parentheses. The data suggests comparable coupling efficiencies.
3.2. Kinetics of Amino Acid Coupling on a PSi Scaffold/Sensor
A key advantage of the PSi scaffold/sensor is that peptide synthesis can be monitored in a nondestructive fashion to quantify the coupling kinetics. Several experiments were carried out to elucidate the time necessary to complete a coupling step that was quantified by a decreased rate of change in the optical red shift. Kinetic measurements are made on a individual scaffold/sensor by immersion in the coupling chemical solution for the indicated times followed by a wash and N2 drying steps. After optical measurement, the sample is reimmersed in the coupling solution, and this cycle is repeated until no further red shift is detected. Error bars represent the average of three independent measurements made across the sensor/scaffold. Figure 5 illustrates two interesting aspects of the synthesis kinetics. First, more than 90% of the red shift is attained within 20–30 min of coupling. This is considerably shorter than the typical time course (2–4 h) over which most resin bead couplings are allowed to react.39 In addition, there is a very large initial jump in the red shift following the first minute of synthesis relative to that for the total time that the scaffolds are left in the coupling reaction. To investigate the extent to which this initial jump is due to rapid amino acid coupling or indicative of a background signal effect, measurements were performed to quantify the nonspecific binding of the coupling chemicals. Freshly prepared aminosilane-terminated scaffold/sensors (PSi + APTMS) were exposed to various combinations of coupling chemicals (Figure S1 and Table S1). The results indicate that HOBt contributes primarily to the nonspecific adsorption and likely contributes to the initial jump in red shift.
Figure 5.
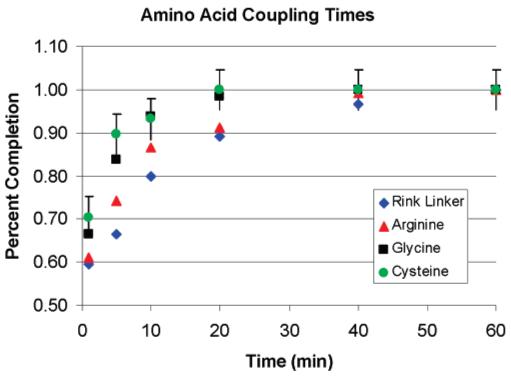
Reaction time course for coupling Fmoc—Rink linker and the indicated Fmoc—amino acids onto the amine-terminated APTMS-PSi scaffold/sensor.
3.3. Fibroblast Adhesion to the RGD-Peptide-Modified PSi Scaffold/Sensor
As a secondary means to validate oligopeptide synthesis, we conducted cell culture experiments using normal dermal fibroblasts cells. The qualitative analysis of cell growth on an oxidized silicon wafer is contrasted with a thermally oxidized PSi sample, an amine-terminated PSi surface, and a fully deprotected RDG peptide synthesized on a PSi + APTMS scaffold/sensor. Cells were stained with propidium iodide or FITC—phalloidin and visualized under a fluorescence microscope (Figure 6). It is known that several cell types can adhere and proliferate on silicon wafers.24,40,41 Like glass, an oxidized silicon surface is anionically charged and hydrophilic (contact angle <10°). Figure 6a illustrates that fibroblasts adhere and proliferate to high density, adopting the characteristic swirl-like pattern morphology on the smooth Si wafer. Oxidized PSi is also anionically charged and hydrophilic (contact angle <10°); however, fibroblasts resist spreading on the nanotopography of the PSi surface. After 48 h in culture, only a few “cell clusters” on PSi are observed (Figure 6b). Similar results are obtained on APTMS-treated PSi surfaces. Observation of the interface between the Si wafer + APTMS and PSi + APTMS confirms that normal human fibroblasts do not adhere or proliferate on the PSi + APTMS surface (Figures 6c and S5). This result contrasts a recent study of immortalized epithelial cell lines cultured on an APTMS-treated PSi sample that showed significant adherence after 4 h.42 Our result possibly suggests that normal human fibroblast cells exhibit more sensitive mechnotransductive behavior. Moreover, 48 h is a sufficiently long time for migration and apoptosis to occur. However, cells cultured on the PSi—RGD scaffold/sensor (Figure 6d) adhere and proliferate to high density, adopting the characteristic swirl-like pattern morphology that confirms our synthesis.
Figure 6.
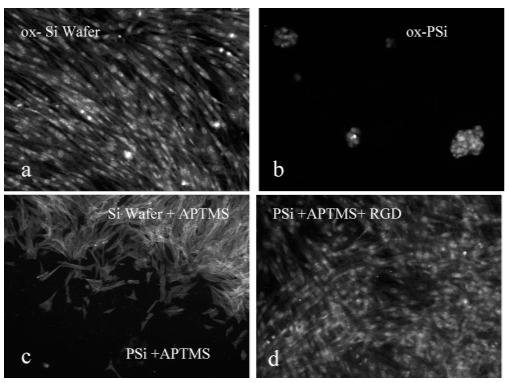
Fluorescence microscopy images of a dermal fibroblast after 48 h of culturing in 10% FBS—DMEM: (a) smooth silicon wafer (Θc < 10°) with oxide and a PI stain; (b) thermally oxidized PSi (Θc <10°) with a PI stain; (c) oxidized and APTMS-treated PSi—wafer interface with an actin FITC stain; and (d) RGD—peptide-modified PSi with a PI stain. Samples were placed in a 12-well plate, and each well was seeded with ∼1 × 10⁴ cells/cm2 and incubated for 48 h.
3.4. Detection of a Synthesized Peptide using Secondary Ion Mass Spectrometry
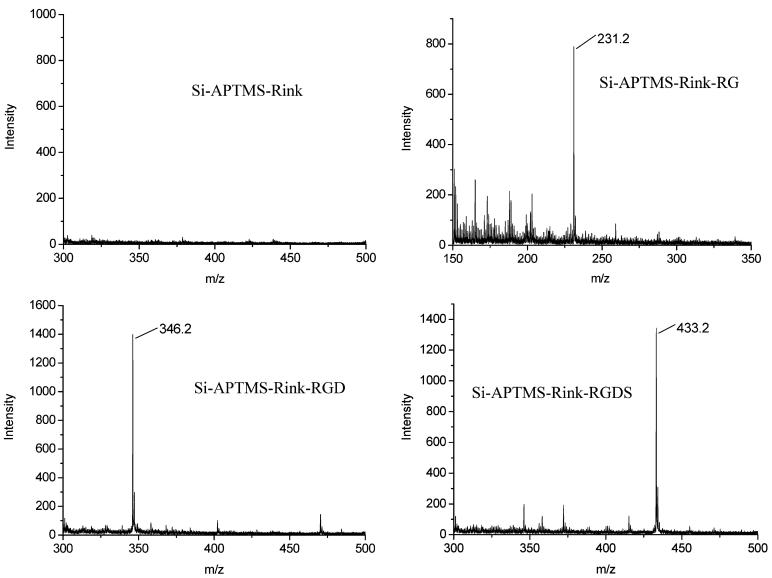
In addition to cell culture and the direct detection of peptide synthesis via the sensor optical response, we employed secondary ion mass spectrometry (SIMS) to further validate peptide synthesis. Several control samples were synthesized and analyzed in addition to the PSi + APTMS—Rink—RGDS sample. The results of positive ion SIMS spectra from the wafer area are shown in Figure 7. For each sample, the appropriate molecular mass is observed, and the SIMS spectra are devoid of large background signals. These results are noteworthy in that they validate our synthesis procedures; however, efforts to obtain equivalent-quality spectra and consistent detection of molecular ion signals from PSi regions of the same samples proved difficult (Figure S3). A positive control composed of evaporated RGDS peptide on oxidized PSi produced an MH+ peak at 434.2 m/e as expected (Figure S4). The reasons for this ambiguous result are not certain, but several possibilities are noted. First, over an order of magnitude more RGDS peptide (∼1 nmol/cm2) was evaporated onto the PSi control sample compared to what we estimate to be synthesized (∼0.02 nmol/cm2) throughout the porous matrix. During evaporation, the peptide may be deposited as a thick surface film resulting from surface tension effects during evaporation. Furthermore, it is well known that SIMS is uniquely surface-sensitive and that desorption/ionization efficiencies depend on many factors.43 It is plausible that peptide detection depends on whether it is evaporated as a film or covalently linked to the PSi sensor. Studies were attempted to lower the porosity of the PSi sensor, forcing synthesis on the top layer, but this did not improve the SIMS detection of peptide on PSi. It is important to note that others have demonstrated porous silicon to be a useful substrate for desorption/ionization mass spectrometry (DIOS)44,45 analysis of small-molecular-weight compounds. This proven application usually employs PSi in the hydride-terminated state or chemically modified with retro-Diels—Alder linkers to enhance positive ion yield.46,47 It has been noted that the photoluminescent type of PSi, as used in this study, is not an effective DIOS surface.44 Future studies must be conducted to investigate whether alternative peptide surface linkers can be exploited to enhance the SIMS detection of synthesized peptide on PSi.
Figure 7.
Secondary ion mass spectra taken from a Si wafer following vapor-phase TFA treatment for 35 min: negative control, amine-terminated Si coupled with Rink; (b) Si—APTMS—Rink—RG yielding an MH+ peak at 231.2 as expected; Si—APTMS—Rink—RGD yielding an MH+ peak at 346.2 as expected; and (d) Si—APTMS—Rink—RGDS yielding an MH+ peak at 433.2 as expected. Note that all amino acids were Fmoc deprotected prior to gas-phase TFA treatment and the spectra were recorded from the wafer area of the sample, not from PSi, for reasons discussed in the text.
4. Conclusions
We have demonstrated that high-surface-area mesoporous PSi can function as a substrate for conventional solid-phase peptide synthesis and that the optical properties of the PSi scaffold/sensor can be used to monitor the synthesis reaction. A similar strategy was employed in the solid-phase synthesis of DNA oligonucleotide strands on PSi particles but without direct optical detection.48 Large optical red shifts are measured following amino acid coupling as a result of changes in the local refractive index. Measurements are made after the scaffold/sensor is washed and dried to eliminate bulk interference from solvent in the porous matrix. Studies show that amino acids couple only when the PSi scaffold/sensor is amine-terminated using either aminosilane or Fmoc-deprotected Rink linker (Figure 3). Cumulative optical shifts do not result from the nonspecific adsorption of amino acids. Equivalent amino acid coupling efficiencies to both amine terminations is observed (Figure 4). Kinetic studies indicate that coupling is ∼90% complete after ∼30 min (Figure 5). Studies are underway to quantify peptide yield and purity relative to standardized polymer bead methodology. Quantitative analysis of the optical response following homo-oligopeptides (4-mers) indicates that either the coupling efficiency or nonlinear optical thickness changes result with increasing peptide length (Figure S2). Future studies will seek to differentiate between coupling efficiency or nonlinear optical thickness changes due to peptide folding or a dependence on the distance from the PSi surface. The synthesis of the ECM cell adhesive (RGD) oligopeptide was validated by the optical sensor response, cell culture, and SIMS analysis (Figures 3, 6, and 7). SIMS analysis of the peptide was consistently detected on the silicon wafer and the wafer/PSi interface but inconsistently in the PSi areas (Figures 1b and S3). Definitive reasons for this are unclear, but it is likely related to inefficient ion yield stemming from the linking chemistry and/or ion ejection from the topographically heterogeneous surface. These studies illustrate the potential to exploit the high surface area, facile coupling, and intrinsic optical detection properties of PSi for use as a novel support capable of rapid, nondestructive, online monitoring of automated tethered synthesis reactions (peptide, oligonucleotide, or carbohydrate). To adapt the PSi scaffold/sensor for automated peptide synthesis, it will be necessary to conduct real-time flow studies to assess whether the local optical shifts associated with peptide coupling can be detected above the background (bulk) signal response generated by solvents remaining in the porous sensor/scaffold. Literature prescience suggests that this may be possible, as the detection of biological molecules using the PSi biosensor in real-time flow situations has been demonstrated.10,49 Real-time flow analysis may also help to reduce the large sample-to-sample variability (Table 1). Finally, this study suggests the possibility of combining photolabile protecting group chemistry and nanoarray technology to spatially direct and monitor the synthesis of combinatorial peptide libraries and subsequently detect molecular biorecognition events in a label-free format. Our future studies will focus on spot arraying the aminosilane linker to demonstrate arrayed peptide synthesis followed by combinatorial oligopeptide receptor synthesis and detection.
Supplementary Material
Acknowledgment
We acknowledge Pete Gareiss, Brian McNaughton, Nate Ross, Charles Mace, and Ben Miller for helpful discussions regarding solid-phase synthesis and Stacy Jacobs for help with cell culture experiments. This work was partially supported by the National Institutes of Health (NIH) National Institute of Allergy and Infectious Diseases (grant 5K25AI060884).
References
- (1).Houghten RA. Proc. Natl. Acad. Sci. U.S.A. 1985;82:5131–5135. doi: 10.1073/pnas.82.15.5131. [DOI] [PMC free article] [PubMed] [Google Scholar]
- (2).Elmblad A, Josephson S, Palm G. Nucleic Acids Res. 1982;10:3291–3301. doi: 10.1093/nar/10.10.3291. [DOI] [PMC free article] [PubMed] [Google Scholar]
- (3).Plante OJ, Palmacci ER, Seeberger PH. Science. 2001;291:1523–1527. doi: 10.1126/science.1057324. [DOI] [PubMed] [Google Scholar]
- (4).Talbo G, Wade JD, Dawson N, Manoussios M, Tregear GW. Lett. Pept. Sci. 1997;4:121–127. [Google Scholar]
- (5).Nielsen CS, Hansen PH, Lihme A, Heegaard PM. J Biochem. Biophys. Methods. 1989;20:69–79. doi: 10.1016/0165-022x(89)90082-1. [DOI] [PubMed] [Google Scholar]
- (6).Harper J, Sailor MJ. Anal. Chem. 1996;68:3713–3717. doi: 10.1021/ac960642y. [DOI] [PubMed] [Google Scholar]
- (7).De Stefano L, Rossi M, Staiano M, Mamone G, Parracino A, Rotiroti L, Rendina I, Rossi M, D’Auria S. J. Proteome Res. 2006;5:1241–1245. doi: 10.1021/pr0600226. [DOI] [PubMed] [Google Scholar]
- (8).Lin H, Gao T, Fantini J, Sailor MJ. Langmuir. 2004;20:5104–5108. doi: 10.1021/la049741u. [DOI] [PubMed] [Google Scholar]
- (9).DeLouise LA, Miller BL. Anal. Chem. 2005;77:1950–1956. doi: 10.1021/ac0486185. [DOI] [PubMed] [Google Scholar]
- (10).L’tant SE, Hart BR, Kane SR, Hadi MZ, Shields SJ, Reynolds JG. Adv. Mater. 2004;16:689–693. [Google Scholar]
- (11).Chan S, Horner SR, Miller BL, Fauchet PM. Mater. Res. Soc. Symp. Proc. 2000;638:F10.4. [Google Scholar]
- (12).Białek M, Grabowski S, Kamiński Z, Kaca W. Acta Biochim. Pol. 2006;53:83–86. [PubMed] [Google Scholar]
- (13).Barnett EM, Elangovan B, Bullok KE, Piwnica—Worms D. Invest. Ophthalmol. Visual Sci. 2006;47:2589–2595. doi: 10.1167/iovs.05-1470. [DOI] [PubMed] [Google Scholar]
- (14).Lutolf MP, Hubbel JA. Nat. Biotechnol. 2005;23:47–55. doi: 10.1038/nbt1055. [DOI] [PubMed] [Google Scholar]
- (15).Hubbell JA. Curr. Opin. Biotechnol. 1999;10:123–129. doi: 10.1016/s0958-1669(99)80021-4. [DOI] [PubMed] [Google Scholar]
- (16).Joszai V, Nagy Z, Osz K, Sanna D, Di Natale G, La Mendola D, Pappalardo G, Rizzarelli E, Sovago I. J. Inorg. Biochem. 2006;100:1399–1409. doi: 10.1016/j.jinorgbio.2006.04.003. [DOI] [PubMed] [Google Scholar]
- (17).Wang J, Luthey—Schulten ZA, Suslick KS. Proc. Natl. Acad. Sci. U.S.A. 2003;100:3035–3039. doi: 10.1073/pnas.262792899. [DOI] [PMC free article] [PubMed] [Google Scholar]
- (18).Yang WR, Hibbert DB, Zhang R, Willett GD, Gooding JJ. Langmuir. 2005;21:260–265. doi: 10.1021/la0482599. [DOI] [PubMed] [Google Scholar]
- (19).Earley KW, Haag JR, Pontes O, Opper K, Juehne T, Song K, Pikaard CS. Plant J. 2006;45:616–629. doi: 10.1111/j.1365-313X.2005.02617.x. [DOI] [PubMed] [Google Scholar]
- (20).Ju ST, Nonogaki T, Bernatowicz MS, Matsueda GR. J. Immunol. 1993;150:2641–2647. [PubMed] [Google Scholar]
- (21).Kokubo T, Hashizume K, Iwase H, Arai K, Tanaka A, Toma K, Hotta K, Kobayashi Y. Nephrol., Dial., Transplant. 2000;15:28–33. doi: 10.1093/ndt/15.1.28. [DOI] [PubMed] [Google Scholar]
- (22).Ruoslahti E, Pierschbacher MD. Science. 1987;238:491–497. doi: 10.1126/science.2821619. [DOI] [PubMed] [Google Scholar]
- (23).Benoit DSW, Anseth KS. Biomaterials. 2005;26:5209–5220. doi: 10.1016/j.biomaterials.2005.01.045. [DOI] [PubMed] [Google Scholar]
- (24).Davis DH, Giannoulis CS, Johnson RW, Desai TA. Biomaterials. 2002;23:4019–4027. doi: 10.1016/s0142-9612(02)00152-7. [DOI] [PubMed] [Google Scholar]
- (25).Fodor SP, Read JL, Pirrung MC, Stryer L, Lu AT, Solas D. Science. 1991;251:767–773. doi: 10.1126/science.1990438. [DOI] [PubMed] [Google Scholar]
- (26).Pellois JP, Zhou X, Srivannavit O, Zhou T, Gulari E, Gao X. Nat. Biotechnol. 2002;20:922–926. doi: 10.1038/nbt723. [DOI] [PubMed] [Google Scholar]
- (27).DeLouise LA, Miller BL. Proc. SPIE. 2004;5357:111. [Google Scholar]
- (28).Chan S, Horner S, Fauchet P, Miller B. J. Am. Chem. Soc. 2001;123:11797–11798. doi: 10.1021/ja016555r. [DOI] [PubMed] [Google Scholar]
- (29).Vinegoni C, Cazzanelli M, Pavesi L. In: Silicon-Based Materials and Devices. Nalwa HS, editor. Vol. 2. Academic Press; San Diego, CA: 2001. p. 124. [Google Scholar]
- (30).DeLouise LA, Miller BL. Anal. Chem. 2004;76:6915–6920. doi: 10.1021/ac0488208. [DOI] [PubMed] [Google Scholar]
- (31).Braun RM, Blenkinsopp P, Mullock SJ, Corlett C, Willey KF, Vickerman JC, Winograd N. Rapid Commun. Mass Spectrom. 1998;12:1246–1252. doi: 10.1002/(SICI)1097-0231(19980930)12:18<1246::AID-RCM316>3.0.CO;2-C. [DOI] [PubMed] [Google Scholar]
- (32).Xu J, Szakal CW, Martin SE, Peterson BR, Wucher A, Winograd N. J. Am. Chem. Soc. 2004;126:3902–3909. doi: 10.1021/ja036549q. [DOI] [PubMed] [Google Scholar]
- (33).Bruggeman DAG. Ann. Phys. Paris. 1935;24:636–664. [Google Scholar]
- (34).DeLouise LA, Kou PM, Miller BL. Anal. Chem. 2005;77:3222–3230. doi: 10.1021/ac048144+. [DOI] [PubMed] [Google Scholar]
- (35).Bonanno L, DeLouise L. Biosens. Bioelectron. 2007;23:444–448. doi: 10.1016/j.bios.2007.05.008. [DOI] [PMC free article] [PubMed] [Google Scholar]
- (36).Ouyang H, DeLouise LA, Miller BL, Fauchet PM. Anal. Chem. 2007;79:1502–1506. doi: 10.1021/ac0608366. [DOI] [PubMed] [Google Scholar]
- (37).Nath N, Chilkoti A. Anal. Chem. 2004;76:5370–5378. doi: 10.1021/ac049741z. [DOI] [PubMed] [Google Scholar]
- (38).Haes AJ, Zou S, Schatz GC, Van Duyne RP. J. Phys. Chem. B. 2004;108:109–116. doi: 10.1021/jp051178g. [DOI] [PubMed] [Google Scholar]
- (39).Chan WC, White PD, editors. Fmoc Solid Phase Peptide Synthesis: A Practical Approach. Oxford University Press; New York: 2003. [Google Scholar]
- (40).Wittig A, Wiemann M, Fartmann M, Kriegeskotte C, Arlinghaus HF, Zierold K, Sauerwein W. Microsci. Res. Tech. 2005;66:248–258. doi: 10.1002/jemt.20159. [DOI] [PubMed] [Google Scholar]
- (41).Ma J, Liu BF, Xu QY, Cui FZ. Colloids Surf., B. 2005;44:152–157. doi: 10.1016/j.colsurfb.2005.06.009. [DOI] [PubMed] [Google Scholar]
- (42).Low SP, Williams KA, Canham LT, Voelcker NH. Biomaterials. 2006;27:4538–4546. doi: 10.1016/j.biomaterials.2006.04.015. [DOI] [PubMed] [Google Scholar]
- (43).Winograd N, Postawa Z, Cheng J, Szakal C, Kozole L, Garrison BJ. Appl. Surf. Sci. 2006;252:6836–6843. [Google Scholar]
- (44).Shen Z, Thomas JJ, Averbuj C, Broo KM, Engelhard M, Crowell JE, Finn MG, Siuzdak G. Anal. Chem. 2001;73:612–619. doi: 10.1021/ac000746f. [DOI] [PubMed] [Google Scholar]
- (45).Cohen L, Go EP, Siuzdak G. In: Small Molecule Desorption/Ionization Mass Analysis MALDI-MS. Hillenkamp F, editor. Vol. 9. 2007. p. 299. [Google Scholar]
- (46).Meng J-C, Averbuj C, Siuzdak G, Finn MG. Angew. Chem. 2004;43:1255–1260. doi: 10.1002/anie.200352803. [DOI] [PubMed] [Google Scholar]
- (47).Meng J-C, Siuzdak G, Finn MG. Chem. Commun. 2004:2108–2109. doi: 10.1039/b408200a. [DOI] [PubMed] [Google Scholar]
- (48).McInnes S, Graney S, Khung Y-L, Voelcker NH. Proc. SPIE. 2006;6036:445–454. [Google Scholar]
- (49).Dancil K-PS, Greiner DP, Sailor MJ. J. Am. Chem. Soc. 1999;121:7925–7930. [Google Scholar]
Associated Data
This section collects any data citations, data availability statements, or supplementary materials included in this article.


