

Abstract
Single molecule microscopy has evolved into the ultimate-sensitivity toolkit to study systems from small molecules to living cells, with the prospect of revolutionizing the modern biosciences. Here we survey the current state-of-the-art in single molecule tools including fluorescence spectroscopy, tethered particle microscopy, optical and magnetic tweezers, and atomic force microscopy. Our review seeks to guide the biological scientist in choosing the right approach from the available single molecule toolkit for applications ranging as far as structural biology, enzymology, nanotechnology, and systems biology.
INTRODUCTION
In late 1959 the visionary Richard Feynman gave his now classic talk suggesting that “there’s plenty of room at the bottom”, which forecast that in the future “we could arrange the atoms one by one the way we want them” and that high-resolution microscopes would allow a direct look at single molecules in biological samples1. Nearly 50 years later, this prediction has spawned the fields of nanotechnology and single molecule (SM) microscopy. In the 1980’s so-called scanning probe and near-field microscopes were developed that use sharp, nanoscale tips to image, probe and manipulate individual atoms or molecules2–4. Pioneering efforts in the late 1980’s and early 1990’s realized optical SM detection in wide-field microscopes5–8. While at first limited to the observation of single chromophores embedded in a crystalline matrix at low temperatures, imaging of single molecules under ambient conditions soon became possible9–11, enabling the envisioned broad applications of SM tools in biology.
Many reviews have described the unprecedented insights into complex biological processes provided by the observation and manipulation of single molecules (for a small selection of recent reviews see12–19). Briefly, according to the ergodicity hypothesis from statistical mechanics, a sufficiently long time average (or sufficient number of observations) from a single molecule is equivalent to a standard population-averaged snapshot, suggesting that, in principle, an SM experiment contains all information of the molecular ensemble. Additionally, SM approaches: (i) reveal heterogeneity and disorder in a sample, albeit in a finite observation window (typically seconds to hours), which seem to contradict the ergodicity hypothesis but are commonplace in biological systems; (ii) afford precise localization (with nanometer accuracy) and counting of molecules (up to 105 molecules/μm2) in spatially distributed samples such as a living cell; (iii) work at the low numbers found for most specific biopolymers (proteins, nucleic acids, polysaccharides) in a living cell (typically 1–1,000), eliminating the need for artificial enrichment; (iv) enable the quantitative measurement of the kinetics (μs to seconds) or statistics of complex biological processes without the need for a perturbing synchronization of molecules to reach a sufficient ensemble-averaged signal; (v) reveal rare and/or transient species along a reaction pathway, which are typically averaged out in ensemble measurements; (vi) enable the ultimate miniaturization and multiplexing of biological assays such as SM sequencing20; (vii) facilitate the direct quantitative measurement of mechanical properties of single biopolymers and their assemblies, including the forces (10−2 to 104 pN) generated by biological motors; and (viii) provide a way to “just look at the thing”, as Feynman suggested1, since one can argue that seeing SM behavior is believing. In combination, these features lead to the profound intellectual and scientific appeal of SM tools and their imminent potential to revolutionize all aspects of the biosciences including structural biology, enzymology, nanotechnology, and systems biology. However, the capabilities of existing SM techniques also have limitations, especially in the accessible measurement accuracies, time resolutions, and time windows, as posed by the weak signal and potential for loss of the observed molecule.
While many studies attest to the unique information gained from SM observation (a conservative estimate places relevant publications at currently ~2,000, with an exponentially increasing trend over the past four decades14), two bottlenecks have impeded an even more rapid and widespread incorporation into the biological sciences. The first bottleneck derives from the perceived requirement for expansive experience and expensive equipment. The accompanying review by Ha and coworkers seeks to encourage researchers to overcome this hurdle by building their own affordable SM fluorescence microscope19. A complementary solution is the implementation of open-access resource centers, much like existing structural biology centers15, or other forms of collaborations with specialists. The second impediment to a broader application of SM tools in biology stems from the need to identify the most suitable technique from the toolkit and develop the corresponding assay to solve the scientific question at hand. The current review aims to provide practical “do-it-yourself” guidelines for choosing the optimal SM tool for any number of research problems. The best choice will depend on the observable of interest, which leads to an organization of the review by categories of observables. For each category, we will provide examples for successful SM assays, as well as a discussion of data analysis, limitations, and possible advances in the future. First, however, we will survey the rapidly expanding optical and force microscopy toolkit available to the SM microscopist (electrophysiology techniques as applied to single membrane-bound ion channels are beyond our scope).
METHODS BASED ON OPTICAL OBSERVATION
An essential basis for making single molecule observations is to dilute the molecule of interest to low (typically < nM) concentrations. The optical, mostly fluorescence based, detection of single molecules has therefore been likened to finding the proverbial needle in the haystack, particularly if the signal-to-noise ratio is not carefully optimized21,22. A number of optical configurations stack the deck in one’s favor and routinely achieve single fluorescent molecule sensitivity (Fig. 1 and Table 1). Their basic components are the microscope, light source(s), optical detector(s), probe(s), and sample23.
Figure 1.

Simplified schematics of SM fluorescence microscopes. (a) In wide-field epi-fluorescence, a laser (green) illuminates an area several μm in diameter and fluorescence (orange) from all single molecules is detected through the same light path. In narrow-field epi-fluorescence, a pinhole (dashed disc) is additionally placed into the excitation path to reduce the excitation volume, therefore increasing the signal-to-noise ratio. In LCM and FCS, the excitation laser is focused to a diffraction-limited Gaussian beam waist. Two pinholes are placed into both the excitation and emission paths (dashed discs), which greatly decreases the background from out-of-focus fluorescence and thus increases the vertical spatial resolution. In FCS single molecules usually diffuse into and out of the confocal ellipsoid, giving rise to stochastic fluorescence bursts (inset). (b) Prism-based TIRFM couples a laser beam into a prism above the critical angle to achieve TIR. (c) Objective-type TIRFM is created by moving the excitation laser beam from the optical axis of the objective to exceed the critical angle for TIR. (d) Closeup comparisons between epi-fluorescence (center light path), objective-type TIRFM and HILO microscopy (light green). (e) NSOM uses a glass fiber, drawn to a sharp tip, to optically probe single molecules on flat surfaces with a spatially constrained evanescent field that is smaller than the wavelength of light. (f) The space available to single molecules can be reduced by confinement in a microfluidic channel of smaller width than the diffraction limit or (g) in capillaries with inner diameters of 15–100 nm.
Table 1.
Common terms in single molecule microscopy
| Term | Acronym | What it means | Reference |
|---|---|---|---|
|
Single molecule fluorescence microscopy
| |||
| Burst-integrated fluorescence lifetime | BIFL | Uses a confocal geometry with time-correlated single-photon counting to detect photons with arrival times for lifetime measurements | 34 |
| Fluorescence (cross-)correlation spectroscopy | F(C)CS | Uses a confocal geometry to probe freely diffusing molecules by calculating the signal auto-(or cross-)correlation | 44 |
| Fluorescence intensity distribution analysis | FIDA | Similar to PCH, but with a more elaborate description of the excitation/detection volume | 137 |
| Highly inclined and laminated optical sheet | HILO | Uses a thin, laminated excitation sheet formed by displacing the excitation laser beam from the optical axis | 25 |
| Laser confocal microscopy | LCM | Uses a confocal pinhole to reject out-of-focus fluorescence and thus achieve a diffraction-limited focal detection spot that is raster scanned over the sample | 138 |
| Near field scanning optical microscopy | NSOM | Uses a sharp glass fiber tip to excite molecules with a spatially constrained evanescent field while raster scanning over a surface | 139 |
| Objective-type total internal reflection fluorescence microscopy | OTIRFM | Uses an evanescent field generated at the interface by TIR through the microscope objective | 28 |
| Photon counting histogram | PCH | Uses fluorescence brightness and concentration of the molecules to calculate the probability of observing m photons during integration time □ | 140 |
|
| |||
| Prism-type total internal reflection fluorescence microscopy | PTIRFM | Couples a laser beam into a prism above the critical angle to achieve TIR and generate an evanescent field at the interface | 28 |
|
| |||
|
Ultrahigh-resolution imaging techniques
| |||
| Fluorescence imaging with one-nanometer accuracy | FIONA | Localizes and tracks single molecule emitters by finding the center of their diffraction limited point spread function | 37 |
| Nanometer-localized multiple single-molecule | NALMS | Uses a similar principle as SHRImP to measure distances between identical fluorescent probes that overlap within a diffraction limited spot | 54 |
| Point accumulation for imaging in nanoscale topography | PAINT | Uses continuous specific or nonspecific binding of diffusing fluorescent probes to an object for high-resolution imaging | 58 |
| Photoactivatable localization microscopy | PALM | Serially photoactivates and –deactivates numerous sparse subsets of photoactivatable fluorophores to produce a sequence of images that are combined into a superresolution composite | 56 |
| PALM with independently running acquisition | PALMIRA | Records non-triggered spontaneous off-on-off cycles of photoswitchable fluorophores without synchronizing the detector to reach faster acquisition | 112 |
| Reversible saturable optically linear fluorescence transitions | RESOLFT | Generalized acronym for GSD and STED | 115 |
| Single-molecule high-resolution colocalization | SHREC | Two-color version of FIONA. | 52 |
| Single-molecule high-resolution imaging with photobleaching | SHRImP | Uses the strategy that upon photobleaching of two or more closely spaced identical fluorophores their position is sequentially determined by FIONA starting from the last bleached fluorophore | 53 |
| Saturated pattern excitation microscopy | SPEM | Wide-field technique that uses saturating standing-wave exciting light patterns together with the nonlinear dependence of fluorescence on the excitation intensity to make high-resolution information visible in the form of moiré fringes | 132 |
| Single particle tracking PALM | sptPALM | Combines PALM with live-cell single fluorescent particle tracking | 114 |
| Saturated structured illumination microscopy | SSIM | Alternative acronym for SPEM | 133 |
| Stimulated emission depletion | STED | Uses overlapping light beams to stimulate the surrounding emitters to reduce the effective focal detection spot in size | 131 |
| Stochastic optical reconstruction microscopy | STORM | Uses photo-switchable fluorophores to image a stochastically different sparse subset in each switching cycle and combine all images into a superresolution composite | 55 |
|
| |||
|
Force microscopy
| |||
| Atomic force microscopy | AFM | Uses a sharp tip mounted at the end of a flexible cantilever to image single molecules by rater scanning over a surface | 3 |
| Magnetic tweezers | MT | Uses an external magnetic field to exert force on a superparamagnetic bead that is tethered to a surface by a single molecule | 71 |
| Optical tweezers | OT | Uses light to exert force on a transparent bead that is tethered to a surface by a single molecule | 59 |
| Tethered particle microscopy | TPM | Tracks the Brownian motion of a microsphere tethered to a surface by a single molecule | 61 |
Experimental configurations
Microscope designs
An SM microscope needs to efficiently reject background, such as autofluorescence as well as elastic Rayleigh and inelastic Raman scattering of the medium surrounding the target molecule, by optically isolating the desired Stokes-(red-)shifted fluorescence signal. A common way to decrease background while retaining signal is to decrease the excitation volume to where the molecule is expected, which can be accomplished by four basic principles (Fig. 1).
First, the excitation volume can be confined using conventional optics. In wide-field epi-fluorescence microscopy the illumination and detection volumes are constrained by focusing light to illuminate an area several μm in diameter and using the same optics to detect fluorescence with an area detector. If desired, the excitation beam waist can be further narrowed with a 200–500 μm pinhole (narrow-field epi-fluorescence24, Fig. 1a). Another approach, termed HILO microscopy (Figure 1d and Table 1), uses a highly inclined beam near the objective edge that refracts into a thin optical sheet to penetrate the sample at a shallow angle25.
Second, light from outside the focal volume can be eliminated using a small detection pinhole on the microscope side of the objective to keep out-of-focus light from reaching the detector (Fig. 1a). This method, called laser confocal microscopy (LCM), has several different implementations as discussed elsewhere26. In fluorescence correlation spectroscopy (FCS) and fluorescence cross-correlation spectroscopy (FCCS) (Table 1), target molecules of one and two fluorophore colors, respectively, either freely diffuse through a fixed confocal volume or are immobilized27, giving rise to stochastic fluorescence fluctuations that are temporally autocorrelated and cross-correlated, respectively, or otherwise statistically analyzed. Without immobilization the temporally autocorrelated molecules are not the same since new ones continuously pass through the confocal volume, leading effectively to ensemble averaging and a limited ability to interrogate or track individual molecules.
Third, total internal reflection (TIR) at a glass(or quartz)-to-solution interface can be used to generate a standing wave (“evanescent field”) that penetrates the solution to a depth of ~50–150 nm, depending mostly on the incident angle and relative refractive indices at the interface28. Practical implementations of total internal reflection fluorescence microscopy (TIRFM, Table 1) use either a quartz prism (Fig. 1b) or the microscope objective (Fig. 1c) to generate the evanescent field and illuminate surface-immobilized or –constrained molecules. The excitation beam paths of epi-fluorescence, HILO and objective TIRFM are relatively similar so that the same microscope can be switched between them (Fig. 1d). Finally, in near-field scanning optical microscopy (NSOM, Table 1), a metal-coated optical fiber with a tapered aperture of sub-wavelength diameter (~80 nm) generates a focused evanescent field that is scanned closely over a surface with immobilized target molecules and imaged using the same fiber or a high-numerical aperture objective (Fig. 1e). Although NSOM has found widespread applications in nanotechnology, it has proven difficult to apply to biological samples due to the need for a flat, stable sample surface and the fragility of the fiber tip.
Fourth, the detection volume can be physically restricted by, for example, using photophysics to silence neighboring molecules. More specifically, spatial resolution and signal-to-noise ratio are improved in stimulated emission depletion (STED) microscopy (Box 1) by depletion of out-of-focus fluorescent molecules or in photoactivated localization microscopy (PALM) and stochastic optical reconstruction microscopy (STORM) by stochastic photoswitching of neighboring fluorophores (Table 1). Alternatively, a small nanofluidic channel (Fig. 1f), capillary (Fig. 1g) or other compartment can be used to contain the target molecule in a volume smaller than the excitation volume, often in combination with other approaches to create a decreased excitation volume. In TIRFM, for example, the detection volume of single molecules can be physically further restricted by partially blocking the evanescent field with nanofabricated zero-mode waveguides29,30 or in partially etched optical fiber-bundle arrays31. Such physical containment strategies often lend themselves to integration with micro- and nanofluidic sample handling, which reduces the required sample volume and gives the opportunity to precisely control environmental conditions such as the timed release and mixing of reagents, fluid flow (shear force), and transient exposure to nanoscale manipulation and sensing devices32 (for a detailed discussion please also see the accompanying review by Brewer and Bianco33).
BOX 1. SUPERRESOLUTION IMAGING BY HARDWARE-BASED METHODS.
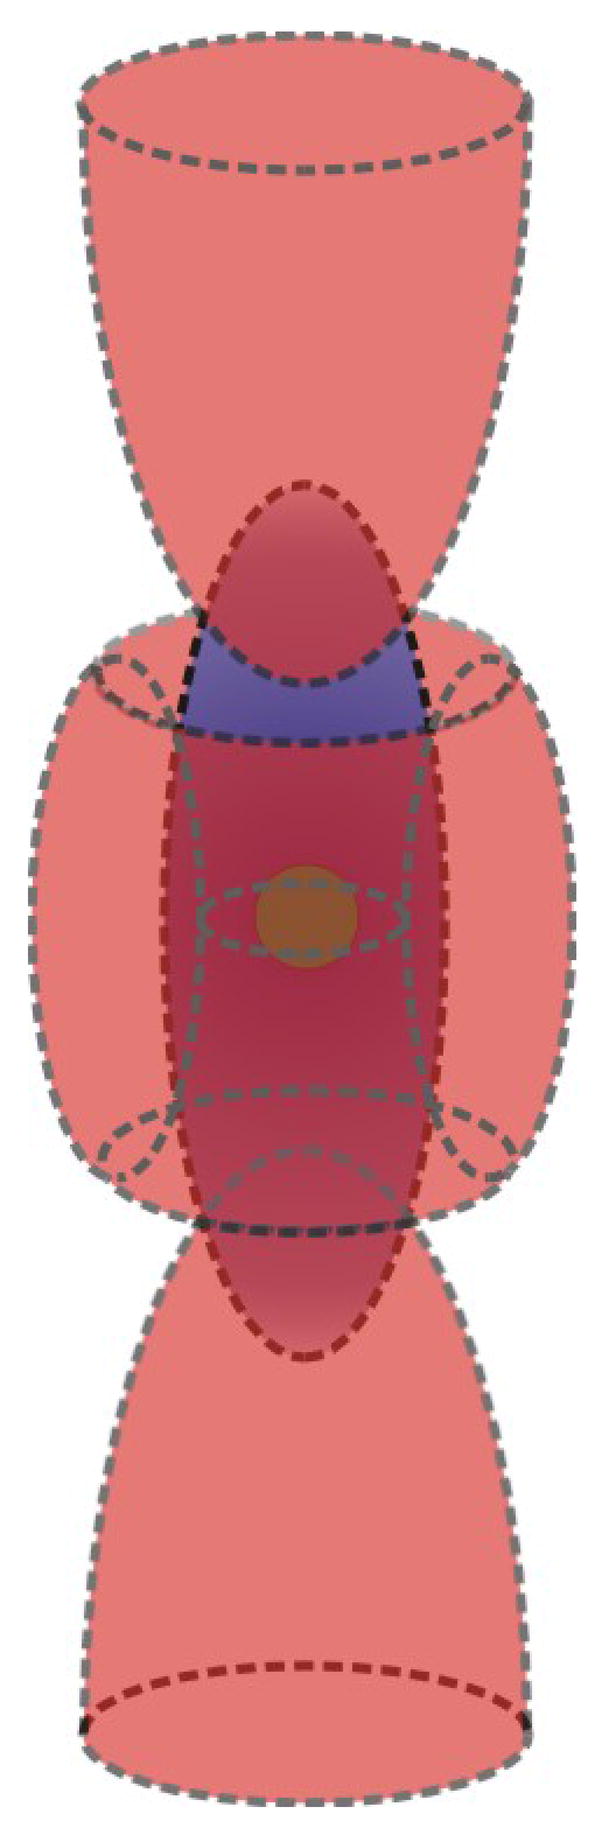
Reversible saturable optical fluorescence transition (RESOLFT) techniques reduce the size of the PSF by the use of sophisticated excitation configurations14,115. Implementations include stimulated emission depletion (STED)115,131 and saturated pattern excitation microscopy (SPEM)132. In STED microscopy a diffraction limited laser beam excites a focal sample volume and is followed (in pulsed STED) or accompanied (in continuous wave STED) by a donut-shaped stimulated emission beam that depletes the excited states of all fluorophores but those in the very center of the originally excited region (see Figure). Only molecules in the center of the focal volume remain in the excited state so that they are detected and imaged. Similarly to scanning LCM, the imaging beams are raster scanned across the sample. The theoretical resolution limit of RESOLFT techniques is given by:
where λ is the wavelength, α the aperture angle of the lens, n the refractive index, Imax the maximum of the light intensity outside of the center position, and Isat the light intensity to saturate the spectroscopic transition to be imaged115. This equation differs from Abbe’s law by introducing Imax/Isat, which in principle can lead to infinite resolution, but at the cost of very high excitation intensities that may damage living cells or other light sensitive samples.
Saturated pattern excitation microscopy (SPEM)132,133 or saturated structured illumination microscopy (SSIM)133 is a wide-field, non-scanning superresolution technique that projects excitation patterns on a fluorescent sample, rendering otherwise unresolvable high-resolution information visible in the form of low-resolution moiré fringes. SSIM builds up higher resolution by using many different patterns14. Images require computational construction from the raw data, with the practical resolving power determined by the signal-to-noise ratio.
4Pi is a confocal fluorescence microscopy that increases the axial (z) resolution of LCM by a factor of ~3–7 through the use of two opposing lenses with high numerical aperture to illuminate a single focal spot; the two wavefronts of the opposing beams interfere constructively at the focal point to narrow the focal maximum along the axial dimension. Interference of the spherical wavefronts above and below the focal plane creates side lobes in the image that are mathematically removed. I5M is a wide field, nonconfocal method that implements the same opposing lens aperture enhancement in the detection of fluorescence, but uses plane parallel standing waves for excitation. Even though 4Pi and I5M are also hardware based methods that alter the PSF of the imaged fluorophore(s), they differ from the RESOLFT techniques, which utilize nonlinear effects from optical saturation of the emitters to shape the PSF. A combination of RESOLFT with 4Pi microscopy thus further increases the axial resolution115.
Box 1 Figure. STED narrows the PSF (blue) by depleting excited states around the very center of the excitation focus (red).
Light sources and optical detectors
In most cases lasers are used for SM detection due to their intense, coherent, and collimated excitation light with well-defined wavelength. Lasers are either continuous or, if additional information such as an excited state lifetime is sought, pulsed34. The most common detector for the single-point measurements performed in confocal fluorescence microscopy is the single-photon counting avalanche photodiode (SPAD or APD)23 of nanosecond response time35. A photomultiplier tube (PMT) has a larger detection area, but offers lower quantum efficiency and requires higher operating voltage, which produces noticeable dark counts even when cooled23. For detection of single molecules in a wide-field microscope a specialized charge coupled device (CCD) is the area detector of choice. A CCD camera does not count single photons per se, but integrates photoelectrons over time with good quantum efficiency. The noise in each pixel of a cooled CCD chip does not notably increase with integration time so that longer integration leads to improved signal-to-noise. Modern CCD cameras that reach single fluorophore detection sensitivity with 1–100 ms integration times use image intensifier tubes with a photocathode, microchannel plate and phosphor screen (in an intensified CCD, or ICCD) or on-chip multiplication of photoelectrons (in an electron-multiplied CCD, or EMCCD). The CCD imaging of the diffraction-limited spot of a single fluorescent molecule described in the implementation section below has recently become very popular since it enables measurement of the molecule’s position at nanometer precision and can visualize position changes over time that report on molecular-scale movement14,36–39. The time resolution of a single fluorescent molecule detected by an APD is mostly limited by the photon count rate, which is inversely related to the total observation time before photobleaching, whereas detection by a CCD is limited by the frame readout rate.
Probes
Fluorophores suitable for SM detection fall into several categories: fluorescent organic dye molecules (including nonlinear optical chromophores), semiconductor nanocrystals, also known as quantum dots, fluorescent proteins, fluorescent microspheres, and gold nanoparticles. A suitable fluorophore needs to have: 1) high brightness, which is the product of the extinction coefficient of the fluorophore at the wavelength of excitation (should be >20,000 M−1cm−1) and the fluorescence quantum yield (ratio of emitted to absorbed photons) at the wavelength of emission (should be >10%); 2) a relatively short excited-state lifetime (of a few nanosecond) to quickly replenish the ground state; 3) a large Stokes shift to facilitate rejection of scattered excitation light; and 4) stable photophysical properties (rare photobleaching, low probability of dark states).
A widespread and powerful SM fluorescence application is to measure intra- or intermolecular distances. For sensitive distance measurements by fluorescence resonance energy transfer (FRET) between two fluorophores, the detected distance(s) should fall within a range of 0.5- to 2-fold of the so-called Förster distance, which is the characteristic distance of half-maximal FRET efficiency of a specific fluorophore pair19,40. To observe single fluorophore quenching by electron transfer the electron transfer partner should be within a distance of ~10 Å. For a more in-depth discussion of the criteria for selecting fluorophores suitable for SM measurements and strategies for their conjugation to a biopolymer the reader is referred to Kapanidis and Weiss41 and the accompanying review by Ha and coworkers19.
The sample
In single “molecule” fluorescence microscopy the target may either be a covalently bonded molecule or a molecular assembly, which can be freely diffusing, spatially constrained or completely immobilized. Techniques that use an evanescent field for excitation and/or seek an extended observation time window require partial or full immobilization of the target molecule. A number of approaches, discussed in ref. 42 and the accompanying review by Ha and coworkers19, have been successfully implemented to accomplish containment of the target molecule under conditions where it retains its native (solution-state) behavior. Recent additions to this arsenal are dielectrophoretic and electrokinetic trapping of freely diffusing molecules14. Which method is most suitable for a given problem depends on the stringency of surface passivation necessary to suppress nonspecific adsorption in the biological context.
Implementation and general considerations
Imaging
Both scanning and stationary modes of LCM can obtain images of biological samples, but with very different characteristics. Scanning LCM can, for example, obtain three-dimensional images of a live cell, but the quality of the image depends heavily on the scanning rate, which limits its ability to observe dynamic processes. “Parking” a stationary LCM focus on an imaged, immobilized biomolecule then can capture dynamic processes on a fast (μs) timescale. Spinning-disc confocal imaging uses a pattern of slits on a disk spinning at typically 3,000 rpm to create virtual pinholes for confocal detection from a larger area43. By comparison, confocal FCS analysis of diffusing molecules is suitable for determining the bulk concentration (nM and below), diffusive properties, and brightness as well as fast to intermediate dynamics (ms), and is limited by the photon count rate and focal residence time. New FCS detection schemes therefore aim to more directly access slower biological processes, as well as higher target concentrations, whereas dual-color FCCS was developed to probe multiple components assembling into complexes44,45. The spatial resolution of scanning LCM can be improved by incorporating “hardware” based high-resolution techniques (Box 1). Epi-fluorescence and TIRF based techniques are suitable to study intermediate to slow dynamics (≥1 ms), limited by the CCD frame rate and image intensity requirements. In conjunction with “software” based high-resolution techniques, epi-fluorescence and TIRF have developed into valuable tools for in vitro and live cell imaging as well as particle tracking (see next section).
Single particle localization and tracking
A multitude of methods are available and continuously being refined to allow biologists to probe the positions and distributions of particles in dynamic samples at high spatial and temporal resolutions, with wide-field optical microscopy as the major work horse. Abbe intuitively postulated over 120 years ago that optical resolution is impossible below ~200 nm (referred to as “Abbe’s law” or “Rayleigh’s resolution limit”)46. Beginning in the late 1980’s, however, light microscopy of fluorescent beads and metallic nanoparticles attached to biological specimens allowed the localization and tracking of features with spatial resolutions of tens of nanometers and time resolutions of tens of milliseconds, resulting in related techniques with names such as nanovid microscopy, single particle tracking (SPT), and tethered particle microscopy (TPM)47–49 (Fig. 2a). As early as 1996, tracking of diffusive motions of membrane constrained, dye labeled single molecules was reported50. A recent theoretical analysis has shown that the resolution of optical microscopes is in fact not limited by Abbe’s law and can be improved by increasing the number of detected photons51. Current ultrahigh-resolution fluorescent microscopy tools can be classified either as techniques that utilize mathematical processing of the acquired diffraction limited image, where the point-spread function (PSF) of an imaged fluorophore is analyzed using a priori knowledge about its shape (“software” based solutions, discussed in the following); or as techniques that take advantage of unique optical hardware configurations to suppress the PSF size through the use of specific sample illumination patterns (“hardware solutions”, see Box 1)14.
Figure 2.

Simplified schematics of SM force microscopes. (a) TPM monitors the restricted Brownian motion of an (often fluorescent) microsphere tethered to a surface by a single molecule. A directional force can be applied to the microsphere by a laminar solution flow. (b) Optical tweezers use light to levitate a transparent bead of distinct refractive index. The trapped bead is suspended at the waist of the focused (typically infrared) laser beam. The displacement of the bead from the focal center results in a proportional restoring force and can be measured by interferometry or back-focal plane detection. A single biopolymer can be suspended between two beads or a bead and a motorized platform. (c) Magnetic tweezers use an external, controllable magnetic field to exert force and/or torque on a superparamagnetic bead that is tethered to a surface via a single molecule. (d) AFM uses a sharp tip mounted at the end of a flexible cantilever to image single molecules bound on an atomically flat surface by raster scanning in the x-y plane (and often simultaneously tapping in the z-dimension). AFM-based force spectroscopy exerts pulling force on a single attached molecule by retraction of the tip in the z-direction. Cantilever bending is detected by the deflection of a laser beam onto a position-sensitive detector such as a quadrant photodiode. A piezoelectric actuator stage is used to control the positioning of the sample relative to the tip.
Recent “software” based particle tracking of single fluorescent emitters has advanced to resolutions of up to 1.5 nm16,37. Fluorescence imaging with one-nanometer accuracy (FIONA) localizes and tracks SM emitters over time by finding the centers of their diffraction limited PSFs in a sequence of wide-field images. This is typically done by approximating the diffraction limited Airy disk as a 2D Gaussian function (Fig. 3a)37,38. Since fitting is a post-measurement, software-based manipulation of wide-field images, it can be applied in conjunction with a broad range of microscope configurations including TIRFM, epi-fluorescence, and LCM. Most typically, images are recorded with a CCD and are thus pixilated. The accuracy with which the center position of a PSF can be localized is then given by the standard error of the mean36:
Figure 3.

Ultrahigh-resolution imaging with “software” based solutions. (a) The pixelized point-spread function (PSF) of a single imaged fluorophore can be modeled by a two-dimensional Gaussian to determine its position with nanometer accuracy. The three-dimensional peak to the left shows the recorded intensity for each pixel as a colored surface and the two-dimensional Gaussian intensity fit as a colored mesh. A corresponding contour map is shown to the right. (b) Two fluorophores with a separation shorter than the diffraction limit can be individually localized by subtracting the PSF of one fluorophore from the initial overlapping image after the other fluorophore is photobleached or has adopted a dark state. (c) An aggregate reconstruction of images with many overlapping fluorescence emitters is possible from sub-images produced by either sequentially photoactivating and photobleaching or cyclically photoswitching sparse stochastic subsets of fluorophores.
To first approximation, σSEM is the square root of the standard deviation s of the Gaussian fit, divided by the square root of the total number N of photons collected (first term), revealing how important total photon count is for high accuracy. The effective pixel size of the camera, a, and the noise from background signal, b, also play a role (second and third terms).
Multiple particle localization and tracking
A number of ultrahigh-resolution techniques build upon FIONA to expand its applicability to larger fluorophore numbers. Single-molecule high-resolution co-localization (SHREC) is a two-color version of FIONA that uses fiduciary markers to measure the registration between two detection channels of separable spectral range52. Single-molecule high-resolution imaging with photobleaching (SHRImP)53 and nanometer-localized multiple single-molecule (NALMS) fluorescence microscopy54 are capable of measuring distances between identical fluorescent probes that overlap in a diffraction limited spot. Upon stochastic photobleaching, the position of the last bleached fluorophore is determined by FIONA. This PSF is then subtracted from the previous image consisting of two overlapping PSFs from two proximal fluorophores, and FIONA is applied to define the PSF location in this difference image (Fig. 3b). This process may continue for an arbitrary number of fluorophores, with decreasing precision of centroid localization of each additional dye molecule.
Stochastic optical reconstruction microscopy (STORM)55 utilizes single photo-switchable fluorescent emitters that are turned on and off by excitation light sources. A stochastically different subset of proximal fluorophores is activated with each imaging cycle, allowing for a higher chance of sufficiently separated PSFs for FIONA-type localization (Fig. 3c). Similarly, photoactivated localization microscopy (PALM)56 and fluorescence PALM (F-PALM)57 photoactivate and subsequently bleach sparse subsets of photoactivatable fluorescent protein molecules within a sample with a high density of such probes. FIONA is applied to each image and the aggregate position information assembled into an ultrahigh-resolution image with as many as 105 PSFs per μm2 and separations of localized molecules resolved to ~10–60 nm. Finally, point accumulation for imaging in nanoscale topography (PAINT) is based on continuous transient (specific or nonspecific) binding of low concentrations of otherwise freely diffusing single fluorophores to an imaged object; once bound and imaged the fluorophores are bleached to repeat the process58. The centroids of the PSFs from these transient fluorescent signals are determined by FIONA and used to assemble a composite image of relatively large objects, such as unilamellar vesicles.
METHODS BASED ON MECHANICAL INTERACTION
The ability to apply force to or measure forces generated by a single biopolymer opens up new avenues to manipulating biomolecules and interrogate cellular processes12,17,18. Three forms of force microscopy are commonly used to study single molecules (Fig. 2) □ optical tweezers (OT), magnetic tweezers (MT), and atomic force microscopy (AFM) □ and are described in detail in the accompanying review by Neuman18. A fourth technique, tethered particle microscopy (TPM), is discussed here as well. They share some common features including that they typically operate chromophore(label-)free as they extend a long biopolymer between two attachment sites (handles).
Experimental configurations
Optical tweezers (OT, optical traps) were developed since the 1970’s59. OT utilize the radiation pressure exerted by a focused laser beam on an object (usually a transparent spherical bead) of distinct refractive index to levitate it (Fig. 2b). The equilibrium position of the bead is close to the center of the laser focus (a slightly downward displacement is due to scattered light). Any displacement from this equilibrium position will produce a restoring force proportional to the displacement (as in a linear spring). In magnetic tweezers (MT), the optically transparent plastic bead is replaced by a superparamagnetic bead that is controlled by magnetic forces (Fig. 2c). MT is an intrinsic force clamp device, since the magnetic field gradient exerts a constant force on the superparamagnetic bead due to the small size of the bead compared to the magnet. An atomic force microscope utilizes a sharp tip mounted at the end of a flexible cantilever as a scanning probe or force transducer (acting as a linear spring) and can be operated in either an imaging or force mode. TPM (Fig. 2a) can be viewed as related since the restricted Brownian motion of a biopolymer tethered bead is tracked over time by CCD-based video microscopy and used to calculate spring constants and other mechanical properties of the tethering biopolymer60 or to monitor changes in its length upon mechanical extension in a laminar flow61,62.
Force generation
In OT, an applied force can be generated by either changing the intensity of the laser (the trapped bead experiences a force proportional to the gradient of the laser intensity used to trap it) or displacing the trapped bead away from the equilibrium position (following Hooke’s spring law). A permanent-magnet MT acts like a constant force clamp. By contrast, an electromagnet MT can vary the applied force by changing the current through the electromagnet. A force-mode AFM uses a flexible cantilever as a linear spring while pulling back from the surface to exert forces on a single molecule that is bound to the imaged surface and becomes physi– or chemisorbed to the tip (Fig. 2d). Finally, in TPM it is possible to apply defined forces to the tethered biopolymer by introducing laminar flow63.
Single molecule manipulation
A typical OT experiment suspends a single biopolymer between two beads or a bead and a flat surface (the latter typically controlled by a motorized stage) and measures a force extension curve as the biopolymer ends are pulled apart or, conversely, the biopolymer length changes during a biological process and the bead is displaced from the trap center. In addition to a linear force, magnetic tweezers can apply controlled torsional twist (torque) on a single molecule by simply rotating the magnetic field. OT have also been demonstrated to have the ability to apply torque to the sample using non-spherical trapped microparticles and linearly polarized trapping beams64,65, although the implementation is not as straightforward as in MT. In AFM, the bending of the flexible cantilever is readily amplified and detected by deflection of a laser beam onto a quadrant photodiode to generate a force-extension curve.
The sample
In force spectroscopy, the biomolecule of interest usually needs to be tethered to a bead or other surface through specific binding or a covalent linkage. Therefore, the surface immobilization strategies used in optical microscopy are equally applicable in force spectroscopy. Surface attachment is simplified by the commercial availability of functionalized polystyrene beads, superparamagnetic beads, and AFM tips12,17,18. To sufficiently separate its two attachment sites, the target molecule oftentimes have to be extended with stiff handles (such as double-stranded DNA). While nonspecific adsorption to the tip is to be avoided in AFM imaging to ensure minimal disturbance of the sample, it is often desirable and sufficient in AFM force mode as long as the adsorption is strong enough to withstand the applied force. The yield of single biopolymers properly suspended between the two surfaces for force measurements may have to be further increased by careful sorting of the obtained force-extension curves and/or biochemical protocols that minimize incomplete assembly or nonspecific binding.
Implementation and general considerations
AFM imaging
The bending of the flexible cantilever in the AFM imaging mode generates a surface contour map representing the morphology of the molecules. The surface density of single molecules, as well as their surface contour map and changes thereof over time are directly available from such AFM images66. Consequently, conformational changes due to ligand binding or complex formation can be detected67. Due to their often random surface binding, the shape of identical molecules in AFM images may vary notably from one another as well as from their solution structure so that proper controls and a shape classification scheme may be necessary. If desired, additional SM properties can be measured or manipulated using related techniques such as scanning electrochemical microscopy68 and scanning tunneling microscopy69.
Force measurement
OT are arguably the most sensitive SM tool for linear force and motion measurements. They can exert forces ranging from 0.1 to 300 pN with high time resolution (down to 100 μs). Dual-trap dumbbell OT have the lowest mechanical noise that can be further reduced by passing the trapping laser beam through a gas of low refraction index such as helium. Ångstrom-level displacements can thus be measured in real-time over long timescales from min to h and at time resolutions as high as ms12,70. MT are most suitable for measuring slow molecular processes that require both force and torque12,71. MT do not suffer from the sample heating and photodamage observed with OT, however, they have limited spatial resolution (down to only 10 nm compared to 0.1 nm with OT) and are unable to provide full three-dimensional manipulation. The applied linear forces can range from 0.05–20 pN, with a torque of up to ~1,000 pN/nm, depending on the properties and dimensions of the paramagnetic bead attached to the biopolymer12. The measurement of rotations and torque generation in biology with MT can be impeded by the rather large torque exerted by this method. AFM in the force spectroscopy mode can affect large forces, in the range of 10–10,000 pN, combined with large biopolymer extensions of 1–10,000 nm12. This wide range of forces makes AFM suitable for probing ligand-receptor interactions as well as covalent bond strengths72. However, the high stiffness of the cantilever (10–105 pN.nm−1) results in a lower bound on the applied force and a force resolution limit of ~10 pN.
CHOOSING THE RIGHT TOOL
How does one choose a suitable technique from the bulging SM toolbox? Given the substantial effort that goes into developing an assay to answer the biological question(s) at hand, careful consideration needs to be given to the possible choices and their individual scope and limitations. Figure 4 shows a flow chart to aid in making an initial choice. Further refinement requires a consideration of scope and limitations in the context of the desired observable(s) as well as examples of successful applications.
Figure 4.

Flowchart to initially select a suitable single molecule technique for a given biological problem. Green ellipsoids, red parallelograms, and yellow rectangles represent start/end points, decisions and observables/action items, respectively.
Target observable: Molecule count (concentration)
Scope and limitations
SM assays can detect minute sample amounts and typically work at low (nM and below) target concentrations, a feature that becomes critical when it is challenging or impractical to produce the larger quantities needed for ensemble experiments. The ability to precisely count the number of molecules present is one of the most immediate benefits of all SM tools except for those focusing on mechanical properties (Fig. 4).
The advantage of imaging and counting single molecules by AFM is the fact that it works label-free since imaging is based on the physical interaction of a scanning stethoscopic tip with the sample. However, the target molecules need to be bound to a flat mica or glass surface, and it may be necessary to increase their molecular weight by attachment to a larger feature or handle, if they are otherwise too small (< ~14 kDa) to be visualized (Fig. 4)73. In addition to the surface density of molecules, basic information on their shape at nm resolution is readily obtained from the AFM image66.
If at least one suitable intrinsic or extrinsic fluorophore is available (Fig. 4), SM fluorescence tools allow one to detect the number of target molecules both in vitro and in living cells. Recent reviews have dealt with strategies for extrinsic fluorescent probe attachment74,75. Once that is accomplished, the most straightforward approach to detecting a target molecule is to let it diffuse through a confocal laser excitation volume and detect the resulting photon burst. The concentration of the target and its diffusion coefficient and thus size can be measured, provided the focal volume is calibrated, by single burst, photon counting histogram (PCH) or autocorrelation analysis in FCS16,44,76,77. Surface constrained fluorophore-labeled molecules – where constraints may be imposed through direct surface attachment or containment within a living cell (membrane) – can be counted in images obtained by LCM, epi-fluorescence, HILO, TIRFM, and NSOM (Fig. 4). Epi-fluorescence and HILO microscopy illuminate target molecules throughout an imaged cell, while TIRFM can only image close to the cell surface. Epi-fluoresence microscopy can lead to limited detection sensitivity due to background signal from out-of-focus planes. In TIRFM, this limitation is overcome by only illuminating molecules within the evanescent field. In all cases where fluorophores are used care has to be taken not to underestimate the number of molecules present due to photobleaching or transitioning into temporary dark states (blinking), or to overestimate them due to the presence of unbound probe. Using statistical models to account for such artifacts, components in aggregates or subunits in complexes can be counted as the number of photobleaching steps to zero signal78,79. Overcoming such limitations, a recently described label-free optical detection scheme for single molecules in vitro uses a sophisticated surface-functionalized whispering-gallery silica microcavity to capture a target molecules, resulting in a resonant wavelength shift80. Microfluidic sample handling and particle trapping methods have the potential to count small numbers of molecules in large volumes81. While future developments are likely to provide more label-free tools for the detection of single molecules, fluorescence offers additional observables that are outlined in the following and are less likely to be replaced anytime soon.
Target observable: Dynamic intramolecular distances
Scope and limitations in biopolymer folding and conformational dynamics
The determination of intramolecular distances using FRET between a donor-acceptor fluorophore pair has found widespread applications in structural biology to characterize the multidimensional conformational landscape and dynamics of biopolymers12,13,16,82. As a through-space interaction between two dipoles (the transition dipole moments of the two fluorophores), the efficiency of energy transfer falls off with a 1/(1+(R/R0)6) dependence on the inter-dye distance R. The characteristic Förster distance R0 ranges between 30–80 Å for most fluorophore pairs, making FRET a suitable biomolecular ruler at the low-nanometer scale23. As further discussed in the accompanying review by Roy and Ha19, the SM version of FRET is able to quantitatively dissect the temporal sequence of events in folding transitions, including the adoption of rare and transient intermediates that may exist under either equilibrium or non-equilibrium conditions, which is rarely possible in ensemble-averaging techniques.
SM FRET measurements are performed on site-specifically doubly-labeled proteins or nucleic acids that either are freely diffusing or are immobilized on carefully passivated glass/quartz surfaces (Fig. 4). Absolute distances are difficult to calibrate83, so that typically relative distance changes or differences are measured with a resolution of down to a few Ångstrom19. Importantly, opposite changes in donor and/or acceptor signal resolve biopolymer dynamics to an extent that is influenced by the finite averaging window of the time gated observation84. A fast detector such as an APD in the single-point measurements of LCM or FCS is therefore optimal for observing conformational changes at the sub-ms and possibly ns timescale, whereas a slower area detector such as a CCD camera can observe more molecules in parallel and rapidly build reliable single molecule statistics at ms time resolution. Processes slower than the detector resolution give rise to separate FRET histogram distributions, while faster processes lead to FRET signal averaging into a single distribution.
Fluorescence microscopy using single-pair FRET on surface-constrained or □trapped target molecules allows for the observation of structural dynamics over long periods of time. Time lapse experiments with intermittent excitation can preserve fluorophores in principle over many hours before they photobleach. Control experiments need to be performed to ensure that the doubly-labeling and immobilization of the target molecule has negligible effect on its biological properties. While FRET is sensitive over a distance range of ~2–8 nm, photoinduced electron transfer (PET) reactions between an excited fluorophore and a redox-matched electron donor or acceptor can probe distances on the scale of a few Ångstrom. This was demonstrated in the reversible electron transfer between flavin and a tyrosine residue in the catalytic core of a single flavin enzyme molecule, where a 1 Å distance change manifests in a several-fold change in flavin fluorescence lifetime and intensity85. A number of non-electron or □energy transfer techniques have started to address slightly longer length scales (10–100 nm) that are not yet the domain of electron microscopy, among them the optical superresolution techniques described in Box 1, as well as the plasmon coupling of pairs of gold nanoparticles86. Besides detecting internal motions, SM FRET is also sensitive to changes in the rotational conformation as demonstrated by experiments on the ATP-dependent dynamics of F1-ATPase87.
Scope and limitations in enzymology
An enzyme’s turnover rate often depends on conformational fluctuations. Conversely, conformational changes often accompany and facilitate enzymatic turnover. In these cases, SM tools allow one to quantitatively dissect an enzymatic mechanism by monitoring the dwell times of diverse conformational states as defined by their FRET levels and/or dwell time constants13,88.
SM enzymology where the enzyme is surface immobilized and the substrate is diffusing, or vice versa, may be carried out using either LCM, epi-fluorescence or TIRFM microscopy. The temporal resolution of LCM is bound in the lower limit by the time needed to detect a single photon and in the higher limit by the diffusion time of the sample molecule in the detection region, which can be expanded by (partial) sample immobilization. Epi-fluorescence or TIRFM can provide higher throughput from observing a large number of molecules simultaneously.
Among successful examples for SM enzymology are the experiments carried out on the small hairpin ribozyme, one of the simplest catalytic RNAs, to determine the multistep enzymatic reaction pathway13. SM probing in combination with mechanistic modeling89, direct measurement of the dwell times associated with catalytic events90, and kinetic fingerprinting by FRET91 were all used to uncover the constituent elementary steps in the catalytic reaction. The challenges associated with these approaches naturally increase with the complexity of the enzymatic mechanism13.
Doubly-labeling proteins site-specifically for SM FRET is often difficult due to the limited number of labeling chemistries; complementary genetically encoded fluorophores of satisfactory photophysical properties for SM detection are only slowly emerging74,75. The problem is simplified for nucleic acid binding motor proteins if the nucleic acid can be labeled, as has led, for example, to the dissection of the mechanism of an RNA polymerase and a DNA helicase by confocal92 and TIR fluorescence microscopy93, respectively. Most naturally occurring intrinsic fluorophores do not have sufficient quantum efficiency and/or photostability for current SM detection tools. An exception is the enzyme cofactor flavin adenine dinucleotide (FAD) that has allowed Xie and coworkers to observe the conformational dynamics of single cholesterol oxidase molecules by monitoring the emission from the enzyme’s fluorescent active site FAD94. In a separate approach, a fluorogenic or fluorescent substrate may be employed such that enzymatic action changes or localizes the fluorescence to a detectable extent29,95–97. If multiple turnover is involved in the latter approach, successive products may have to be photobleached96 or otherwise kept from saturating the detector29. SM enzymology without the need for fluorophores but instead using force spectroscopy can be pursued if the substrate is a biopolymer such as a long DNA molecule whose length or helical twist is affected by the enzymatic reaction12,98.
Scope and limitations from heterogeneity
Since their inception94,99,100, SM tools have often revealed heterogeneous behavior within a population of molecules, termed dynamic or static disorder (or memory), depending on the exchange rate between behaviors. A single enzyme molecule, for example, often exhibits large fluctuations of its folding and/or turnover rate constant at a broad range of time scales (from ms to many hours88,96,101). Such heterogeneity, which may or may not have biological relevance, is best delineated using SM techniques, but makes the acquisition and sorting of large data sets a necessity to ensure statistical significance of the conclusions. One approach to increase the data richness of an SM FRET experiment is to use three-color alternating-laser excitation, which allows for the simultaneous determination of three intramolecular distances102.
Target Observable: Intermolecular distance
Scope and limitations
Self-assembly of macromolecular complexes is a process of fundamental importance in biology as well as much of modern nanotechnology. Most SM tools that are suitable to measure intramolecular distances can also be applied to obtain intermolecular distances within complexes, and again offer the advantage over ensemble techniques to quantitatively resolve the temporal sequence of even rare and/or short-lived events.
Successful applications of SM tools to complex assemblies include studies of the signaling pathway involving the calcium-binding protein calmodulin (CaM) by SM FRET and fluorescence polarization using confocal microscopy103. Moreover, the assembly of fluorophore labeled tRNAs on immobilized ribosomes has been studied using FRET-based TIRFM to dissect the ribosomal translation cycle95. In these cases, doubly-labeling for FRET is facilitated since the interaction partners only need to be site-specifically labeled with one fluorophore each. Directed self-assembly, such as the hybridization of a complementary strand to an RNA molecule, can also be exploited for the site-specific attachment of fluorophores in cases where the assembly itself is not of interest104,105. A careful choice of the labeling pattern usually depends on the system of interest. For example, attaching the donor to a DNA-binding protein in solution and the acceptor to its surface immobilized DNA partner facilitates TIRFM detection of their interaction as a transition from negligible fluorescence signal to high FRET.
A “holy grail” in biology is the quantification of molecular interactions in living cells, ideally at the single molecule level, a challenge that only recently has started to be met. Dual-color FCCS detects two spectrally distinguishable, (ideally) non-interacting fluorophores within living cells in separate channels and cross-correlates their signals in real-time. FCCS therefore has been utilized to detect, for example, intracellular protein-protein and DNA-protein interactions without the need to measure actual distances44,106. TIRFM107 and spinning-disc confocal imaging43 have been employed to detect the association of membrane bound proteins in live and fixed cells, respectively, by SM FRET. However, fluorophore labeling and rapid cellular diffusion are still the limiting factors for SM studies of interaction partners in living cells43. A recent approach has taken advantage of the slowed diffusion of a fluorescent-protein labeled transcription factor when bound to its (large) DNA target, as wide-field imaging with a long CCD integration time leads to localization enhancement of bound and severe blurring of unbound transcription factor108. Conversely, stroboscopic imaging can be used to virtually suppress diffusion of intracellular single molecules109. Recently, ultrahigh-resolution imaging techniques have provided independent access to the relative positioning, and thus information on the association, of interacting biopolymers.
Target observable: Ultrahigh-resolution molecule localization
Scope and limitation in biological imaging
An ultimate goal of the biosciences is arguably to detect the dynamic positioning (and functional state) of each single molecule in a biological specimen15. SM imaging techniques such as FIONA are now capable of tracking biopolymers labeled with single organic dye fluorophores in vitro at low-nanometer precision and 1–500 ms time resolution14,38. In living cells the resolution may be slightly lower, but SM imaging holds the promise to reveal biological processes in situ and in real-time to reach a true systems-level understanding.
SM imaging resolution improves with the photon count, which can be enhanced by using longer detector integration times or brighter emitters such as quantum dots or nanoparticle scatterers. Quantum dots, for example, can be tracked in the sub-ms time range, even in vivo, but are often plagued by low labeling efficiency, large size and non-uniform shape, non-uniform excitation and emission characteristics, and blinking38,39. Using two-color FIONA, or SHREC, a better than 10-nm distance between static fluorophores can be determined, and the tens tens-of-nanometer steps of mobile motor proteins followed in real-time38,39. SHREC uses the same setup as SM FRET and hence can be applied in conjunction. Using SHRImP or NALMS analysis of sequential photobleaching events on static samples (Table 1), 10-nm distances between multiple identical fluorophores attached to a single target molecule (or complex) can be measured38,39. SHRIMP/NALMS allows for the localization of overlapping PSFs with similar spectral emission (i.e., from identical fluorophores), but becomes more difficult and noisy with increasing photobleaching steps. Since the analysis starts from the last photobleaching event, complete bleaching is necessary for the analysis, limiting the analysis to non-moving targets. Excitation intensities for any of these methods can be as low as a few mW/cm2, reducing photodamage in living cell samples. An application of these high-resolution imaging tools to nanotechnology has also been suggested110.
Stochastic imaging techniques are rapidly evolving. STORM gives very high resolution images (20–30 nm in the lateral and 50–60 nm in the axial dimension111) due to the ability to collect a large number of photons from each molecule, but is currently limited to fixed samples since a reducing agent is required. By comparison, PALM and F-PALM are well suited to living samples because they use fluorescent proteins, but current fixation methods may make them less suitable for fixed samples due to possible perturbation of fluorescent activity. Conventional PALM permanently bleaches each molecule after imaging so each one is only counted once, whereas STORM, F-PALM, and PALMIRA (PALM with independently running acquisition112) work by repeated activation and inactivation of probe subsets that may overlap with one another. PALMIRA thereby achieves ~100-fold faster collection times compared to PALM, and in combination with its single excitation laser requirement for activation and readout of the probes, results in lower background noise without the need for TIRF imaging and thin samples112. Two-color PALMIRA has successfully been used to image a intracellular microtubule network of whole fixed cells at image acquisition times of 40–60 seconds and position precisions of 10–15 nm, showing that two-color imaging and protein colocalization in cells is possible with precision on the macromolecular scale113. The stochastic imaging technique combining single particle tracking and PALM (sptPALM) has been utilized to image membrane proteins at 20 frames per second in living cells, mapping single molecule diffusion of up to thousands of molecules in the plasma membrane, and creating a spatially resolved map of single molecule diffusion coefficients114.
An orthogonal approach to reaching ultrahigh resolution (often collectively referred to superresolution techniques) is to shape the PSF through the nonlinear effect that space-selective saturation has on emitter molecules surrounding the center of the excited region14,115. It is expected that in the future the resulting “hardware” based ultrahigh-resolution techniques, generalized under the acronym RESOLFT (Table 1 and Box 1), will be applied to a greater extent to single molecules. RESOLFT techniques such as STED (Table 1 and Box 1) can image dynamical processes with ~20 nm resolution, even at two colors116,117. The combination of STED with 4Pi microscopy (Table 1 and Box 1) is expected to further improve resolution in the axial dimension, and parallelization with multiple foci will allow larger areas to be examined faster115. Suitable combinations of both “hardware“ and “software” based techniques may be envisioned to ultimately yield real-time measurements of the dynamic locations and nanoscale distances of large ensembles of single molecules, with broad applications in complex mixtures including living cells.
Target observable: (Un)folding of biopolymers
Scope and limitations
SM force manipulation and measurement techniques have been recognized as uniquely effective tools for characterizing the forces and motions that biopolymers can affect or withstand12,18. The reconstruction of folding free energy landscapes of biopolymers is one focus of SM force spectroscopy12,18. Inter- and intramolecular interactions such as the unfolding of proteins and nucleic acids, the dissociation of molecular complexes, and even the breaking of single chemical bonds can be induced and characterized through external mechanical force. The application of force along a specific (un)folding direction enforces a defined reaction pathway and can be related to the reversible work (free energy) done, even under partially irreversible conditions, by repeatedly performing both folding and unfolding reactions and applying the Crooks fluctuation theorem to the observed work distributions118.
Available tools include OT, MT, AFM, and flow-extension TPM (Fig. 2 and Table 1), which can measure conformational changes on length scales both larger and smaller than FRET. In addition, they can be applied when labeling with fluorophores is challenging or not feasible. Force is transduced through a biopolymer-tethered dielectric or magnetic bead in the case of OT, MT, and TPM, or through the AFM tip. Tight specific attachment of the biopolymer to its force transducer and suppression of non-specific binding are important requirements for force spectroscopy.
AFM is often used to unfold proteins with tandem repeats, which can either be naturally occurring (as in the case of the muscle protein titin) or artificially introduced, leading to a characteristic zig-zag pattern that effectively multiplexes the observation and facilitates identification of properly attached biopolymer chains119. In addition, by chemical modification of the AFM tip various specific and nonspecific biological interactions can be directly probed72.
Target observable: Mechanochemical force generation
Scope and limitations of OT and MT
The generation of force at the molecular level by coupling movement with NTP hydrolysis is essential for a number of biological processes, including the transport of cellular cargo via molecular motors and the enzymatic action of polymerases and helicases. The detailed characterization of kinesins120,121 and myosins122 by OT based force spectroscopy to determine step size, stall force, and processivity highlight the breadth of the unique information obtained.
Since long DNA can be readily attached to beads, force spectroscopy has also been extensively applied to mechanochemical processes involving nucleic acid binding proteins. For example, OT assays have identified the bacteriophage Γ29 portal motor as one of the strongest biological motors with a stall-force of nearly 60 pN during packaging of viral DNA into the capsid123. A particularly challenging biological question that OT probing has been able to address is that of the mechanism by which enzymes such as RNA polymerase couple their chemical and mechanical cycles12,70. Furthermore, the incorporation of rotational control into OT or MT has begun to address the question of how biomolecular motors including F1F0 ATP synthase, topoisomerases, and polymerases generate torque17.
Scope and limitations of TPM
Prominent applications of TPM have arisen from the single molecule observation of motor enzymes that shorten or lengthen a tether over time61,62. In a variation of TPM, rotatory motions can be visualized through attachment of a bead124 or actin filament87, although it is difficult to calibrate the drag forces exerted by the latter. TPM is a rather passive technique in that it relies on the Brownian motion of a microscopic bead at the end of an invisible single molecule tether. Artifacts from the presence of multiple tethers can be minimized by using sufficiently small biopolymer:bead ratios and by sorting out beads with asymmetric radial position distributions. Additional challenges arise from spurious tethering and can only be avoided by careful controls and systematic comparisons of samples60.
FUTURE TOOLS
The technical advances made by SM tools over the past two decades have been staggering. Consequently, whole new fields of biological inquiry have opened up, bringing to life Feynman’s vision from half a century ago1. One remaining limitation of SM tools is the fact that they typically access only a limited number of observables at a time, making an understanding of complex biological processes tedious since many assays have to be developed. The future of SM microscopy will thus increasingly see applications that combine tools, for example, to measure and exert mechanical forces while monitoring in real-time the structural response by SM fluorescence12,17 (Box 2). Such combinations will be synergistic since optical tweezers, for example, do not reveal precisely where in a macromolecular complex a force is exerted, while single molecule fluorescence is a passive technique since it cannot favor and probe a specific reaction coordinate. Pioneering efforts in this direction are still sparse125–128 and may need commercialization of instrumentation to reach mainstream biology.
BOX 2. NEW DEVELOPMENTS INVOLVING SM FORCE MICROSCOPY.
Multi-dimensional reaction landscapes are necessary to describe most biological processes, making it unlikely that a one-dimensional reaction coordinate can fully delineate them. Manipulating multiple interacting molecules in parallel and monitoring multiple observables in one molecule are among the emerging concepts involving force based SM techniques.
A Quad-trap instrument can be generated by first splitting a laser beam into two orthogonally polarized beams, one of which is used to form a continuous trap while the other beam is timeshared over three trap positions using acousto-optic deflectors. The continuous trap is monitored by back-focal-plane interferometry whereas the other three are used to manipulate trapped biopolymers such as two entangled DNA molecules129. Alternatively, holographic images can be used to generate up to 200 optical traps that can be positioned in three dimensions130.
Many molecular machines in cells not only generate linear but also rotatory force. Measuring torque using OT can be achieved by using magneto-optical tweezers134 or by introducing a small “rotor” bead to the biomolecule17. An asymmetric shape or birefringent properties of the trapped particle induces torque upon changing the angular momentum of the trapping light64. Hybrid methods can allow the simultaneous measurements of force and torque or force and displacement along multiple axes17.
Combinations of force with optical SM detection techniques have been realized in a number of ways. One example is the merger of AFM with fluorescence SM microscopy. For combining AFM imaging with confocal microscopy, an infrared light source (850 nm) can be used to detect the position of the cantilever, which minimizes interference with optical detection. A tip assisted optics system with two scanners facilitates the positioning of the tip within the optical focus135. With an AFM-TIRFM combination, it is possible to mechanically manipulate a single molecule while monitoring its fluorescence136.
Hybrids of OT with SM fluorescence microscopy have recently started to emerge. The intense near-infrared trapping beam of OT poses as challenges that the much weaker fluorescence emission is overpowered and multiphoton photodamage occurs. To mitigate the problem, three basic solutions have been demonstrated. First, the simultaneous monitoring of mechanical and ligand-binding events in a single myosin molecule has been achieved by physically separating the locations of two trap beams and the TIRFM-generated evanescent field125. Second, the unzipping of single 15-base-pair DNA molecules has been induced using OT and simultaneously been observed using TIRFM by careful selection of fluorophores and optical filters126. Perhaps the most elegant approach is to interlace in time the OT and TIRFM laser beams to prevent the simultaneous exposure of fluorophores to both lasers127.
Another route to increased information content and experimental control in SM experiments can be expected from further improvements of individual SM tools. For example, optical tweezers can be multiplexed by controlling arrays of beads through splitting the trapping beam129 or through computer-generating holograms with arbitrary three-dimensional light patterns130 (Box 2). Similarly, SM fluorescence imaging can be multiplexed by the use of high-content screening approaches as currently employed at the ensemble level in drug discovery. Such approaches may eventually enable “single molecule systems biology”. The future of the biosciences is thus illuminated by single molecule microscopy, a field that is ready for more widespread utilization.
Acknowledgments
This work was supported in part by US National Institutes of Health grants GM062357, GM081025, GM037006, and NSF Chemical Bonding Center award 0533019.
References
- 1.Feynman RP. In: Miniaturization. Gilbert HD, editor. Reinhold Publishing Corporation; New York: 1961. pp. 282–296. Feynman’s now famous deliberations on the “plenty of room at the bottom” inspired several generations of scientists to seek to fill this room with nanometer-scale materials and techniques to study them. [Google Scholar]
- 2.Binning G, Rohrer H, Gerber C, Weibel E. Surface Studies by Scanning Tunneling Microscopy. Phys Rev Lett. 1982;49:57–61. [Google Scholar]
- 3.Binning G, Quate CF, Gerber C. Atomic Force Microscope. Phys Rev Lett. 1986;56:930–933. doi: 10.1103/PhysRevLett.56.930. The authors demonstrate the concept of atomic force microscopy by the combination of a scanning tunneling microscope and a stylus profilometer that is able to investigate surfaces of insulators on an atomic scale. [DOI] [PubMed] [Google Scholar]
- 4.Pohl DW, Denk W, Lanz M. Optical Stethoscopy - Image Recording with Resolution Lambda/20. Appl Phys Lett. 1984;44:651–653. [Google Scholar]
- 5.Moerner WE, Kador L. Optical-Detection and Spectroscopy of Single Molecules in a Solid. Phys Rev Lett. 1989;62:2535–2538. doi: 10.1103/PhysRevLett.62.2535. The authors report the first optical absorption spectrum from a single molecule of pentacene in a p-terphenyl crystal at the temperature of liquid helium. [DOI] [PubMed] [Google Scholar]
- 6.Orrit M, Bernard J. Single Pentacene Molecules Detected by Fluorescence Excitation in a Para-Terphenyl Crystal. Phys Rev Lett. 1990;65:2716–2719. doi: 10.1103/PhysRevLett.65.2716. The authors report the first fluorescence detection of single pentacene molecules in a p-terphenyl crystal at low temperature. [DOI] [PubMed] [Google Scholar]
- 7.Moerner WE. A dozen years of single-molecule spectroscopy in physics, chemistry, and biophysics. J Phys Chem B. 2002;106:910–927. [Google Scholar]
- 8.Orrit M. Single-molecule spectroscopy: The road ahead. J Chem Phys. 2002;117:10938–10946. [Google Scholar]
- 9.Shera EB, Seitzinger NK, Davis LM, Keller RA, Soper SA. Detection of Single Fluorescent Molecules. Chem Phys Lett. 1990;174:553–557. The authors demonstrate for the first time single molecule fluorescence detection in solution at room temperature. [Google Scholar]
- 10.Dickson RM, Norris DJ, Tzeng YL, Moerner WE. Three-dimensional imaging of single molecules solvated in pores of poly(acrylamide) gels. Science. 1996;274:966–969. doi: 10.1126/science.274.5289.966. [DOI] [PubMed] [Google Scholar]
- 11.Funatsu T, Harada Y, Tokunaga M, Saito K, Yanagida T. Imaging of Single Fluorescent Molecules and Individual Atp Turnovers by Single Myosin Molecules in Aqueous-Solution. Nature. 1995;374:555–559. doi: 10.1038/374555a0. The authors refine epi-fluorescence and total internal reflection microscopy to achieve video-rate imaging of single molecules in aqueous solution. [DOI] [PubMed] [Google Scholar]
- 12.Greenleaf WJ, Woodside MT, Block SM. High-resolution, single-molecule measurements of biomolecular motion. Annu Rev Biophys Biomol Struct. 2007;36:171–190. doi: 10.1146/annurev.biophys.36.101106.101451. [DOI] [PMC free article] [PubMed] [Google Scholar]
- 13.Ditzler MA, Aleman EA, Rueda D, Walter NG. Focus on function: single molecule RNA enzymology. Biopolymers. 2007;87:302–316. doi: 10.1002/bip.20819. [DOI] [PubMed] [Google Scholar]
- 14.Moerner WE. New directions in single-molecule imaging and analysis. Proc Natl Acad Sci USA. 2007;104:12596–12602. doi: 10.1073/pnas.0610081104. [DOI] [PMC free article] [PubMed] [Google Scholar]
- 15.Walter NG, et al. Under the microscope: Single molecule symposium at the University of Michigan, 2006. Biopolymers. 2007;85:106–114. doi: 10.1002/bip.20621. [DOI] [PubMed] [Google Scholar]
- 16.Selvin PR, Ha T, editors. Single-Molecule Techniques - A Laboratory Manual. Cold Spring Harbor Laboratory; Cold Spring Harbor, NY: 2008. [Google Scholar]
- 17.Moffit JR, Chemla YR, Smith SB, Bustamante C. Recent advances in optical tweezers. Annu Rev Biochem. 2008 doi: 10.1146/annurev.biochem.77.043007.090225. in press. [DOI] [PubMed] [Google Scholar]
- 18.Neuman K. Force spectroscopy and single molecule manipulation techniques. Nat Methods. 2008 ibid. [Google Scholar]
- 19.Roy R, Hohng S, Ha T. A Practical Guide to Single Molecule FRET. Nat Methods. 2008 doi: 10.1038/nmeth.1208. ibid. [DOI] [PMC free article] [PubMed] [Google Scholar]
- 20.Harris TD, et al. Single-molecule DNA sequencing of a viral genome. Science. 2008;320:106–109. doi: 10.1126/science.1150427. [DOI] [PubMed] [Google Scholar]
- 21.Michalet X, Weiss S. Single-molecule spectroscopy and microscopy. Compt Rend Phys. 2002;3:619–644. [Google Scholar]
- 22.Moerner WE, Fromm DP. Methods of single-molecule fluorescence spectroscopy and microscopy. Rev Sci Instr. 2003;74:3597–3619. [Google Scholar]
- 23.Lakowicz JR. Principles of Fluorescence Spectroscopy. 3. Springer; New York: 2006. [Google Scholar]
- 24.Yang W, Gelles J, Musser SM. Imaging of single-molecule translocation through nuclear pore complexes. Proc Natl Acad Sci USA. 2004;101:12887–12892. doi: 10.1073/pnas.0403675101. [DOI] [PMC free article] [PubMed] [Google Scholar]
- 25.Tokunaga M, Imamoto N, Sakata-Sogawa K. Highly inclined thin illumination enables clear single-molecule imaging in cells. Nat Methods. 2008;5:159–161. doi: 10.1038/nmeth1171. [DOI] [PubMed] [Google Scholar]
- 26.Conchello JA, Lichtman JW. Optical sectioning microscopy. Nat Methods. 2005;2:920–931. doi: 10.1038/nmeth815. [DOI] [PubMed] [Google Scholar]
- 27.Kim HD, et al. Mg2+-dependent conformational change of RNA studied by fluorescence correlation and FRET on immobilized single molecules. Proc Natl Acad Sci USA. 2002;99:4284–4289. doi: 10.1073/pnas.032077799. [DOI] [PMC free article] [PubMed] [Google Scholar]
- 28.Axelrod D. Total internal reflection fluorescence microscopy in cell biology. Methods Enzymol. 2003;361:1–33. doi: 10.1016/s0076-6879(03)61003-7. [DOI] [PubMed] [Google Scholar]
- 29.Levene MJ, et al. Zero-mode waveguides for single-molecule analysis at high concentrations. Science. 2003;299:682–686. doi: 10.1126/science.1079700. [DOI] [PubMed] [Google Scholar]
- 30.Korlach J, et al. Selective aluminum passivation for targeted immobilization of single DNA polymerase molecules in zero-mode waveguide nanostructures. Proc Natl Acad Sci USA. 2008 doi: 10.1073/pnas.0710982105. [DOI] [PMC free article] [PubMed] [Google Scholar]
- 31.Gorris HH, Blicharz TM, Walt DR. Optical-fiber bundles. FEBS J. 2007;274:5462–5470. doi: 10.1111/j.1742-4658.2007.06078.x. [DOI] [PubMed] [Google Scholar]
- 32.Mannion JT, Craighead HG. Nanofluidic structures for single biomolecule fluorescent detection. Biopolymers. 2007;85:131–143. doi: 10.1002/bip.20629. [DOI] [PubMed] [Google Scholar]
- 33.Brewer LR, Bianco PR. Multi-channel, laminar flow cells for single molecule studies of DNA-protein interactions. Nat Methods. 2008 doi: 10.1038/nmeth.1217. ibid. [DOI] [PMC free article] [PubMed] [Google Scholar]
- 34.Eggeling C, Fries JR, Brand L, Gunther R, Seidel CA. Monitoring conformational dynamics of a single molecule by selective fluorescence spectroscopy. Proc Natl Acad Sci USA. 1998;95:1556–1561. doi: 10.1073/pnas.95.4.1556. [DOI] [PMC free article] [PubMed] [Google Scholar]
- 35.Lee TH, et al. Measuring the folding transition time of single RNA molecules. Biophys J. 2007;92:3275–3283. doi: 10.1529/biophysj.106.094623. [DOI] [PMC free article] [PubMed] [Google Scholar]
- 36.Thompson RE, Larson DR, Webb WW. Precise nanometer localization analysis for individual fluorescent probes. Biophys J. 2002;82:2775–2783. doi: 10.1016/S0006-3495(02)75618-X. [DOI] [PMC free article] [PubMed] [Google Scholar]
- 37.Yildiz A, et al. Myosin V walks hand-over-hand: Single fluorophore imaging with 1.5-nm localization. Science. 2003;300:2061–2065. doi: 10.1126/science.1084398. The authors demonstrate that single fluorophore tracking can be refined to nanometer resolution in dynamic biological samples. [DOI] [PubMed] [Google Scholar]
- 38.Toprak E, Selvin PR. New fluorescent tools for watching nanometer-scale conformational changes of single molecules. Ann Rev Biophys Biomol Struct. 2007;36:349–369. doi: 10.1146/annurev.biophys.36.040306.132700. [DOI] [PubMed] [Google Scholar]
- 39.Park H, Toprak E, Selvin PR. Single-molecule fluorescence to study molecular motors. Quart Rev Biophys. 2007;40:87–111. doi: 10.1017/S0033583507004611. [DOI] [PubMed] [Google Scholar]
- 40.Walter NG. Structural dynamics of catalytic RNA highlighted by fluorescence resonance energy transfer. Methods. 2001;25:19–30. doi: 10.1006/meth.2001.1212. [DOI] [PubMed] [Google Scholar]
- 41.Kapanidis AN, Weiss S. Fluorescent probes and bioconjugation chemistries for single-molecule fluorescence analysis of biomolecules. J Chem Phys. 2002;117:10953–10964. [Google Scholar]
- 42.Rasnik I, Mckinney SA, Ha T. Surfaces and orientations: Much to FRET about? Acc Chem Res. 2005;38:542–548. doi: 10.1021/ar040138c. [DOI] [PubMed] [Google Scholar]
- 43.Yin J, et al. Single-cell FRET imaging of transferrin receptor trafficking dynamics by Sfp-catalyzed, site-specific protein labeling. Chem Biol. 2005;12:999–1006. doi: 10.1016/j.chembiol.2005.07.006. [DOI] [PMC free article] [PubMed] [Google Scholar]
- 44.Haustein E, Schwille P. Fluorescence correlation spectroscopy: novel variations of an established technique. Annu Rev Biophys Biomol Struct. 2007;36:151–169. doi: 10.1146/annurev.biophys.36.040306.132612. [DOI] [PubMed] [Google Scholar]
- 45.Van Orden A, Jung J. Fluorescence correlation spectroscopy for probing the kinetics and mechanisms of DNA hairpin formation. Biopolymers. 2008;89:1–16. doi: 10.1002/bip.20826. [DOI] [PubMed] [Google Scholar]
- 46.Michalet X, Weiss S. Using photon statistics to boost microscopy resolution. Proc Natl Acad Sci USA. 2006;103:4797–4798. doi: 10.1073/pnas.0600808103. [DOI] [PMC free article] [PubMed] [Google Scholar]
- 47.Geerts H, et al. Nanovid Tracking - a New Automatic Method for the Study of Mobility in Living Cells Based on Colloidal Gold and Video Microscopy. Biophys J. 1987;52:775–782. doi: 10.1016/S0006-3495(87)83271-X. [DOI] [PMC free article] [PubMed] [Google Scholar]
- 48.Gelles J, Schnapp BJ, Sheetz MP. Tracking Kinesin-Driven Movements with Nanometre-Scale Precision. Nature. 1988;331:450–453. doi: 10.1038/331450a0. The authors demonstrate the tracking of nanometer-scale motion in dynamic biological systems by attaching microscopic beads. [DOI] [PubMed] [Google Scholar]
- 49.Schafer DA, Gelles J, Sheetz MP, Landick R. Transcription by Single Molecules of RNA-Polymerase Observed by Light-Microscopy. Nature. 1991;352:444–448. doi: 10.1038/352444a0. [DOI] [PubMed] [Google Scholar]
- 50.Schmidt T, Schutz GJ, Baumgartner W, Gruber HJ, Schindler H. Imaging of single molecule diffusion. Proc Natl Acad Sci USA. 1996;93:2926–2929. doi: 10.1073/pnas.93.7.2926. [DOI] [PMC free article] [PubMed] [Google Scholar]
- 51.Ram S, Ward ES, Ober RJ. Beyond Rayleigh’s criterion: A resolution measure with application to single-molecule microscopy. Proc Natl Acad Sci USA. 2006;103:4457–4462. doi: 10.1073/pnas.0508047103. [DOI] [PMC free article] [PubMed] [Google Scholar]
- 52.Churchman LS, Okten Z, Rock RS, Dawson JF, Spudich JA. Single molecule high-resolution colocalization of Cy3 and Cy5 attached to macromolecules measures intramolecular distances through time. Proc Natl Acad Sci USA. 2005;102:1419–1423. doi: 10.1073/pnas.0409487102. [DOI] [PMC free article] [PubMed] [Google Scholar]
- 53.Gordon MP, Ha T, Selvin PR. Single-molecule high-resolution imaging with photobleaching. Proc Natl Acad Sci USA. 2004;101:6462–6465. doi: 10.1073/pnas.0401638101. [DOI] [PMC free article] [PubMed] [Google Scholar]
- 54.Qu XH, Wu D, Mets L, Scherer NF. Nanometer-localized multiple single-molecule fluorescence microscopy. Proc Natl Acad Sci USA. 2004;101:11298–11303. doi: 10.1073/pnas.0402155101. [DOI] [PMC free article] [PubMed] [Google Scholar]
- 55.Rust MJ, Bates M, Zhuang XW. Sub-diffraction-limit imaging by stochastic optical reconstruction microscopy (STORM) Nat Methods. 2006;3:793–795. doi: 10.1038/nmeth929. [DOI] [PMC free article] [PubMed] [Google Scholar]
- 56.Betzig E, et al. Imaging intracellular fluorescent proteins at nanometer resolution. Science. 2006;313:1642–1645. doi: 10.1126/science.1127344. The authors demonstrate that intracellular proteins can be imaged at nanometer spatial resolution by stochastic photoswitching. [DOI] [PubMed] [Google Scholar]
- 57.Hess ST, Girirajan TPK, Mason MD. Ultra-high resolution imaging by fluorescence photoactivation localization microscopy. Biophys J. 2006;91:4258–4272. doi: 10.1529/biophysj.106.091116. [DOI] [PMC free article] [PubMed] [Google Scholar]
- 58.Sharonov A, Hochstrasser RM. Wide-field subdiffraction imaging by accumulated binding of diffusing probes. Proc Natl Acad Sci USA. 2006;103:18911–18916. doi: 10.1073/pnas.0609643104. [DOI] [PMC free article] [PubMed] [Google Scholar]
- 59.Ashkin A. Acceleration and Trapping of Particles by Radiation Pressure. Phys Rev Lett. 1970;24:156. The author implements optical tweezers as a non-invasive manipulation technique. [Google Scholar]
- 60.Lambert MN, et al. Mg2+-Induced Compaction of Single RNA Molecules Monitored by Tethered Particle Microscopy. Biophys J. 2006;90:3672–3685. doi: 10.1529/biophysj.105.067793. [DOI] [PMC free article] [PubMed] [Google Scholar]
- 61.Schafer DA, Gelles J, Sheetz MP, Landick R. Transcription by single molecules of RNA polymerase observed by light microscopy. Nature. 1991;352:444–448. doi: 10.1038/352444a0. [DOI] [PubMed] [Google Scholar]
- 62.Dohoney KM, Gelles J. Chi-sequence recognition and DNA translocation by single RecBCD helicase/nuclease molecules. Nature. 2001;409:370–374. doi: 10.1038/35053124. [DOI] [PubMed] [Google Scholar]
- 63.van Oijen AM, et al. Single-molecule kinetics of lambda exonuclease reveal base dependence and dynamic disorder. Science. 2003;301:1235–1238. doi: 10.1126/science.1084387. [DOI] [PubMed] [Google Scholar]
- 64.La Porta A, Wang MD. Optical Torque Wrench: Angular Trapping, Rotation, and Torque Detection of Quartz Microparticles. Phys Rev Lett. 2004;92:190801. doi: 10.1103/PhysRevLett.92.190801. [DOI] [PubMed] [Google Scholar]
- 65.Deufel C, Forth S, Simmons CR, Dejgosha S, Wang MD. Nanofabricated quartz cylinders for angular trapping: DNA supercoiling torque detection. Nat Methods. 2007;4:223–225. doi: 10.1038/nmeth1013. [DOI] [PubMed] [Google Scholar]
- 66.Yang Y, Wang H, Erie DA. Quantitative characterization of biomolecular assemblies and interactions using atomic force microscopy. Methods. 2003;29:175–187. doi: 10.1016/s1046-2023(02)00308-0. [DOI] [PubMed] [Google Scholar]
- 67.Weber PC, Ohlendorf DH, Wendoloski JJ, Salemme FR. Structural Origins of High-Affinity Biotin Binding to Streptavidin. Science. 1989;243:85–88. doi: 10.1126/science.2911722. [DOI] [PubMed] [Google Scholar]
- 68.Fan FR, Bard AJ. Electrochemical Detection of Single Molecules. Science. 1995;267:871–874. doi: 10.1126/science.267.5199.871. [DOI] [PubMed] [Google Scholar]
- 69.Hla SW, Rieder KH. STM control of chemical reaction: single-molecule synthesis. Annu Rev Phys Chem. 2003;54:307–330. doi: 10.1146/annurev.physchem.54.011002.103852. [DOI] [PubMed] [Google Scholar]
- 70.Abbondanzieri EA, Greenleaf WJ, Shaevitz JW, Landick R, Block SM. Direct observation of base-pair stepping by RNA polymerase. Nature. 2005;438:460–465. doi: 10.1038/nature04268. The authors show that Ångstrom resolution can be obtained using ultrasensitive optical tweezers to observe single steps of RNA polymerase along a double-strand DNA template. [DOI] [PMC free article] [PubMed] [Google Scholar]
- 71.Charvin G, Strick TR, Bensimon D, Croquette V. Tracking topoisomerase activity at the single-molecule level. Annu Rev Biophys Biomol Struct. 2005;34:201–219. doi: 10.1146/annurev.biophys.34.040204.144433. [DOI] [PubMed] [Google Scholar]
- 72.Kedrov A, Janovjak H, Sapra KT, Muller DJ. Deciphering Molecular Interactions of Native Membrane Proteins by Single-Molecule Force Spectroscopy. Annu Rev Biophys Biomol Struct. 2007;36:233–260. doi: 10.1146/annurev.biophys.36.040306.132640. [DOI] [PubMed] [Google Scholar]
- 73.Ke Y, Lindsay S, Chang Y, Liu Y, Yan H. Self-assembled water-soluble nucleic acid probe tiles for label-free RNA hybridization assays. Science. 2008;319:180–183. doi: 10.1126/science.1150082. [DOI] [PubMed] [Google Scholar]
- 74.Michalet X, et al. The power and prospects of fluorescence microscopies and spectroscopies. Annu Rev Biophys Biomol Struct. 2003;32:161–182. doi: 10.1146/annurev.biophys.32.110601.142525. [DOI] [PubMed] [Google Scholar]
- 75.Tinnefeld P, Sauer M. Branching out of single-molecule fluorescence spectroscopy: challenges for chemistry and influence on biology. Angew Chem Int Ed Engl. 2005;44:2642–2671. doi: 10.1002/anie.200300647. [DOI] [PubMed] [Google Scholar]
- 76.Thompson NL, Lieto AM, Allen NW. Recent advances in fluorescence correlation spectroscopy. Curr Opin Struct Biol. 2002;12:634–641. doi: 10.1016/s0959-440x(02)00368-8. [DOI] [PubMed] [Google Scholar]
- 77.Elson EL. Quick tour of fluorescence correlation spectroscopy from its inception. J Biomed Opt. 2004;9:857–864. doi: 10.1117/1.1779234. [DOI] [PubMed] [Google Scholar]
- 78.Leake MC, et al. Stoichiometry and turnover in single, functioning membrane protein complexes. Nature. 2006;443:355–358. doi: 10.1038/nature05135. [DOI] [PubMed] [Google Scholar]
- 79.Shu D, Zhang H, Jin J, Guo P. Counting of six pRNAs of phi29 DNA-packaging motor with customized single-molecule dual-view system. EMBO J. 2007;26:527–537. doi: 10.1038/sj.emboj.7601506. [DOI] [PMC free article] [PubMed] [Google Scholar]
- 80.Armani AM, Kulkarni RP, Fraser SE, Flagan RC, Vahala KJ. Label-free, single-molecule detection with optical microcavities. Science. 2007;317:783–787. doi: 10.1126/science.1145002. [DOI] [PubMed] [Google Scholar]
- 81.Huang B, et al. Counting low-copy number proteins in a single cell. Science. 2007;315:81–84. doi: 10.1126/science.1133992. [DOI] [PubMed] [Google Scholar]
- 82.Zhuang X. Single-molecule RNA science. Annu Rev Biophys Biomol Struct. 2005;34:399–414. doi: 10.1146/annurev.biophys.34.040204.144641. [DOI] [PubMed] [Google Scholar]
- 83.Cosa G, et al. Secondary structure and secondary structure dynamics of DNA hairpins complexed with HIV-1 NC protein. Biophys J. 2004;87:2759–2767. doi: 10.1529/biophysj.104.043083. [DOI] [PMC free article] [PubMed] [Google Scholar]
- 84.Wang D, Geva E. Protein structure and dynamics from single-molecule fluorescence resonance energy transfer. J Phys Chem B. 2005;109:1626–1634. doi: 10.1021/jp0478864. [DOI] [PubMed] [Google Scholar]
- 85.Yang H, et al. Protein conformational dynamics probed by single-molecule electron transfer. Science. 2003:262–266. doi: 10.1126/science.1086911. [DOI] [PubMed] [Google Scholar]
- 86.Reinhard BM, Sheikholeslami S, Mastroianni A, Alivisatos AP, Liphardt J. Use of plasmon coupling to reveal the dynamics of DNA bending and cleavage by single EcoRV restriction enzymes. Proc Natl Acad Sci USA. 2007;104:2667–2672. doi: 10.1073/pnas.0607826104. [DOI] [PMC free article] [PubMed] [Google Scholar]
- 87.Noji H, Yasuda R, Yoshida M, Kinosita K. Direct observation of the rotation of F-1-ATPase. Nature. 1997;386:299–302. doi: 10.1038/386299a0. [DOI] [PubMed] [Google Scholar]
- 88.Zhuang XW, et al. Correlating structural dynamics and function in single ribozyme molecules. Science. 2002;296:1473–1476. doi: 10.1126/science.1069013. A detailed study of the hairpin ribozyme reveals profound molecular heterogeneities in single biomolecules that is largely lost in the ensemble average. [DOI] [PubMed] [Google Scholar]
- 89.Rueda D, et al. Single-molecule enzymology of RNA: essential functional groups impact catalysis from a distance. Proc Natl Acad Sci U S A. 2004;101:10066–10071. doi: 10.1073/pnas.0403575101. [DOI] [PMC free article] [PubMed] [Google Scholar]
- 90.Nahas MK, et al. Observation of internal cleavage and ligation reactions of a ribozyme. Nat Struct Mol Biol. 2004;11:1107–1113. doi: 10.1038/nsmb842. [DOI] [PubMed] [Google Scholar]
- 91.Liu S, Bokinsky G, Walter NG, Zhuang X. Dissecting the multistep reaction pathway of an RNA enzyme by single-molecule kinetic “fingerprinting”. Proc Natl Acad Sci USA. 2007;104:12634–12639. doi: 10.1073/pnas.0610597104. [DOI] [PMC free article] [PubMed] [Google Scholar]
- 92.Kapanidis AN, et al. Initial transcription by RNA polymerase proceeds through a DNA-scrunching mechanism. Science. 2006;314:1144–1147. doi: 10.1126/science.1131399. [DOI] [PMC free article] [PubMed] [Google Scholar]
- 93.Myong S, Rasnik I, Joo C, Lohman TM, Ha T. Repetitive shuttling of a motor protein on DNA. Nature. 2005;437:1321–1325. doi: 10.1038/nature04049. [DOI] [PubMed] [Google Scholar]
- 94.Lu HP, Xun L, Xie XS. Single molecule enzymatic dynamics. Science. 1998;282:1877–1882. doi: 10.1126/science.282.5395.1877. [DOI] [PubMed] [Google Scholar]
- 95.Blanchard SC, Gonzalez RL, Kim HD, Chu S, Puglisi J. D tRNA selection and kinetic proofreading in translation. Nat Struct Mol Biol. 2004;11:1008–1014. doi: 10.1038/nsmb831. [DOI] [PubMed] [Google Scholar]
- 96.English BP, et al. Ever-fluctuating single enzyme molecules: Michaelis-Menten equation revisited. Chem Biol. 2006;2:87–94. doi: 10.1038/nchembio759. [DOI] [PubMed] [Google Scholar]
- 97.Luo G, Wang M, Konigsberg WH, Xie XS. Single-molecule and ensemble fluorescence assays for a functionally important conformational change in T7 DNA polymerase. Proc Natl Acad Sci USA. 2007;104:12610–12615. doi: 10.1073/pnas.0700920104. [DOI] [PMC free article] [PubMed] [Google Scholar]
- 98.Bustamante C, Bryant Z, Smith S. B Ten years of tension: single-molecule DNA mechanics. 2003;421:423–427. doi: 10.1038/nature01405. [DOI] [PubMed] [Google Scholar]
- 99.Rotman B. Measurement of Activity of Single Molecules of Beta-D-Galactosidase. Proc Natl Acad Sci USA. 1961;47:1981–1991. doi: 10.1073/pnas.47.12.1981. [DOI] [PMC free article] [PubMed] [Google Scholar]
- 100.Xue QF, Yeung ES. Differences in the Chemical-Reactivity of Individual Molecules of an Enzyme. Nature. 1995;373:681–683. doi: 10.1038/373681a0. [DOI] [PubMed] [Google Scholar]
- 101.Laurence TA, Kong X, Jager M, Weiss S. Probing structural heterogeneities and fluctuations of nucleic acids and denatured proteins. Proc Natl Acad Sci USA. 2005;102:17348–17353. doi: 10.1073/pnas.0508584102. [DOI] [PMC free article] [PubMed] [Google Scholar]
- 102.Lee NK, Koh HR, Han KY, Kim SK. Folding of 8–17 deoxyribozyme studied by three-color alternating-laser excitation of single molecules. J Am Chem Soc. 2007;129:15526–15534. doi: 10.1021/ja0725145. [DOI] [PubMed] [Google Scholar]
- 103.Liu R, Hu D, Tan X, Lu HP. Revealing Two-State Protein-Protein Interactions of Calmodulin by Single-Molecule Spectroscopy. J Am Chem Soc. 2006;128:10034–10042. doi: 10.1021/ja057005m. [DOI] [PubMed] [Google Scholar]
- 104.Zhuang X, et al. A single-molecule study of RNA catalysis and folding. Science. 2000;288:2048–2051. doi: 10.1126/science.288.5473.2048. [DOI] [PubMed] [Google Scholar]
- 105.Dorywalska M, et al. Site-specific labeling of the ribosome for single-molecule spectroscopy. Nucleic Acids Res. 2005;33:182–189. doi: 10.1093/nar/gki151. [DOI] [PMC free article] [PubMed] [Google Scholar]
- 106.Bacia K, Kim SA, Schwille P. Fluorescence cross-correlation spectroscopy in living cells. Nat Methods. 2006;3:83–89. doi: 10.1038/nmeth822. [DOI] [PubMed] [Google Scholar]
- 107.Murakoshi H, et al. Single-molecule imaging analysis of Ras activation in living cells. Proc Natl Acad Sci USA. 2004;101:7317–7322. doi: 10.1073/pnas.0401354101. [DOI] [PMC free article] [PubMed] [Google Scholar]
- 108.Elf J, Li GW, Xie XS. Probing transcription factor dynamics at the single-molecule level in a living cell. Science. 2007;316:1191–1194. doi: 10.1126/science.1141967. [DOI] [PMC free article] [PubMed] [Google Scholar]
- 109.Xie XS, Yu J, Yang WY. Living cells as test tubes. Science. 2006;312:228–230. doi: 10.1126/science.1127566. [DOI] [PubMed] [Google Scholar]
- 110.Rueda D, Walter NG. Single molecule fluorescence control for nanotechnology. J Nanosci Nanotechnol. 2005;5:1990–2000. doi: 10.1166/jnn.2005.505. [DOI] [PubMed] [Google Scholar]
- 111.Huang B, Wang W, Bates M, Zhuang X. Three-dimensional super-resolution imaging by stochastic optical reconstruction microscopy. Science. 2008;319:810–813. doi: 10.1126/science.1153529. [DOI] [PMC free article] [PubMed] [Google Scholar]
- 112.Geisler C, et al. Resolution of lambda/10 in fluorescence microscopy using fast single molecule photo-switching. Appl Phys A. 2007;88:223–226. [Google Scholar]
- 113.Bock H, et al. Two-color far-field fluorescence nanoscopy based on photoswitchable emitters. Appl Phys B. 2007;88:161–165. [Google Scholar]
- 114.Manley S, et al. High-density mapping of single-molecule trajectories with photoactivated localization microscopy. Nat Methods. 2008;5:155–157. doi: 10.1038/nmeth.1176. [DOI] [PubMed] [Google Scholar]
- 115.Hell SW. Far-field optical nanoscopy. Science. 2007;316:1153–1158. doi: 10.1126/science.1137395. [DOI] [PubMed] [Google Scholar]
- 116.Donnert G, et al. Two-color far-field fluorescence nanoscopy. Biophys J. 2007;92:L67–69. doi: 10.1529/biophysj.107.104497. [DOI] [PMC free article] [PubMed] [Google Scholar]
- 117.Willig KI, Harke B, Medda R, Hell SW. STED microscopy with continuous wave beams. Nat Methods. 2007;4:915–918. doi: 10.1038/nmeth1108. [DOI] [PubMed] [Google Scholar]
- 118.Collin D, et al. Verification of the Crooks fluctuation theorem and recovery of RNA folding free energies. Nature. 2005;437:231–234. doi: 10.1038/nature04061. [DOI] [PMC free article] [PubMed] [Google Scholar]
- 119.Carrion-Vazquez M, Li H, Lu H, Marszalek PE, Oberhauser AF, Fernandez JM. The mechanical stability of ubiquitin is linkage dependent. Nat Struct Biol. 2003;10:674–676. doi: 10.1038/nsb965. [DOI] [PubMed] [Google Scholar]
- 120.Block SM, Goldstein LS, Schnapp BJ. Bead movement by single kinesin molecules studied with optical tweezers. Nature. 1990;348:348–352. doi: 10.1038/348348a0. [DOI] [PubMed] [Google Scholar]
- 121.Kuo SC, Sheetz MP. Force of single kinesin molecules measured with optical tweezers. Science. 1993;260:232–234. doi: 10.1126/science.8469975. [DOI] [PubMed] [Google Scholar]
- 122.Nishizaka T, Miyata H, Yoshikawa H, Ishiwata S, Kinosita K., Jr Unbinding force of a single motor molecule of muscle measured using optical tweezers. Nature. 1995;377:251–254. doi: 10.1038/377251a0. [DOI] [PubMed] [Google Scholar]
- 123.Smith DE, et al. The bacteriophage straight phi29 portal motor can package DNA against a large internal force. Nature. 2001;413:748–752. doi: 10.1038/35099581. [DOI] [PubMed] [Google Scholar]
- 124.Sowa Y, Rowe AD, Leake MC, Yakushi T, Homma M, et al. Direct observation of steps in rotation of the bacterial flagellar motor. Nature. 2005;437:916–919. doi: 10.1038/nature04003. [DOI] [PubMed] [Google Scholar]
- 125.Ishijima A, et al. Simultaneous observation of individual ATPase and mechanical events by a single myosin molecule during interaction with actin. Cell. 1998;92:161–171. doi: 10.1016/s0092-8674(00)80911-3. The authors demonstrate that a combination of single molecule fluorescence microscopy with optical tweezers is possible. [DOI] [PubMed] [Google Scholar]
- 126.Lang MJ, Fordyce PM, Engh AM, Neuman KC, Block SM. Simultaneous, coincident optical trapping and single-molecule fluorescence. Nat Methods. 2004;1:133–139. doi: 10.1038/nmeth714. [DOI] [PMC free article] [PubMed] [Google Scholar]
- 127.Brau RR, Tarsa PB, Ferrer JM, Lee P, Lang MJ. Interlaced optical force-fluorescence measurements for single molecule biophysics. Biophys J. 2006;91:1069–1077. doi: 10.1529/biophysj.106.082602. [DOI] [PMC free article] [PubMed] [Google Scholar]
- 128.Hohng S, Zhou R, Nahas MK, Yu J, Schulten K, Lilley DMJ, Ha T. Fluorescence-force spectroscopy maps two-dimensional reaction landscape of the Holliday junction. Science. 2007;318:279–283. doi: 10.1126/science.1146113. [DOI] [PMC free article] [PubMed] [Google Scholar]
- 129.Noom MC, van den Broek B, van Mameren J, Wuite GJ. Visualizing single DNA-bound proteins using DNA as a scanning probe. Nat Methods. 2007;4:1031–1036. doi: 10.1038/nmeth1126. [DOI] [PubMed] [Google Scholar]
- 130.Grier DG, Roichman Y. Holographic optical trapping. Appl Opt. 2006;45:880–887. doi: 10.1364/ao.45.000880. [DOI] [PubMed] [Google Scholar]
- 131.Hell SW, Wichmann J. Breaking the Diffraction Resolution Limit by Stimulated-Emission - Stimulated-Emission-Depletion Fluorescence Microscopy. Optics Lett. 1994;19:780–782. doi: 10.1364/ol.19.000780. The authors present the concept of stimulated emission depletion (STED) fluorescence microscopy to break Abbe’s diffraction limit. [DOI] [PubMed] [Google Scholar]
- 132.Heintzmann R, Jovin TM, Cremer C. Saturated patterned excitation microscopy - a concept for optical resolution improvement. J Opt Soc Amer. 2002;19:1599–1609. doi: 10.1364/josaa.19.001599. [DOI] [PubMed] [Google Scholar]
- 133.Gustafsson MGL. Nonlinear structured-illumination microscopy: Wide-field fluorescence imaging with theoretically unlimited resolution. Proc Natl Acad Sci USA. 2005;102:13081–13086. doi: 10.1073/pnas.0406877102. [DOI] [PMC free article] [PubMed] [Google Scholar]
- 134.Crut A, Koster DA, Seidel R, Wiggins CH, Dekker NH. Fast dynamics of supercoiled DNA revealed by single-molecule experiments. Proc Natl Acad Sci USA. 2007;104:11957–11962. doi: 10.1073/pnas.0700333104. [DOI] [PMC free article] [PubMed] [Google Scholar]
- 135.Owen RJ, Heyes CD, Knebel D, Rocker C, Nienhaus GU. An integrated instrumental setup for the combination of atomic force microscopy with optical spectroscopy. Biopolymers. 2006;82:410–414. doi: 10.1002/bip.20414. [DOI] [PubMed] [Google Scholar]
- 136.Hugel T, et al. Single-molecule optomechanical cycle. Science. 2002;296:1103–1106. doi: 10.1126/science.1069856. [DOI] [PubMed] [Google Scholar]
- 137.Kask P, Palo K, Ullmann D, Gall K. Fluorescence-intensity distribution analysis and its application in biomolecular detection technology. Proc Natl Acad Sci USA. 1999;96:13756–13761. doi: 10.1073/pnas.96.24.13756. [DOI] [PMC free article] [PubMed] [Google Scholar]
- 138.Cox IJ, Sheppard CJR, Wilson T. Super-Resolution by Confocal Fluorescent Microscopy. Optik. 1982;60:391–396. [Google Scholar]
- 139.Edidin M. Near-field scanning optical microscopy, a siren call to biology. Traffic. 2001;2:797–803. doi: 10.1034/j.1600-0854.2001.21108.x. [DOI] [PubMed] [Google Scholar]
- 140.Chen Y, Muller JD, So PTC, Gratton E. The photon counting histogram in fluorescence fluctuation spectroscopy. Biophys J. 1999;77:553–567. doi: 10.1016/S0006-3495(99)76912-2. [DOI] [PMC free article] [PubMed] [Google Scholar]