Abstract
ASAP family Arf GAPs induce the hydrolysis of GTP bound to the Ras superfamily protein Arf1, regulate cell adhesion and migration and have been implicated in carcinogenesis. The ASAP proteins have a core catalytic domain of PH, Arf GAP and Ank repeat domains. The PH domain is necessary for both biological and catalytic functions of ASAP1 and has been proposed to be integrally folded with the Arf GAP domain. Protection studies and analytical ultracentrifugation studies previously reported indicated that the domains are, at least partly, folded together. Here, using NMR spectroscopy and biochemical analysis, we have further tested this hypothesis and characterized the interdomain interaction. A comparison of NMR spectra of three recombinant proteins comprised of either the isolated PH domain of ASAP1, the Arf GAP and ankyrin repeat domain or all three domains indicated that the PH domain did interact with the Arf GAP and Ank repeat domains; however, we found a significant amount of dynamic independence between the PH and Arf GAP domains, consistent with the interactions being transient. In contrast, the Arf GAP and Ank repeat domains form a relatively rigid structure. The PH-Arf GAP domain interaction partially occluded the phosphoinositide binding site in the soluble protein, but binding studies indicated the PIP2 binding site was accessible in ASAP1 bound to a lipid bilayer surface. Phosphoinositide binding altered the conformation of the PH domain, but had little effect on the structure of the Arf GAP domain. Mutations in a loop of the PH domain that contacts the Arf GAP domain affected PIP2 binding and the Km and kcat for converting Arf1•GTP to Arf1•GDP. Based on these results, we generated a homology model of a composite PH/Arf GAP/Ank repeat domain structure. We propose that the PH domain contributes to Arf GAP activity by either binding to or positioning Arf1•GTP that is simultaneously bound to the Arf GAP domain.
Keywords: ADP-ribosylation factor, GTPase-activating protein, pleckstrin homology domain, Nuclear Magnetic Resonance spectrometry
Introduction
Arf GAPs are a family of proteins named for the enzymatic activity of inducing the hydrolysis of GTP bound to Arf family proteins [1-4]. There are 31 genes encoding proteins with Arf GAP catalytic domains in humans. Many are structurally complex and the family can be subdivided based on domain structure. Seven subtypes have been demonstrated to contain Arf GAP activity. In three subtypes, the Arf GAPs, SMAPs and Gits, the Arf GAP domain is at the extreme N-terminus of the protein. In four subtypes, the ASAPs, ACAPs, ARAPs and AGAPs, the Arf GAP domain is between a pleckstrin homology (PH) and Ank repeat domains. Each Arf GAP examined has a specific cellular localization associated with a specific cellular function or activity. Arf GAP-type proteins, for instance, are associated with the Golgi apparatus and are involved with intracellular protein transport and membrane traffic [5,6]. ASAP family proteins are associated with cellular adhesive structures and have been implicated in behaviors of malignant cells that mediate much of the morbidity associated with cancer [7 - 10].
Three genes encode proteins in the ASAP family [1,2]. They were named for the first identified member ASAP1 [11], which contains Arf GAP, SH3, Ankyrin repeat and PH domains. Each member has, from the N-terminus, a BAR, PH, Arf GAP, Ank repeat and proline rich domains. ASAP1 and ASAP2 also have an SH3 domain at the C-terminus. ASAP1 has tandem repeats of E/DLPPKP between the proline rich and SH3 domains. ASAP1 is encoded on chromosome 8q24.1 and has been implicated in carcinogenesis [10]. Amplification of the gene in uveal melanoma correlates with invasive behavior, and expression of recombinant ASAP1 in noninvasive uveal melanoma cells increases the rate at which the cells migrate. ASAP1 expression has also been reported to correlate with the invasive potential of mammary carcinoma cells [8]. ASAP1 associates with and is necessary for the formation of invasive structures called invadopodia in mammary carcinoma cells and podosomes in fibroblasts [8,9].
The Arf GAP activity is necessary for the function of ASAP1 [7,12,13]. Recent kinetic studies have found differences between the catalytic activity of ASAP1 and that of other Arf GAPs [14 -16]. One difference between ASAP1 and other Arf GAPs is the role of the PH domain in catalysis. A protein without the PH domain has 1/100,000th the activity of ASAP1 recombinant protein containing the PH domain [17]. The PH domain binds phosphatidyl 4,5 bisphosphate [18], but the requirement for the PH domain for catalytic activity was observed even in the absence of phospholipids [17]. These results are consistent with the ideas that the PH domain directly affects the catalytic domain or influences the formation of the Arf1•GTP•ASAP1 complex. We have proposed that the PH and Arf GAP domains form an integrally folded structure [17]; however, the structural basis by which the PH domain affects the catalytic domain is not understood. The PH domain is also important for function of ASAP1 in invadopodia (Jian, Bharti and Randazzo, unpublished) but, as for catalytic function, the molecular basis for the requirement is not known.
The PH domain is a structural motif found in approximately 250 proteins in humans, and it is the 10th most common protein fold [19 -22]. Of the 250 PH domains, about 10% specifically bind to phosphoinositides. On the basis of this activity, the PH domain has been proposed to mediate recruitment of proteins to membrane surfaces. The function of only a few of the 90% of PH domains that do not bind phosphoinositides is known [20,21]. Several PH domains have been found to bind proteins [23 - 26]. Among the group that does bind phosphoinositides, additional functions have been proposed. For instance, in Rho family protein exchange factors, PH domains occur immediately C-terminal to a dbl homology (DH) domain and, as determined through crystal structures of the substrate-enzyme complex, contribute to substrate binding [27,28].
Here, we report the results of experiments designed to define the role of the PH domain in Arf GAP catalysis by determining the structural interface and dynamics of association of the Arf GAP domain with the PH domain. NMR experiments were performed to compare 3 recombinant proteins: (i) the isolated PH domain of ASAP1; (ii) the Arf GAP and ankyrin repeats of ASAP1; and (iii) the PH, Arf GAP and ankyrin repeats. We found that the PH domain in the combined structure moved independently of the rest of the protein, consistent with a model that the three domains did not form one integrated structure. However, there was also evidence that the Arf GAP and ankyrin repeat domains influence lipid binding by the PH domain. We present a homology model that incorporates constraints determined by previously reported protection studies and the NMR spectral perturbations that we describe here.
Materials and Methods
Plasmids
A plasmid with an open reading frame encoding His10[325-724]ASAP1 in pET19b (called PZA in this paper) has been described [17]. [325-451]ASAP1 PH (called PH in this paper) was generated by amplifying reading frame encoding residues from 325 to 451 of ASAP1 and subcloned into the Nde I and Xho I site of pET19b. [441-724]ASAP1 ZA (called ZA in this paper) was constructed by amplifying a reading frame encoding residues from 441 to 724 of ASAP1 and subcloning into Nde I and Xho I site of pET21c.
Protein purification and buffers
All proteins were labeled with stable isotopes (15N, and or 13C, and or 2H) by expression in bacteria grown in Spectra 9 medium (Spectra Stable Isotopes, Columbia, MD). PZA and ZA were expressed and purified as described in [17]. PZA protein was dialyzed in buffers containing 20 mM TrisHCl (pH 8.0), 200 mM NaCl and 1 mM MgCl2; or phosphate buffered saline (pH 7.4) with 1 mM EDTA and 1 mM dithiothreitol (DTT); or 200 mM KPi (pH7.2), 1 mM EDTA and 1 mM DTT. For ZA, the protein was dialyzed in buffer containing either 20 mM TrisHCl (pH 8.0), 200 mM NaCl and 1 mM MgCl2; or 20 mM NaPi (pH 7.4) with 310 mM NaCl; or 200 mM KPi (pH 6.6), 1 mM EDTA and 1 mM DTT.
PH was expressed by the same method as for PZA and ZA. The pellet from 1 liter of bacteria expressing PH was lysed using a French Press in 20 mM TrisHCl (pH 8.0), 20 mM NaCl, Complete™ protease inhibitor cocktail (Roche) and 10 % glycerol. The lysate was clarified by centrifugation at 100,000 × g for one hour. The concentration of NaCl in the lysate was adjusted to 500 mM. The lysate was fractionated on a 1 ml HisTrap HP column (GE Healthcare Life Sciences) using an imidazole gradient from 20 mM to 600 mM in 20 mM Tris HCl (pH 8.0), 500 mM NaCl and 10 % glycerol. The fractions containing PH were further purified by gel filtration using a HiPrep 16/60 Sephacryl S-100 HR column (GE Healthcare Life Sciences) in the following buffers: (i) 20 mM TrisHCl (pH 8.0), 200 mM NaCl and 1 mM MgCl2; (ii) phosphate buffered saline (pH 7.4) with 1 mM EDTA and 1 mM DTT; (iii) 200 mM KPi (pH 7.2), 1 mM EDTA and 1mM DTT; (iv) 200 mM KPi (pH 6.6), 1 mM EDTA and 1 mM DTT; (v) 200 mM KPi (pH 5.5), 1 mM EDTA and 1 mM DTT.
Isothermal titration calorimetry
Stepwise titration calorimetry was done using a VP-ITC calorimeter (MicroCal, Northhampton, MA). The cell volume was 1.4 ml and the concentration of protein was 30 μM. The titration was done at 25° C with injections of 5 μl each of 3 mM IP3 for PZA or PH proteins in a buffer containing 20mM TrisHCl (pH 8.0), 200 mM NaCl and 1 mM MgCl2. Protein and IP3 solutions were degassed before each experiment. Heats of dilution were subtracted from raw data. The values for the stoichiometry of binding and thermodynamatic constants were determined using ORIGIN software package (MicroCal, Northhampton, MA).
Lipid binding assay
Sucrose-loaded large unilamellar vesicles (LUVs) were prepared and lipid binding was determined as described [29]. Phospholipids (40% phosphatidylcholine (PC), 25% phosphatidylethanolamine (PE), 15 % phosphatidylserine (PS), 10% cholesterol, with either 10 % phosphatidylinositol (PI); or 9 % PI and 1 % phosphatidylinositol 4,5-bisphosphate (PIP2); or 7.5 % PI and 2.5 % PIP2; or 5 % PI and 5 % PIP2; or 2.5 % PI and 7.5 % PIP2; or 0 % PI and 10 % PIP2) were dried under stream of nitrogen for 1 hour. The phospholipid film was further dried in vacuo for 1 hour and then hydrated in a buffer contained 20 mM Hepes, 20 mM KCl and 200 mM sucrose. Multilamellar vesicles were formed by 5 freeze-thawed cycles of the mixture. Lipids were then extruded through filters with pore sizes of 1.0 μm to form unilamellar vesicles. One μM of PZA or PH protein were incubated with LUVs at 30° C for 5 minutes in a buffer containing 25 mM Hepes pH 7.5, 100 mM NaCl, 2 mM MgCl2 and 1 mM EDTA. The sucrose-loaded LUVs were then precipitated by centrifugation at 100,000 × g for 15 minutes at 4°C. The proteins bound to the vesicles were separated on SDS-PAGE and visualized with Coomassie blue dye. The density of the protein bands were quantified by densitometry using Scion image.
NMR experiments
All 2D 15N HSQC spectra for chemical shift perturbation analysis of the PH, ZA and PZA constructs, and 3D 15N HSQC-NOESY (tmix 100 ms) [30] spectra for resonance assignment of the PH and ZA constructs were recorded on a Bruker 800MHz Avance spectrometer with triple-axis gradient probe. All CBCACONH and HNCACB [31] spectra for resonance assignment of the PH and ZA constructs were recorded on a Bruker 600MHz Avance spectrometer with triple-axis gradient cryoprobe. All NMR experiments were performed at 25°C. The 3D NMR experiments for resonance assignments for the PH domain were done at two pH values, 5.5 and 6.6, in 200 mM KPi. Resonance assignments for the ZA construct were done at pH 6.6 in 200 mM KPi. 2D 15N HSQC spectra for the chemical shift perturbation measurements were done at pH 8.0 in 20 mM Tris buffer with 200 mM NaCl, except for the comparison of mutant PZA constructs with wild type, which were done at pH 7.4 in phosphate buffered saline. All buffers were 95% H2O, 5% D2O with 1 mM EDTA and 1 mM DTT. Two alignment media for measuring residual dipolar couplings, PEG and 1,2-didodecanoyl-rac-glycerol-3-phosphocholine (DLPC)/CHAPSO (4.2:1 ratio, 5% and 7% w/v), were tested with the PZA construct. PZA was stable at 25°C in DLPC/CHAPSO but precipitated in the PEG solution. The DLPC/CHAPSO samples separated into aqueous and lipid phases after placement in the 800 MHz magnet in less than 1 hour, and produced poor spectra. No additional attempts to measure residual dipolar couplings were made. The NMR tubes for the PH and PZA samples were silanized using Sigmacote (Sigma-Aldrich) in order to reduce the rate of precipitation. The changes in amide shifts in the 1H-15N HSQC spectra were calculated using the combined chemical shift difference, Δδ(NH), with the equation Δδ(NH)=[ΔδH2 + (ΔδN/10)2]1/2 where ΔδH is the 1H chemical shift change and ΔδN is the 15N chemical shift change. The NMRPipe software package was used to process and analyze the NMR spectra [32].
Molecular Modeling
Homology models of the PH and ZA constructs were created using Prime of Maestro/MacroModel (Schrödinger, Inc. New York, NY), using the PDB structures 2DA0 and 1DCQ, respectively. Over 1300 potential poses of the PH/ZA complex were generated with EMAP of CHARMM using the grid-threading Monte Carlo (GTMC) method, [33] and filtered using the geometric criteria described in the Results. The linker region between PH and ZA domains was built for the filtered set of complexes using Prime. Dibutanoyl phosphatidylinositol 3,4,5-trisphosphate (PIP3 diC4) of the PDB structure 1WIG was placed by aligning the 1WIG PH domain with that in the ASAP1 PH/ZA complex, deleting the 1WIG PH domain and altering PIP3 diC4 to dibutanoyl phosphatidylinositol 4,5-bisphosphate (PIP2 diC4). All structures were minimized with MacroModel (PRCG 500 steps, OPLS 2005, implicit water, normal cutoffs).
Miscellaneous
All the lipids were obtained from Avanti Polar lipids (Alabaster, AL) including PC (chicken egg), PE (Bovine Liver), PS (Porcine Brain), PI (Bovine Liver), PIP2 (Porcine Brain) and cholesterol. IP3 (D-myo-Inositol 1,4,5-trisphosphate) was purchased from EMD Chemicals, Inc. (Gibbstown, NJ). Dibutanoyl-D-myo-phosphatidylinositol 4,5-bisphosphate (PIP2 diC4) was from Echelon Biosciences (Salt Lake City, UT). The concentrations of protein were estimated using the BioRad assay (BioRad, Hercules, CA). Arf GAP activity was determined using myrArf1•[α32P]GTP as a substrate as described [34-36]. MyrArf1 was prepared as described [15,37]. Saturation kinetics were performed using myrArf1•GTP as a substrate and following changes in tryptophan fluorescence in Arf that accompany the Arf1•GTP to Arf1•GDP transition as described [15,35].
Results
NMR assignments
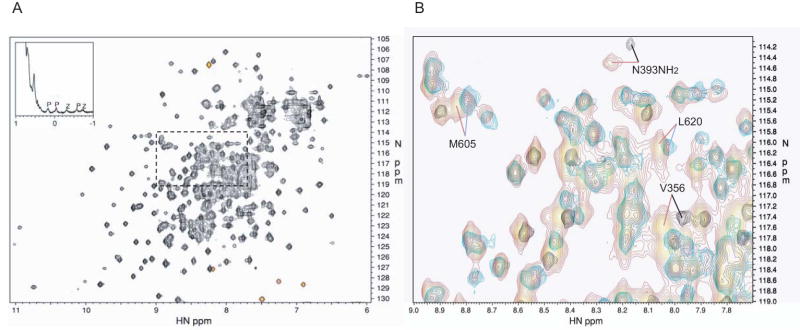
To test the hypothesis that the Arf GAP and PH domains of ASAP1 dynamically interact, we studied three recombinant proteins (Figure 1): one, called PZA, is comprised of the PH, Arf GAP and ankyrin repeat domains of mouse ASAP1 ([325-724]ASAP1); a second called ZA is comprised of the Arf GAP and ankyrin repeat domains ([441-724]ASAP1); the third is comprised of the PH domain ([325-451]ASAP1). The “Z” in the abbreviation stands for zinc binding motif, which comprises the Arf GAP catalytic domain. “P” is for PH domain and “A” is for ankyrin repeat. PZA and PH were fused at the N-terminus to a 10 histidine tag with a linker sequence. ZA was fused to a 6 histidine tag at the C-terminus. Backbone resonance assignments for PH and ZA were made at 25° C using the standard suite of 3D NMR experiments (see Methods). Assignments for the 13C/15N-labeled PH domain were done for two pH values, 5.5 and 6.6, and were 100% complete and 71% complete, respectively, for the 127 non-His-tag residues. In addition, all glutamine, asparagine and tryptophan side chain amides were also assigned. At pH 6.6 many of the backbone amide signals in the loops surrounding the phosphoinositide binding site were no longer observable. Unobservable loop resonances are not uncommon for PH domains, and they can be due to increased solvent exchange with increased pH, as well as conformational exchange of the loop backbone structures on the intermediate NMR timescale (100 ns-0.1 s) [38,39,40]. Because PZA becomes increasingly unstable below pH 7.2, backbone amide assignments of 2D 15N HSQC spectra of the PH domain were also made at pH 7.2 and 8.0 by analogy to the spectrum at pH 6.6. At pH 7.2 and 8.0, the backbone amide assignments were 69% complete, and the side chain amide assignments were 82% complete.
Figure 1. NMR spectrum of the PZA construct of ASAP1. A. 2D 15N HSQC spectrum.
The 2D 15N HSQC spectrum of 2H/15N labeled PZA is shown, with a region of the 1D spectrum of natural abundance PZA shown in the inset. The red signals are folded, with frequencies lying outside the 15N spectral width. The 1D spectrum shows the upfield methyl region. Methyl resonances belonging to the PH and ZA domains are indicated by P and Z, respectively. B. Overlay of spectra. Region expanded from A), indicated by the (dashed?) box, showing the overlay of the 15N HSQC spectrum of the full-length PZA construct (red) with those of the PH domain alone (black) and ZA construct (blue). Four chemical shift changes of particular interest are indicated. The backbone amide of V356 shows the largest change in the PH domain alone compared to the full-length PZA construct. The ZA construct residues M605 and L620 are too far from the domain N-terminus to make contact with the inter-domain linker, and so these chemical shift changes are evidence of contact between the ZA and PH domains. Many side chain amide signals also show significant differences; here, the change for one of the amide signals for the side chain of N393 in the PH domain is indicated.
Backbone resonance assignments for the 2H/13C/15N-labeled ZA construct were made at pH 6.6 for both N-terminal and C-terminal His-tag versions. The results were nearly identical, with 89% of the 284 non-His-tag residues assigned and only the final two C-terminal ZA residues differing substantially. Signals for the first twelve backbone amides at the N-terminus, corresponding to the linker region between PH and ZA domains, were not observed, though signals were seen for the Gln 442 and Asn 447 side chains in the linker region, and these both had signals typical for fully exposed side chains. Side chain glutamine, asparagine and tryptophan amides were 91% assigned. Amide assignments were made for the 2D 15N HSQC spectra of the ZA construct at pH 7.2 and 8.0, and the backbone and side chain amides were 88% and 91% assigned at both pH values.
Because of poor solubility and propensity to precipitate at 25° C, sufficient concentration of the PZA construct could not be achieved for the standard 3D NMR experiments, and only 2D 15N HSQC spectra of 2H/15N-labeled PZA were measured, at pH 7.2 and 8.0 and at concentrations ranging from 70 to 85 μM. Silanization of the NMR tubes slowed the rate of precipitation, but even with optimum solvent conditions, the majority of the PZA sample precipitated in a few hours at 25°C and more quickly at higher temperatures. No suitable alignment medium for measuring residual dipolar couplings was found (see Methods). Figure 1A shows the 15N HSQC spectrum of PZA at pH 8.0. Backbone and side chain amide assignments were made by analogy to the corresponding PH and ZA construct 15N HSQC spectra. Nearly all signals from both PH and ZA spectra were present, though eleven backbone and three side chain amide signals were no longer distinguishable due to overlap with stronger signals; 321 out of 399 non-His-tag backbone amides and 36 out of 45 side chain amides were assigned. Eight signals were observed that were not present in the PH and ZA spectra. These eight signals could correspond to backbone amides of the linker region between the PH and ZA domains.
Interdomain dynamics indicate transient domain association
A comparison of 1D NMR spectra of PZA with PH and ZA constructs indicated a significant degree of dynamic independence between the PH and ZA domains, that is, the two domains move relatively independently of one another. For example, in the 1D PZA spectrum the signals with chemical shifts less than 0.5 ppm appear as a superposition of the corresponding regions of the 1D PH and ZA spectra. Resonances with chemical shifts less than 0.5 ppm commonly arise from hydrophobic core methyl groups. If the two domains were folded together as one rigid unit, the peak heights should be comparable. However, the PH domain peaks are on average 1.8 times higher than those of the ZA domain (see Figure 1A inset). Peak height in a 1D NMR spectrum is inversely proportional to the transverse relaxation rate, which in turn is roughly proportional to molecular weight for rigid bodies. Thus the PH domain core appears to experience dynamics corresponding to an effective molecular weight almost a factor of two lower than the ZA domain. Excluding the linker and His-tag peptides, the molecular weights of the PH and ZA domains are 11 and 30 kDa. If the two domains were fully independent in the PZA construct, then the ratio of peak heights should be near 2.7 (30/11), so the observed ratio of 1.8 is consistent with some degree of interaction between domains. Comparison of the PH domain methyl peaks in the PH and PZA constructs confirms this result. The PH domain methyl peaks are 1.5 times broader (FWHM) in the PZA construct, 21 Hz compared to 32 Hz on average, while for a rigid PH/ZA complex an increase by a factor close to 3.7 would be expected based on molecular weight. The ZA methyl peaks show almost the same line widths for the ZA and PZA constructs, 53 Hz compared to 56 Hz on average, within the ±2 Hz error for the line width determination.
The dynamic motion between domains is also apparent in the 2D 15N HSQC spectrum of PZA. The short lifetime of the PZA sample made acquiring data necessary for a full longitudinal and transverse relaxation time analysis impractical. However, the peak heights in the 2D spectrum for the PH domain are significantly stronger than those of the ZA domain. As a representative subset, the PH and ZA backbone amide peaks were compared with 1H resonances in the range of 9 to 10 ppm; this region of the spectrum contains signals from only fully folded regions of the protein. The PH domain peaks were 2.0 times higher than the ZA domain peaks. In 2D spectra the relationship between relaxation rates and peaks heights is more complex than for 1D spectra; nevertheless, the stronger PH peaks are consistent with the interdomain dynamics deduced from the 1D NMR spectrum. While there is considerable variability in backbone amide signal intensity in the 2D spectra of the ZA construct, there is no overall qualitative difference between the ArfGAP and anykrin repeat regions, and the NMR data are consistent with these regions folding as one integral domain, as seen in the homologous PAPβ/ASAP2 structure solved by x-ray crystallography [41].
Chemical shift perturbations are consistent with loops of the PH domain near the PIP2 binding site associating with a catalytically critical surface of the Arf GAP domain
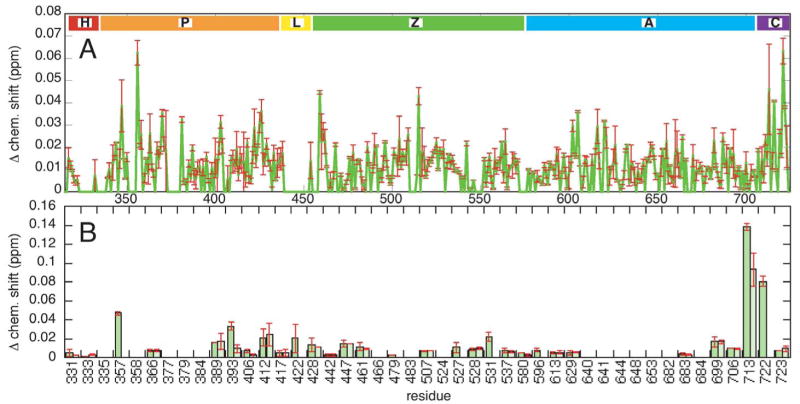
The backbone and side chain amide chemical shifts of the PH and ZA constructs were compared to the PZA construct chemical shifts in order to pinpoint potential interaction sites between the domains. To minimize differences due to buffer conditions, all three constructs were dialyzed together, and the measurements were done at pH 8.0 to reduce spurious effects due to changes in histidine protonation state due to small changes in pH; this is especially important upon addition of phosphatidylinositol compounds (next section). Two sets of 15N HSQC spectra at 25° C were acquired for two independently prepared sets of samples. Figure 1B shows an overlaid region of the PH, ZA and PZA spectra, highlighting several perturbations of interest, and Figure 2A shows a plot of the average perturbation in ppm between the PZA construct backbone amide resonances and those of the PH and ZA constructs, with the error bars showing the difference between the two measurements. Figure 2B shows the chemical shift perturbations for the side chain amides.
Figure 2. Chemical shift differences between PZA and the PH and ZA. A. Backbone amides.
Backbone amide chemical shift differences as a function of residue number with error bars resulting from two separate measurements. The residue regions indicated correspond to H: his tag, P: PH domain, L: linker region, Z: Arf GAP domain, A: ankyrin repeat domain, and C: c-terminal tail. B. Side chains amides. Side chain amide chemical shift differences with each side chain residue number indicated and with error bars as in A).
For the PH domain, the largest chemical shift perturbation occurred for Val 356 located at the beginning of the second beta strand. Smaller, though significant changes (>0.03 ppm) in the backbone amide resonances occur for Leu 347, Thr 370, Ala 381, Ile 403 and Leu 426 (see Figure 3A). All these except Leu 426 bracket loop regions that surround the phosphoinositide binding pocket of the PH domain, regions where backbone amide signals could not be detected (see white regions in Figure 3A). The side chain amide of Trp 357 was also significantly perturbed.
Figure 3. Significantly perturbed amides in the PH domain and ZA.
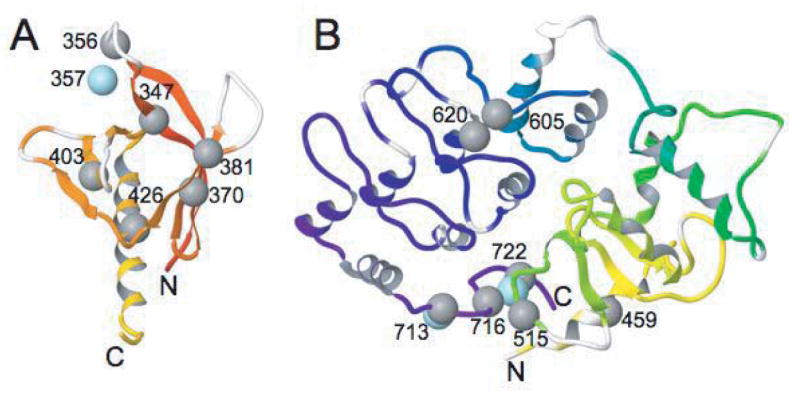
Significantly perturbed backbone amides due to PH/ZA domain interaction are shown as grey spheres and side chain amides by blue spheres, with residue numbers indicated. Unassigned backbone regions are white in the ribbon diagram. A. PH domain B. ZA
The largest backbone amide perturbations for the ZA domain occurred primarily near the N and C-termini, for example Asp 459 and Trp 722 (Figures 2 and 3B). The termini are physically close in the protein structure (<10 Å), so these perturbations might be due to the interdomain linker attached to the N-terminus. Another significantly perturbed residue spatially near the N-terminus is Gly 515 (10 Å); this region of the Arf GAP domain is important for substrate catalysis [15]. Slightly further and significantly perturbed are Val 716 (13 Å) and Asn 713 (17 Å). In fact, the side chain amide of Asn 713 shows the strongest perturbation of any ZA or PH domain resonance (0.14 ppm). Much further away are the significantly perturbed residues Met 605 (32 Å) and Leu 620 (28 Å) in the first ankyrin repeat. These residues are far from the N-terminus and unlikely to be contacted by the interdomain linker. It is possible that they are contacted by the PH domain, though other explanations, such as allosteric effects not due to direct contact or intermolecular interactions, cannot be ruled out.
Three single-point mutants in the PH domain of PZA, [K349Q]PZA, [T375H]PZA, and [N406H]PZA, were made to test whether the three loops surrounding the phosphoinositide binding site, whose signals could not be observed above pH 6.6, might play a role in specific interdomain interactions. The first of these, K349Q, serves as a control, since a previous study showed that this lysine was protected from biotinylation in PZA compared to the PH domain alone [17], implying that it might lie at the PH/ZA interface. The amide signal for Lys 349 is observable, and in the 15N HSQC spectrum of the K349Q mutant, large differences from the wild type corresponding to the signals for Gln 349 and its immediate neighbors were clearly apparent; however, the other two mutated residues had no observable signals in the spectra for the mutants, just as for wild type. In all three mutant spectra, small but significant changes could be seen for residues not directly neighboring the mutated residue, indicating additional small, non-local changes to the PH domain structure. Despite this, the signals for the ZA domain were nearly identical for the mutants compared to wild type, with no differences greater than 0.01ppm, i.e. indistinguishable from noise (data not shown). The previous Lys 349 protection result casts doubt on the simplest explanation, namely, that the two domains do not interact via the loops with the mutated residues. Another possibility is that the PH/ZA interactions are predominantly non-specific, and that perturbations due to the mutations are distributed across the non-specific interface and too diluted to detect. Non-specific interdomain interactions would be consistent with the observed interdomain dynamics.
IP3 and PIP2 diC4 affect predominantly the PH domain
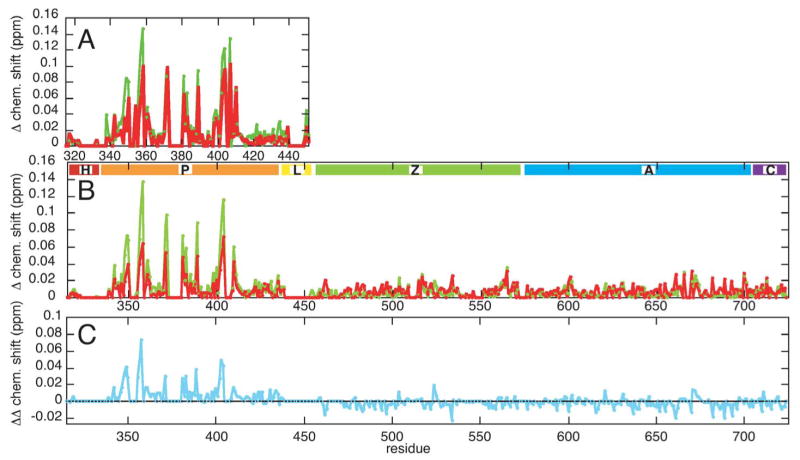
The Arf GAP activity of ASAP1 requires bound phosphotidylinositol 4,5-bisphosphate (PIP2) for full activation. 15N HQSC spectra of 2H/15N-labeled PZA and 15N-labeled PH and ZA constructs at 85 μM with two soluble PIP2 analogs at 650 μM were acquired at pH 8.0 for comparison. One analog, D-myo-inositol (1,4,5) tris-phosphate (IP3), corresponds to the PIP2 head group, and the other, dibutanoyl phosphotidylinositol (4,5)-bisphosphate (PIP2 diC4), also includes the glycerol and truncated, butanoyl versions of the two lipid tail groups. Figure 4 shows the backbone amide perturbations of PZA due to bound IP3 and PIP2 diC4, with the corresponding perturbations for PH domain alone shown for comparison. The interactions of IP3 and PIP2 diC4 with the ZA domain alone were negligible.
Figure 4. Effect of IP3 and PIP2 diC4 binding on spectra. A. PH domain B. PZA.
Chemical shift perturbations due to IP3 binding are shown in green and PIP2 diC4 binding in red. In (B) the residues regions are as in Figure 2. C. The difference in chemical shift perturbations due to IP3 and PIP2 diC4. The PIP2 diC4 perturbations were subtracted from those of IP3.
The largest PZA perturbations are seen for the PH domain, while the ZA domain portion of PZA shows only weak perturbations. For both the full PZA construct and the PH domain alone, the perturbations due to IP3 and PIP2 diC4 binding appear comparable, though for PIP2 diC4 the perturbations are smaller, especially for binding PZA. This might indicate weaker PIP2 diC4 binding, due to unfavorable interactions with the additional PIP2 diC4 components or perhaps reflecting the reduction in charge due to the phosphodiester linkage to the glycerol. A concentration dependence measurement of IP3 and PIP2 diC4 induced chemical shift changes would be necessary to demonstrate this conclusively. Accounting for the overall weaker perturbations due to PIP2 diC4, there seem to be specific differences in the pattern of perturbations due to IP3 versus PIP2 diC4 in the binding to the PH domain alone. For example, IP3 binding results in stronger perturbations around Lys 349, while PIP2 diC4 binding causes relatively stronger perturbations around Ile 371. These specific differences are not as apparent in the binding to PZA and could be due in part to noise in the data. Neither IP3 nor PIP2 diC4 binding led to any reappearance of signals from the PH domain loops surrounding the phosphoinositide binding site.
Differential inositide binding to PZA and PH indicates partial occlusion of the PIP2 binding site by ZA that is relieved by binding to a phospholipid bilayer
To test the influence of the ZA domain on the binding of PIP2 by the PH domain, isothermal titration calorimetry (ITC) was performed on IP3 binding to PZA and to the isolated PH domain. Figure 5 shows the ITC curves along with the integrated enthalpy as a function of IP3 concentration, corrected for heat of dilution of IP3. The fitted curves correspond to binding constants of 75 μM ± 15 μM for the isolated PH domain and 350 μM ± 50 μM for PZA. Note that we were unable to achieve saturation for PZA and, therefore, the standard error is relatively large; nevertheless it is clear that the binding of IP3 to PH domain alone is stronger than for binding to PZA. This suggests that interaction between the PH and ZA domains interferes with IP3 binding. If the PH/ZA interaction involves the loops surrounding the phosphoinositide binding site, as the NMR chemical shift perturbation measurements imply, then perhaps the binding site is occluded to some degree or its structure altered unfavorably by the ZA domain interaction.
Figure 5. IP3 binding to PZA and PH.
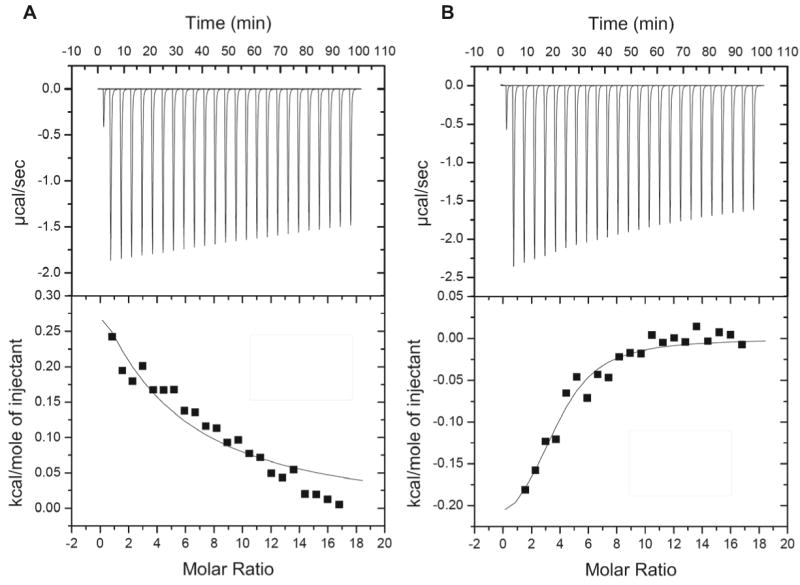
Isothermal calorimetry curves of IP3 binding. A. PZA. ITC curve for PZA domain as a function of concentration with the integrated enthalphy curve corrected for the heat of dilution of IP3 shown in the lower panel. B. Isolated PH domain. ITC curve for PH with the integrated enthalphy curve corrected for the heat of dilution of IP3 shown in the lower panel.
We also examined the PIP2 dependence of PH and PZA binding to large unilamellar vesicles (LUVs) (Figure 6). No difference between the proteins was detected. One interpretation of this result is that association with a lipid bilayer opens the structure, exposing the PIP2 binding site. In this case, mutating residues around the interface between the PH and Arf GAP domains might affect binding to and stimulation of GAP activity by PIP2. To test this prediction, we compared PH and PZA with changes in residues in a loop of the PH domain that contacts the Arf GAP domain ([H405D,N406D]PH and [H405D, N406D]PZA). The mutations in the PH domain had a smaller effect on PH than PZA binding to PIP2 containing LUVs (Figure 7A and B). In addition, the GAP activity of [H405D,N406D]PZA was less efficiently activated by PIP2 than for the wild type PZA (Figure 7C). In addition, the Km was increased and the kcat decreased resulting in proteins with 1/10th to 1/15th the catalytic power of the wild type PZA (Table 1). We also examined PZA with changes to residues predicted to directly interact with the inositide head group, [R360Q]PZA [15,17,18], which has been previously described, and [R407D]PZA. Both proteins had a lower affinity for PIP2 than PZA ([18] and Figure 7B) and both had an increased Km and decreased kcat for catalysis of Arf1•GTP to Arf1•GDP (Table 1).
Figure 6. PIP2 binding to PH and PZA.
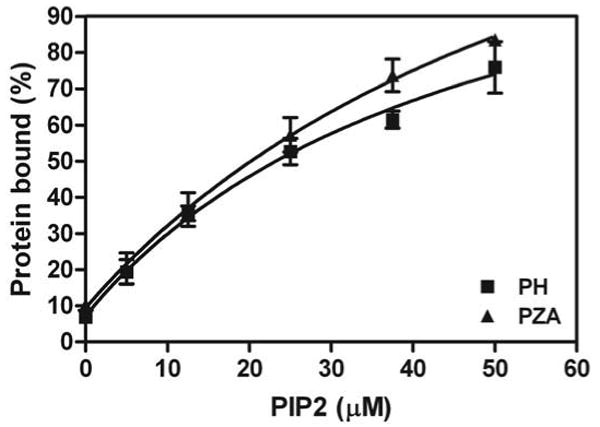
One μM PH and PZA were incubated with sucrose-filled large unilammelar vesicles. The total lipid concentration was 1 mM and the concentration of PIP2 is indicated. The vesicles were rapidly separated from the bulk solution by centrifugation and the fraction of protein precipitating with the vesicles was determined. The data are the average of three experiments ± SEM and are fit to a simple hyperbola.
Figure 7. Effect of mutating PH domain in region of interaction with Arf GAP domain on lipid dependent binding and GAP activity. A. Binding of isolated PH domain to LUVs.
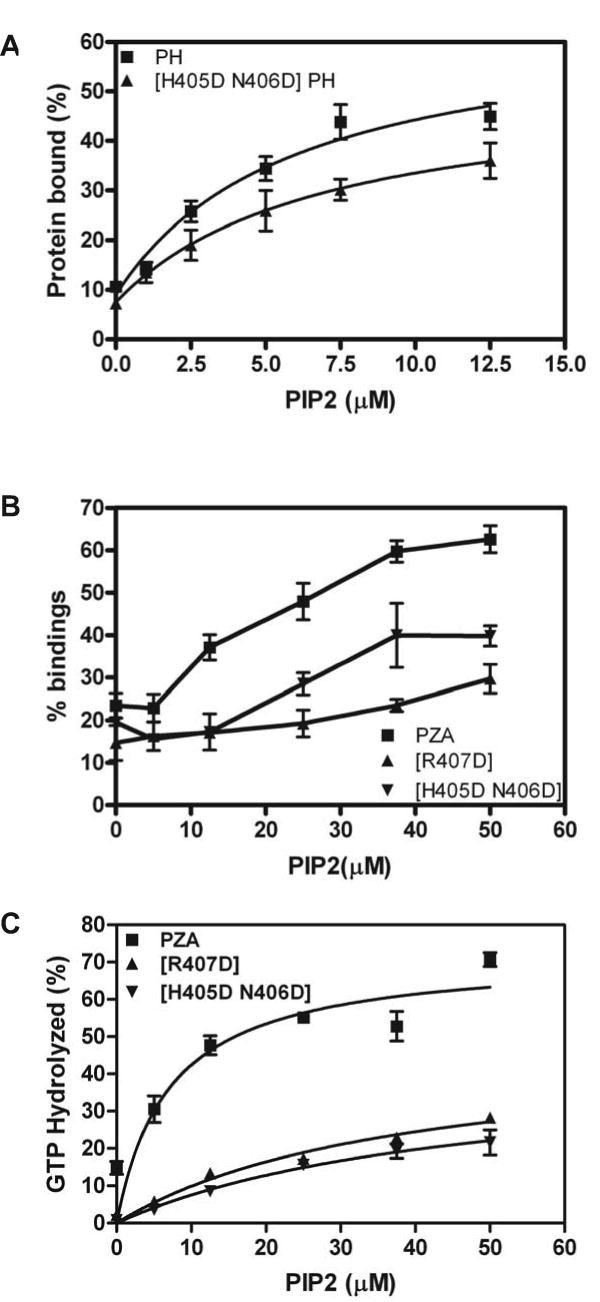
The binding of PH and [H405D, N406D]PH to LUVs containing the indicated concentrations of PIP2 was measured as described in Figure 6. The data are the mean ± SEM from three experiments. B. Binding of PZA to vesicles. The PIP2 dependence of [H405D, N406D]PZA and [R407D]PZA binding to large unilamellar vesicles was compared to that of PZA. C. PIP2 dependence of Arf GAP activity. GAP activity of PZA, [H405D, N406D]PZA and [R407D]PZA was determined as described in “Materials and Methods” in the presence of large unilamellar vesicles containing PIP2 at the indicated concentration in the reaction mixture.
Table 1. Kinetic parameters of PZA and mutants.
MyrArf1•GTP was titrated into reactions contain 0.4 nM of either [R407D]PZA or [H405D N406D]PZA and initial rates were determined as described in Luo et al. [15]. The Km and Vmax were estimated from a Michaelis-Menten plot and the kcat calculated from the Vmax. * data from Luo et al. [15].
| Protein | Km (μM) | kcat (/sec) |
|---|---|---|
| PZA* | 2.2±0.5 | 57.3±4.6 |
| [R360Q]* | 6.8±1.8 | 13.8±4.7 |
| [R407D] | 8.3±3.3 | 15.3±3.3 |
| [H405D N406D] | 9.7±3.6 | 15.9±3.4 |
Modeling PH and ZA Domain Interactions
To visualize the putative transient PH/ZA contacts involving the PH domain loops surrounding the phosphoinositide binding site, an ensemble of PH/ZA complexes was generated using the EMAP docking program of CHARMM [42]. Homology models were used in the visualization (see Methods), with the PH domain generated from the NMR structure for human ASAP1 (97% identity) (pdb 2DA0), and the ZA domain generated from the x-ray structure for Arf GAP domain and ankyrin repeats of PAPβ/ASAP2 (66% identity) (pdb 1DCQ, [41]). A set of over 1300 possible poses was generated and then scanned for complexes with termini separated by less than 40Å, the length of the linker if fully extended. The complexes also were further screened for those with at least one of the loops surrounding the phosphoinositide binding site (residues 349-357, 372-380 or 404-409) within 20Å of either Gly 515, Met 605, Leu 620, Asn 713, or Val 716, the non-termini residues of the ZA domain most strongly perturbed by the PH domain in the NMR spectra. An ensemble of twelve structures most compatible with the experimental results is shown in Figure 8A, and a representative member of the ensemble is shown in Figure 8B. PIP2 diC4 was incorporated into the structure shown in Figure 8B based on the PDK1 PH domain x-ray structure 1WIG [43]. The glycerol and butanoyl groups project out from the PIP2 binding pocket.
Figure 8. Model structure of the PH/ZA complex. A. Ensemble of possible PH domain locations compatible with the NMR results.
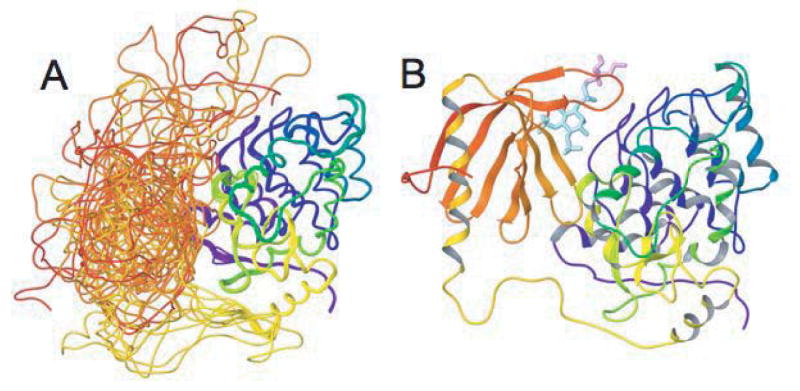
In this ribbon diagram the PH domain is red to orange, the linker region yellow, and the ZA domain yellow-green to blue. B. Representative member of the ensemble including bound PIP2 diC4. The region of PIP2 diC4 shown in blue corresponds to IP3, and the pink region shows the glycerol and butanoyl groups. The pink star indicates residue 406 in the PH domain.
In terms of interaction energies, it is not clear why the putative interface implied by the NMR results and earlier biotinylation protection study [17] is preferred. The PH domain has a charge of +7 and the ZA domain -8; however, the ZA surface on the opposite side of the putative interface has a much greater concentration of negatively charged surface residues. The putative ZA interaction interface has more exposed hydrophobic residues than the opposite side, so hydrophobic interactions could favor the putative interaction interface. However, there is an even more concentrated region of hydrophobic surface along the outer edge of the third and fourth ankyrin repeats, outside the region of the putative interaction. Both regions showing NMR perturbations, the first near Gly 515, Asn 713 and Val 716, and the second near Met 605 and Leu 620, correspond to shallow concave regions centered on narrow pockets at the interface between the Arf GAP and ankyrin repeat regions of the ZA domain (Figure 9). This suggests that surface shape complementarity could play a role in favoring the putative interaction interface, perhaps with insertion of particular PH domain loop side chains into the pockets, though any interaction would be transient to be consistent with the observed interdomain dynamics.
Figure 9. Surface of the PH domain interaction region of the ZA domain.
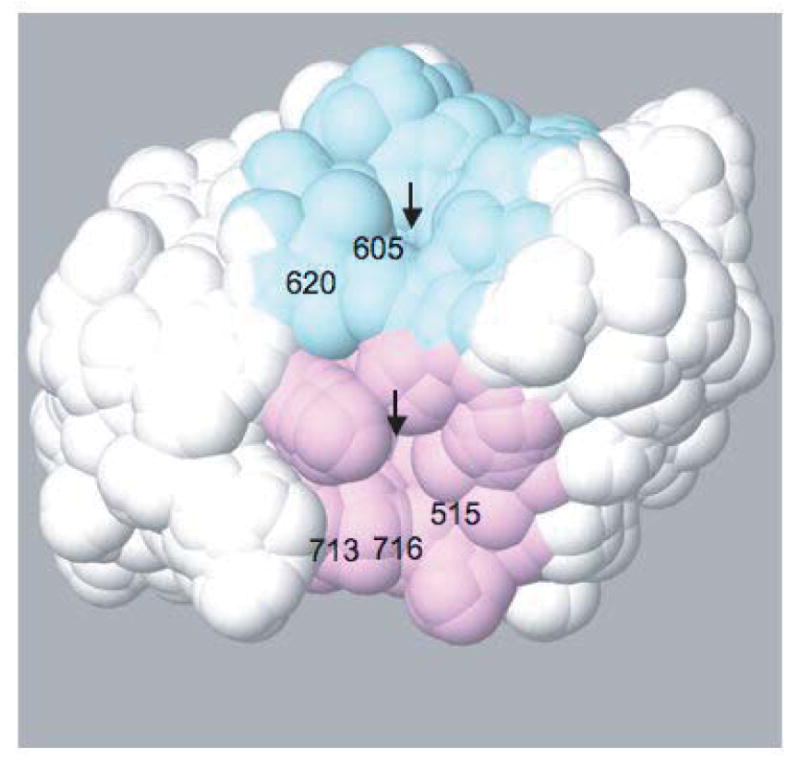
The two concave regions near the sites of largest chemical shift perturbations, with residue numbers indicated, are shown in pink and blue. The arrows indicate the narrow pockets at the center of each region. The angle of view in this figure is similar to that of Figure 3B.
Discussion
The PH domain of ASAP1 is critical for function of the Arf GAP catalytic domain. Previous studies have led to the proposal that the PH domain is integrally folded with the Arf GAP domain and structural changes in the PH domain can be transmitted to the Arf GAP domain. Using NMR spectroscopy and biochemical studies we have begun to determine the structural basis for the functional interaction between the PH and Arf GAP domains. The results refute the previous proposal but are consistent with a model in which the PH domain borders the catalytically active surface of the Arf GAP domain where it interacts with the substrate Arf1•GTP, optimally aligning it for catalysis of GTP hydrolysis.
We propose a model in which the PH domain does have a role in catalysis but is not integrally folded with the Arf GAP/ankyrin repeat domains. A comparison of the spectra of PH, ZA and PZA indicated that the PH domain interacted with the other two domains through an ensemble of transient contacts with partial occlusion of the PIP2 binding site on the PH domain. However, there was a significant degree of dynamic independence indicating that the domains are not integrally folded. The effect of phosphoinositide analogs on the NMR spectra further supported the idea that the domains were not integrally folded. The binding of IP3 or PIP2 diC4 significantly perturbed a large fraction of the PH domain amide signals, both for binding to the PH domain alone and to PZA (Figure 4). Tryptophan fluorescence of the PH domain is also altered upon binding PIP2 diC4 [17]. Both results are consistent with structural changes in the PH domain upon binding the PIP2 analog. However, the changes in PH domain structure upon binding IP3 had minimal impact on the ZA domain structure in the PZA construct. These results imply there is little or no relay of the PIP2-induced structural changes in the PH domain to the ZA domain. Though the PH and ZA domains are relatively independent in solution, this does not mean they cannot form an integral complex upon binding Arf•GTP. A model that could explain these results together with the data indicating the importance of the PH domain for catalysis is that the PH domain directly interacts with the substrate Arf1•GTP similar to that described for DH-PH Rho exchange factors [27,28].
Binding of Arf1•GTP to ASAP1 involved both PH and Arf GAP/ankyrin repeat domains. Several residues important for catalysis have been identified within the Arf GAP domain [15]. These residues center around Arg 497 of the Arf GAP domain, which itself is essential for catalysis. Two of the residues, Arg 505 (12Å from Met 605) and Asp 512 (10Å from Gly 515), lie at the edge of the putative PH/ZA interaction interface. Both the NMR and ITC results are consistent with loops surrounding the phosphoinositide binding site of the PH domain interacting with the catalytically important site (Figure 9). Based on these spatial relationships, Arf1•GTP could simultaneously contact the PH and the Arf GAP domains. The PH domain could affect both the Km and, by alignment of the substrate, the kcat. In this model, mutations in the PH domain would be expected to affect the Km and kcat, as we found. PIP2 binding to the PH domain, by affecting its structure, could regulate the interaction between Arf1•GTP and the PH domain. Alternatively, the bound PIP2 could be near the Arf GAP catalytic site and form part of the PZA/Arf•GTP interface.
Either PIP2 or soluble forms of PIP2 stimulate GAP activity of ASAP1; however the stimulation is greatly enhanced by association with a membrane or micelle surface containing acidic phospholipids [18]. Our model based on the NMR and ITC results may explain the effect of a phospholipid surface. Using ITC, we found that IP3 bound more tightly to the isolated PH domain than to PZA, consistent with the partial occlusion of the PIP2 binding site by the Arf GAP and Ank repeat domains. This conclusion is also supported by the NMR spectra. In contrast, the PIP2 dependencies for PH and PZA binding to LUVs were similar. We interpreted these results as the PIP2 binding site being exposed upon binding to a surface. The negatively charged phospholipids could disrupt the PH/ZA interaction by competing with the negatively charged ZA domain. With the ZA dissociated, the phosphoinositide site in the PH domain would have increased accessibility to PIP2 in the membrane. This model is consistent with the interaction between lysine and arginine side chains of PH domains and the acidic phospholipid phosphatidic acid that has been proposed based on solid state NMR data [44]. To further test the idea, we mutated residues near the interface of the PH and Arf GAP domains to disrupt the positional changes that would occur on binding to acidic large unilamellar vesicles. We found reduced binding to PIP2 in LUVs. Examination of vesicle dependent changes in fluorescent resonance energy transfer in the highly homologous ASAP2 with fluorescent tags at the N- and C-termini also led to the idea that the PH and Arf GAP domains may reorient upon binding to a surface containing acidic phospholipids [17].
Members of the ASAP subfamily of Arf GAP proteins contain several domains in addition to the PH and ZA domains. The N-terminal region (residues 1-311) contains a BAR domain [29], while the C-terminal region (residues 725-1091) contains a proline rich region, an (E/DLPPKP)8 repeat region, and an SH3 domain [1,4,2]. How these additional domains might interact with the PH and ZA domains is unknown. Interaction between a BAR domain and a PH domain is seen for another protein, APPL1, an effector of Rab5 GTPase [45]. Rab5, like Arf1, is a Ras-superfamily GTP binding protein. It binds primarily to the PH domain of APPL1, but the binding surface also incorporates part of the BAR domain. A similar BAR/PH domain interaction might be present in ASAP1, and interaction between the BAR and ZA domains or contribution of the BAR domain to Arf binding would not be surprising.
Conclusion
The NMR and biochemical analyses of ASAP1 are consistent with a model in which the PH domain contributes to binding and aligning Arf1•GTP for optimal catalysis of GTP hydrolysis.
Acknowledgments
This work was supported by the Intramural Research Program of the National Cancer Institute and the National Heart, Lung and Blood Institute, National Institutes of Health, Department of Health and Human Services.
Contributor Information
Ruibai Luo, Laboratory of Cellular and Molecular Biology, Bethesda, MD 20892.
Lisa M. Miller Jenkins, Laboratory of Cell Biology, National Cancer Institute, Bethesda, MD 20892
Paul A. Randazzo, Laboratory of Cellular and Molecular Biology, Bethesda, MD 20892.
James Gruschus, National Heart, Lung and Blood Institute, National Institutes of Health, Bethesda, MD 20892.
References
- 1.Inoue Hiroki, Randazzo Paul A. Traffic. 2007;8:1465–1475. doi: 10.1111/j.1600-0854.2007.00624.x. [DOI] [PubMed] [Google Scholar]
- 2.Randazzo PA, Inoue H, Bharti S. Biol Cell. 2007;99:583–600. doi: 10.1042/bc20070034. [DOI] [PubMed] [Google Scholar]
- 3.Nie ZZ, Hirsch DS, Randazzo PA. Curr Opin Cell Biol. 2003;15:396–404. doi: 10.1016/s0955-0674(03)00071-1. [DOI] [PubMed] [Google Scholar]
- 4.Nie ZZ, Randazzo PA. J Cell Sci. 2006;119:1203–1211. doi: 10.1242/jcs.02924. [DOI] [PubMed] [Google Scholar]
- 5.Frigerio G, Grimsey N, Dale M, Majoul I, Duden R. Traffic. 2007;8:1644–1655. doi: 10.1111/j.1600-0854.2007.00631.x. [DOI] [PMC free article] [PubMed] [Google Scholar]
- 6.Cukierman E, Huber I, Rotman M, Cassel D. Science. 1995;270:1999–2002. doi: 10.1126/science.270.5244.1999. [DOI] [PubMed] [Google Scholar]
- 7.Randazzo PA, Andrade J, Miura K, Brown MT, Long YQ, Stauffer S, Roller P, Cooper JA. Proc Nat'l Acad Sci USA. 2000;97:4011–4016. doi: 10.1073/pnas.070552297. [DOI] [PMC free article] [PubMed] [Google Scholar]
- 8.Onodera Y, Hashimoto S, Hashimoto A, Morishige M, Yamada A, Ogawa E, Adachi M, Sakurai T, Manabe T, Wada H, Matsuura N, Sabe H. EMBO J. 2005;24:963–973. doi: 10.1038/sj.emboj.7600588. [DOI] [PMC free article] [PubMed] [Google Scholar]
- 9.Bharti S, Inoue H, Bharti K, Hirsch DS, Nie Z, Yoon HY, Artym V, Yamada KM, Mueller SC, Barr VA, Randazzo PA. Mol Cell Biol. 2007;27:8271–8283. doi: 10.1128/MCB.01781-06. [DOI] [PMC free article] [PubMed] [Google Scholar]
- 10.Ehlers JP, Worley L, Onken MD, Harbour JW. Clinical Cancer Research. 2005;11:3609–3613. doi: 10.1158/1078-0432.CCR-04-1941. [DOI] [PubMed] [Google Scholar]
- 11.Brown MT, Andrade J, Radhakrishna H, Donaldson JG, Cooper JA, Randazzo PA. Mol Cell Biol. 1998;18:7038–7051. doi: 10.1128/mcb.18.12.7038. [DOI] [PMC free article] [PubMed] [Google Scholar]
- 12.Liu YH, Loijens JC, Martin KH, Karginov AV, Parsons JT. Mol Biol Cell. 2002;13:2147–2156. doi: 10.1091/mbc.E02-01-0018. [DOI] [PMC free article] [PubMed] [Google Scholar]
- 13.Liu Y, Yerushalmi GM, Grigera PR, Parsons JT. J Biol Chem. 2005;280:8884–8892. doi: 10.1074/jbc.M412200200. [DOI] [PubMed] [Google Scholar]
- 14.Yoon HY, Jacques K, Nealon B, Stauffer S, Premont RT, Randazzo PA. Cellular Signalling. 2004;16:1033–1044. doi: 10.1016/j.cellsig.2004.02.008. [DOI] [PubMed] [Google Scholar]
- 15.Luo R, Ahvazi B, Amariei D, Shroder D, Burrola B, Losert W, Randazzo PA. Biochem J. 2007;402:439–447. doi: 10.1042/BJ20061217. [DOI] [PMC free article] [PubMed] [Google Scholar]
- 16.Luo RB, Jacques K, Ahvazi B, Stauffer S, Premont RT, Randazzo PA. Curr Biol. 2005;15:2164–2169. doi: 10.1016/j.cub.2005.10.065. [DOI] [PubMed] [Google Scholar]
- 17.Che MM, Boja ES, Yoon HY, Gruschus J, Jaffe H, Stauffer S, Schuck P, Fales HM, Randazzo PA. Cellular Signalling. 2005;17:1276–1288. doi: 10.1016/j.cellsig.2005.01.007. [DOI] [PubMed] [Google Scholar]
- 18.Kam JL, Miura K, Jackson TR, Gruschus J, Roller P, Stauffer S, Clark J, Aneja R, Randazzo PA. J Biol Chem. 2000;275:9653–9663. doi: 10.1074/jbc.275.13.9653. [DOI] [PubMed] [Google Scholar]
- 19.Lemmon MA, Ferguson KM, Schlessinger J. Cell. 1996;85:621–624. doi: 10.1016/s0092-8674(00)81022-3. [DOI] [PubMed] [Google Scholar]
- 20.Lemmon MA. Traffic. 2003;4:201–213. doi: 10.1034/j.1600-0854.2004.00071.x. [DOI] [PubMed] [Google Scholar]
- 21.Lemmon MA, Ferguson KM, Abrams CS. FEBS Lett. 2002;513:71–76. doi: 10.1016/s0014-5793(01)03243-4. [DOI] [PubMed] [Google Scholar]
- 22.Muller A, MacCallum RM, Sternberg MJE. Genome Research. 2002;12:1625–1641. doi: 10.1101/gr.221202. [DOI] [PMC free article] [PubMed] [Google Scholar]
- 23.Nie ZZ, Fei J, Premont RT, Randazzo PA. J Cell Sci. 2005;118:3555–3566. doi: 10.1242/jcs.02486. [DOI] [PubMed] [Google Scholar]
- 24.Nie Z, Boehm M, Boja ES, Vass WC, Bonifacino JS, Fales HM, Randazzo PA. Dev Cell. 2003;5:513–521. doi: 10.1016/s1534-5807(03)00234-x. [DOI] [PubMed] [Google Scholar]
- 25.Nakayama Y, Goebl M, Greco BO, Lemmon S, Chow EPC, Kirchhausen T. Eur J Biochem. 1991;202:569–574. doi: 10.1111/j.1432-1033.1991.tb16409.x. [DOI] [PubMed] [Google Scholar]
- 26.Snyder JT, Singer AU, Wing MR, Harden TK, Sondek J. J Biol Chem. 2003;278:21099–21104. doi: 10.1074/jbc.M301418200. [DOI] [PubMed] [Google Scholar]
- 27.Rossman KL, Worthylake DK, Snyder JT, Siderovski DP, Campbell SL, Sondek J. EMBO J. 2002;21:1315–1326. doi: 10.1093/emboj/21.6.1315. [DOI] [PMC free article] [PubMed] [Google Scholar]
- 28.Rossman KL, Cheng L, Mahon GM, Rojas RJ, Snyder JT, Whitehead IP, Sondek J. J Biol Chem. 2003;278:18393–18400. doi: 10.1074/jbc.M300127200. [DOI] [PubMed] [Google Scholar]
- 29.Nie Z, Hirsch DS, Luo R, Jian X, Stauffer S, Cremesti A, Andrade J, Lebowitz J, Marino M, Ahvazi B, Hinshaw JE, Randazzo PA. Curr Biol. 2006;16:130–139. doi: 10.1016/j.cub.2005.11.069. [DOI] [PubMed] [Google Scholar]
- 30.Gruschus JM, Ferretti JA. J Mag Reson. 1999;140:451–459. doi: 10.1006/jmre.1999.1852. [DOI] [PubMed] [Google Scholar]
- 31.Grzesiek S, Bax A. J Biomolecular NMR. 1993;3:185–204. doi: 10.1007/BF00178261. [DOI] [PubMed] [Google Scholar]
- 32.Delaglio F, Grzesiek S, Vuister GW, Zhu G, Pfeifer J, Bax A. J Biomolecular NMR. 1995;6:277–293. doi: 10.1007/BF00197809. [DOI] [PubMed] [Google Scholar]
- 33.Wu XW, Milne JLS, Borgnia MJ, Rostapshov AV, Subramaniam S, Brooks BR. J Struct Biol. 2003;141:63–76. doi: 10.1016/s1047-8477(02)00570-1. [DOI] [PMC free article] [PubMed] [Google Scholar]
- 34.Randazzo PA, Miura K, Jackson TR. Methods Enzymol. 2001;329:343–354. doi: 10.1016/s0076-6879(01)29096-x. [DOI] [PubMed] [Google Scholar]
- 35.Che MM, Nie ZZ, Randazzo PA. Methods Enzymol. 2005;404:147–163. doi: 10.1016/S0076-6879(05)04015-2. [DOI] [PubMed] [Google Scholar]
- 36.Randazzo PA, Kahn RA. J Biol Chem. 1994;269:10758–10763. [PubMed] [Google Scholar]
- 37.Ha VL, Thomas GMH, Stauffer S, Randazzo PA. Methods Enzymol. 2005;404:164–174. doi: 10.1016/S0076-6879(05)04016-4. [DOI] [PubMed] [Google Scholar]
- 38.Edlich C, Simon B, Sattler M, Muhle-Goll C. J Biomolecular NMR. 2006;36:21. doi: 10.1007/s10858-005-6053-x. [DOI] [PubMed] [Google Scholar]
- 39.Fushman D, Cahill S, Lemmon MA, Schlessinger J, Cowburn D. Proc Nat'l Acad Sci USA. 1995;92:816–820. doi: 10.1073/pnas.92.3.816. [DOI] [PMC free article] [PubMed] [Google Scholar]
- 40.Zhang P, Talluri S, Deng HY, Branton D, Wagner G. Structure. 1995;3:1185–1195. doi: 10.1016/s0969-2126(01)00254-4. [DOI] [PubMed] [Google Scholar]
- 41.Mandiyan V, Andreev J, Schlessinger J, Hubbard SR. EMBO J. 1999;18:6890–6898. doi: 10.1093/emboj/18.24.6890. [DOI] [PMC free article] [PubMed] [Google Scholar]
- 42.Lee DY, Park SJ, Jeong W, Sung HJ, Oho T, Wu XW, Rhee SG, Gruschus JM. Biochemistry. 2006;45:15301–15309. doi: 10.1021/bi061824h. [DOI] [PubMed] [Google Scholar]
- 43.Komander D, Fairservice A, Deak M, Kular GS, Prescott AR, Downes CP, Safrany ST, Alessi DR, Van Aalten DMF. EMBO J. 2004;23:3918–3928. doi: 10.1038/sj.emboj.7600379. [DOI] [PMC free article] [PubMed] [Google Scholar]
- 44.Kooijman EE, Tieleman DP, Testerink C, Munnik T, Rijkers DTS, Burger KNJ, de Kruijff B. J Biol Chem. 2007;282:11356–11364. doi: 10.1074/jbc.M609737200. [DOI] [PubMed] [Google Scholar]
- 45.Zhu GY, Chen J, Liu J, Brunzelle JS, Huang B, Wakeham N, Terzyan S, Li XM, Rao Z, Li GP, Zhang XJC. EMBO J. 2007;26:3484–3493. doi: 10.1038/sj.emboj.7601771. [DOI] [PMC free article] [PubMed] [Google Scholar]


