Abstract
The torque generated by the power stroke of Escherichia coli F1-ATPase was determined as a function of the load from measurements of the velocity of the γ-subunit obtained using a 0.25 μs time resolution and direct measurements of the drag from 45 to 91 nm gold nanorods. This result was compared to values of torque calculated using four different drag models. Although the γ-subunit was able to rotate with a 20× increase in viscosity, the transition time decreased from 0.4 ms to 5.26 ms. The torque was measured to be 63±8 pN nm, independent of the load on the enzyme.
Keywords: F1-ATPase, Gold nanorod, Molecular motor, High-speed data acquisition, Single molecule
1. Introduction
The F1F0 ATP synthase is required for energy conversion in almost all living organisms. It is composed of two complexes, the F1-ATPase (Escherichia coli subunits α, β, γ, δ and ε) that is peripheral to bio-energetic membranes, and F0 (E. coli subunits a, b, and c) that is an integral membrane complex. In F1, a ring of three αβ-subunit heterodimers surrounds the γ-subunit coiled-coil domain while the γ-subunit ‘foot’ domain anchors F1 to the c10-subunit ring of E. coli F0 [1,2]. Functionally F1F0 is a rotary machine, where rotor subunits γ, ε and c rotate relative to the stator composed of subunits a, b, α, β and δ [3,4].
Each αβ heterodimer contains a site that catalyzes ATP synthesis/hydrolysis. The synthesis of ATP is driven by ΔμH+ driven rotation the c-ring of F0Fo that forces conformational changes in the (αβ)3 ring [4]. Conversely, ATP hydrolysis can drive γ-subunit rotation in the opposite direction [3]. The three catalytic sites operate in an alternating site mechanism in which binding of ATP to the empty catalytic site induces release of ADP and phosphate from an adjacent site concurrent with rotation [5].
Direct observation of ATPase-driven rotation by microscopy is possible when F1 is mounted on a slide and a visible probe is attached to the γ-subunit. Rotation of the γ-subunit occurs in discrete 120° steps, each of which is associated with hydrolysis of an ATP molecule [3,6-8]. The torque generated by the molecule is dependent upon the strength of the power stroke associated with each hydrolysis event. The power stroke is dependent upon the velocity of the γ-subunit when it rotates. At saturating ATP concentrations, the velocity is determined by the transition time; i.e. the time required for γ to move from one dwell location to the next. By measuring the number of rotations per second as a function of the length of an actin filament (200-3000 μm) the first torque calculations of 40 pN nm were obtained by estimating the drag based upon the length of the probe [3]. A torque value of 50 pN nm was calculated by estimating the drag from the curvature of an actin filament induced by the rotation of the γ-subunit [9]. This torque estimate was superior to previous attempts since the torque of F1 is balanced by the elastic recoil of a bent actin filament which, unlike drag, is a conservative force. Similar values were obtained using video imaging systems to measure the rotation of an F1-ATPase labeled with a gold nanosphere [10].
Limitations of the temporal resolution of these methods resulted in using the number of revolutions per second to approximate rotational velocity [3,10]. This method failed to account for the fact that the motor spends most of the time in a state where γ is not rotating. The number of rotations per second gives an average velocity which is the integral of all the instantaneous velocities that occur during one 360° rotation. When the motor is in a dwell state it has a velocity of zero. Thus, the velocity of the power stroke is faster than the average value resulting in an underestimation of the torque. A related, but less significant, problem occurs with the actin filament curvature approach. Since the filament relaxes during each dwell, the net curvature is less than what would occur if the motor rotated continuously.
Recently, the rotational events of the γ-subunit were measured with a time resolution of 0.25 μs using gold nanorods as probes such that the speed of rotation could be distinguished from the dwell time [11]. Based on these measurements, values of torque as high as 61 pN nm were calculated by estimating the drag [11]. However, the accuracy of these torque calculations was limited by the ability to estimate the drag on the gold nanorod. Several different models have been proposed to estimate the drag on the probe based on the size, shape, viscosity, and binding orientation [3,11-13].
We now report the torque generated by the power stroke of F1-ATPase as a function of the load on the enzyme. Measurements of the velocity were obtained using a 0.25 μs time resolution and directly measuring the drag. This result was compared to values of torque calculated using four different drag models. Rotational assays were performed as described recently [11,14,15] as a function of polyethylene glycol (PEG 400) which increases the viscosity of the reaction medium. Although the γ-subunit was able to rotate with a 20× increase in viscosity, the transition time decreased from 0.4 ms to 5.26 ms and the torque remained 63±8 pN nm, independent of the load on the enzyme.
2. Results
Fig. 1 shows the measured viscosity of the assay buffer as a function of the percentage (vol/vol) of PEG 400. These data were used to calculate the shear stress as a function of the shear rate (Fig. 2). The linear dependence between these parameters indicates that the assay buffer containing PEG 400 behaves as a Newtonian fluid. Thus, PEG 400 molecules are too small to be pulled along by the rotating nanorod, and do not make secondary nonlinear contributions to the drag.
Fig. 1.
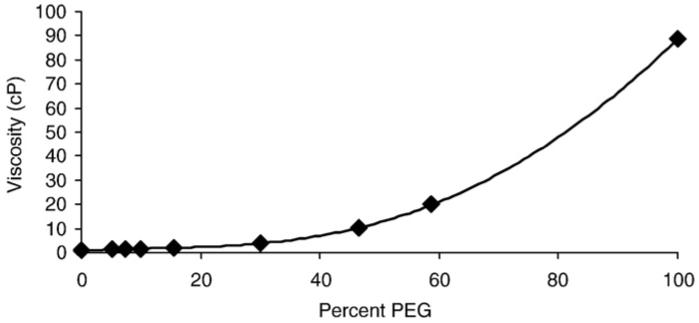
The viscosity of the buffer used to make single molecule rotation measurements (Rotation Buffer (50 mM Tris-Cl/pH 8.0, 10 mM KCl)) as a function of its percent composition of PEG 400 (vol/vol). The measurements were made using a Brookfield DV-E viscometer with a UL adapter at 28 °C.
Fig. 2.
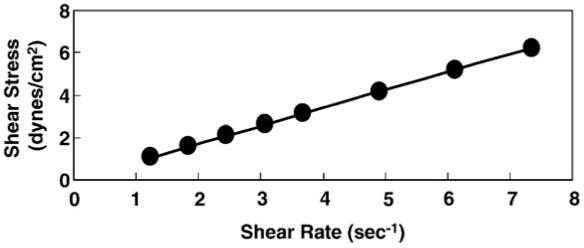
The shear stress as a function of the shear rate of the Rotation Buffer containing PEG 400. This was determined by measuring the effect of increasing the velocity on a rotating probe in the Brook field DV-E viscometer.
The drag coefficient was determined directly as described by Hunt et al. [16] by measuring the amount of angular change in individual gold nanorods near the surface in the absence of F1 (Fig. 3). Nanorods were selected which displayed a color change indicative of rotational movement, and which did not move significantly in the z direction, i.e. remained in focus. The dynamic range of scattered light intensity from a nanorod was measured by rotating the polarizer 360° in 10° increments. The angular change is related to the intensity by:
| (1) |
where ϕ is the difference in angle between the plane of polarization and the gold nanorod, A is the dynamic range, and B is the sum of the background noise level and half the dynamic range. The angular change was used to determine the diffusion constant by:
| (2) |
Fig. 3.
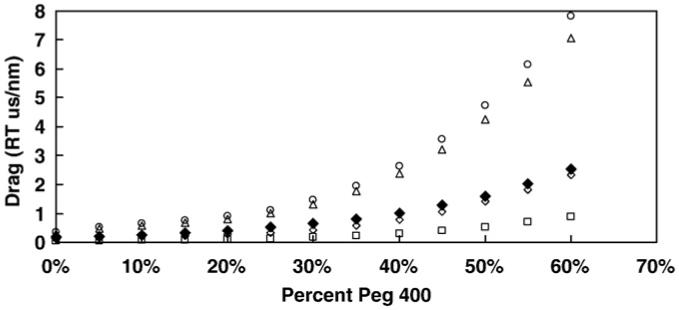
Drag as a function of viscosity. The solid symbol (◆) is the experimental value, while the open symbols are the theoretical values for a rod (△), a sphere (○), a filament (□), and a propeller (◇) calculated from Eqs. (4)-(7).
The change in the angle of gold nanorods near the surface was measured at data acquisition rates from 10 to 200 kHz in 10 kHz increments, which made the determination of the diffusion constant, D, independent of time artifacts. Using Einstein’s relation (Eq. (3)) the drag coefficient, Γ, was determined from the diffusion coefficient,
| (3) |
Fig. 3 also shows a comparison of the various drag values calculated from models that assume that the gold nanorod has the properties of a propeller [12], a nanosphere [13], a rod [11], and a long filament [3]. Based on the model for a propeller, the drag force is approximated by Eq. (4):
| (4) |
where L1 and L2 are the lengths of the propeller extending from the rotational axis, r is the radius of the rod, μ is the viscosity of the medium, and h is the height of the cylinder axis relative to the surface. The height of the propeller was estimated to be 17 nm based on the dimensions of F1 and avidin from crystal structures [17,18]. When h is small, most energy dissipation is believed to occur in the gap between the propeller and the surface [19].
The models used to estimate the drag force generated by a nanoscale rod, a nanosphere, and a filament are described by Eqs. (5)-(7), respectively:
| (5) |
| (6) |
| (7) |
The results in Fig. 3 show that the propeller model provides the closest approximation to the experimental data. Other models estimated the drag to be as much as 4-fold higher than the measured value at 60% PEG.
To determine the velocity of the power stroke generated during F1-ATPase-driven rotation, transition times were measured by tracking a 91×45 nm gold nanorod, through 90° of a rotation as described in Spetzler et al. [11], and the velocity plotted as a function of the viscosity (Fig. 4). The velocity of the transition decreased with increasing viscosity.
Fig. 4.
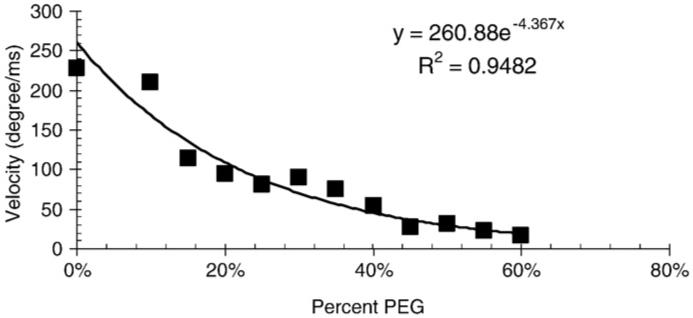
The velocity of the γ-subunit power stroke as a function of viscosity.
Fig. 5 shows the torque values calculated from the drag and the velocity by:
| (8) |
where w is the angular velocity as a function of viscosity. The value calculated from the direct measurements of the drag was 63 pN nm±8 nm, and was independent of the load applied to the motor. The estimated value for the torque based on the propeller model (∼55 pN nm) was similar to the measured result. However, the estimated values based on the sphere, the rod, and filament models were substantially different, indicating that the models provide poor estimates of the drag on the nanorod. For the models of the sphere and rod, the torque values were greater than the maximum amount of energy available to the enzyme in the absence of PEG 400 and increased linearly as a function of the viscosity violating the second law of thermodynamics.
Fig. 5.
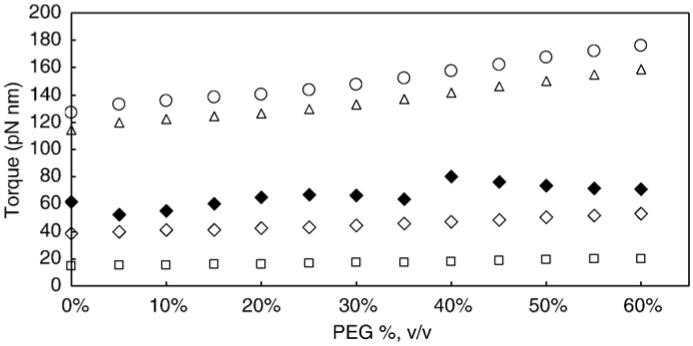
The torque generated by the F1 as a function of the load on the motor. The solid symbol (◆) is the experimental value, while the open symbols are the theoretical values for a rod (△), a sphere (○), a filament (□), and a propeller (◇) calculated from Eqs. (4)-(7).
3. Discussion
The torque value obtained from measured values for both the velocity and the drag reported here was 63 pN nm±8 nm. As the load increased, there was a corresponding decrease in the velocity indicating that the torque was constant over the range of viscous conditions examined. This value is consistent with the highest measured values for the torque generated by the F1-ATPase [11], but is significantly higher than values obtained elsewhere [3,9,10]. Independent evidence that supports the torque reported here can be derived from measurements of the H+/ATP ratio of proton transport-coupled ATP synthesis and hydrolysis catalyzed by liposomes that contain chloroplast F0F1 [20]. In this study, the rates of ATP synthesis and hydrolysis were measured with the luciferin/luciferase assay after an acid-base transition at various [ATP]/([ADP][Pi]) ratios as a function of ΔpH. By determining the point at which the free energy from the [ATP]/([ADP] [Pi]) ratio was in equilibrium with the transmembrane electrochemical potential difference such that there was no net synthesis or hydrolysis of ATP, H+/ATP ratios of 3.9-4.0 and standard Gibbs free energies of ATP synthesis of 37±2 kJ/mol and 36±3 kJ/mol at pH 8.45 and 8.05, respectively, were obtained. If we assume that the equilibrium point (when there is no net ATP synthesis or hydrolysis) occurs when ΔμH+ is equivalent and opposite to the force generated by F1-ATPase hydrolysis, then the Gibbs free energy is equal to the energy used to generate torque. Based on this assumption the chloroplast F1-ATPase generates 61.4±3 pN nm and 59.8±5 pN nm of torque at pH 8.45 and 8.05, respectively. These values are comparable to those reported here for the torque generated by E. coli F1-ATPase.
Previous estimates of the torque F1 produces against the friction of the viscous medium range from 40 to 50 pN nm [9,10]. From these estimates, it was calculated that the work F1 can do in a 120° step is about 80-90 pN nm or ∼20 kBT, calculated as 40-44 pN nm multiplied by (2/3)π radians. This is close to the physiological |ΔG| for ATP hydrolysis, and was interpreted to mean that the efficiency of the enzyme to convert chemical energy into mechanical energy is nearly 100% under physiological conditions [21]. Since the experiments were not performed under physiological conditions, not all sources of energy were taken into consideration, thus, the efficiency would be lower, consistent with predictions made by Karplus et al. [22].
The results presented here show that the enzyme is capable of doing more work than would be predicted by the amount of free energy under physiological conditions, suggesting that there are additional sources of energy. Gao et al. [23] and Yang et al. [24] calculated that the differential in binding constants could yield ∼80 pN nm worth of work using cellular concentrations of 3 mM ATP, 0.4 Mm ADP, and 6 mM Pi. In the experiments reported here, there were only trace amounts, <1%, of ADP and Pi in the 1 mM ATP solution used to induce rotation allowing as much as 60 pN nm of free energy to be generated from the concentration gradient between [ATP]/([ADP][Pi]). Based upon the data presented here, the work done by the enzyme is ∼130 pN nm. The energy available from substrate binding and sub-sequent product release, and the concentration gradient yield a net amount of 140 pN nm of free energy, suggesting that the enzyme is at least 90% efficient.
Acknowledgement
This work was supported by National Institutes of Health grant GM50202 to W.D.F.
References
- [1].Abrahams JP, Leslie AG, Lutter R, Walker JE. Structure at 2.8 A resolution of F1-ATPase from bovine heart mitochondria. Nature. 1994;370:621–628. doi: 10.1038/370621a0. [DOI] [PubMed] [Google Scholar]
- [2].Stock D, Leslie AG, Walker JE. Molecular architecture of the rotary motor in ATP synthase. Science. 1999;286:1700–1705. doi: 10.1126/science.286.5445.1700. [DOI] [PubMed] [Google Scholar]
- [3].Noji H, Yasuda R, Yoshida M, Kinosita K., Jr. Direct observation of the rotation of F1-ATPase. Nature. 1997;386:299–302. doi: 10.1038/386299a0. [DOI] [PubMed] [Google Scholar]
- [4].Borsch M, Turina P, Eggeling C, Fries JR, Seidel CA, Labahn A, Graber P. Conformational changes of the H+-ATPase from Escherichia coli upon nucleotide binding detected by single molecule fluorescence. FEBS Lett. 1998;437:251–254. doi: 10.1016/s0014-5793(98)01247-2. [DOI] [PubMed] [Google Scholar]
- [5].O’Neal CC, Boyer PD. Assessment of the rate of bound substrate interconversion and of ATP acceleration of product release during catalysis by mitochondrial adenosine triphosphatase. J. Biol. Chem. 1984;259:5761–5767. [PubMed] [Google Scholar]
- [6].Junge W, Sabbert D, Engelbrecht S. Rotatory catalysis by F-ATPase: real-time recording of intersubunit rotation. Berichte Der Bunsen-Gesellschaft-Phys. Chem. Chem. Phys. 1996;100:2014–2019. [Google Scholar]
- [7].Futai M, Omote H, Maeda M. Escherichia coli H(+)-ATPase (ATP synthase): catalytic site and roles of subunit interactions in energy coupling. Biochem. Soc. Trans. 1995;23:785–789. doi: 10.1042/bst0230785. [DOI] [PubMed] [Google Scholar]
- [8].Richter ML, McCarty RE. Energy-dependent changes in the conformation of the epsilon subunit of the chloroplast ATP synthase. J. Biol. Chem. 1987;262:15037–15040. [PubMed] [Google Scholar]
- [9].Panke O, Cherepanov DA, Gumbiowski K, Engelbrecht S, Junge W. Viscoelastic dynamics of actin filaments coupled to rotary F-ATPase: angular torque profile of the enzyme. Biophys. J. 2001;81:1220–1233. doi: 10.1016/S0006-3495(01)75780-3. [DOI] [PMC free article] [PubMed] [Google Scholar]
- [10].Yasuda R, Noji H, Kinosita K, Jr., Yoshida M. F1-ATPase is a highly efficient molecular motor that rotates with discrete 120 degree steps. Cell. 1998;93:1117–1124. doi: 10.1016/s0092-8674(00)81456-7. [DOI] [PubMed] [Google Scholar]
- [11].Spetzler D, York J, Daniel D, Fromme R, Lowry D, Frasch W. Microsecond time scale rotation measurements of single F(1)-ATPase molecules. Biochemistry. 2006;45:3117–3124. doi: 10.1021/bi052363n. [DOI] [PMC free article] [PubMed] [Google Scholar]
- [12].Soong RK, Bachand GD, Neves HP, Olkhovets AG, Craighead HG, Montemagno CD. Powering an inorganic nanodevice with a biomolecular motor. Science. 2000;290:1555–1558. doi: 10.1126/science.290.5496.1555. [DOI] [PubMed] [Google Scholar]
- [13].Yasuda R, Noji H, Yoshida M, Kinosita K, Itoh H. Resolution of distinct rotational substeps by submillisecond kinetic analysis of F-1-ATPase. Nature. 2001;410:898–904. doi: 10.1038/35073513. [DOI] [PubMed] [Google Scholar]
- [14].Spetzler D, York J, Martin J, Ishmukhametov R, Frasch WD. Microsecond resolution of enzymatic conformational changes using dark field microscopy. methods. doi: 10.1016/j.ymeth.2008.05.004. In Press. [DOI] [PubMed] [Google Scholar]
- [15].York J, Spetzler D, Hornung T, Ishmukhametov R, Martin J, Frasch WD. Abundance of Escherichia coli F(1)-ATPase molecules observed to rotate via single-molecule microscopy with gold nanorod probes. J. Bioenerg. Biomembr. 2007;39:435–439. doi: 10.1007/s10863-007-9114-x. [DOI] [PubMed] [Google Scholar]
- [16].Hunt AJ, Gittes F, Howard J. The force exerted by a single kinesin molecule against a viscous load. Biophys. J. 1994;67:766–781. doi: 10.1016/S0006-3495(94)80537-5. [DOI] [PMC free article] [PubMed] [Google Scholar]
- [17].Al-Shawi MK, Ketchum CJ, Nakamoto RK. Energy coupling, turnover, and stability of the F0F1 ATP synthase are dependent on the energy of interaction between gamma and beta subunits. J. Biol. Chem. 1997;272:2300–2306. doi: 10.1074/jbc.272.4.2300. [DOI] [PubMed] [Google Scholar]
- [18].Ketchum CJ, Al-Shawi MK, Nakamoto RK. Intergenic suppression of the gammaM23K uncoupling mutation in F0F1 ATP synthase by betaGlu-381 substitutions: the role of the beta380DELSEED386 segment in energy coupling. Biochem. J. 1998;330(Pt 2):707–712. doi: 10.1042/bj3300707. [DOI] [PMC free article] [PubMed] [Google Scholar]
- [19].Al-Shawi MK, Nakamoto RK. Mechanism of energy coupling in the FOF1-ATP synthase: the uncoupling mutation, gammaM23K, disrupts the use of binding energy to drive catalysis. Biochemistry. 1997;36:12954–12960. doi: 10.1021/bi971477z. [DOI] [PubMed] [Google Scholar]
- [20].Turina P, Samoray D, Graber P. H+/ATP ratio of proton transport-coupled ATP synthesis and hydrolysis catalysed by CF0F1-liposomes. EMBO J. 2003;22:418–426. doi: 10.1093/emboj/cdg073. [DOI] [PMC free article] [PubMed] [Google Scholar]
- [21].Kinosita K, Jr., Yasuda R, Noji H, Adachi K. A rotary molecular motor that can work at near 100% efficiency. Philos. Trans. R. Soc. Lond., B Biol. Sci. 2000;355:473–489. doi: 10.1098/rstb.2000.0589. [DOI] [PMC free article] [PubMed] [Google Scholar]
- [22].Karplus M, Gao YQ, Ma J, van der Vaart A, Yang W. Protein structural transitions and their functional role. Philos. Trans. A Math Phys. Eng. Sci. 2005;363:331–355. doi: 10.1098/rsta.2004.1496. discussion 355-336. [DOI] [PubMed] [Google Scholar]
- [23].Gao YQ, Yang W, Marcus RA, Karplus M. A model for the cooperative free energy transduction and kinetics of ATP hydrolysis by F1-ATPase. Proc. Natl. Acad. Sci. U. S. A. 2003;100:11339–11344. doi: 10.1073/pnas.1334188100. [DOI] [PMC free article] [PubMed] [Google Scholar]
- [24].Yang W, Gao YQ, Cui Q, Ma J, Karplus M. The missing link between thermodynamics and structure in F1-ATPase. Proc. Natl. Acad. Sci. U. S. A. 2003;100:874–879. doi: 10.1073/pnas.0337432100. [DOI] [PMC free article] [PubMed] [Google Scholar]


