

Abstract
To examine possible neural strategies for the detection of tones in broadband noise, single-neuron extracellular recordings were obtained from the anteroventral cochlear nucleus (AVCN) in anesthetized gerbils. Detection thresholds determined by average discharge rate and several temporal metrics were compared with previously reported psychophysical detection thresholds in cats (Costalupes 1985). Because of their limited dynamic range, the average discharge rates of single neurons failed to predict psychophysical detection thresholds for relatively high-level noise at all measured characteristic frequencies (CFs). However, temporal responses changed significantly when a tone was added to a noise, even for neurons with flat masked rate-level functions. Three specific temporal analyses were applied to neural responses to tones in noise. First, temporal reliability, a measure of discharge time consistency across stimulus repetitions, decreased with increasing tone level for most AVCN neurons at all measured CFs. Second, synchronization to the tone frequency, a measure of phase-locking to the tone, increased with tone level for low-CF neurons. Third, rapid fluctuations in the poststimulus time histograms (PSTHs) decreased with tone level for a number of neurons at all CFs. For each of the three temporal measures, some neurons had detection thresholds at or below psychophysical thresholds. A physiological model of a higher-stage auditory neuron that received simple excitatory and inhibitory inputs from AVCN neurons was able to extract the PSTH fluctuation information in a form of decreased rate with tone level.
INTRODUCTION
Monaural detection of tones in background noise is a fundamental problem in auditory physiology and psychophysics. For auditory nerve (AN) fibers and most cochlear nucleus (CN) neurons, average discharge rate increases monotonically with tone level. However, the dynamic range of most AN fibers and CN neurons for rate encoding is significantly reduced by the presence of background noise (Geisler and Sinex 1980; Gibson et al. 1985; Rhode et al. 1978; Young and Barta 1986). This decrease is caused by a reduction in maximum rate at high tone levels and increased rates in response to the noise alone (Gibson et al. 1985).
Neural temporal response patterns change when a tone is added to a noise (Greenwood and Goldberg 1970). The most intensively studied temporal property is the synchronization coefficient of discharges to tone frequency, which has been shown to yield lower detection thresholds than discharge rates in both AN fibers (Rhode et al. 1978) and CN neurons (Miller et al. 1987) at relatively high noise levels. However, neural mechanisms that can extract phase-locking information for tone-in-noise detection are unclear. Moreover, phase locking to high-frequency tones is presumably too weak to be a cue for detection. This study explored temporal approaches as alternatives to average discharge rate or synchronization to tone frequency, seeking strategies that are physiologically realizable and not restricted to low frequencies.
Extracellular recordings were made from neurons in the anteroventral cochlear nucleus (AVCN) in response to tones in noise, and detection thresholds as determined by the average discharge rate and by several temporal measures of the neural responses were compared with psychophysical detection thresholds. The CN is the first stage of the auditory CNS and receives direct input from AN fibers. The rate-related dynamic-range properties of most AVCN neurons in response to tones in noise are similar to those of AN fibers (Gibson et al. 1985; May and Sachs 1992; Rhode et al. 1978). However, since AVCN neurons can receive convergent AN fiber inputs (Liberman 1991), as well as inhibitory inputs (Caspary et al. 1994; Kopp-Scheinpflug et al. 2002; Wickesberg and Oertel 1990), the detailed temporal information exhibited by AVCN neurons differs from that of AN fibers. For example, a number of AVCN neurons show enhanced synchronization to tones (Joris et al. 1994) and to the envelope of amplitude-modulated stimuli (Frisina et al. 1990) compared with AN fibers.
Before introducing the temporal measures used here, several issues related to previous studies should be discussed. First, the noise spectrum levels used in most previous physiological studies (AN: Young and Barta 1986; inferior colliculus: Rees and Palmer 1988) were relatively low compared with those used in psychophysical experiments (Costalupes 1983; Zheng et al. 2002). In this study, the noise levels were chosen to match the levels typically used in psychophysical studies of masked detection.
Second, in previous physiological studies of detection of tones in broadband noise, the temporal information analysis was mainly focused on the change of synchronization to the tone frequency. Although envelope-based psychophysical models have been used to explain human performance in tone-in-noise detection (Gilkey and Robinson 1986; Richards 1992), possible changes in the neural responses caused by changes in the stimulus envelope have not been studied for detection, given the absence of a distinct envelope for broad-band noise. However, after narrowband filtering in the periphery, the “effective” noise waveform has an envelope with slower modulations than the original stimulus envelope (Lawson and Uhlenbeck 1950; Louage et al. 2004). It has been shown that in response to tone and noise stimuli, envelope-locked temporal response properties of AN fibers and CN neurons can be separated from fine-structure phase locking by using predischarge stimulus ensembles (van Gisbergen et al. 1975) or autocorrelograms (Louage et al. 2004, 2005). In this study, we measured the change in the fluctuation of the post-stimulus time histograms (PSTHs) caused by the addition of a tone to a noise. It was assumed that the fluctuation was dominated by the envelope, not the fine structure, of the “effective” stimulus.
Third, in the ascending auditory pathway, the discharge of a higher-stage neuron is not a simple summation of its input from lower-stage neurons. Modeling studies have shown that if a neuron receives multiple subthreshold inputs from lower-stage neurons, the relative timing across inputs can affect the discharge of the targeted neuron, even if the inputs are independent (Banks and Sachs 1991; Rothman et al. 1993). This study explored several possible neural processing strategies that could be used by higher auditory centers that receive projections from the AVCN.
To examine both slow and rapid information in neural responses, temporal analysis windows of different lengths were applied to tone-in-noise responses for each analysis. First, changes in the temporal discharge patterns were quantified by a temporal correlation metric. More specific temporal metrics were applied to neural responses to extract different types of information, including temporal reliability, synchronization to the tone frequency, and fluctuation of the PSTH. A higher-stage physiological model was tested for its detection performance based on the fluctuations of PSTHs recorded from AVCN neurons. In addition to these temporal metrics computed from the whole or steady-state responses, changes in the first-spike latencies of AVCN neurons to tones in noise were examined.
METHODS
Animal preparation and recording procedures
Extracellular recordings were obtained in the AVCN of adult Mongolian gerbils (Meriones unguiculatus). The animal was anesthetized with an intraperitoneal injection of a mixture of ketamine (170 mg/kg) and xylazine (7 mg/kg). A syringe pump (BSP-99, Braintree Scientific) was used for continuous subcutaneous injection of 50% ketamine plus xylazine and 50% saline (0.9%), at a rate of 0.05 ml/h or less. Supplemental intramuscular injections of ketamine and xylazine were administered based on the animal’s pedal reflex and respiration rate. The animal was placed in a double-walled soundproof room with an automated heating pad to maintain a constant body temperature of 37.5°C. After a tracheotomy, the left pinna was removed, and a hole was made in the bulla. A second hole was made in the temporal bone to expose a small portion of the cerebellum directly above the AVCN. These procedures were approved by the Syracuse University Institutional Animal Care and Use Community.
Glass electrodes filled with 3 M NaCl were advanced by a manual micropositioner. Each penetration was constrained within a small range of stereotaxic angles. Occasionally, the location of neurons was verified histologically. Sound stimuli were delivered through a plastic tube coupled to the left auditory meatus. An acoustic calibration was performed with an ER-7C probe microphone (Etymôtic Research) at the beginning of each experiment, and linear compensation of the sound stimulus using the calibration table was performed for the frequency range of 0.1–10 kHz. A programmable Tucker-Davis-Technologies System III was used to generate the stimuli digitally and record the action potential times, under the control of Matlab. Sub-microsecond accuracy was achieved for discharge time recordings.
A low-level broadband noise (0.1–10 kHz, 50-ms duration, repeated every 100 ms) was used as a search stimulus while isolating single neurons. An automated threshold tuning curve was used to identify the threshold (Liberman 1978), CF, and spontaneous rate for each neuron. Responses to a CF tone with a duration of 25 ms, repeated every 100 ms at several levels (e.g., 0 – 80 dB SPL with a 10-dB step size), were used to categorize unit types according to Blackburn and Sachs (1989). For tone-in-noise responses, the frequency of the tone was set equal to the CF of the neuron, and the tone level was varied (e.g., 30 – 80 dB SPL with a 10-dB step size). The Gaussian noise masker had a frequency spectrum from 0.1 to 10 kHz; neurons with CFs outside the range of 0.3– 8 kHz were not included in the analysis. The noise spectrum level was set at 30 dB SPL for all neurons (the overall level of the noise was 70 dB SPL); 40 dB SPL noise spectrum level was also tested when possible. Noise waveforms were generated randomly for each neuron at each noise level but were identical (frozen) for all presentations of noise-alone and tone-plus-noise stimuli, because of the requirement of repetitive stimulus presentations by the temporal analyses. Tone and noise tokens were gated simultaneously with 10-ms cosine-squared ramps. The tone-plus-noise stimulus had a duration of 250 ms and was repeated every 475 ms. Thirty to 50 presentations of each stimulus were obtained for each neuron. In each presentation, the tone level was randomly selected to avoid sequential effects. After each tone-in-noise presentation, the tone alone was presented to obtain unmasked rate-level functions.
Average discharge rate
The average discharge rate was defined as the total discharge count in each stimulus presentation, including both onset and sustained activity, divided by the stimulus duration. A d′ metric based on the mean and the SD of the average discharge rate was used to quantify the rate change in response to noise-alone and tone-plus-noise stimuli (MacMillan and Creelman 2005)
Mn and Mtn are the mean average rates across repetitions in response to the noise alone and a tone plus the noise, respectively. and are the estimated variances of the average rates for the noise alone and the tone plus the noise, respectively. The lowest tone level that had d′ ≥ 1 was defined as the detection threshold.
Temporal correlation
A direct measure of the overall change in the temporal discharge pattern when a tone was added to a frozen noise was the correlation coefficient between the two responses. A low correlation value indicated a large change in the neural response because of the addition of the tone. If no significant change occurred, there was not sufficient temporal information available to detect the tone. However, to provide useful information, the change caused by the stimulus had to be larger than the variation from trial to trial in response to the same stimulus, i.e., the noise alone. Figure 1 shows a neuron’s responses to a noise at 30 dB SPL spectrum level and to the noise plus a 65 dB SPL tone. rb is the correlation coefficient between the PSTHs of even- and odd-numbered presentations of the noise alone. ra is the correlation coefficient between the PSTHs of odd-numbered presentations of the noise alone and odd-numbered presentations of the tone plus the noise. The detection threshold based on temporal correlation was defined as the lowest tone level for which ra was significantly lower than rb [t-test of 2 dependent correlations (Blalock 1972), P < 0.05].
FIG. 1.
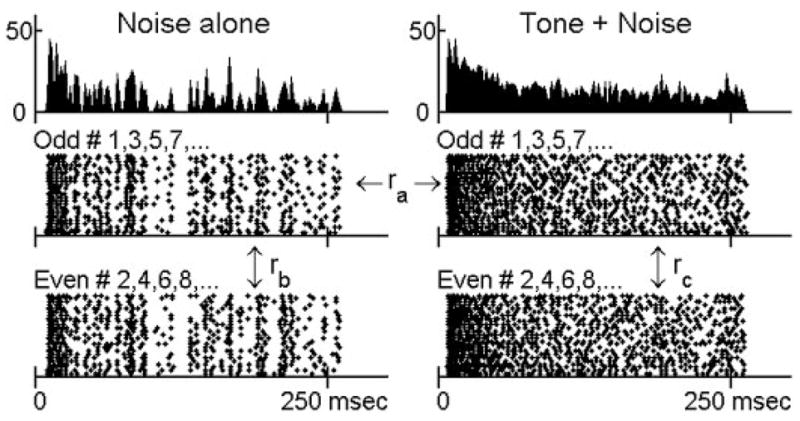
Responses of a chopper unit to a noise at 30 db SPL spectrum level and the same frozen noise with an added 65 db SPL tone. Top: poststimulus time histograms (PSTHs) obtained from 50 trials, with 2-ms bin width. Bottom: dot rasters of discharge times grouped into odd- and even-numbered trials. ra is the correlation coefficient between odd-numbered trials to noise-alone and to tone-plus-noise stimuli. rb (noise alone) and rc (tone plus noise) are correlation coefficients between odd- and even-numbered trials, respectively. G309u9: characteristic frequency (CF) = 482 Hz, spontaneous rate (SR) = 0 sp/s, threshold in quiet = 22 dB SPL.
PSTHs were convolved with a Gaussian smoothing function before the correlation was computed. The SD of the Gaussian smoothing function was referred to as the temporal analysis window, which was varied over a large range (0.2, 0.6, 1.6, 4.5, and 12.8 ms) to examine both slowly and rapidly changing temporal information. The Gaussian function was truncated to 3 SD in length (as in Martin et al. 2004). For each temporal analysis window, the PSTH was convolved with the Gaussian smoothing function, and the bin width of the resulting PSTH was chosen to match the temporal analysis window.
Note that each correlation was measured between two groups of discharge trains, i.e., even- and odd-numbered presentations, instead of between every pair of individual discharge trains. Measuring the correlation between two PSTHs was more practical because the correlation between two individual discharge trains was very small when the smallest temporal analysis window was applied, because of the sparseness of discharges. Interleaved presentations were chosen for each group to avoid sequential effects.
Because each correlation value was obtained from just one comparison between two PSTHs, the temporal correlation appeared to be noisy and was not strictly monotonic for every neuron. In this study, the detection threshold based on the temporal correlation was defined as the lowest tone level that showed a significant change when all higher tone levels also showed significant changes. This rule also applied to any of the following metrics that were not strictly monotonic.
Temporal correlation measured the amount of change in the neural responses caused by adding a tone to a specific noise waveform. However, this is not a physiologically realistic detection mechanism because a direct comparison between the noise-alone and tone-plus-noise responses is generally not available. In addition, changes in temporal correlation did not indicate how the response changed or potential mechanisms that caused the change. Three more specific temporal strategies are discussed in the next three sections: temporal reliability, synchrony to tone frequency, and PSTH fluctuation.
Temporal reliability
Because of the stochastic nature of the AN fiber inputs, the discharge times of AVCN neurons varied across presentations of the same stimulus waveform. Reliability measured the consistency of a single neuron’s discharges to a number of presentations of the same stimulus (Mainen and Sejnowski 1995; Martin et al. 2004). As shown in Fig. 1, rb measured the consistency of discharge times in response to the noise alone and can be thought of as a measure of reliability. Similarly, the correlation coefficient between the PSTHs of even- and odd-numbered presentations of the tone-plus-noise stimulus was denoted as rc. As with the temporal correlation measure, discharge trains in each temporal-analysis window were smoothed before the correlation coefficient was computed. The presence of a tone was determined if the addition of a tone caused a significant change in the reliability. The detection threshold was defined as the lowest tone level that elicited a significant increase or decrease in the reliability for any temporal analysis window [t-test of 2 independent correlations (Blalock 1972), P < 0.05], as long as this increase or decrease persisted at all the tone levels higher than the threshold for that particular temporal analysis window.
Synchrony to the tone frequency
The synchronization coefficient, also called the vector strength (Goldberg and Brown 1969), of the response to each stimulus presentation was computed at the tone frequency for tone-plus-noise and noise-alone responses. The onset response (discharges within 12 ms after the stimulus onset) was not included when computing synchronization. The discharge trains were not smoothed so as to preserve fine-timing information for mid- and high-CF neurons. The mean synchronization coefficient for all presentations at each tone level was tested for significance (Mardia 1972; P < 0.05). The detection threshold was defined as the lowest tone level that elicited significant synchronization. The criterion for significant synchronization had to account for the number of discharges (Mardia 1972); the number of discharges used here was the mean discharge count averaged across stimulus presentations.
Fluctuation of the PSTH
Richards (1992) used the average slope of the stimulus envelope as a decision variable to predict human performance in psychophysical detection experiments. After the extraction of the stimulus envelope, the difference between adjacent points in the envelope was computed and averaged across the stimulus duration. This average slope measured the amount of fluctuation in the stimulus envelope. A similar metric was applied in this study to the neural response PSTHs with different temporal analysis windows.
Discharge times were smoothed by the Gaussian smoothing function described above and combined across all stimulus presentations to form the PSTH. The discharge count in the previous bin was subtracted from the count in each bin of the PSTH. The absolute values of all the subtracted numbers were summed. The fluctuation of the PSTH was defined as the sum divided by the number of bins in the PSTH for a given temporal analysis window. The change in fluctuation with changing tone level was measured for each neuron.
In Results, a higher-stage physiological model with combined excitatory and inhibitory inputs that was able to extract the PSTH fluctuation is presented. Detection performance based on this model was superior to that based on the computed fluctuation of the PSTH as described above. Therefore only detection thresholds of the physiological model are presented below.
First-spike latency
It has been shown in previous studies that AVCN neurons have decreased first-spike latencies when the level of a pure CF tone is increased (for review, see Moller 1975). This study explored first-spike latency changes with tone level when a noise masker was present. The first spikes were identified using an approach presented by Young et al. (1988), which involved manually placing a cursor at the beginning of the stimulus-driven response to remove spontaneous activity.
RESULTS
Data presented here describe recordings from 102 isolated AVCN units in 19 gerbils. Responses of all 102 neurons were studied with tones in 30-dB SPL noise, and 57 of them were also studied with tones in 40-dB SPL noise. Neurons were classified into three major categories based on their short-tone-burst responses (Blackburn and Sachs 1989). Fifty-three “primary-like” units included response types associated with bushy cells (e.g., primary-like and primary-like-with-notch). Thirty-five “chopper” units included both transient and sustained chopper response types, because no consistent difference was found between the two types of choppers for any of the analyses. Fourteen “other” units included neurons that could not be classified into the first two categories. Figures 2A–5A show examples of short-tone PSTHs for four representative neurons (2 primary-like and 2 chopper units arranged in order of increasing CF). The response properties to tones in noise were analyzed on the basis of the discharge rate and the temporal measures. The detection thresholds for each metric were compared with psychophysical detection thresholds for the cat (Costalupes 1985), because behavioral results are not available for the gerbil. In the Costalupes study, the noise was continuously presented, whereas the noise was gated in this study; therefore the psychophysical thresholds were corrected with 1- to 3-dB elevations at mid and high frequencies to compensate for the effect of noise duration on detection thresholds (Wier et al. 1977).
FIG. 2.

Responses of a chopper unit to a short tone (25 ms, 50 dB SPL), long tones (250 ms), noise alone (250 ms), or tones plus noise (250 ms). A: PSTH for responses to the short tone at CF. Bin width = 0.5 ms. B–I: tone-in-noise responses. B: PSTH for noise at 30 dB SPL spectrum level. Bin width = 2 ms. C: PSTH for noise in B plus a 65 dB SPL tone. Bin width = 2 ms. D: masked rate-level functions for a 250-ms CF tone and for tone plus noise. E: temporal correlation measured with different temporal-analysis windows. F: temporal reliability measured with different termoral-analysis windows. G: synchronization coefficent to tone. H: PSTH fluctuation measured with different temporal-analysis windows. I: rate-level function of SFIE model. All filled squares indicate significant increase, and all open squares indicate significant decreases (P < 0.05 or d′ ≥ 1). X on the abscissa indicates reponses to noise alone. G309u9: CF = 492 Hz, SR = 0 sp/s. Pure-tone rate threshold in quiet = 22 dB SPL (same neuron as in Fig. 1). Fifty trials per stimulus condition. Error bars are SD.
FIG. 5.

Responses of a primary-like unit. Same format as Fig. 2. Tone level in C is 70 dB SPL. Thirty tone-in-noise trials. G313u12: CF = 4,565 Hz, SR = 38 sp/s, pure-tone rate threshold in quiet = 12 dB SPL.
Average discharge rate
Figures 2D–5D show masked and unmasked rate-level functions for tones at CF of the four representative neurons; the masker noise spectrum level was 30 dB SPL. Figures 2D and 3D show that the average discharge rates of a chopper and a primary-like unit increased significantly for the two highest tone levels (■). However, the discharge rates of the other two neurons (Figs. 4D and 5D; 1 chopper and 1 primary-like unit) were independent of tone level up to the highest tone level tested (70 or 80 dB SPL). The average rate in response to a pure tone at CF with the same stimulus duration is also shown for comparison (Figs. 2D–5D, dashed lines). The dynamic range of each neuron’s discharge rate was ≥30 dB SPL for pure tones but was usually reduced in the presence of the noise (e.g., Figs. 3D–5D, but not for Fig. 2D). For all neurons recorded, this reduction of dynamic range was mainly the effect of increased activity at low tone levels caused by the addition of masking noise. For some neurons, it was also an effect of reduced maximum responses at high tone levels caused by the presence of the masking noise (Fig. 4D and 5D). These observations agreed with those of Gibson et al. (1985).
FIG. 3.

Responses of a primary-like unit. Same format as Fig. 2. Tone level in C is 70 dB SPL. Fifty tone-in-noise trials. G297u5: CF = 676 Hz, SR = 49 sp/s, pure-tone rate threshold in quiet = 20 dB SPL. Pure-tone PSTH in A showed clear phase locking to the tone.
FIG. 4.

Responses of a chopper unit. Same format as Fig. 2. Tone level in C is 70 dB SPL. Fifty tone-in-noise trials. G308u3: CF = 1,085 Hz, SR = 0 sp/s, pure-tone rate threshold in quiet = 21 dB SPL.
Figure 6A shows the detection thresholds for all neurons based on average rate. The symbols in the shaded area represent neurons with unchanged rate-level functions up to the highest tone level tested (70 or 80 dB SPL). When the noise spectrum level was 30 dB SPL (Fig. 6A, left), 45% of neurons had flat rate-level functions. Even among the 55% of neurons with measurable thresholds, the neural thresholds were higher than psychophysical detection thresholds (solid lines). The percentage of neurons with flat rate-level functions was even higher when the noise spectrum level was 40 dB SPL (Fig. 6A, middle). In general, chopper units had lower rate thresholds than did primary-like units at similar CFs. At a noise spectrum level of 40 dB SPL, no primary-like unit at mid and high frequencies showed a significant change in average rate at any tone level (Fig. 6A, middle). The right panel of Fig. 6A will be discussed later with the results of other analyses.
FIG. 6.

Left and middle columns: detection thresholds based on (A) average dischare rate of the neuron, (B) temporal correlation, (C) temporal reliability, (D) synchronization to the tone, and (E) SFIE model discharge rate at noise spectrum levels of 30 (left) and 40 (middle) dB SPL. Shaded areas, label Un, indicate no measurable detection threshold up to the highest tone level tested (45, 1, 12, 39, and 11% of neurons for 30-dB SPL noise, and 67, 5, 27, 56, and 23% of neurons for 40-dB SPL noise, based on the measures of A–E, respectively). Solid lines represent psychophysical detection thresholds of the cat (Costalupes 1985) corrected for noise duration (Wier et al. 1977). Right column: increase of detection threshold for each neuron when noise spectrum level increased from 30 to 40 dB SPL, for neuron that were tested at both noise levels. Shaded areas, labeled Un, indicate neurons with unmeasurable thresholds at 40 dB SPL noise spectrum level. Shaded symbols circled by dashed lines, labeled Neg, indicate neurons with lower thresholds at 40 dB SPL, including those neurons that had unmeasurable thresholds at 30 dB SPL but measurable thresholds at 40 dB SPL noise spectrum level (these neurons are also marked in the left and middle panels as shaded symbols). Solid lines in the right panels represent increase in psychophysical detection threshold when noise level was increased by 10 dB. For the purpose of illustration, small jitter drawn from a Gaussian distribution with SD of 1 dB SPL was added to threshold value to avoid completely overlapping symbols.
Temporal correlation and first-spike latency
Values of temporal correlations for the four representative neurons are shown in Figs. 2E–5E. Detection performance based on the temporal correlation of chopper units was approximately invariant with window size. For example, the detection threshold of the chopper unit shown in Fig. 2E was 50 dB SPL for every temporal analysis window. (The significant point at 20 dB SPL using the smallest temporal analysis window was discarded based on the rule described in Methods.) For the chopper unit shown in Fig. 4E, the detection threshold was invariant with all temporal analysis windows except the largest one. In contrast, at a noise spectrum level of 30 dB SPL, ~68% of the primary-like units had lower detection thresholds when the temporal analysis windows were smaller. For example, the two primary-like units shown in Figs. 3E and 5E had detection thresholds that were relatively low for the three smallest temporal analysis windows, whereas the two largest temporal analysis windows exhibited no significant change up to the highest tone level tested.
Figure 6B shows detection thresholds as determined by temporal correlation. For neurons with detection performance that varied across different temporal analysis windows, the lowest threshold was selected. Compared with the rate thresholds in Fig. 6A, the detection thresholds of most neurons were lower than the psychophysical thresholds, including neurons that had flat masked rate-level functions. No significant difference was found in the detection thresholds of different neuron types.
The correlation coefficient measured the discharge similarity between neural responses to noise-alone and tone-plus-noise stimuli. A low correlation can result from different discharge patterns or from the same pattern shifted in time. To examine the possibility of a shift in latency, we measured the maximum value of the normalized cross-correlation function between noise-alone and tone-plus-noise responses, which was essentially the maximum correlation coefficient between the two responses with different delays introduced. The detection threshold of a neuron as determined by temporal correlation did not change when a latency shift was taken into account, although sometimes the maximum correlation was slightly higher than when the correlation coefficient had no relative delay (data not shown).
For some AVCN neurons, the first-spike latency decreased monotonically with increasing tone level when a masking noise was present (63 and 24% of neurons when the noise spectrum level was 30 and 40 dB SPL, respectively). Figure 7 shows the mean and SD of the first-spike latency for the four representative neurons. Each open symbol indicates a significant decrease (d′ ≥ 1) in the first-spike latency at a certain tone level compared with the latency for noise alone. In general, the lowest tone level associated with a significant change in first-spike latency agreed with the average rate threshold, such as the neuron in Fig. 7B. For the 30-dB SPL noise spectrum level, 25% of neurons had lower detection thresholds when based on the first-spike latency than when determined by average rate, such as the neurons in Fig. 7, A, C, and D; yet 24% of neurons had lower rate thresholds. Because first-spike latency did not yield significantly better detection performance than did average rate, it was not further explored in this study.
FIG. 7.
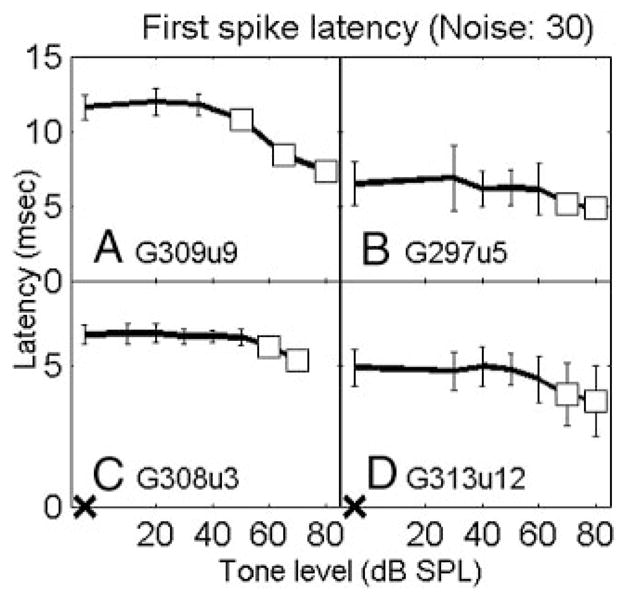
First-spike latencies for the 4 representative neurons in response to tones in noise. A–D correspond to the 4 neurons in Figs. 2–5, respectively. Noise spectrum level was 30 dB SPL. Open squares indicate signficant decrease in the first-spike latency to tone-plus-noise condition compared with noise-alone condition (d′ ≥ 1). X on the abscissa indicates response to noise alone.
Temporal reliability
Temporal reliability measures a single neuron’s consistency when responding to multiple presentations of the same stimulus. Values of temporal reliability based on tone-in-noise responses of the four representative neurons are shown in Figs. 2F–5F. Note that for the noise-alone condition, the temporal reliability was equal to the temporal correlation. Before discussing how reliability changed with different sound stimuli for each neuron, it should be noted that the reliability across neurons was quite diverse. It was commonly observed that low-CF neurons were more reliable than high-CF neurons for both noise-alone and tone-plus-noise stimuli. For example, the primary-like unit with a CF of 676 Hz in Fig. 3F had higher reliability values than the primary-like unit with a CF of 4565 Hz in Fig. 5F, especially for smaller temporal analysis windows. Also, chopper units were typically more reliable than primary-like units, except at very low CFs.
The reliability of a number of neurons changed significantly when a tone was added to the noise. The two primary-like units in Figs. 3F and 5F showed a clear decrease in temporal reliability with increasing tone level when relatively small temporal analysis windows were used. However, the chopper unit in Fig. 4F did not show a systematic change in reliability with increasing tone level. For small temporal analysis windows, ~75 and 65% of AVCN neurons showed decreased reliability with increasing tone level for 30- and 40-dB SPL noise spectrum level, respectively, whereas the rest showed unchanged or increased reliability with increasing tone level. For large temporal analysis windows, fewer neurons showed systematic changes.
The left and middle panels of Fig. 6C show the detection thresholds based on temporal reliability for the two noise levels tested. For a number of neurons, the thresholds determined by temporal reliability were at or below the psychophysical thresholds, but more neurons had thresholds higher than the psychophysical thresholds. No significant difference was found in the detection thresholds across different neuron types.
Synchrony to the tone frequency
Figures 2G–5G show the synchronization coefficients of the four representative neurons computed at the tone frequency, which was set equal to CF. In general, low-CF neurons had higher synchronization than high-CF neurons (Figs. 3G and 5G), and primary-like neurons had higher synchronization than chopper neurons with similar CFs (Figs. 2G and 3G). These properties were consistent with previous descriptions of AVCN neurons synchronization to pure CF tones (Blackburn and Sachs 1989).
Figure 6D shows the detection thresholds based on the synchronization coefficient for all neurons. A small number of neurons, mainly primary-like units, had detection thresholds equal to or lower than the psychophysical thresholds at low CFs. The majority of chopper units had detection thresholds higher than the psychophysical thresholds.
Fluctuation of the PSTH
Figure 1 shows the dot rasters and PSTHs of a chopper unit in response to a 30-dB SPL noise (left) and to the noise plus a 65-dB SPL tone (right). Certain temporal discharge patterns, resulting from consistent discharge timing across trials, can be easily visualized in the dot rasters of the noise-alone responses (middle and bottom left). These discharge patterns are also apparent in the fluctuations of the PSTHs (top left). However, discharge patterns are weaker in the tone-plus-noise response (middle and bottom right), which results in relatively flat PSTHs (top right). As stated earlier, after passing the broadband noise through peripheral auditory filters, the envelope of the effective stimulus has more low-frequency energy and thus fluctuates more visibly than the envelope of the original waveform (Lawson and Uhlenbeck 1950; Louage et al. 2004). Adding a tone to the noise flattened the envelope of the stimulus, resulting in a more evenly distributed PSTH of the neural response. Figures 2H–5H show values of the PSTH fluctuation for the four representative neurons using different temporal analysis windows. For each temporal analysis window (represented by each line), the values of PSTH fluctuation at different tone levels were normalized by the corresponding value of the fluctuation with noise-alone stimuli for the purpose of illustration. For the first three neurons (Figs. 2– 4), the tone-plus-noise PSTHs were significantly flattened as compared with the noise-alone PSTHs when the temporal analysis resolution was chosen to approximately match the PSTH fluctuations. For the high-CF primary-like neuron in Fig. 5, the fluctuation of the PSTH did not change as much as for the other three neurons. Approximately 56 and 37% of all neurons tested showed decreased fluctuation for at least one temporal analysis window for noise spectrum levels of 30 and 40 dB SPL, respectively. For neurons that showed decreased fluctuation, ~90% of them showed the most significant decrease when using a 1.6-ms temporal analysis window (Figs. 2H–5H, thick lines) among the five windows tested.
The fluctuation was computed as the difference between adjacent discharge counts averaged over the stimulus duration. If the shape of the PSTH did not change and only the discharge rate increased, the computed fluctuation increased. As seen in Fig. 2H, the reduction of fluctuation at high tone levels dominated the increased rate when a 1.6-ms temporal analysis window was used. However, for the smallest (0.2 ms) and largest (13 ms) temporal analysis windows, the measured fluctuation increased at high tone levels, which may have been affected by the increased rate or a stronger onset response. Because the measured fluctuation using these two temporal analysis windows was less consistent across neurons as compared with the decrease measured using the 1.6-ms window, the increase in fluctuation was not considered to be a reliable cue for tone-in-noise detection.
Same-frequency inhibition and excitation model
The temporal strategies described above require a higher-stage auditory center to process the temporal information in CN neural responses for tone-in-noise detection. In the Discussion, we will address the difficulty of finding physiological substrates for calculating the temporal correlation, temporal reliability, and synchronization to the tone frequency. Here we present a physiological model for extracting the information contained in the fluctuation of the PSTH. Modeling methods will be presented first, followed by the model results.
MODELING METHODS
The fluctuation of the PSTH was reflected in the difference of discharge counts in adjacent bins. A physiological mechanism that uses this information therefore must have access to both present and previous discharge activity to make a comparison. A natural way to provide this comparison is a delayed inhibition. Nelson and Carney (2004) proposed a phenomenological model to account for the response properties of inferior-colliculus (IC) neurons to amplitude modulation, the same-frequency inhibition and excitation (SFIE) model (Fig. 8A). As will be addressed later, the PSTH fluctuations were assumed to be dominated by locking to stimulus envelope. Because the model shows rate tuning to the frequency of fluctuations of stimulus envelopes and receives delayed inhibitory inputs, it simulates a physiological mechanism that can extract PSTH fluctuations obtained from AVCN neurons to detect the presence of the tone.
FIG. 8.
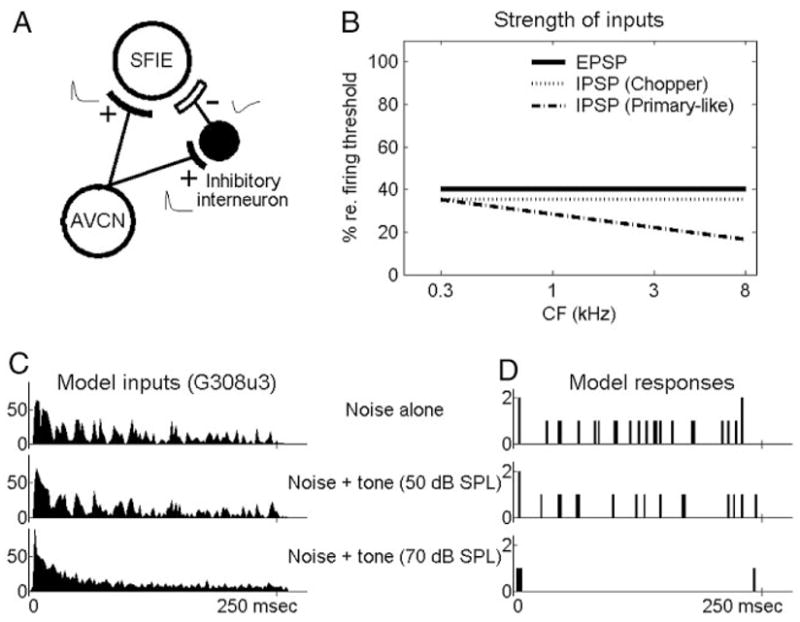
A: schematic diagram of the same-frequency inhibition and excitation (SFIE) model. B: strength of excitatory postsynaptic potentials (EPSPs) and inhibitory postsynaptic potentials (IPSPs; value 100% was equivalent to excitatory strength of a single input action potential that just caused the membrane potential to reach discharge threshold). C: PSTHs of a chopper nueron (unit shown in Fig. 4) describing the inputs to the model. D: model responses. In C and D, top panels correspond to a noise at 30 dB SPL spectrum level; the middle and bottom panels correspond to the same frozen noise plus a 50 (middle) or 70 (bottom) dB sPL tone. Bin width = 2 ms. + and − signs indicate excitatory and inhibitory inputs, respectively, and illustrative EPSPs and IPSPs are plotted beside the + and − signs.
The model receives on-CF excitatory inputs and delayed on-CF inhibitory inputs. When the reversal potential of inhibitory postsynaptic potentials (IPSPs) is close to the resting potential of the cellular membrane, this type of inhibition is called a shunting inhibition (for review, see Koch 1999). The effect of a shunting inhibition on the discharge rate is subtractive when the inhibitory inputs terminate on the cell body and divisive when they terminate on distal dendrites (Koch 1999). The neuron model used here had a single compartment and the inhibitory effects were thus mainly subtractive. A leaky integrate-and-fire model with time-varying conductances was used to simulate the SFIE model neuron (see APPENDIX). The model inputs were discharge times in 30 –50 repetitions obtained from a single AVCN neuron. No temporal analysis window was used because the smoothness of the inputs was determined by the time constants of the excitatory postsynaptic potentials (EPSPs) and inhibitory postsynaptic potentials (IPSPs).
The time constants of the EPSPs and the IPSPs were 0.5 and 2 ms, respectively. These relatively fast time constants were required by the model to extract the rapidly changing PSTH fluctuation. The inhibitory inputs were delayed by 1 ms to simulate the synaptic delay associated with an inhibitory interneuron. The strength of excitatory and inhibitory inputs used for different CFs is shown in Fig. 8B; a value of 100% was equivalent to the strength of one input discharge that just caused the membrane potential to reach the discharge threshold. The strength of inhibition was kept constant for model cells that had inputs from chopper units, but linearly decreased with CF for model cells that had inputs from primary-like units. This configuration was chosen to maintain a reasonable discharge rate (e.g., >20 spikes/s in response to noise alone) for model neurons with high-CF primary-like inputs, which would otherwise have had rates too low to contain any reliable information. Among all model parameters, the strength of excitatory and inhibitory inputs was most critical for determining the model’s detection threshold.
The SFIE model required multiple input discharge trains to detect the fluctuations of the PSTHs. Here the responses of a single AVCN neuron to 50 stimulus repetitions were used as the multiple inputs to provide one repetition of the model discharge count. The variance of the model discharge count was added based on the variance of the input (i.e., the variance over the mean of the model discharge count was set equal to the variance over the mean of the input discharge count). The model detection threshold was the lowest tone level that had d′ ≥ 1. Note that a decrease of model rate was used in the calculation of d′.
MODELING RESULTS
Figure 8D shows the responses of a model cell that received input from the chopper unit shown in Fig. 4 (replotted in Fig. 8C). For noise alone, the model neuron received excitatory inputs that fluctuated with time (Fig. 8C, top). Although the strength of the inhibitory inputs was as strong as that of the excitatory inputs, the membrane potential still reached the discharge threshold frequently. Therefore the model showed sustained activity to noise alone or when a low-level tone was added to the noise. However, when a high-level tone was added to the noise, the model received fewer fluctuating excitatory inputs from the chopper unit (Fig. 8C, middle and bottom). Meanwhile, the inhibitory inputs were more constant and thus more effective in preventing the membrane potential from depolarizing. The model thus yielded mainly subthreshold activity and low discharge rates in response to high-level tone-in-noise stimuli, and a significant decrease in the model rate indicated the presence of a tone.
Figures 2I–5I show the rate-level function of the SFIE model with the discharge times of the four representative neurons as inputs. The first two neurons (Figs. 2I and 3I) had monotonically decreasing model rates with increasing tone level. The third neuron (Fig. 4I) had a clear trend of decreased model rate, although there was a dip at 20 dB SPL (the detection threshold of this neuron was defined as 50 dB SPL). The model discharge rate with inputs from the fourth neuron (Fig. 5I) was noisier. Note that only responses from 30 trials were obtained for the neuron in Fig. 5, whereas 50 trials were obtained for the other three representative neurons.
Figure 6E shows the detection thresholds as determined by the model rate with inputs from recorded AVCN neurons. Some of the model thresholds were equal to or lower than the psychophysical thresholds. Here the model rate included both onset and sustained activity; performance did not change significantly when only sustained activity was analyzed. No significant difference was found in the detection thresholds across different neuron types.
Although the rate-level functions of the SFIE model qualitatively represented the fluctuation of the PSTH, it was commonly observed that the model rate changed significantly at a lower tone level than did thresholds based on fluctuation of the PSTH. For example, the fluctuation of the PSTH of the chopper unit with a temporal analysis window of 1.6 ms (Fig. 2H) did not show a significant decrease at 50 dB SPL, whereas the SFIE model did (Fig. 2I). There were cases for which no systematic change was observed in PSTH fluctuation up to the highest tone level tested, but the rate of the SFIE model decreased monotonically with tone level. The better performance of the model was partly the result of the nonlinear behavior of a neuron model that generated discharges only if the membrane potential exceeded a discharge threshold. When the input neural response had a flat PSTH because of the addition of a tone, it was more likely to cause subthreshold activity that was not reflected in the number of model discharges. An extreme example is shown in the bottom panels of Fig. 8, C and D, for a noise plus a 70-dB SPL tone. Except at the onset and offset, the model input only caused subthreshold activity and led to no sustained model responses. However, when calculating PSTH fluctuation, the subtraction between adjacent counts still left some sustained activity that contributed to the values shown in Fig. 4H. Hence the spiking model was more sensitive to the reduction of fluctuation in the envelope and less affected by the absolute input rate than nonspiking models were.
Comparisons of the detection performance between different measures
Direct comparison of detection thresholds among the approaches presented here was complicated by several issues. First, the measures of rate, correlation, and synchronization required different statistical methods to test for significant changes. Second, the detection thresholds of the average rate and the synchronization were based on neural responses for individual trials, whereas the other temporal approaches required combinations of discharge times across trials. Third, the detection thresholds of the temporal correlation and the temporal reliability for each neuron were chosen as the best performance across all temporal analysis windows, whereas the measures of average rate and synchronization did not involve different temporal resolutions. The SFIE model can also be thought of as using one temporal resolution, because the time constants and inhibitory delays of the model were fixed for all neurons.
The ability to predict psychophysical detection thresholds based on the performance of each cue (Fig. 6, left and middle panels) was described above for two noise levels. Another way to test a detection cue was to measure how detection performance based on this cue changed with noise level compared with the psychophysical thresholds, which are ~10 dB higher for 40-dB SPL noise than for 30-dB SPL noise (Costalupes 1985). The right column in Fig. 6 shows the increment of threshold for neurons tested at both noise levels. The increment in the psychophysical detection thresholds, indicated by the solid lines (Fig. 6, right panels), was 10 dB SPL for low and mid frequencies and gradually increased to 13 dB SPL at the highest frequencies (Costalupes 1985). For each detection cue, a certain number of neurons had thresholds that were increased by a similar amount as compared with the psychophysical thresholds. For example, 54% of primary-like neurons showed a 10-dB increment in threshold based on synchronization to the tone frequency (Fig. 6D, right), although some of these neurons had higher detection thresholds than the psychophysical thresholds at both noise levels (Fig. 6D, left and middle). Because the tone level was usually measured with a 10-dB step, some of the neurons that showed a 0-or 20-dB SPL increment in their thresholds might actually have had smaller or larger increments in threshold if a higher resolution of tone level steps had been used. For the temporal correlation, temporal reliability, and SFIE model, there were neurons that showed decreased detection threshold with increased noise level (enclosed by dashed lines in the right column of Fig. 6), which was contradictory to the psychophysical observation. The detection performance of these neurons as determined by that particular detection cue should be evaluated with caution (Fig. 6, left and right columns, symbols with a dot in the center). Nevertheless, these neurons may still contribute to the detection task if a population of neurons are combined to predict the psychophysical detection thresholds at different noise levels.
DISCUSSION
This study showed that the average discharge rate of individual AVCN neurons was incapable of predicting psychophysical tone-in-noise detection performance, whereas the temporal correlation measure indicated that abundant temporal information was available. Three temporal cues—reliability, synchronization to the tone frequency, and fluctuation of the PSTH—were shown to yield detection thresholds in some neurons that were comparable to psychophysical results. The SFIE model provided a specific, physiologically realistic mechanism for the extraction of temporal envelope fluctuation and transformation into a representation in terms of discharge rate.
Average discharge rate
A reduction in the dynamic range of the discharge rate caused by a broadband noise was found in most of the neurons in this study and showed trends similar to previous studies of AN fibers and CN neurons (AN: Geisler and Sinex 1980; Rhode et al. 1978; Young and Barta 1986; CN: Gibson et al. 1985). It has been reported that a small number of AN fibers with low- and mid-spontaneous rates have rate thresholds comparable with behavioral detection thresholds (Young and Barta 1986). Because the dynamic range of the average discharge rate of CN neurons is similar to AN fibers (Gibson et al. 1985), it would be expected that the rate coding of some CN neurons should be sufficient to account for psychophysical detection thresholds. However, the highest noise spectrum level in the study of Young and Barta was 30 dB SPL. This study showed that detection performance based on discharge rate was even worse for the 40-dB SPL noise spectrum level.
One limitation of this study was that the animals were anesthetized with ketamine during the recordings. May and Sachs (1992) suggested that VCN neurons in awake cats may exhibit larger dynamic ranges in rate than neurons in anesthetized or decerebrate cats. Another limitation was that the rate coding discussed thus far was based on single neurons. It is likely that the rate information in an optimally weighted population of independent neurons would predict lower detection thresholds than the most sensitive individual neuron. Theoretically, combining the average discharge rate across identical but independent neurons can reduce the variance of the rate. For example, the detection threshold based on the average rate of the chopper neuron in Fig. 2 was 65 dB SPL, but might be reduced to 50 dB SPL if the estimated variance of the rate was reduced by combining 10 statistically identical and independent neurons, although the absolute rate change was small at 50 dB SPL. In other words, to achieve lower detection thresholds than the single-neuron thresholds, small rate changes in a precise system are critical.
A mechanism that could combine the average rates across a population of neurons to reduce the variance is not clear. Discharges of higher-stage auditory neurons that receive multiple inputs from AVCN neurons are affected by refractoriness and by the relative timing differences between individual inputs. Because the majority of AVCN neurons showed decreased temporal reliability with increasing tone level, the reduction of the coincidence across neurons on addition of the tone would act against the increased average rate for any higher-stage neurons with subthreshold inputs.
Temporal reliability
Martin et al. (2004) calculated the coefficient of reliability as the mean cross-correlation coefficient of every pair of smoothed discharge trains for all possible combinations of trials. They found that the discharge pattern of auditory thalamic neurons in response to tones was scrambled when broadband noise was added, which was reasonable because the noise in each stimulus presentation was not identical (frozen). In this study, the temporal reliability measure focused on discharge-timing similarity across identical neurons to the same stimulus; thus the noise was frozen to maintain consistent response patterns, as seen in Fig. 1.
Most of the AVCN neurons exhibited decreased reliability when a CF tone was added to broadband noise, especially for relatively small temporal analysis windows. The exact factors that determined the temporal reliability for AVCN neurons are not clear from the results obtained here. Nevertheless, some similarities between these results and a previous study of neocortical neurons (Mainen and Sejnowski 1995) may provide some insight. In that study, the reliability of discharge timing was shown to be significantly higher in response to fluctuating current pulses than to a DC current, although the average discharge count did not vary much across trials for either stimulus. In this study, of the neurons that had decreased reliability for at least one temporal analysis window, 92 and 71% also had decreased PSTH fluctuation at noise levels of 30 and 40 dB SPL, respectively, although the detection thresholds based on the two metrics were not always the same. Therefore one possible factor contributing to the observed temporal reliability is the presence of temporal features contained in the stimulus waveform that cause synchronization in the neural responses. This hypothesis implies an association between the temporal reliability and the envelope of the effective stimulus. However, as shown by the chopper unit in Fig. 4, which had large changes in the PSTH fluctuation but small changes in the reliability when a high-level tone was added to the noise, the relationship between the stimulus envelope and the temporal reliability was not as direct as the relationship between the stimulus envelope and the PSTH fluctuation.
The two primary-like units in Figs. 3 and 5 showed decreasing temporal reliability for relatively small temporal analysis windows. This decreased reliability might seem to contradict the increased synchronization to the tone frequency. Although the higher reliability of low-CF neurons compared with high-CF neurons was presumably caused by the stronger phase locking at low frequencies, a higher synchronization coefficient caused by the addition of a tone did not necessarily correspond to higher response reliability across presentations or to a higher coincidence of discharge times across identical neurons. For the two primary-like units (Figs. 3C and 5C), the increased synchronization with the tone level indicated that discharges appeared at a more precise phase in each tone cycle; however, because the neuron did not discharge in every tone cycle, the reduction of the PSTH fluctuation suggested that the activity was spread out over more tone cycles. If the fluctuation of PSTHs was mainly determined by the envelope of the effective stimulus, as will be discussed next, it is reasonable to conclude that the neural response to stimulus envelope played a more important role in determining the temporal reliability than did the synchronization to the tone frequency.
Fine timing versus envelope
We hypothesized that PSTH fluctuation was caused mainly by the stimulus envelope because AVCN neurons have been shown to discharge in synchrony to the envelope of amplitude-modulated stimuli (Frisina et al. 1990; Rhode and Greenberg 1994). In this study, the envelope that was assumed to be responsible for the PSTH fluctuation was the envelope of the effective stimulus after peripheral filtering (Louage et al. 2004), which differs from the envelope achieved by the Hilbert transform of the original waveform. The fluctuation of the PSTH might also be affected by the neuron’s intrinsic properties and its inputs.
It is difficult to discriminate fine-timing and envelope-related cues because they are not clearly delineated by response properties analyzed with different temporal resolutions. For the majority of neurons, the 1.6-ms analysis window was found to provide the best resolution for measuring PSTH fluctuation among the five windows tested. Although this 1.6-ms window was smaller than the period of a CF tone for low-frequency neurons, fluctuations measured on this time scale were classified as envelope-related for two reasons. First, this resolution value was fixed for all neurons and was independent of their CFs. As long as the temporal resolution did not match the CF exactly, the fluctuation was associated with factors other than phase locking to the tone. Second, stronger synchronization to the tone at higher tone levels caused more precise timing in each tone cycle, which should have resulted in more peaky PSTHs, as opposed to the observed flattened PSTHs using the 1.6-ms analysis window, as shown in Figs. 2–4.
By using different temporal analysis windows that ranged from submillisecond to tens of milliseconds, the best resolution for processing the temporal information quantified by each metric was examined. There were three major conclusions related to temporal resolution. First, performance based on the temporal correlation of chopper units was less affected by the choice of temporal analysis window, whereas most primary-like units showed lower thresholds with relatively small window sizes. This difference implies that temporal information carried by these primary-like units would not be useful for detection if higher-stage auditory pathways were not sufficiently fast or accurate. Second, the temporal reliability for most of the neurons predicted better detection performance when using relatively small temporal analysis windows. Third, the decrease in PSTH fluctuation with tone level was most significant with a temporal analysis window of 1.6 ms for most AVCN neurons.
Louage et al. (2005) measured the intrinsic oscillations of AVCN neurons in response to broadband noise with the shuffled autocorrelogram (SAC). They found the dominance of synchronization transitioned from the tone frequency to envelope-locking at CFs of ~4 kHz. This study showed that the rapid fluctuation of PSTHs, presumably caused by the rapidly changing stimulus envelope, contained information for detection for both low and high CFs. In fact, the detection thresholds based on the PSTH fluctuations of low-CF neurons were lower than high-CF neurons, which agreed with the psychophysical detection thresholds. There are two reasons for this apparent discrepancy between the study of Louage et al. and this study. First, synchronization to fine structure and to envelope can be independent of each other (van Gisbergen et al. 1975). Synchronization to the tone frequency only relies on the discharge phase in each tone cycle and does not incorporate the cycle in which a discharge falls. Therefore a low-CF neuron can synchronize to both the envelope and the fine structure (Rhode and Greenberg 1994). Second, Louage et al. focused on the relative importance of fine-timing and envelope synchronization in determining the overall neural response, whereas this study focused on determining which cue was more sensitive to the addition of a tone to noise.
Comparisons between Fig. 6, D and E, indicated that the envelope-related cue was able to predict the psychophysical thresholds at both low and high CFs, whereas synchronization to the tone frequency was only able to predict the psychophysical thresholds at low CFs. In addition, it has been discussed earlier that the change of temporal reliability when a tone was added to noise was dominated by the stimulus envelope. Therefore we conclude that envelope-related cues may be critical for tone-in-noise detection at both low and high frequencies.
SFIE model
The SFIE model (Nelson and Carney 2004) was originally developed to predict the responses to amplitude-modulated stimuli of inferior colliculus (IC) neurons, which have an average firing rate that is tuned to modulation frequency. This study showed that, with inputs from a number of AVCN neurons, a decrease in the discharge rate of the model can indicate the presence of a tone in background noise. The model provided a fundamental detection strategy that separated the tone from the noise without cross-frequency integration. The result indicated that single-neuron responses elicited by fluctuations in the stimulus envelope may contain useful information for detection of tones in noise, although in reality the physiological mechanism probably involves more complicated arrangements than simple combinations of excitatory and inhibitory inputs with matched CFs.
In the central nucleus of the IC (ICC), the frequency tuning of the inhibitory inputs was found to match to that of the excitatory inputs for most neurons (Palombi and Caspary 1996); stimulating the lateral lemniscus can cause EPSPs and delayed IPSPs in the same ICC neuron (for review, see Wu et al. 2004). These observations are consistent with the assumptions of the SFIE model. A study of ICC neurons in decerebrate cats (Ramachandran et al. 1999) showed that the majority of neurons responded to broadband noise with diverse shapes in the rate-level functions and discharge rates to tones and to noise. However, Rees and Palmer (1988) mainly reported weak responses of ICC neurons to broadband noise in anesthetized guinea pigs. It is unclear whether decreased neural responses with increasing tone level were ever observed in that study. In addition to ICC neurons, there are neurons at other levels of the auditory system that receive combined excitatory and inhibitory inputs. For example, the lateral and medial superior olivary nuclei (LSO and MSO) receive ipsilateral and contralateral inhibitory inputs, as well as excitatory inputs (LSO: Brownell et al. 1979; Wu and Kelly 1994; MSO: Cant and Hyson 1992; Grothe and Sanes 1993). These neurons are also physiological candidates for the SFIE model as tone-in-noise detectors.
The time constants used in the model simulation were relatively short to follow the rapidly changing PSTH fluctuations. One study of ICC neurons showed EPSP time constants of several milliseconds (Wu et al. 2004), which were several times longer than the values used here. The EPSP time constants of LSO and MSO neurons are closer to the values used here (Smith et al. 2000; Wu and Kelly 1994). Note that the relatively low temperature used in those in vitro studies might have led to slower measured time constants (Smith et al. 2000) than what could have been obtained at the animals’ body temperature.
Possible physiological mechanisms for the temporal approaches
The next step beyond the exploration of the types of information that are potentially useful for detection is to understand what physiological mechanisms can process the information from AVCN neurons. As mentioned earlier, the temporal correlation metric indicated change in the neural responses, but such change cannot be easily represented by any feasible physiological strategy. Thus only the other three temporal metrics are discussed in the following text.
Temporal reliability was used to measure the consistency of the discharge pattern of a neuron across trials; we hypothesize that it also reflects the coincidence of discharge timing across a population of neurons. A neuron that requires the temporal convergence of multiple excitatory subthreshold inputs to reach its discharge threshold functions as a coincidence detector. When a tone is added to a noise, the discharge rate of the coincidence-detection neuron is decreased if the reliability of its input is reduced with approximately a constant number of input discharges; however, if the number of input discharges is higher for the tone, the target neuron is more likely to increase its discharge rate, counteracting the reliability cue. Simulations of a coincidence-detection neuron with inputs from AVCN recordings revealed that the input rate had a stronger effect than the reliability did (data not shown). Therefore not all AVCN neurons could use a simple coincidence-detection mechanism to extract the information in the temporal reliability measure.
Changes in the fluctuation of PSTHs can be detected by the SFIE model, as discussed above. For the chopper unit in Fig. 4, another way to detect the fluctuation is to set a high discharge threshold for the membrane potential of the postsynaptic neuron that receives multiple excitatory inputs from AVCN neurons and no inhibitory inputs. For example, based on the PSTHs shown in Fig. 4, B and C, for a noise alone and for a 70-dB SPL tone plus noise, a discharge threshold set just under the peak values of the noise-alone PSTH and above the sustained activity of the tone-plus-noise PSTH would result in a decreased discharge rate of the postsynaptic neuron on addition of the tone to the noise. This thresholding mechanism can be realized by the coincidence-detection neuron described above by increasing the discharge threshold. However, similar to the problem with the coincidence-detection mechanism, the thresholding mechanism would fail to detect the tone if the input rate increased with tone level.
The fine-timing information for tone-in-noise detection was quantified with the synchronization coefficient in this and previous studies (Miller et al. 1987; Rhode et al. 1978). The computation of the synchronization to the tone frequency requires knowledge of the tone frequency and an “internal clock” (Joris et al. 2006; Louage et al. 2004) to mark the phase of each discharge in a tone cycle. Before discussing possible mechanisms that do not involve an internal clock, it should be noted that simple coincidence detection across identical and independent neurons, although it seems intuitive, does not reliably detect increased synchronization to the tone with increasing tone level because of the decreased temporal reliability and more uniformly spread discharge activity.
One way to avoid the requirement of an internal clock is to have accurate delay lines that are proportional to the neuron’s CF. These delay lines can be used by a first-order autocorrelation model that increases its rate when the coincidence between nondelayed inputs and delayed inputs is higher when a tone is added. To date, direct physiological evidence for delay lines has not been identified. Another way to avoid using an internal clock and the knowledge of tone frequency is to construct a shuffled autocorrelogram (Louage et al. 2004, 2005). However, the physiological mechanism for constructing an autocorrelogram is still unclear (Cariani and Delgutte 1996).
In addition to synchronization to the tone frequency, phase changes across AN fibers with different CFs are used by the phase-opponency model (Carney et al. 2002) for tone-in-noise detection as an alternative fine-timing cue. The detection thresholds of this model were shown to match to human psychophysical detection thresholds at low frequencies (Kidd et al. 1989). The physiological evidence for this model is still under exploration.
Future studies
The temporal approaches used here were based on the responses of on-CF neurons. The possibility that detection performance would improve by including off-CF neurons in those analyses was not explored. Lewis and Henry (1995) showed responses of a high-CF AN fiber to a low-CF tone and the tone plus a broadband noise (their Fig. 8). This fiber had only onset and offset responses to the tone-alone stimulus but a sustained response to the tone-plus-noise stimulus that was phase-locked to the off-CF tone. It is possible that some AVCN neurons also have such properties, which may provide useful phase-locking information for tone-in-noise detection. The role of off-CF neurons should be considered in further studies of the temporal metrics presented here.
This study found that the rapidly changing fluctuation of the PSTH contained useful information for detection, which was presumably determined by the effective stimulus envelope. It was unclear whether the best temporal resolution, 1.6 ms, was general for detection of tones in noise with any bandwidth or was unique to broadband noise. In a reliability study of neo-cortical neurons (Mainen and Sejnowski 1995), the best time scale for precise discharge timing was found to be 1 to 2 ms, even when the current pulses used to stimulate the neurons fluctuated at a much slower rate. It is possible that the rapid fluctuation of AVCN responses to tones in subcritical-band noise still contain useful information for detection. Nevertheless, contributions of the slow-changing envelope to the detection of a tone in narrowband noise cannot be ruled out until further experiments are conducted. Such studies would be of interest for comparison to psychophysical studies of detection with different masker bandwidths.
Acknowledgments
We appreciate help from L. Pawson and K. Abrams with the animal surgery and from P. Nelson with the SFIE model and review of this manuscript. S. Early provided editorial assistance. We also thank B. Dossert for help with the apparatus and the staff of Laboratory Animal Resources of Syracuse University.
GRANTS
This study was supported by National Institute of Deafness and Other Communication Disorders Grant CD-01641.
APPENDIX
A single-compartment leaky integrate-and-fire model with time-and voltage-dependent conductances (Cook et al. 2003) was used.
The neuron model used to simulate the SFIE model can be expressed as
Parameter descriptions and values are listed in Table 1. The model inputs are arrival times of incoming excitatory or inhibitory discharges, tE and tI, respectively. When the membrane potential, V(t), exceeds a discharge threshold, θ, an action potential is marked in time as the model output. A dead time of 0.7 ms is used to simulate the absolute refractory period after each action potential.
TABLE 1.
Parameter values for the SFTE model
| Parameters | Description | Value |
|---|---|---|
| Cm/Gm | Ratio of membrane capacitance to membrane conductance for leakage | 0.5 ms |
| GE, G1 | Maximum membrane conductances for excitatory and inhibitory postsynaptic currents (EPSCs and IPSCs, respectively) | Adjusted to yield the strength of EPSPs and IPSPs as described in Fig. 8B |
| τE, τ1 | Time constants of EPSCs and IPSCs, respectively | Adjusted so that the decay time constants of evoked EPSPs and IPSPs were 0.5 and 2 ms |
| θ | Discharge threshold | 15 mV above the membrane’s resting potential |
| VE | Reversal potentials for EPSCs | 55 mV above the resting potential |
| V1 | Reversal potentials for IPSCs | Set equal to resting potential |
EPSP, excitatory postsynaptic potential; IPSP, inhibitory postsynaptic potential; EPSC, excitatory postsynaptic current; IPSC, inhibitory postsynaptic current.
References
- Banks MI, Sachs MB. Regularity analysis in a compartmental model of chopper units in the anteroventral cochlear nucleus. J Neurophysiol. 1991;65:606–629. doi: 10.1152/jn.1991.65.3.606. [DOI] [PubMed] [Google Scholar]
- Blackburn CC, Sachs MB. Classification of unit types in the anteroventral cochlear nucleus: PST histograms and regularity analysis. J Neurophysiol. 1989;62:1303–1329. doi: 10.1152/jn.1989.62.6.1303. [DOI] [PubMed] [Google Scholar]
- Blalock HM. Social Statistics. New York: McGraw-Hill; 1972. [Google Scholar]
- Brownell WE, Manis PB, Ritz LA. Ipsilateral inhibitory responses in the cat lateral superior olive. Brain Res. 1979;177:189–193. doi: 10.1016/0006-8993(79)90930-2. [DOI] [PMC free article] [PubMed] [Google Scholar]
- Cant NB, Hyson RL. Projections from the lateral nucleus of the trapezoid body to the medial superior olivary nucleus in the gerbil. Hear Res. 1992;58:26–34. doi: 10.1016/0378-5955(92)90005-8. [DOI] [PubMed] [Google Scholar]
- Cariani PA, Delgutte B. Neural correlates of the pitch of complex tones. I. Pitch and pitch salience. J Neurophysiol. 1996;76:1698–1716. doi: 10.1152/jn.1996.76.3.1698. [DOI] [PubMed] [Google Scholar]
- Carney LH, Heinz MG, Evilsizer ME, Gilkey RH, Colburn HS. Auditory phase opponency: a temporal model for masked detection at low frequencies. Acta Acustica United With Acustica. 2002;88:334–347. [Google Scholar]
- Caspary DM, Backoff PM, Finlayson PG, Palombi PS. Inhibitory inputs modulate discharge rate within frequency receptive fields of antero-ventral cochlear nucleus neurons. J Neurophysiol. 1994;72:2124–2133. doi: 10.1152/jn.1994.72.5.2124. [DOI] [PubMed] [Google Scholar]
- Cook DL, Schwindt PC, Grande LA, Spain WJ. Synaptic depression in the localization of sound. Nature. 2003;421:66–70. doi: 10.1038/nature01248. [DOI] [PubMed] [Google Scholar]
- Costalupes JA. Broadband masking noise and behavioral pure tone thresholds in cats. I. Comparison with detection thresholds. J Acoust Soc Am. 1983;74:758–764. doi: 10.1121/1.389863. [DOI] [PubMed] [Google Scholar]
- Costalupes JA. Representation of tones in noise in the responses of auditory nerve fibers in cats. I. Comparison with detection thresholds. J Neurosci. 1985;5:3261–3269. doi: 10.1523/JNEUROSCI.05-12-03261.1985. [DOI] [PMC free article] [PubMed] [Google Scholar]
- Frisina RD, Smith RL, Chamberlain SC. Encoding of amplitude modulation in the gerbil cochlear nucleus. I. A hierarchy of enhancement. Hear Res. 1990;44:99–122. doi: 10.1016/0378-5955(90)90074-y. [DOI] [PubMed] [Google Scholar]
- Geisler CD, Sinex DG. Responses of primary auditory fibers to combined noise and tonal stimuli. Hear Res. 1980;3:317–334. doi: 10.1016/0378-5955(80)90026-x. [DOI] [PubMed] [Google Scholar]
- Gibson DJ, Young ED, Costalupes JA. Similarity of dynamic range adjustment in auditory nerve and cochlear nuclei. J Neurophysiol. 1985;53:940–958. doi: 10.1152/jn.1985.53.4.940. [DOI] [PubMed] [Google Scholar]
- Gilkey RH, Robinson DE. Models of auditory masking: a molecular psychophysical approach. J Acoust Soc Am. 1986;79:1499–1510. doi: 10.1121/1.393676. [DOI] [PubMed] [Google Scholar]
- Goldberg JM, Brown PB. Response of binaural neurons of dog superior olivary complex to dichotic tonal stimuli: some physiological mechanisms of sound localization. J Neurophysiol. 1969;32:613–636. doi: 10.1152/jn.1969.32.4.613. [DOI] [PubMed] [Google Scholar]
- Greenwood DD, Goldberg JM. Response of neurons in the cochlear nuclei to variations in noise bandwidth and to tone-noise combinations. J Acoust Soc Am. 1970;47:1022–1040. doi: 10.1121/1.1912002. [DOI] [PubMed] [Google Scholar]
- Grothe B, Sanes DH. Bilateral inhibition by glycinergic afferents in the medial superior olive. J Neurophysiol. 1993;69:1192–1196. doi: 10.1152/jn.1993.69.4.1192. [DOI] [PubMed] [Google Scholar]
- Joris PX, Carney LH, Smith PH, Yin TC. Enhancement of neural synchronization in the anteroventral cochlear nucleus. I. Responses to tones at the characteristic frequency. J Neurophysiol. 1994;71:1022–1036. doi: 10.1152/jn.1994.71.3.1022. [DOI] [PubMed] [Google Scholar]
- Joris PX, Louage DHG, Cardoen L, van der Heijden M. Correlation index: a new metric to quantify temporal coding. Hear Res. 2006;216–217:19–30. doi: 10.1016/j.heares.2006.03.010. [DOI] [PubMed] [Google Scholar]
- Kidd G, Jr, Mason CR, Brantley MA, Owen GA. Roving-level tone-in-noise detection. J Acoust Soc Am. 1989;86:1310–1317. doi: 10.1121/1.398745. [DOI] [PubMed] [Google Scholar]
- Koch C. Biophysics of Computation: Information Processing in Single Neurons. New York: Oxford; 1999. pp. 423–426. [Google Scholar]
- Kopp-Scheinpflug C, Dehmel S, Dörrscheidt GJ, Rübsamen R. Interaction of excitation and inhibition in anteroventral cochlear nucleus neurons that receive large endbulb synaptic endings. J Neurosci. 2002;22:11004–11018. doi: 10.1523/JNEUROSCI.22-24-11004.2002. [DOI] [PMC free article] [PubMed] [Google Scholar]
- Lawson JL, Uhlenbeck GE. MIT Radiation Laboratory. New York: McGraw-Hill; 1950. Threshold Signals; p. 24. [Google Scholar]
- Lewis ER, Henry KR. Nonlinear effects of noise on phase-locked cochlear-nerve responses to sinusoidal stimuli. Hear Res. 1995;92:1–16. doi: 10.1016/0378-5955(95)00189-1. [DOI] [PubMed] [Google Scholar]
- Liberman MC. Auditory-nerve response from cats raised in a low-noise chamber. J Acoust Soc Am. 1978;63:442–455. doi: 10.1121/1.381736. [DOI] [PubMed] [Google Scholar]
- Liberman MC. Central projections of auditory-nerve fibers of differing spontaneous rate. I. Anteroventral cochlear nucleus. J Comp Neurol. 1991;313:240–258. doi: 10.1002/cne.903130205. [DOI] [PubMed] [Google Scholar]
- Louage DHG, van der Heijden M, Joris PX. Temporal properties of responses to broadband noise in the auditory nerve. J Neurophysiol. 2004;91:2051–2065. doi: 10.1152/jn.00816.2003. [DOI] [PubMed] [Google Scholar]
- Louage DHG, van der Heijden M, Joris PX. Enhanced temporal response properties of anteroventral cochlear nucleus neurons to broadband noise. J Neurosci. 2005;25:1560–1570. doi: 10.1523/JNEUROSCI.4742-04.2005. [DOI] [PMC free article] [PubMed] [Google Scholar]
- MacMillan NA, Creelman CD. Detection Theory: A User’s Guide. Mahwah, NJ: Lawrence Erlbaum Associates; 2005. [Google Scholar]
- Mainen ZF, Sejnowski TJ. Reliability of spike timing in neocortical neurons. Science. 1995;268:1503–1506. doi: 10.1126/science.7770778. [DOI] [PubMed] [Google Scholar]
- Mardia KV. Statistics of Directional Data: Probability and Mathematical Statistics. New York: Academic Press; 1972. [Google Scholar]
- Martin EM, West MF, Bedenbaugh PH. Masking and scrambling in the auditory thalamus of awake rats by Gaussian and modulated noises. Proc Natl Acad Sci USA. 2004;101:14961–14965. doi: 10.1073/pnas.0306879101. [DOI] [PMC free article] [PubMed] [Google Scholar]
- May BJ, Sachs MB. Dynamic range of neural rate responses in the ventral cochlear nucleus of awake cats. J Neurophysiol. 1992;68:1589–1602. doi: 10.1152/jn.1992.68.5.1589. [DOI] [PubMed] [Google Scholar]
- Miller MI, Barta PE, Sachs MB. Strategies for the representation of a tone in background noise in the temporal aspects of the discharge patterns of auditory-nerve fibers. J Acoust Soc Am. 1987;81:665–679. doi: 10.1121/1.394835. [DOI] [PubMed] [Google Scholar]
- Moller AR. Latency of unit responses in cochlear nucleus determined in two different ways. J Neurophysiol. 1975;38:812–821. doi: 10.1152/jn.1975.38.4.812. [DOI] [PubMed] [Google Scholar]
- Nelson PC, Carney LH. A phenomenological model of peripheral and central neural responses to amplitude-modulated tones. J Acoust Soc Am. 2004;116:2173–2186. doi: 10.1121/1.1784442. [DOI] [PMC free article] [PubMed] [Google Scholar]
- Palombi PS, Caspary DM. GABA inputs control discharge rate primarily within frequency receptive fields of inferior colliculus neurons. J Neurophysiol. 1996;75:2211–2219. doi: 10.1152/jn.1996.75.6.2211. [DOI] [PubMed] [Google Scholar]
- Ramachandran R, Davis KA, May BJ. Singe-unit responses in the inferior colliculus of decerebrate cats. I. Classification based on frequency response maps. J Neurophysiol. 1999;82:152–163. doi: 10.1152/jn.1999.82.1.152. [DOI] [PubMed] [Google Scholar]
- Rees A, Palmer AR. Rate-intensity functions and their modification by broadband noise for neurons in the guinea pig inferior colliculus. J Acoust Soc Am. 1988;83:1488–1498. doi: 10.1121/1.395904. [DOI] [PubMed] [Google Scholar]
- Rhode WS, Geisler CD, Kennedy DT. Auditory nerve fiber responses to wide-band noise and tone combinations. J Neurophysiol. 1978;41:692–704. doi: 10.1152/jn.1978.41.3.692. [DOI] [PubMed] [Google Scholar]
- Rhode WS, Greenberg S. Encoding of amplitude modulation in the cochlear nucleus of the cat. J Neurophysiol. 1994;71:1797–1825. doi: 10.1152/jn.1994.71.5.1797. [DOI] [PubMed] [Google Scholar]
- Richards VM. The detectability of a tone added to narrow bands of equal-energy noise. J Acoust Soc Am. 1992;91:3424–3435. doi: 10.1121/1.402831. [DOI] [PubMed] [Google Scholar]
- Rothman JS, Young ED, Manis PB. Convergence of auditory nerve fibers onto bushy cells in the ventral cochlear nucleus: implications of a computational model. J Neurophysiol. 1993;70:2562–2583. doi: 10.1152/jn.1993.70.6.2562. [DOI] [PubMed] [Google Scholar]
- Smith AJ, Owens S, Forsythe ID. Characterisation of inhibitory and excitatory postsynaptic currents of the rat medial superior olive. J Physiol. 2000;529:681–698. doi: 10.1111/j.1469-7793.2000.00681.x. [DOI] [PMC free article] [PubMed] [Google Scholar]
- van Gisbergen JAM, Grashuis JL, Johannesma PIM, Vendrik AJH. Neurons in the cochlear nucleus investigated with tone and noise stimuli. Exp Brain Res. 1975;23:387–406. doi: 10.1007/BF00238022. [DOI] [PubMed] [Google Scholar]
- Wickesberg RE, Oertel D. Delayed, frequency-specific inhibition in the cochlear nuclei of mice: a mechanism for monaural echo suppression. J Neurosci. 1990;10:1762–1768. doi: 10.1523/JNEUROSCI.10-06-01762.1990. [DOI] [PMC free article] [PubMed] [Google Scholar]
- Wier CC, Green DM, Hafter ER, Burkhardt S. Detection of a tone burst in continuous- and gated-noise maskers; defects of signal frequency, duration, and masker level. J Acoust Soc Am. 1977;61:1298–1300. doi: 10.1121/1.381432. [DOI] [PubMed] [Google Scholar]
- Wu SH, Kelly JB. Physiological evidence for ipsilateral inhibition in the lateral superior olive: synaptic responses in mouse brain slice. Hear Res. 1994;73:57–64. doi: 10.1016/0378-5955(94)90282-8. [DOI] [PubMed] [Google Scholar]
- Wu SH, Ma CL, Kelly JB. Contribution of AMPA, NMDA, and GABAA receptors to temporal pattern of postsynaptic responses in the inferior colliculus of the rat. J Neurosci. 2004;24:4625–4634. doi: 10.1523/JNEUROSCI.0318-04.2004. [DOI] [PMC free article] [PubMed] [Google Scholar]
- Young ED, Barta PE. Rate responses of auditory nerve fibers to tones in noise near masked threshold. J Acoust Soc Am. 1986;79:426–442. doi: 10.1121/1.393530. [DOI] [PubMed] [Google Scholar]
- Young ED, Robert JM, Shofner WP. Regularity and latency of units in ventral cochlear nucleus: implications for unit classification and generation of response properties. J Neurophysiol. 1988;60:1–29. doi: 10.1152/jn.1988.60.1.1. [DOI] [PubMed] [Google Scholar]
- Zheng L, Early SJ, Mason CR, Idrobo F, Harrison JM, Carney LH. Binaural detection with narrowband and wideband reproducible noise maskers. II. Results for rabbit. J Acoust Soc Am. 2002;111:346–356. doi: 10.1121/1.1423930. [DOI] [PubMed] [Google Scholar]