Abstract
Quantitative evaluation of cardiac image data obtained using multidetector row computed tomography (CT) is compromised by partial scan reconstructions, which improve the temporal resolution but significantly increase image-to-image CT number variations for a fixed region of interest compared to full reconstruction images. The feasibility of a new approach to solve this problem is assessed. An anthropomorphic cardiac phantom and an anesthetized pig were scanned on a dual-source CT scanner using both full and partial scan acquisition modes under different conditions. Additional scans were conducted with the electrocardiogram (ECG) signal being in synchrony with the gantry rotation. In the animal study, a simple x-ray detector was used to generate a signal once per gantry rotation. This signal was then used to pace the pig’s heart. Phantom studies demonstrated that partial scan artifacts are strongly dependent on the rotational symmetry of angular projections, which is determined by the object shape and composition and its position with respect to the isocenter. The degree of partial scan artifacts also depends on the location of the region of interest with respect to highly attenuating materials (bones, iodine, etc.) within the object. Single-source partial scan images (165 ms temporal resolution) were significantly less affected by partial scan artifacts compared to dual-source partial scan images (82 ms temporal resolution). When the ECG signal was in synchrony with the gantry rotation, the same cardiac phase always corresponded to the same positions of the x-ray tube(s) and, hence, the same scattering and beam hardening geometry. As a result, the range of image-to-image CT number variations for partial scan reconstruction images acquired in synchronized mode was decreased to that achieved using full reconstruction image data. The success of the new approach, which synchronizes the ECG signal with the position of the x-ray tube(s), was demonstrated both in the phantom and animal experiments.
Keywords: multidetector row CT, CT perfusion, partial scan reconstruction, cardiac CT, CT artifacts
I. INTRODUCTION
Cardiac computed tomography (CT) is a valuable noninvasive tool for the evaluation of cardiac anatomy and function.1–11 Quantitative clinical applications of cardiac CT currently include stenosis size determination12–15 and, to a lesser extent, plaque composition.16,17 Morphological imaging of cardiac chamber and valve dimensions and motion18 are also important diagnostic tools. All of these applications rely to some degree on accurate CT numbers. Additionally, myocardial perfusion CT has been successfully used to study pathological changes in myocardial microvascular function, which may indicate early stages of coronary artery disease, myocardial hypertrophy, cardiomyopathy, or systemic diseases such as arterial hypertension.19–21 Myocardial perfusion CT has been performed primarily using electron beam CT (EBCT) technology because of its superior temporal resolution,22,23 allowing quantitative analysis of myocardial permeability and myocardial intravascular volume to detect small changes caused by endothelial dysfunction and early atherosclerosis.24–27 Unlike current clinical applications of cardiac CT, myocardial perfusion imaging is extremely dependent on accurate CT numbers.
Due to certain limitations and inherent disadvantages of the EBCT technology, it is no longer considered adequate for state-of-the-art cardiac imaging or general radiology applications. In contrast, multidetector row CT (MDCT) has made significant progress in cardiac CT over the last 10 years and, with the recent introduction of the dual-source CT scanner (Definition, Siemens Medical Solutions, Forchheim, Germany) that is capable of 82 ms temporal resolution,28 quantitative cardiac CT applications, such as myocardial perfusion imaging, can be transitioned from EBCT to MDCT.
A recent myocardial perfusion study using a porcine model29 showed a good correlation between MDCT (Sensation 64, Siemens Medical Solutions, Forchheim, Germany) and EBCT (C-150, Imatron Corp., San Francisco, CA) when using the Patlak model.30 However, the MDCT assessments of myocardial permeability and intravascular volume using a gamma-variate analysis of indicator-dilution curves27,31 did not correlate well with the EBCT results, which had been previously validated against radioactive microsphere measurements,25 the current gold standard. We hypothesize that this lack of correlation between MDCT and EBCT was caused by partial scan artifacts, explained below, which specifically affect the myocardial perfusion data acquired with MDCT.
Since myocardial perfusion CT during the transient passage of a bolus of intravascular contrast agent requires a temporal resolution sufficient to “freeze” cardiac motion, it employs partial scan reconstruction algorithms, which use only a portion (180° +fan angle) of the projection data to reconstruct an image32 and can improve the temporal resolution close to the isocenter by a factor of 2.33 Theoretically, a partial scan algorithm can produce an exact reconstruction of any object inside the field of view. However, experimental projection values are never exactly identical to the ideal line integrals of attenuation coefficients due to the presence of effects such as scatter and beam hardening, even if such effects are minor. Therefore, there always exist a difference between the ideal theoretical set of projection values (line integrals) and the real experimental set of projection values. In cardiac MDCT, this difference can vary for images corresponding to different heart cycles because the position of the partial scan source trajectory with respect to the anatomy changes from one heart cycle to another. On the contrary, for full scan reconstructions, the differences between the ideal and real projection values still exist but do not change from one heartbeat to another.
Thus, partial scan artifacts are a manifestation of image artifacts (scatter, beam hardening, etc.) which vary from one heart cycle to another due to different positions of the partial scan source trajectory relative to the anatomy. For a set of partial scan reconstruction images, this causes a significant increase in image-to image variation of the mean CT number within a spatially fixed (with respect to the scan plane) region of interest compared to the corresponding set of full reconstruction images. The increased CT number variations can have a detrimental effect on all quantitative applications of cardiac MDCT, but especially on myocardial perfusion imaging since it is extremely dependent on accurate CT numbers. EBCT, by its design,22,23 ensures that partial scan reconstructions always originate from the same set of angular projections. Therefore, myocardial perfusion data acquired with EBCT are not affected by angle-dependent partial scan artifacts.
Solving the partial scan problem for MDCT requires either the use of full (360°) reconstructions or the use of only a specific range of x-ray tube positions for image reconstruction. For cardiac imaging, both options are undesirable. Full scan reconstructions increase the temporal window associated with each image, degrading temporal resolution; reconstructing images only for a given set of projections limits the position in the cardiac cycle where reconstruction can occur. We have devised and implemented a novel idea to provide accurate partial scan reconstruction at any position in the cardiac cycle.
The purpose of this study was twofold: (i) to use an anthropomorphic model to quantitate the magnitude of partial scan artifacts; and (ii) to use an animal model to assess the feasibility of a new method to reduce or eliminate partial scan artifacts. The premise of our initial implementation, in animals, is to use external pacing to synchronize the animal’s heart rate with the position of the x-ray tube(s). We used a simple x-ray detector to generate a signal once per gantry rotation. This signal was then used to pace the animal’s heart. In this manner, we ensure that for any cardiac phase we wish to reconstruct, the rotating x-ray tube(s) cover the same angular region in every heartbeat. This provides consistent projection data for each reconstruction and reduces the image-to-image variation in CT numbers due to partial scan artifacts. In this paper, we demonstrate the success of this approach using both an anthropomorphic cardiac phantom and an anesthetized pig.
Although the synchronization technique is proposed specifically for animal research, it may have some clinical relevance. Further work specifically devoted to the clinical impact of partial scan artifacts on myocardial perfusion using MDCT is currently underway.
II. MATERIALS AND METHODS
II.A. Water phantom
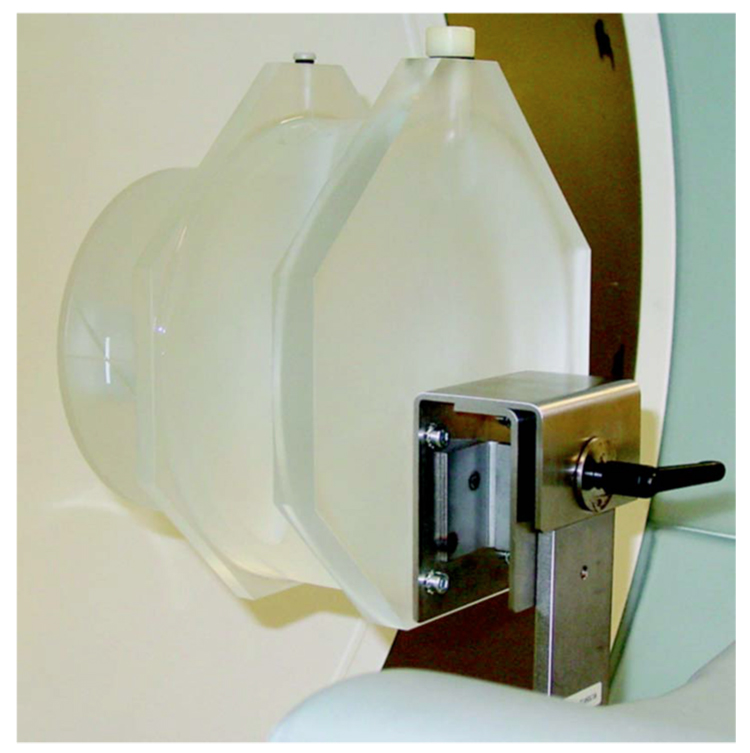
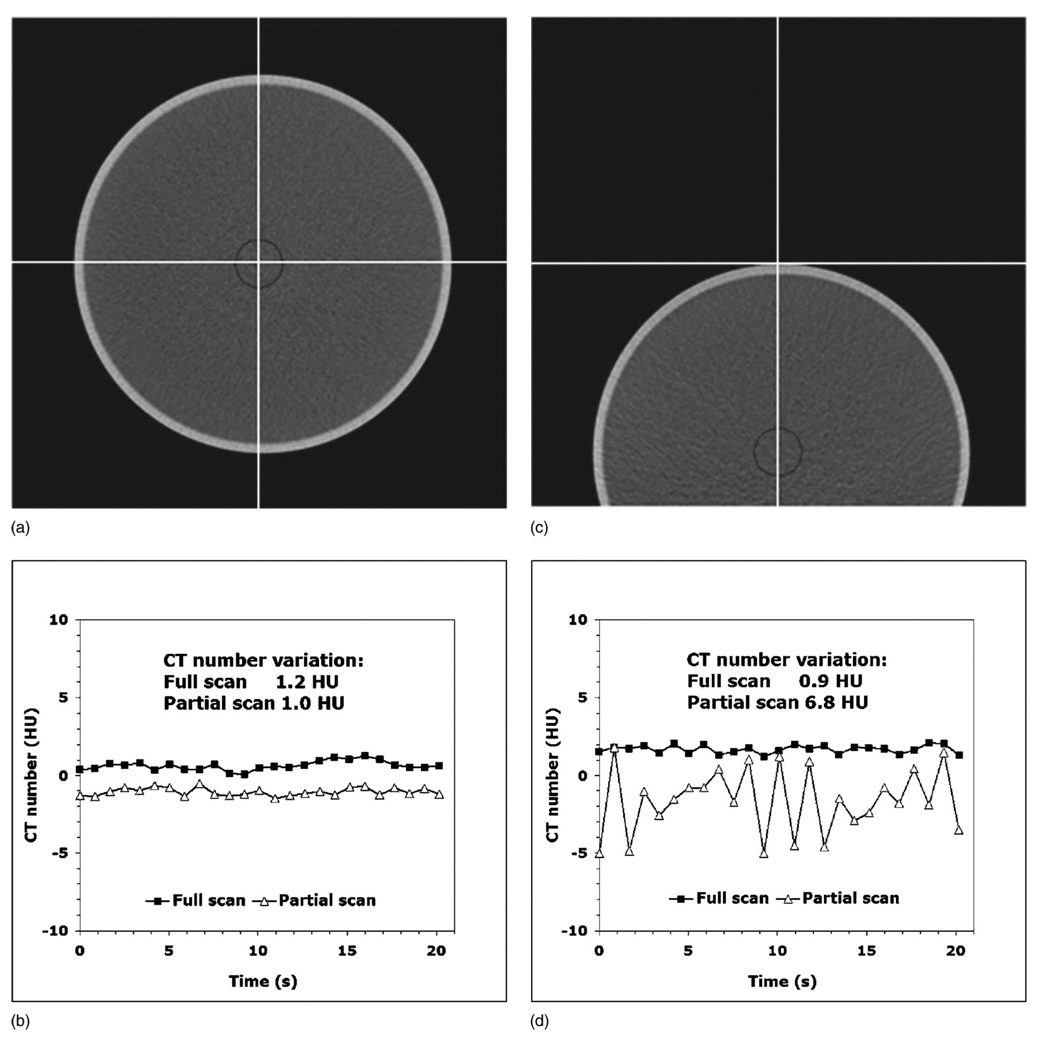
To illustrate the underlying principle of partial scan artifacts, a cylindrical water phantom, 20 cm in diameter, was placed at the isocenter of the dual-source 64-slice scanner (Definition, Siemens Medical Solutions, Forchheim, Germany) without any table attenuation (Fig. 1) and scanned without table movement. Images were reconstructed using both full and partial scan techniques. In this perfectly symmetric scattering geometry, all partial scan reconstructions are equivalent and no partial scan artifacts are expected. A second set of data was obtained with the phantom positioned 10 cm off isocenter, when the geometry was no longer rotationally symmetric.
FIG. 1.
A phantom used for daily water calibrations of the scanner. The water-filled, 20 cm diameter section of this phantom was used. The cantilevered design ensures no table attenuation is present in the scan plane.
Both full and partial scan image data were acquired in the sequential (nonspiral) mode with zero table feed, 0.33 s rotation time, and 24 × 1.2 mm collimation (used for clinical perfusion protocols due to its wider z-coverage) using prospective ECG-triggering with the ECG signal (70 bpm) generated by an external ECG simulator. The data were collected for 25 consecutive “heart” cycles (~20 s). The full scan (330 ms temporal resolution) acquisitions were performed using the single tube mode with 120 kVp and 100 mAs, while the partial scan (82 ms temporal resolution) data were acquired using the dual tube mode with 120 kVp and 240 mAs. The mAs value for the partial scan acquisitions was chosen to approximately match the noise level of the full scan acquisitions. The mAs value indicated on the scanner’s console for the dual-source cardiac sequential scan is calculated using the total tube current (sum of both tubes) multiplied by the scan acquisition time of 0.2 s (the time that tube A is energized to ensure the data completion). Therefore, each tube is operating at (240/2) / 0.2=600 mA tube current. Since each tube contributes only one quarter of a rotation of the projection data to the reconstructed images, the combined mAs used in a dual-source partial scan image is equal to 2 × (600 × 0.33/4)=99 mAs, which is very close to the 100 mAs used in a single-source full reconstruction image.
The noise level (standard deviation within the region of interest, ROI) for the water phantom at isocenter was measured for both full scan and partial scan reconstructed images. The average noise level over the entire dataset (25 images) was 11.46 HU for full scan reconstructions and 11.53 HU for partial scan reconstructions. Image reconstruction was performed using the B35 kernel, 2.4 mm slice thickness, and a 260-mm field of view (FOV). For the partial scan reconstructions, this is the maximum FOV where the data from both x-ray tubes are used to reconstruct an image. Images corresponding to the same z-axis location (closest to the center of the detector) were chosen to avoid any issues related to the cone beam artifacts.34,35 All four data sets (partial and full scan reconstructions, at and off isocenter) were evaluated using a 25 mm diameter circular ROI placed in the center of the phantom. For each data set, the mean CT number measured within the ROI as a function of time was recorded for all images (one image per heart cycle). The range of image-to-image variations in the mean CT number was determined for each data set as a difference between the maximum and minimum CT numbers.
II.B. Anthropomorphic cardiac phantom
II.B.1. Effect of anisotropy
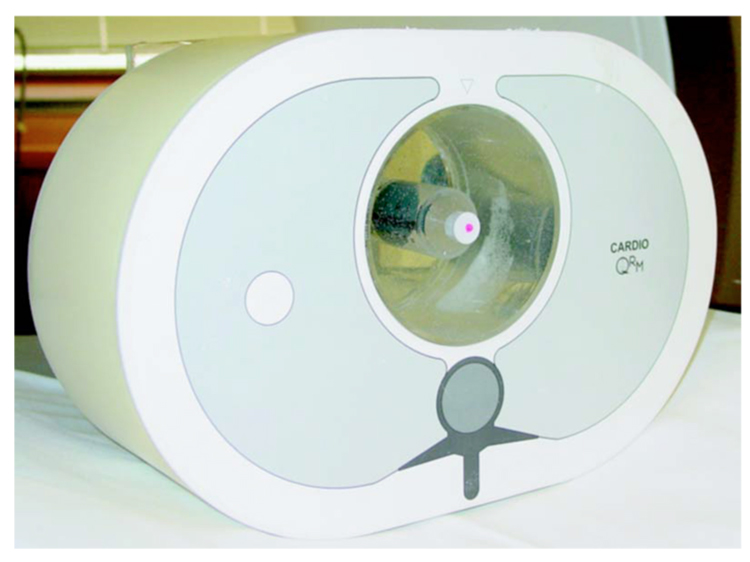
This set of experiments was performed to test the hypothesis that the magnitude of partial scan artifacts depends on the degree of anisotropy in the projection data, where anisotropy of angular projections can be defined as a variation in a specific detector element value as a function of source position. To simulate the scanning conditions resulting in different amount of anisotropy of angular projections, the 10 cm central portion of an anthropomorphic cardiac phantom (QRM, Möhrendorf, Germany) was replaced with a water-filled tank containing a syringe centered in the middle of the tank (Fig. 2). Data were obtained when the syringe was filled with water and one of four iodine solutions (500, 1000, 1500, and 2000 HU). Both full and partial scan acquisitions were performed with the phantom located at the isocenter and 10 cm off isocenter (total of 20 data sets). All acquisition parameters were as described in the previous section.
FIG. 2.
An anthropomorphic cardiac phantom (QRM, Möhrendorf, Germany) with its central portion replaced with a water-filled tank. The syringe centered in the middle of the tank was filled with water and iodine solutions.
II.B.2. Effect of heart rate and dual versus single source
To determine the dependence (if any) of partial scan artifacts on the heart rate or dual-source versus single-source acquisition mode, additional data were collected using one iodine concentration (1500 HU) and four different heart rates (60, 70, 80, and 90 bpm, generated by an external ECG simulator). For each heart rate, both “quarter-scan” (two tubes, 82 ms temporal resolution) and “half-scan” (single tube, 165 ms temporal resolution) data were acquired with the phantom located at the isocenter. The acquisition parameters for the quarter-scan data were as described in the previous section. The half-scan data were acquired using a single-source retrospective ECG-gated perfusion (zero table feed) mode with 0.33 s rotation time, 24 × 1.2 mm collimation, 120 kVp, and 170 mAs. The mAs value was chosen to approximately match the noise level of the quarter-scan images. For different heart rates, data were collected for different numbers of consecutive heart cycles to allow for the total acquisition time of each scan to be approximately 50 s. Two additional quarter-scan acquisitions corresponding to heart rates of 60.6 and 90.9 bpm were performed using the simulated ECG signal, which was in synchrony with the gantry rotation (described in the next section). Therefore, a total of 10 data sets were obtained.
For all cardiac phantom data, the images were reconstructed as described in the previous section. The same z-axis location (closest to the center of the detector) was evaluated for all data sets, and four circular ROIs, 20 mm in diameter, were placed symmetrically above, below, and on both sides of the syringe. For each data set, the mean CT numbers measured within each ROI were recorded as a function of time for all images (one image per heart cycle). The range of image-to-image variations in the mean CT number was determined for each data set and each ROI as the difference between the maximum and minimum CT numbers.
II.C. Synchronization with the gantry rotation
To synchronize the heart rate with the gantry rotation, the angular positions of the x-ray tubes, as they rotated about isocenter, were determined using a solid state x-ray detector (model 07–451, Nuclear Associates, Carle Place, NY) positioned close to the edge of the scan plane at the bottom of the gantry. The x-ray detector was connected to a transducer amplifier (PM1000, CWE, Inc., Ardmore, PA) configured as a single-ended dc amplifier for low-pass filtering and amplification. Edge detection and pulse shaping of the signal was provided by a function generator (model 7260 Generator, Exact Electronics, Hillsboro, OR) configured as an externally triggered, non-retriggering, monostable multivibrator. The function generator’s trigger pulse length was set just below the integer multiple of the gantry rotation period, so that three different heart rate synchronizations could be implemented. Since the gantry rotation time was 330 ms, synchronization of the gantry rotation to cardiac-cycle periods of 330, 660, and 990 ms was possible, corresponding to heart rates of 181.8, 90.9, and 60.6 bpm, respectively. The rising edge of the function generator output was utilized to trigger both channels of a dual-channel stimulator (S8800B, Grass Instruments, Quincy, MA). The first channel was configured to generate a 50 ms pulse with amplitude of ~5 V. This signal was attenuated to approximately 1 mV and connected to the scanner’s ECG input, providing an “ECG” signal that was synchronized to the position of the x-ray tubes. The second channel of the S8800B was configured to pace the pig’s heart in the animal experiment. Pulse durations of 10 ms, ranging from 6 to 12 V were adequate to achieve pacing. This signal was routed through an isolation unit (SIU5 Stimulus Isolation Unit, Grass Instruments, Quincy, MA) for electrical isolation and then connected to the pig’s pacing catheter. This pacing method provided synchronization of the pig’s cardiac cycle to the angular position of the x-ray sources.
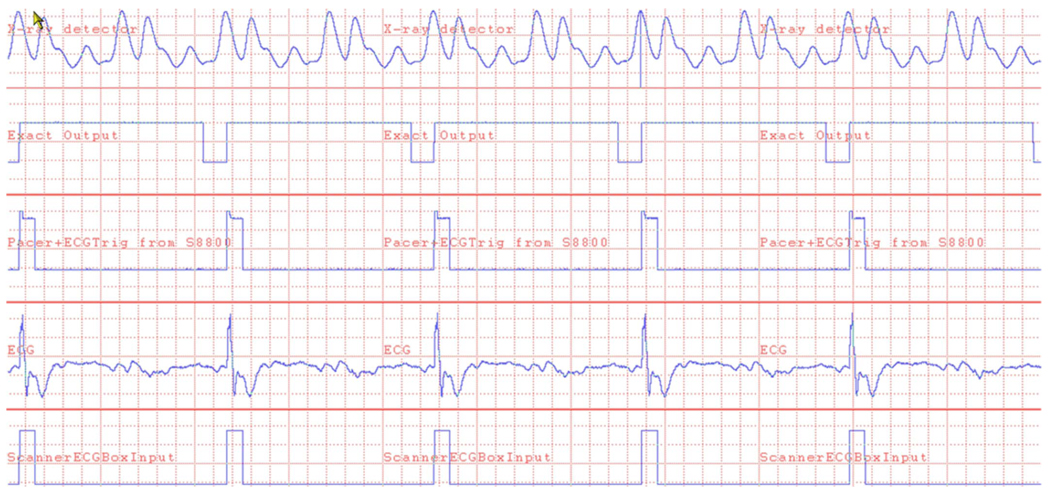
A multichannel data acquisition system (model DI-430, DATAQ Instruments, Akron, OH and PDS PC, Oconomowoc, WI) was used to record the various signals mentioned above to verify proper operation and synchronization throughout the study. Figure 3 shows an example of the recorded signals under synchronized operation at a heart rate of 90.9 bpm.
FIG. 3.
Signals recorded during synchronous operation of the scanner with cardiac pacing at 90.9 bpm. Time scale is 60 ms/division. The rising edge of the x-ray detector signal (top trace) triggers the Exact Output signal, generating the 600 ms pulse which “covers up” the second set of x-ray pulses. The rising edge of the Exact Output signal triggers the S8800 Pacer & ECGTrig. The resulting pacing of the pig’s heart is shown in the ECG line. The bottom trace is the signal sent to the scanner’s ECG input.
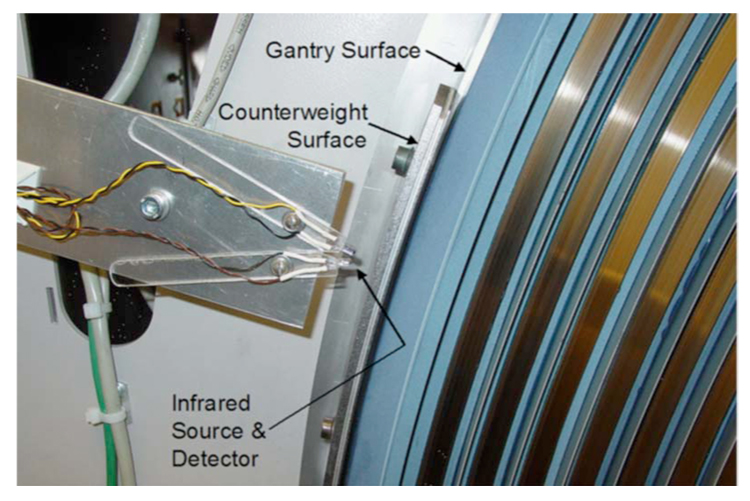
Subsequent to successful implementation of synchronized operation using the x-ray detector, a more robust method of x-ray source position detection was developed and implemented. The position of the rotating x-ray tubes was determined by detecting the reflection of infrared light from one of the counterweights mounted on the gantry (Fig. 4). This method generates a signal once for every gantry rotation, which is processed similarly to the x-ray detector’s signal described above, with the exception of the analog filtering and amplification steps.
FIG. 4.
Photograph of the x-ray tube position detector installed on the scanner. The infrared source and detector are mounted on Plexiglas “fingers” that swivel to provide alignment of the source and detector so that reflection from the counterweight is reliably detected, but reflections off of the gantry surface are ignored.
II.D. Animal study
The animal study was approved by the Institutional Animal Care and Use Committee. The pig (weight 35.6 kg) was intubated with intramuscular induction of ketamine (12.5 mg/kg) and xylaxine (2 mg/kg) and mechanically ventilated. The anesthesia was maintained during the entire study using intravenous ketamine (4 mg/kg), fentanyl (0.04 mg/kg), and etomidate (0.15 mg/kg) in normal saline (2–3 mL/min). The right internal jugular vein was exposed and cannulated with a 7-Fr sheath under fluoroscopy. A 6-Fr bipolar pacing catheter was inserted via the right internal jugular vein and positioned in the coronary sinus to confirm the scan location and pace the heart when necessary. The left internal jugular vein was exposed and cannulated with 7-Fr sheath. Under fluoroscopic guidance a “halo” 6-Fr pigtail catheter was inserted via the left internal jugular vein and positioned in the pulmonary artery for injection of contrast agent. An IV bolus of heparin (5000 units) was injected followed by a continuous infusion of heparin (1000 units/h) in saline. The left common carotid artery was cannulated with a 9-F sheath. A short 8-Fr single lumen coronary guiding catheter was positioned, via the left common carotid artery, in the proximal left anterior descending coronary artery (LAD) between its ostium and the first diagonal branch (monitored by fluoroscopy), allowing for selective infusions of contrast to define the LAD-perfused region. A 2.2-Fr single lumen infusion catheter was advanced into the proximal LAD for microsphere injection. A bilateral vagotomy was performed and electrodes placed on the caudal end of the vagus nerves for electrical stimulation, thereby slowing the heart rate when necessary. Once catheterized, the pig was placed in a supine position within the scanner with the long axis of the left ventricle oriented approximately perpendicular to the scan plane. Electrodes on the limbs were used to monitor the ECG signal, which was also used by the scanner for the nonsynchronized acquisitions.
For the scanning protocol, we did not employ the prospective ECG-triggering mode used for the phantom studies, since it did not allow image reconstruction at multiple cardiac phases. A dual-source (82 ms) ECG-gated perfusion mode with zero table feed and continuous x-ray exposure was not available on the scanner at the time. To acquire ECG-gated data without table motion that could retrospectively be reconstructed at any phase of the cardiac cycle, we used the dual-source ECG-gated spiral mode and kept the pig in the same position with respect to the gantry by placing it on a custom-made table that remained stationary when the scanner table top was moved during the spiral scan. Animal breathing was suspended during all scans using a large animal ventilator (model 613; Harvard Apparatus, Holliston, MA).
Spiral scanning was performed using 80 kVp (to increase the iodine signal) and 250 mAs/rotation (sum of both tubes), 0.33 s rotation time, 24 × 1.2 collimation, and 0.2 pitch. The use of 1.2 mm detector collimation is consistent with clinical perfusion CT scan protocols, which do not require submillimeter image slice widths. In spite of our use of a spiral scan mode, the pig remained stationary in the scan plane for all scans. The first two scans were performed in the absence of iodine contrast and lasted approximately 20 s each. The first scan was done with the pig’s natural heart rate, while the second scan was done when the animal’s heart rate was synchronized to the gantry rotation rate at 90.9 bpm. For the last two scans, a 0.33 mL/kg bolus of contrast medium iopamidol (Isovue-370, Bracco Diagnostics Inc., Princeton, NJ) was injected over 2 s into the pulmonary artery 4 s prior to the scan. These scans were approximately 40 s each and lasted during the transient myocardial opacification and the wash-out phase. The first contrast scan was done with the pig’s natural heart rate and the second with the animal’s heart rate synchronized to the gantry rotation rate at 181.8 bpm. Therefore, a total of four perfusion scans were performed for the animal study. For the contrast-enhanced nonsynchronized scan, the heart rate varied from 85 to 96 bpm, with the mean value being 89.9 bpm. For the noncontrast nonsynchronized scan, the heart rate varied from 95 to 109 bpm (with a single ectopic beat at 162 bpm), with the mean value being 107 bpm.
For all scans, images were reconstructed at the “−83 ms “ phase (83 ms before the R-wave peak) using a 180 mm FOV, B35 kernel, 5 mm slice thickness, and 0.5 mm reconstruction interval. A very small reconstruction interval was necessary in order to carefully select the spiral images from different heart cycles corresponding to the same anatomical level. Exact matching of the anatomic scan level was facilitated by a thin metallic marker placed on the table surface. This marker provided a stationary reference point by which the precise z-axis location of an image could be identified. After the images corresponding to the middle of the left ventricle (LV) were selected, a ROI was placed in the anterior LV myocardium. For each scan, the mean CT number corresponding to the chosen ROI was recorded as a function of time for all images (one image per heart cycle).
After the study was completed, the anesthetized animal was heparinized and euthanized with sodium pentobarbital.
III. RESULTS
III.A. Water phantom
When the water phantom was aligned exactly at the isocenter [Fig. 5(a)], the range of image-to-image variations in the mean CT number for both full and partial scans [Fig. 5(b)] was essentially identical (1.0 and 1.2 HU). However, when the phantom was located 10 cm off isocenter [Fig. 5(c)], the partial scan acquisition produced a 7.6 times larger range of the CT number variations [Fig. 5(d)] compared to the full scan data (6.8 versus 0.9 HU).
FIG. 5.
(a) The water phantom aligned exactly at the isocenter without table attenuation. (b) In this perfectly symmetric setting, both full and partial scan reconstruction images have the same range of the CT number variations. (c) The water phantom located 10 cm off the isocenter. (d) Moving the phantom off the isocenter creates enough anisotropy to cause partial scan artifacts. The partial scan has a 7.6 times larger range of CT number variations compared to the full scan.
III.B. Anthropomorphic cardiac phantom
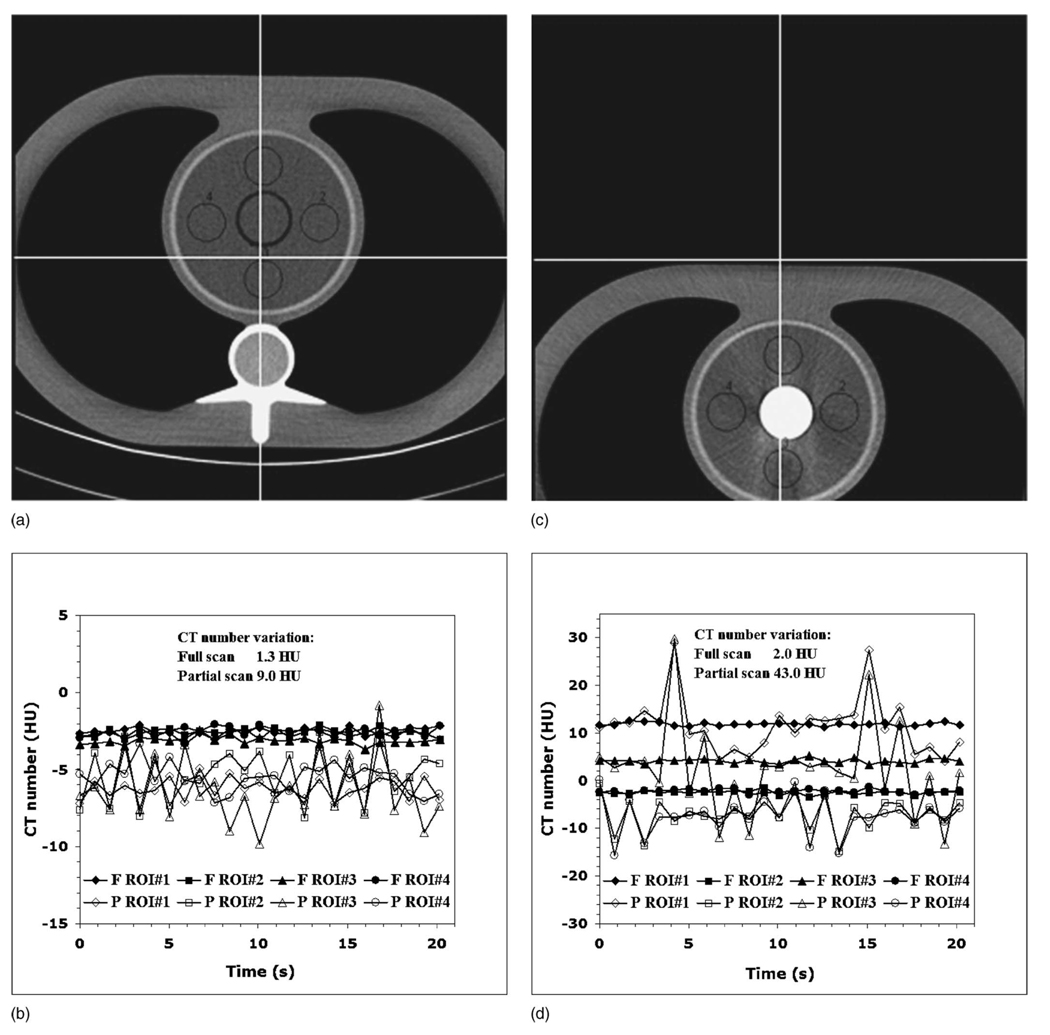
For the first set of experiments (effect of anisotropy of angular projections), the partial scan artifacts were smallest in magnitude when the cardiac phantom was aligned at the isocenter and the syringe was filled with water [Fig. 6(a)]. The ranges of the CT number variations for ROI 1, ROI 2, ROI 3, and ROI 4 were, respectively, 2.3, 5.6, 9.0, and 3.9 HU for the partial scan data and 1.3, 0.9, 1.2, and 0.9 HU for the full scan data [Fig. 6(b)]. Thus, even for the phantom at the isocenter, the partial scan artifacts accounted for up to a 7.5 times (for ROI 3) larger range of the CT number variations compared to the full scan data, due to the lack of rotational symmetry in this simple thorax phantom.
FIG. 6.
(a) The cardiac phantom with the water-filled syringe aligned at scanner isocenter. (b) The phantom geometry has enough anisotropy to cause mild to moderate partial scan artifacts, depending on the ROI location. (c) The cardiac phantom with the iodine-filled (2000 HU) syringe located 10 cm off the isocenter. (d) This geometry has large anisotropy, resulting in moderate to severe partial scan artifacts, depending on the ROI location.
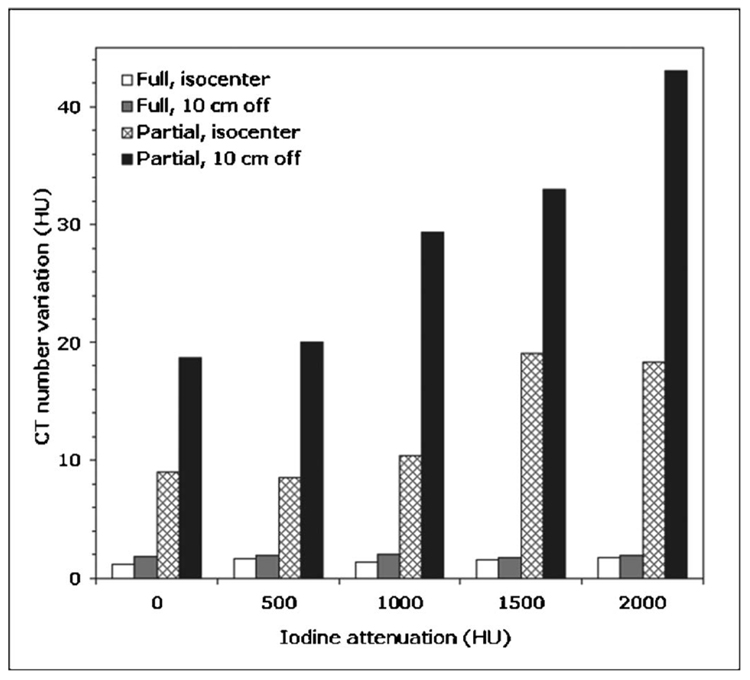
The largest manifestation of the partial scan artifact was observed when the cardiac phantom was located 10 cm off isocenter and the syringe was filled with 2000 HU iodine solution [Fig. 6(c)]. This worst case scenario resulted in the CT number variations for the ROI 1, ROI 2, ROI 3, and ROI 4, which were, respectively, 19.6, 7.1, 22.8, and 9.2 times larger for the partial scan data compared to the full scan data [Fig. 6(d)]. The results for all 20 data sets are summarized in the bar plot shown in Fig. 7.
FIG. 7.
The maximum range of the image-to-image variations in a mean CT number for any evaluated ROI for full and partial scans of the cardiac phantom located at isocenter and 10 cm off the isocenter, as a function of the iodine attenuation inside the phantom.
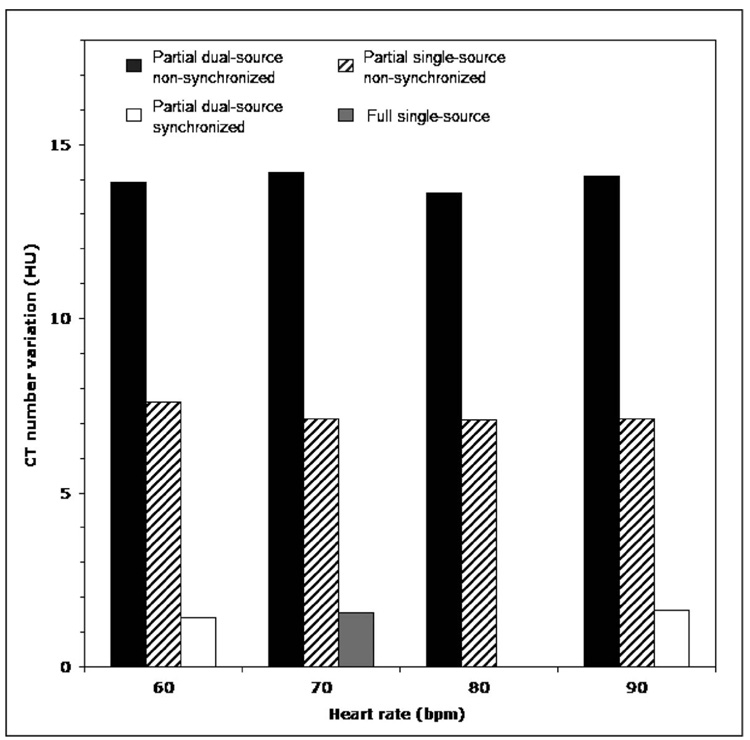
The second set of experiments (effect of heart rate and dual versus single source) performed with the constant iodine concentration showed that the degree of the partial scan artifact was significantly less for the single-source partial scan (165 ms) compared to the dual-source partial scan (82 ms). However, it did not change significantly for different heart rates when the ECG synchronization was not used. The maximum range of the CT number variations for any evaluated ROI was 7.6, 7.1, 7.1, 7.1 (165 ms data) and 13.9, 14.2, 13.6, 14.1 HU (82 ms data) for the heart rates of 60, 70, 80, and 90 bpm, respectively. However, for the partial scan acquisitions with 60.6 and 90.9 bpm heart rate, when the ECG-signal was synchronized to the gantry rotation rate, the maximum range of the CT number variations drastically reduced to only 1.4 and 1.6 HU. For comparison, the full scan data corresponding to the same iodine density demonstrated a maximum range of the CT number variations of 1.6 HU. The results for all ten data sets are summarized in the bar plot shown in Fig. 8.
FIG. 8.
The maximum range of the image-to-image variations in a mean CT number for any evaluated ROI for synchronized and nonsynchronized partial scans of the cardiac phantom, as a function of the heart rate. The phantom was centered at the isocenter. The synchronized scans were performed for heart rate of 60.6 and 90.9 bpm.
III.C. Animal study
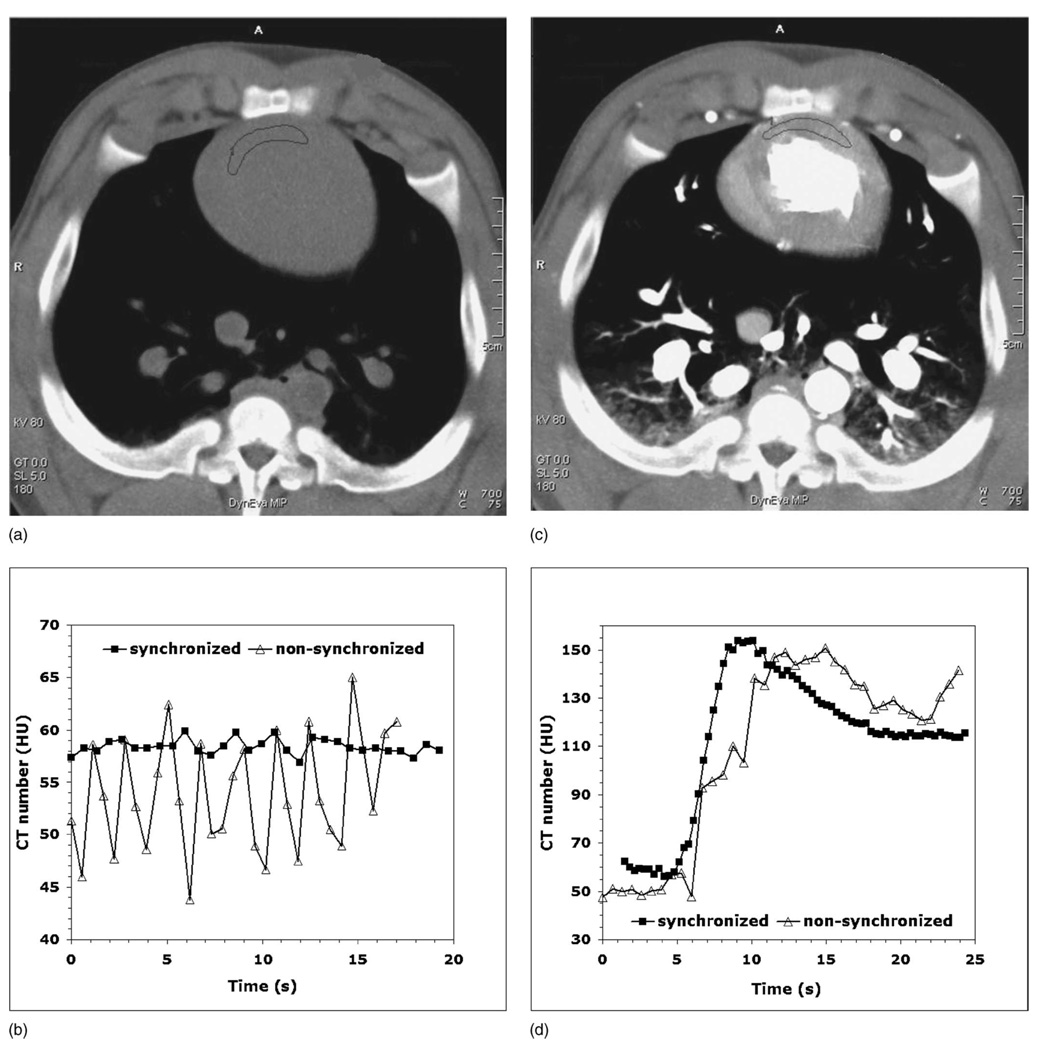
Figures 9(a) and 9(c) show the animal perfusion images in the absence of iodine contrast and with the contrast enhancement of the myocardium, while Figs. 9(b) and 9(d) demonstrate the corresponding perfusion data (CT number versus time) obtained both with and without synchronization of the heart rate to the gantry rotation rate. In the absence of contrast, the range of the CT number variations was reduced from 20 HU down to 3 HU by synchronization of the animal’s ECG to the gantry rotation [Fig. 9(b)]. The myocardial perfusion data obtained with contrast enhancement were significantly degraded by the CT number variations when partial scan reconstructions without ECG-gantry synchronization were used. However, these variations were eliminated when using the synchronization mode, which resulted in a high-quality contrast enhancement curve [Fig. 9(d)].
FIG. 9.
(a) Maximum intensity projection (MIP) image from the animal study in the absence of iodine contrast. (b) Noncontrast data show a drastic reduction in the CT number variations for the synchronized mode (square). (c) MIP image with the contrast enhancement of the myocardium (d) Myocardial perfusion data for the nonsynchronized mode (triangle) are degraded by partial scan artifacts.
IV. DISCUSSION
The water phantom results clearly demonstrate that partial scan artifacts are caused by the combination of two conditions. The first condition is that partial scans use only the portion (180° +fan angle) of the projection data compared to the 360° of data used for the full scan reconstruction. The second condition is the anisotropy of angular projections. As demonstrated in Fig. 7, full reconstruction images show minimal CT number variations (1.3–2.1 HU), even for very anisotropic settings (e.g., 2000 HU iodine solution 10 cm off isocenter). Additionally, partial scans obtained in perfectly isotropic settings (water phantom at the isocenter) show very little variation in CT numbers as demonstrated in Fig. 5(b). However, when partial scans are performed in anisotropic conditions, partial scan artifacts occur. Figure 5(d) shows that moving the perfectly symmetric water phantom 10 cm off the isocenter creates enough anisotropy in angular projections to increase the range of the CT number variations 7.6 times compared to full scans. The anisotropy of angular projections depends on the object shape and its position with respect to the isocenter, as well as the presence and location of highly attenuating materials (bones, iodine, etc.) within the object. When we enhanced the anisotropy of angular projections, either by using a higher concentration iodine solution or by moving the phantom off the isocenter, partial scan artifacts increased, as shown in Fig. 7. The degree of the partial scan artifact also depends on the ROI location with respect to highly attenuating materials present within the object. For example, the range of the CT number variations for four ROIs shown in Fig. 6(d) was 43.0 HU for ROI 3 but only 14.1 HU for ROI 2. The most severe partial scan artifacts were observed for ROI 3 because it was located between the iodine syringe and the “spine” of the phantom, both highly attenuating materials. The single-source partial scan data were significantly less affected by the artifact than the dual-source data (Fig. 8). The lack of projections for tube B outside of 26 cm FOV (projection truncation) or the effects of cross scatter in the dual-source acquisition mode seem to enhance the magnitude of partial scan artifacts.
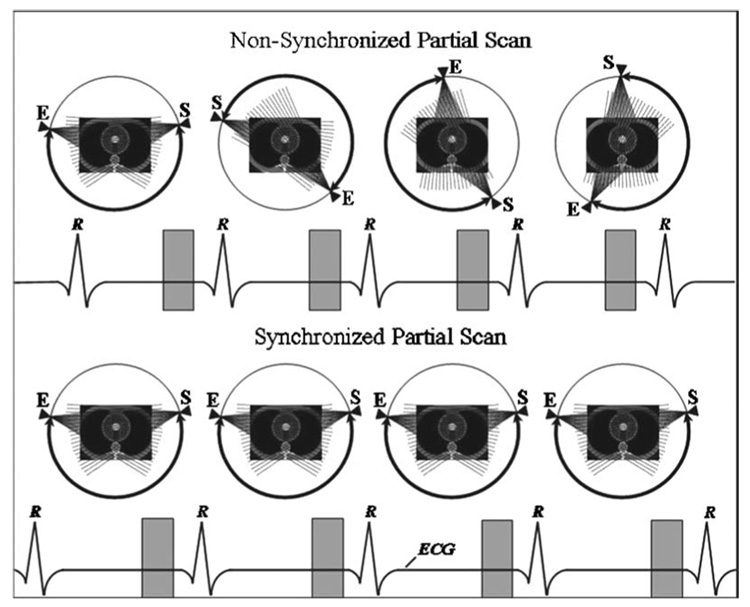
Figure 10 illustrates the underlying principle of the partial scan artifact. For simplicity, only one x-ray tube is shown. The angular range covered by the tube (bold arch with arrows) from the start (s) to the end (E) of the partial scan changes from one heart cycle to another by the angle Δα equal to
| (1) |
where TRR is the R-R interval time, Trot is the gantry rotation time, and the function floor(X) rounds X to the nearest integer less than or equal to X. For an example, for a heart rate of 70 bpm (TRR=0.857 s), the angular range of projection data changes by 215° every heart cycle. Therefore, when an object has anisotropic attenuation properties and/or is located off the isocenter, the scattering and beam hardening geometry changes every heart cycle, causing CT number variations among the images corresponding to different heart cycles. Even when the partial scan source trajectory changes only a little over one heart cycle (e.g., Δα ≈ 7° for HR =90 bpm), this small change quickly adds up after several heart cycles (e.g., Δα ≈ 110° after only 10 s for HR =90 bpm), increasing the CT number variation for any non-synchronized heart rate. That explains why the range of the CT number variations is essentially the same for all four different heart rates shown in Fig. 8, two of which are very close to the synchronization heart rates of 60.6 and 90.9 bpm.
FIG. 10.
Diagram showing the principle of the partial scan artifact and how it can be eliminated by synchronizing the heart rate with the gantry rotation rate. The nonsynchronized sequence is shown for the HR of 70 bpm, while the synchronized sequence corresponds to the HR of 60.6 bpm. The gantry rotation period is 330 ms.
Partial scan artifacts can be avoided by using full scan reconstructions. However, such an approach would degrade the temporal resolution by a factor of 3 or 4 for a dual-source scanner (from 82 to 248 or 330 ms), causing substantial image quality degradation due to cardiac motion. Since the two tubes are 90° apart, it takes at least three quarters of a rotation (248 ms) to acquire 360° of projection data, which would result in a factor of 3 degradation of temporal resolution. However, the 3/4 rotation reconstruction is not currently available on the system. Therefore, myocardial perfusion data would be compromised by motion artifacts instead of partial scan artifacts.
To eliminate the partial scan artifact without sacrificing the temporal resolution, one must ensure that the source trajectory (and, hence, scatter, beam hardening, etc.) does not change from one heart cycle to another (Δα=0). This can only happen when TRR=Trot×N, where N is an integer number. By synchronizing the heart rate with the gantry rotation rate, we satisfy this condition so that the source trajectory remains the same for any given image in the data set, as shown in Fig. 10. Both the cardiac phantom results for N=3 (HR=60.6 bpm) and N=2 (HR=90.9 bpm) shown in Fig. 8 and the animal data for N=2 and N=1 (HR =181.8 bpm) shown in Figs. 9(b) and 9(d) clearly demonstrate the success of the synchronization technique. The synchronized data (white bars) in Fig. 8 have the same range of the CT number variations as the full scan data (gray bar), demonstrating the complete elimination of partial scan artifacts. The synchronized perfusion data from the animal study [Fig. 9(d)] show a large reduction of partial scan artifact, which could enable a more accurate analysis compared to the nonsynchronized data.
The obvious limitation of the proposed synchronization technique is its invasive nature, which requires pacing the heart. Although it can be applied to animals, it is generally not applicable in human subjects. Therefore, another solution of the partial scan problem needs to be found for myocardial perfusion imaging of humans using MDCT. Further work, which is specifically devoted to the clinical impact of partial scan artifacts on myocardial perfusion using MDCT, is currently underway. This work is based on animal studies and involves comparing myocardial perfusion values obtained using standard (nonsynchronized), synchronized, and partially synchronized (i.e., the simulated ECG signal is in synchrony with the gantry rotation but the heart is not paced) acquisition techniques. Partial scan problems would also be avoided if a gantry rotation rate could be changed in synchrony with the patient’s heart rate. However, such a solution represents a serious engineering challenge and does not seem practical. Finally, improved beam hardening and scatter correction algorithms might also reduce or even eliminate partial scan artifacts.
In spite of ensuring invariant scatter and beam hardening effects using the proposed technique, additional sources of CT number inaccuracies may exist. Using EBCT, where the source trajectory is consistent from image to image, Bell et al.25 observed disagreements between the EBCT-derived and microsphere-derived measurements. These disagreements may have resulted from additional sources of CT number inaccuracies in the EBCT system unrelated to the source trajectory, errors in the gold-standard measurements, or both. Whether perfusion measurements using the proposed technique are affected by the absolute accuracy (versus relative image-to-image accuracy) of CT numbers should be confirmed in an animal model.
In conclusion, we have detailed the dependence of partial scan artifacts on the anisotropy of angular projections and the location of the region of interest, quantitated the magnitude of the effect in an anthropomorphic model, and demonstrated the success of the new approach for cardiac CT imaging using MDCT based on the synchronization of the ECG signal with the x-ray tube position. This method drastically improves the quality of the cardiac CT data by reducing the CT number fluctuations caused by partial scan artifacts.
ACKNOWLEDGMENTS
This work was supported in part by National Institute of Health grants EB-07986 and RR-18898. Erik Ritman, Steven Jorgensen, and Yue Dong were supported by NIH Grant No. HL72255. The authors would like to thank Patricia Beighley for assistance with the animal preparation and subsequent CT scanning procedures, and Kris Nunez for assistance with manuscript submission.
Contributor Information
A. N. Primaka, CT Clinical Innovation Center, Department of Radiology, Mayo Clinic College of Medicine, Rochester, Minnesota 55905
Y. Dong, Department of Physiology and Biomedical Engineering, Mayo Clinic College of Medicine, Rochester, Minnesota 55905
O. P. Dzyubak, CT Clinical Innovation Center, Department of Radiology, Mayo Clinic College of Medicine, Rochester, Minnesota 55905
S. M. Jorgensen, Department of Physiology and Biomedical Engineering, Mayo Clinic College of Medicine, Rochester, Minnesota 55905
C. H. McCollough, CT Clinical Innovation Center, Department of Radiology, Mayo Clinic College of Medicine, Rochester, Minnesota 55905
E. L. Ritman, Department of Physiology and Biomedical Engineering, Mayo Clinic College of Medicine, Rochester, Minnesota 55905
References
- 1.Achenbach S, Daniel WG. Current role of cardiac computed tomography. Herz. 2007;32:97–107. doi: 10.1007/s00059-007-2961-8. [DOI] [PubMed] [Google Scholar]
- 2.Cury RC, Nieman K, Shapiro MD, Nasir K, Brady TJ. Comprehensive cardiac CT study: Evaluation of coronary arteries, left ventricular function, and myocardial perfusion—is it possible? J. Nucl. Cardiol. 2007;14:229–243. doi: 10.1016/j.nuclcard.2007.01.035. [DOI] [PubMed] [Google Scholar]
- 3.Flohr TG, Schoepf UJ, Ohnesorge BM. Chasing the heart: New developments for cardiac CT. J. Thorac. Imaging. 2007;22:4–16. doi: 10.1097/RTI.0b013e318032132c. [DOI] [PubMed] [Google Scholar]
- 4.Herzog C, Zangos S, Zwerner P, Costello P, Vogl TJ, Schoepf UJ. CT of coronary artery disease. J. Thorac. Imaging. 2007;22:40–48. doi: 10.1097/RTI.0b013e318032394f. [DOI] [PubMed] [Google Scholar]
- 5.Savino G, Zwerner P, Herzog C, Politi M, Bonomo L, Costello P, Schoepf UJ. CT of cardiac function. J. Thorac. Imaging. 2007;22:86–100. doi: 10.1097/RTI.0b013e3180317433. [DOI] [PubMed] [Google Scholar]
- 6.Hoffmann MH, Shi H, Manzke R, Schmid FT, De Vries L, Grass M, Brambs HJ, Aschoff AJ. Noninvasive coronary angiography with 16-detector row CT: Effect of heart rate. Radiology. 2005;234:86–97. doi: 10.1148/radiol.2341031408. [DOI] [PubMed] [Google Scholar]
- 7.Hoffmann MH, Shi H, Schmitz BL, Schmid FT, Lieberknecht M, Schulze R, Ludwig B, Kroschel U, Jahnke N, Haerer W, Brambs HJ, Aschoff AJ. Noninvasive coronary angiography with multislice computed tomography. JAMA. 2005;293:2471–2478. doi: 10.1001/jama.293.20.2471. [DOI] [PubMed] [Google Scholar]
- 8.Mahnken AH, Muhlenbruch G, Gunther RW, Wildberger JE. Cardiac CT: Coronary arteries and beyond. Eur. Radiol. 2007;17:994–1008. doi: 10.1007/s00330-006-0433-9. [DOI] [PubMed] [Google Scholar]
- 9.Orakzai SH, Orakzai RH, Nasir K, Budoff MJ. Assessment of cardiac function using multidetector row computed tomography. J. Comput. Assist. Tomogr. 2006;30:555–563. doi: 10.1097/00004728-200607000-00001. [DOI] [PubMed] [Google Scholar]
- 10.Schoenhagen P, Halliburton SS, Stillman AE, Kuzmiak SA, Nissen SE, Tuzcu EM, White RD. Noninvasive imaging of coronary arteries: Current and future role of multi-detector row CT. Radiology. 2004;232:7–17. doi: 10.1148/radiol.2321021803. [DOI] [PubMed] [Google Scholar]
- 11.van der Vleuten PA, Willems TP, Gotte MJ, Tio RA, Greuter MJ, Zijlstra F, Oudkerk M. Quantification of global left ventricular function: Comparison of multidetector computed tomography and magnetic resonance imaging. A meta-analysis and review of the current literature. Acta Radiol. 2006;47:1049–1057. doi: 10.1080/02841850600977760. [DOI] [PubMed] [Google Scholar]
- 12.Garcia MJ, Lessick J, Hoffmann MH. Accuracy of 16-row multidetector computed tomography for the assessment of coronary artery stenosis. JAMA. 2006;296:403–411. doi: 10.1001/jama.296.4.403. [DOI] [PubMed] [Google Scholar]
- 13.Cury RC, Ferencik M, Achenbach S, Pomerantsev E, Nieman K, Moselewski F, Abbara S, Jang IK, Brady TJ, Hoffmann U. Accuracy of 16-slice multi-detector CT to quantify the degree of coronary artery stenosis: Assessment of cross-sectional and longitudinal vessel reconstructions. Eur. J. Radiol. 2006;57:345–350. doi: 10.1016/j.ejrad.2005.12.019. [DOI] [PubMed] [Google Scholar]
- 14.Leber AW, Becker A, Knez A, von Ziegler F, Sirol M, Nikolaou K, Ohnesorge B, Fayad ZA, Becker CR, Reiser M, Steinbeck G, Boekstegers P. Accuracy of 64-slice computed tomography to classify and quantify plaque volumes in the proximal coronary system: A comparative study using intravascular ultrasound. J. Am. Coll. Cardiol. 2006;47:672–677. doi: 10.1016/j.jacc.2005.10.058. [DOI] [PubMed] [Google Scholar]
- 15.Raff GL, Gallagher MJ, O’Neill WW, Goldstein JA. Diagnostic accuracy of noninvasive coronary angiography using 64-slice spiral computed tomography. J. Am. Coll. Cardiol. 2005;46:552–557. doi: 10.1016/j.jacc.2005.05.056. [DOI] [PubMed] [Google Scholar]
- 16.Achenbach S, Moselewski F, Ropers D, Ferencik M, Hoffmann U, MacNeill B, Pohle K, Baum U, Anders K, Jang IK, Daniel WG, Brady TJ. Detection of calcified and noncalcified coronary atherosclerotic plaque by contrast-enhanced, submillimeter multidetector spiral computed tomography: A segment-based comparison with intravascular ultrasound. Circulation. 2004;109:14–17. doi: 10.1161/01.CIR.0000111517.69230.0F. [DOI] [PubMed] [Google Scholar]
- 17.Leber AW, Knez A, Becker A, Becker C, von Ziegler F, Nikolaou K, Rist C, Reiser M, White C, Steinbeck G, Boekstegers P. Accuracy of multidetector spiral computed tomography in identifying and differentiating the composition of coronary atherosclerotic plaques: A comparative study with intracoronary ultrasound. J. Am. Coll. Cardiol. 2004;43:1241–1247. doi: 10.1016/j.jacc.2003.10.059. [DOI] [PubMed] [Google Scholar]
- 18.Vogel-Claussen J, Pannu H, Spevak PJ, Fishman EK, Bluemke DA. Cardiac valve assessment with MR imaging and 64-section multi-detector row CT. Radiographics. 2006;26:1769–1784. doi: 10.1148/rg.266065035. [DOI] [PubMed] [Google Scholar]
- 19.Budoff MJ, Shavelle DM, Lamont DH, Kim HT, Akinwale P, Kennedy JM, Brundage BH. Usefulness of electron beam computed tomography scanning for distinguishing ischemic from nonischemic cardiomyopathy. J. Am. Coll. Cardiol. 1998;32:1173–1178. doi: 10.1016/s0735-1097(98)00387-8. [DOI] [PubMed] [Google Scholar]
- 20.Mannheim D, Versari D, Daghini E, Gossl M, Galili O, Chade A, Rajkumar VS, Ritman EL, Lerman LO, Lerman A. Impaired myocardial perfusion reserve in experimental hypercholesterolemia is independent of myocardial neovascularization. Am. J. Physiol. Heart Circ. Physiol. 2007;292:H2449–H2458. doi: 10.1152/ajpheart.01215.2006. [DOI] [PubMed] [Google Scholar]
- 21.Daghini E, Lerman LO. Assessment of myocardial microvascular function: New opportunities in fast computed tomography. Trends Cardiovasc. Med. 2007;17:14–19. doi: 10.1016/j.tcm.2006.10.002. [DOI] [PubMed] [Google Scholar]
- 22.Boyd DP, Gould RG, Quinn JR, Sparks R, Stanley JH, Hermannsfeldt WB. A proposed dynamic cardiac 3-D densitometer for early detection and evaluation of heart disease. IEEE Trans. Nucl. Sci. 1979;26:2724–2727. [Google Scholar]
- 23.McCollough CH, Morin RL. The technical design and performance of ultrafast computed tomography. Radiol. Clin. North Am. 1994;32:521–536. [PubMed] [Google Scholar]
- 24.Rodriguez-Porcel M, Zhu XY, Chade AR, Amores-Arriaga B, Caplice NM, Ritman EL, Lerman A, Lerman LO. Functional and structural remodeling of the myocardial microvasculature in early experimental hypertension. Am. J. Physiol. Heart Circ. Physiol. 2006;290:H978–H984. doi: 10.1152/ajpheart.00538.2005. [DOI] [PMC free article] [PubMed] [Google Scholar]
- 25.Bell MR, Lerman LO, Rumberger JA. Validation of minimally invasive measurement of myocardial perfusion using electron beam computed tomography and application in human volunteers. Heart. 1999;81:628–635. doi: 10.1136/hrt.81.6.628. [DOI] [PMC free article] [PubMed] [Google Scholar]
- 26.Mohlenkamp S, Lerman LO, Lerman A, Behrenbeck TR, Katusic ZS, Sheedy PF, 2nd, Ritman EL. Minimally invasive evaluation of coronary microvascular function by electron beam computed tomography. Circulation. 2000;102:2411–2416. doi: 10.1161/01.cir.102.19.2411. [DOI] [PubMed] [Google Scholar]
- 27.Lerman LO, Siripornpitak S, Maffei NL, Sheedy PF, 2nd, Ritman EL. Measurement of in vivo myocardial microcirculatory function with electron beam CT. J. Comput. Assist. Tomogr. 1999;23:390–398. doi: 10.1097/00004728-199905000-00013. [DOI] [PubMed] [Google Scholar]
- 28.Flohr TG, et al. First performance evaluation of a dual-source CT (DSCT) system. Eur. Radiol. 2006;16:256–268. doi: 10.1007/s00330-005-2919-2. [DOI] [PubMed] [Google Scholar]
- 29.Daghini E, Primak AN, Chade AR, Zhu X, Ritman EL, McCollough CH, Lerman LO. Evaluation of porcine myocardial microvascular permeability and fractional vascular volume using 64-slice helical computed tomography (CT) Invest. Radiol. 2007;42:274–282. doi: 10.1097/01.rli.0000258086.78179.90. [DOI] [PubMed] [Google Scholar]
- 30.Patlak CS, Blasberg RG, Fenstermacher JD. Graphical evaluation of blood-to-brain transfer constants from multiple-time uptake data. J. Cereb. Blood Flow Metab. 1983;3:1–7. doi: 10.1038/jcbfm.1983.1. [DOI] [PubMed] [Google Scholar]
- 31.Liu YH, Shu NH, Ritman EL. A fast computed tomographic imaging method for myocardial perfusion. Am. J. Card. Imaging. 1993;7:301–308. [PubMed] [Google Scholar]
- 32.Parker DL. Optimal short scan convolution reconstruction for fanbeam CT. Med. Phys. 1982;9:254–257. doi: 10.1118/1.595078. [DOI] [PubMed] [Google Scholar]
- 33.Flohr T, Ohnesorge B. Heart rate adaptive optimization of spatial and temporal resolution for electrocardiogram-gated multislice spiral CT of the heart. J. Comput. Assist. Tomogr. 2001;25:907–923. doi: 10.1097/00004728-200111000-00014. [DOI] [PubMed] [Google Scholar]
- 34.Manzke R, Grass M, Hawkes D. Artifact analysis and reconstruction improvement in helical cardiac cone beam CT. IEEE Trans. Med. Imaging. 2004;23:1150–1164. doi: 10.1109/TMI.2004.830804. [DOI] [PubMed] [Google Scholar]
- 35.Hsieh J, Londt J, Vass M, Li J, Tang X, Okerlund D. Step-and-shoot data acquisition and reconstruction for cardiac x-ray computed tomography. Med. Phys. 2006;33:4236–4248. doi: 10.1118/1.2361078. [DOI] [PubMed] [Google Scholar]


