

Abstract
Chemokines, chemotactic cytokines, may promote hepatic inflammation in chronic hepatitis C virus (HCV) infection through the recruitment of lymphocytes to the liver parenchyma. We evaluated the association between inflammation and fibrosis and CXCR3-associated chemokines, interferon γ–inducible protein 10 (IP-10/CXCL10), monokine induced by interferon γ (Mig/CXCL9) and interferon-inducible T cell α chemoattractant (I-TAC/CXCL11), in HCV infection. Intrahepatic mRNA expression of these chemokines was analyzed in 106 chronic HCV-infected patients by real time PCR. The intrahepatic localization of chemokine producer cells and CXCR3+ lymphocytes was determined in selected patients by immunohistochemistry. We found elevated intrahepatic mRNA expression of all three chemokines, most markedly CXCL10, in chronic HCV-infected patients with higher necroinflammation and fibrosis. By multivariable multivariate analysis, intrahepatic CXCL10 mRNA expression levels were significantly associated with lobular necroinflammatory grade and HCV genotype 1. In the lobular region, CXCL10- and CXCL9-expressing hepatocytes predominated in areas with necroinflammation. Strong CXCL11 expression was observed in almost all portal tracts, while CXCL9 expression varied considerably among portal tracts in the same individual. The majority of intrahepatic lymphocytes express the CXCR3 receptor, and the number of CXCR3+ lymphocytes was increased in patients with advanced necroinflammation.
Conclusion
These findings suggest that the CXCR3-associated chemokines, particularly CXCL10, may play an important role in the development of necroinflammation and fibrosis in the liver parenchyma in chronic HCV infection.
Keywords: HCV, CXCL10, CXCL9, CXCL11, biopsy
Hepatitis C virus (HCV) infects ~120 million people worldwide. In the United States, with nearly 5 million people infected, HCV is the most common cause of chronic liver disease, cirrhosis and hepatocellular carcinoma (1–3). However, the progression of hepatic fibrosis varies considerably among chronic HCV-infected patients. Consequently, some patients will have no appreciable fibrosis after decades of viral infection while others rapidly progress to end stage liver disease (2, 4, 5). Although the mechanisms leading to liver cell injury in chronic HCV infection are incompletely understood, the immune response is thought to be an important determinant of the rate of hepatic fibrogenesis (6, 7). Intrahepatic inflammation has been shown to be one of the most important predictors of fibrosis progression in chronic HCV-infected patients (4, 8–10). Consequently, the degree of inflammatory activity is an important factor in disease assessment and may even have value in the decision to initiate therapy.
Chemokines, small chemotactic cytokines that attract leukocytes to inflammatory sites, are important determinants of the development of intrahepatic inflammation in chronic HCV infection. They have been divided into four subfamilies, CC, CXC, CX3C and C, based on the relative position of two conserved N-terminal cysteine residues. CXC chemokines have been further divided into two groups depending on the presence of the ELR (Glu-Leu-Arg) motif preceding the first cysteine: the ELR CXC and non-ELR CXC chemokines (11, 12). The non-ELR CXC chemokines, interferon (IFN) γ–inducible protein 10 (IP-10/CXCL10), monokine induced by IFN γ (Mig/CXCL9) and IFN-inducible T cell α chemoattractant (I-TAC/CXCL11), appear to be important in HCV pathogenesis. In chronic HCV-infected patients, peripheral blood and intrahepatic levels of these three chemokines are elevated compared to uninfected individuals. Their common receptor, CXCR3, has been detected on the majority of intrahepatic lymphocytes (13, 14). The CXCR3 receptor is preferentially expressed on T-helper 1 lymphocytes (15, 16), cells that are characterized by IFN γ and interleukin-2 secretion, and that predominate in the liver of chronic HCV-infected patients. Consequently, through the attraction of CXCR3+ lymphocytes, CXCL10, CXCL9, and CXCL11 may foster ongoing intrahepatic inflammation that may subsequently promote the development of liver cell injury and fibrogenesis.
In this study, we evaluated the expression level and intrahepatic localization of CXCL10, CXCL9 and CXCL11 in a total of 118 chronic HCV-infected patients. Our primary goal was to evaluate the role of these chemokines in the development of intrahepatic inflammation and fibrosis in chronic HCV infection. Intrahepatic mRNA expression levels of these chemokines were measured in liver biopsies obtained from 106 patients with different degrees of liver inflammation and fibrosis as well as in uninfected controls. Additionally, we determined the intrahepatic chemokine producer cells, their intrahepatic localization, and the number of CXCR3+ lymphocytes in 20 liver samples from virally-infected individuals.
Materials and Methods
Patient characteristics
Liver biopsies were obtained from chronic HCV-infected patients who were referred to the clinics of the Center for the Study of Hepatitis C at New York Presbyterian/Weill Cornell Medical Center between 2000 and 2006 for evaluation of chronic HCV. Liver biopsies for histological assessment of HCV-associated liver disease are routinely obtained prior to initiation of antiviral therapy. The study was performed according to a protocol approved by the Weill Medical College of Cornell University Institutional Review Board and was consistent with the standards established by the Helsinki Declaration of 1975. Written informed consent was obtained from all patients prior to specimen collection.
A total of 118 patients included in this study. Intrahepatic chemokine expression was analyzed in 106 patients who were selected based upon the availability of adequately preserved liver tissue. Chemokine producer cells were analyzed in 20 selected patients. HCV RNA levels were measured within a year of the liver biopsy in 83 chronic HCV-infected patients. Patients were included if they were positive for anti-HCV antibodies by ELISA, had detectable serum HCV RNA, and had HCV infection for >6 months. Patients were excluded if they had any cause of liver disease other than HCV infection, were hepatitis B surface antigen positive, were infected with the human immunodeficiency virus, had been treated for HCV within two years prior to the liver biopsy, or had any of the following: renal failure, hepatocellular carcinoma, or decompensated liver disease. Control liver tissue was obtained from six uninfected individuals: two specimens from explanted normal livers, one surgical specimen from a patient with biliary obstruction, one surgical specimen from a patient with lung cancer metastatic to the adrenal gland, and two surgical specimens from macroscopically normal areas from a patient with hepatocellular carcinoma and a patient with urinary bladder cancer metastatic to the liver.
Tissue samples and liver histology
At the time of the liver biopsy, tissue was placed in 10% neutral buffered formalin, fixed overnight, and embedded in paraffin for routine histological examination. An additional section of the biopsy was immediately snap frozen in liquid nitrogen or preserved in RNALater (Ambion, Austin, TX) for subsequent RNA isolation. Portal, periportal and lobular inflammation and fibrosis were determined in a blinded fashion on all liver biopsies by an experienced liver pathologist (LMP) according to the Scheuer system (17).
RNA isolation and real-time RT-PCR
Intrahepatic chemokine mRNA expression levels were determined by real-time RT-PCR. Initially, total RNA was extracted using RNeasy mini kit (QIAGEN, Valencia, CA). Real-time RT-PCR was performed using the TaqMan One-Step RT-PCR Master Mix Reagents Kit (Applied Biosystems, Foster City, CA), which combines the reverse transcription and amplification steps in the same reaction. Pre-designed and pre-optimized TaqMan Gene Expression Assays (Applied Biosystems), containing gene-specific probe and primer sets, were used for quantitative gene expression analysis of CXCL10 (assay ID Hs00171042_m1), CXCL9 (assay ID Hs00171065_m1) and CXCL11 (assay ID Hs00171138_m1). GAPDH was also amplified and used as an internal control (assay ID Hs99999905_m1). The real-time RT-PCR reaction was performed in an ABI Prism 7700 (Applied Biosystems) using the following conditions: 30 min at 48° C followed by 10 min at 95° C, 40 cycles of 15 sec at 95° C, and 1 min at 60° C. Reactions were performed in a total volume of 25 μl using 5 ng of total RNA for CXCL10, CXCL9, and GAPDH, and 10 ng for CXCL11. Each sample was run in triplicate and threshold cycles (CT) for CXCL10, CXCL9, and CXCL11 were averaged and normalized to the endogenous GAPDH control. Intrahepatic mRNA obtained from a healthy liver was used to calibrate each PCR reaction. Relative measurement of the amplified product was performed using the comparative CT method as described in the manufacturer’s manual (18).
Immunohistochemistry
Immunohistochemistry was performed using the following antibodies: CXCR3 (CD183) (mouse clone 1C6/CXCR3, BD PharMingen, San Jose, CA), CXCL11 (rabbit polyclonal, PeproTech, Rocky Hill, NJ), CXCL9 and CXCL10 (both goat polyclonal, RD Systems, Minneapolis, MN). Formalin-fixed, paraffin-embedded, 4-μm sections were deparaffinized in xylene, rehydrated through graded ethanol, and rinsed in water. Heat-induced epitope retrieval was performed in 10 mM citrate buffer pH 6.0 in a 1200-Watt microwave oven at 90% output. CXCR3 and CXCL11 were retrieved for 10 min and CXCL9 was retrieved for 20 min. CXCL10 was heat retrieved for 5 min followed by a 2 min alkaline endopeptidase-3 (Ventana Medical System Tucson, AZ) enzymatic digestion. Antibody incubations and detection were carried out at 37°C on a NEXes instrument (Ventana Medical Systems) using Ventana’s reagent buffer and detection kits. In brief, endogenous peroxidase activity was blocked with hydrogen peroxide. Antibodies were diluted in PBS as follows; CXCR3 and CXCL11, 1:100; CXCL9, 1:50; and CXCL10, 1:25. All primary antibodies were incubated overnight at room temperature. CXCR3 and CXCL11 were detected using Ventana’s biotinylated goat anti-mouse and goat anti-rabbit antibodies, respectively. CXCL9 and CXCL10 were detected using biotinylated horse anti-goat (Vector Laboratories, Burlingame, CA) diluted 1:100 and 1:80, respectively. Both were incubated for 32 min at 37°C followed by the application of streptavidin-horseradish-peroxidase conjugate. The complex was visualized with 3,3 diaminobenzidene and enhanced with copper sulfate. Slides where washed in water, counterstained with hematoxylin, dehydrated, and mounted with permanent media. Appropriate positive and negative controls (multi-tissue block of tonsil, thymus, liver, and spleen) were run in parallel with study slides.
Dual immunohistochemistry was performed on a surgical specimen obtained from a patient with chronic HCV infection. For dual immunohistochemistry, slides were initially labeled with anti-CXCR3 and subsequently with anti-CXCL10 or anti-CXCL9 as described above except for the following modifications. Target antigen retrieval for CXCL9 was performed for 10 min. Incubation with the primary CXCL10 antibody was carried out for 6 hours at room temperature. Anti-CXCL9 antibody was diluted 1:40 and incubated overnight at room temperature. For CXCL9, the anti-goat secondary antibody was diluted 1:500 and incubated for 30 minutes at 37°C. Subsequently, alkaline phosphatase-streptavidin conjugate was applied. The complex was visualized by the simultaneous application of Naphthol-AS-MX phosphatase and Fast Red TR salt in acetate buffer. Slides were then washed in water, counterstained with hematoxylin, quickly dehydrated through graded alcohols, and mounted with permanent media.
CXCR3+ cells were counted in 5 portal tracts (x200 magnification) and 5 lobular areas (x400 magnification) in each patient. Chemokine expression in the liver parenchyma and in portal areas was determined semiquantitatively: 0, no staining; 1, positive staining in <25% of cells; 2, positive staining in 25–50% of cells; 3, positive staining in 50–75% of cells; and 4, positive staining in >75% of cells.
Statistical analysis
Descriptive statistics were computed for all variables. Because the data were not normally distributed, they were log-transformed prior to statistical analysis. Since CXCL10, CXCL9, and CXCL11 were measured on each patient, these measurements are correlated (ρ = 0.428 for correlation between ln[CXCL10] and ln[CXCL9], ρ = 0.751 for correlation between ln[CXCL10] and ln[CXCL11], and ρ = 0.571 for correlation between ln[CXCL9] and ln[CXCL11]). Thus, the response variable is a vector of the form
where Yi1 = ln(CXCL10), Yi2 = ln(CXCL9), Yi3 = ln(CXCL11). Hotelling’s T2 statistic was used to compare equality of means of the different chemokines between HCV-infected patients and uninfected controls. We used the one-way multivariate analysis of variance (MANOVA) to determine whether the means of CXCL10, CXCL9, and CXCL11 differ at different levels of grade or stage. To assess the relative contribution of each individual chemokine, we constructed 95% confidence intervals for the differences in the levels between patients with different degrees of grade and stage and subsequently applied the Bonferroni adjustment for multiple comparisons. A multivariable multivariate linear model was constructed to evaluate the effects of histologic (lobular grade, portal grade, and stage), demographic (ethnicity, age, and gender), and virologic (HCV RNA and genotype) factors on chemokine levels. The term “multivariable” refers to models that contain multiple independent explanatory variables, as in the case of regression models with many predictors. The term “multivariate” refers to techniques and models where the response or outcome variable is a vector, i.e., contains multiple outcomes. Association analysis was conducted using the Cochran-Armitage test to take into account the ordinal nature of the variables and to identify potential confounding between inflammation and fibrosis. The level of significance was set at α = 0.05. When appropriate, graphical analysis using boxplots was used.
Results
Intrahepatic chemokine mRNA expression in chronic HCV infection
To determine the potential association between CXCR3-associated chemokines and inflammation, we evaluated the intrahepatic mRNA expression levels of CXCL10, CXCL9, and CXCL11 in liver biopsies obtained from 106 chronic HCV-infected patients and six uninfected controls. Among the 106 patients, the median age was 49 (interquartile range = 12) years, 55% of the patients were male, 75% were Caucasian, and 74% were infected with HCV genotype 1 (Table 1). Chemokine expression levels were analyzed with respect to the grade of lobular and portal inflammation as well as the stage of fibrosis.
Table 1.
Demographic characteristics
| Parameter | mRNA1 (N=106) | IHC2 (N=20) | Controls (N=6) | |
|---|---|---|---|---|
| Age3 | 49 (12) | 52.5 (10.0) | 70.5 (6) | |
| Gender | Male | 58 | 12 | 5 |
| Female | 48 | 8 | 1 | |
| Ethnicity | Caucasian | 80 | 13 | 4 |
| AA | 11 | 3 | 0 | |
| Hispanic | 13 | 3 | 1 | |
| Asian | 2 | 1 | 0 | |
| Unknown | 0 | 0 | 1 | |
| Genotype | 1 | 78 | 14 | NA |
| 2–3 | 27 | 5 | NA | |
| Unknown | 1 | 1 | NA | |
| Treatment | Naïve | 86 | 14 | NA |
| Prior NR | 20 | 7 | NA | |
| HCV RNA3,4 International units/ml | 6.0 x 10⁵ (2.4 x 10⁶) | 1.3 x 10⁶ (2.2 x 10⁶) | NA | |
| Portal Grade | 1 | 36 | 4 | NA |
| 2 | 50 | 14 | NA | |
| 3 | 20 | 2 | NA | |
| Lobular Grade | 1 | 63 | 6 | NA |
| 2 | 41 | 10 | NA | |
| 3 | 2 | 4 | NA | |
| Stage | 0 | 13 | 0 | NA |
| 1 | 34 | 3 | NA | |
| 2 | 34 | 10 | NA | |
| 3 | 21 | 6 | NA | |
| 4 | 4 | 1 | NA | |
Demographic data on patients who had mRNA chemokine levels assessed in liver tissue.
Demographic data on patients who had chemokine measurements based upon immunohistochemical staining of liver sections
Median (interquartile range).
HCV RNA obtained within a year of the liver biopsy was available for 83 patients in whom chemokine mRNA levels were assessed and in 6 patients who had samples available for immunohistochemistry.
Abbreviations: IHC, immunohistochemistry; AA, African-American; NR, non-responder; NA, not applicable.
Compared to uninfected controls, intrahepatic mRNA expression of all three chemokines was increased in HCV-infected patients. Median intrahepatic CXCL10, CXCL11, and CXCL9 mRNA relative expression levels were 9.22 (1.00–21.86), 3.75 (1.00 –16.11), and 4.11 (1.00–16.68) among the uninfected controls and 221.3(5.70 –2740.10), 50.2(2.25 – 433.53), and 36.6 (4.11 – 442.64) in chronic HCV patients, respectively (Fig 1a–c). We found that mean chemokine levels are significantly elevated in HCV-infected compared to uninfected controls (T2 = 63.06, p-value <0.00001).
Figure 1.

Box and whisker plots illustrating elevated intrahepatic chemokine mRNA levels in hepatitis C virus (HCV)-infected (n = 106) compared with normal (n = 6) individuals. a) interferon γ–inducible protein-10 (IP-10/CXCL10), b) monokine induced by interferon γ (Mig/CXCL9), and c) interferon inducible T-cell alpha chemoattractant (I-TAC/CXCL11). Chemokine expression levels, measured by real-time PCR, were normalized to endogenous GAPDH control and then calculated as fold-induction over the expression levels in a liver sample obtained from a normal control. The Y-axis indicates the logarithmic-transformed levels for each chemokine. The box extends from the 25th to the 75th percentile. The line in the middle of the box is the median and the lines extending from either end of the box indicate the extent of the data beyond the 25th and 75th percentiles, and outliers, if any. The number of patients per group is indicated in parenthesis. Note different Y-axis values between CXCL10 and CXCL9/CXCL11.
Intrahepatic chemokine levels and inflammation
Since very few patients had none (grade 0) or advanced (grade 4) inflammation, they were combined for statistical analysis. For lobular inflammation, patients were grouped into two categories, minimal/mild (grade ≤ 1) and mild/moderate (grade > 1). For portal inflammation, three strata were constructed, minimal/mild (grade ≤ 1), mild/moderate (grade = 2) and moderate/advanced (grade > 2).
Analysis of all three chemokines simultaneously, using MANOVA in the absence of demographic or virologic variables, we found a significant association between lobular (Wilks λ = 0.8747, p=0.0037) and portal (Wilks λ = 0.8764, p=0.04) inflammation and chemokine expression. Among the individual chemokines (univariate analysis), we found that CXCL10, CXCL9, and CXCL11 were 1.3 to 3 (p = 0.0015), 1 to 2 (p = 0.0241), and 1.4 to 3 (p = 0.003) times higher in patients with lobular grade > 1 in comparison with those with grade ≤ 1, respectively, as indicated by their respective confidence intervals (Fig 2a–c; Tables 2 and 3). In terms of portal inflammation, we found that CXCL10 levels were 1.05 to 2.89 (p = 0.045) higher in patients with portal grade = 2 compared to grade ≤ 1 and 1.17 to 4.65 (p = 0.0106) higher in those with portal grade > 2 compared to grade ≤ 1. Similarly, CXCL9 and CXCL11 levels among patients with portal grade > 2 were elevated by 1 to 4 (p = 0.0167 for CXCL9, p = 0.0192 for CXCL11) times in comparison with those with grade ≤ 1 (Fig 2d–f; Tables 2 and 3). In conclusion, of the three chemokines, CXCL10 is most markedly elevated with increasing grades of inflammation.
Figure 2.


Association between chemokine expression and inflammation in patients with chronic hepatitis C virus infection. Box and whisker plots illustrating increases in intrahepatic chemokine mRNA levels in patients with minimal/mild (grade < 1) compared to those with mild/moderate (grade > 1) grades of lobular necroinflammation for: a) CXCL10 (interferon γ–inducible protein-10: IP-10), b) CXCL9 (monokine induced by interferon γ: Mig), and c) CXCL11 (interferon inducible T-cell alpha chemoattractant: I-TAC). CXCL10, CXCL9, and CXCL11 levels are significantly (p = 0.0015, p = 0.0241, and p = 0.003, respectively) elevated in those with lobular grade > 1 compared to those with grade ≤ 1. The lower row of box and whisker plots illustrates increased intrahepatic d) CXCL10, e) CXCL9, and f) CXCL11 mRNA levels in patients with increasing grades of portal inflammation. Patients were divided into three strata: minimal/mild (grade ≤ 1), mild/moderate (grade = 2) and moderate/advanced (grade >2). CXCL10, CXCL9, and CXCL11 levels are significantly (p = 0.0106, p = 0.0167, and p = 0.0192, respectively) elevated in those with portal grade > 2 compared to those with grade ≤ 1. CXCL10 levels are also significantly (p = 0.045) in those with portal grade = 2 compared to those with grade ≤ 1. The Y-axis indicates the logarithmic-transformed levels for each chemokine as determined by real-time PCR. The number of patients per group is indicated in parenthesis. Patients with extreme values were the same for all three chemokines. Note different Y-axis values between CXCL10 and CXCL9/CXCL11.
Table 2.
Means and standard deviations of logarithmically transformed chemokine expression levels stratified by histological parameters
| Histologic Classification | Location | Level | ln(CXCL10) | ln(CXCL9) | ln(CXCL11) | |||
|---|---|---|---|---|---|---|---|---|
| μ | SD | μ | SD | μ | SD | |||
| Grade | Lobular | ≤ 1 | 4.93 | 1.06 | 3.40 | 0.96 | 3.64 | 1.01 |
| >1 | 6.00 | 0.86 | 3.85 | 1.04 | 4.27 | 0.97 | ||
| Portal | ≤ 1 | 4.78 | 1.10 | 3.23 | 0.95 | 3.60 | 0.97 | |
| 2 | 5.32 | 0.99 | 3.66 | 1.05 | 4.00 | 1.01 | ||
| >2 | 5.66 | 0.72 | 3.99 | 0.86 | 4.20 | 1.14 | ||
| Stage | 0 | 4.65 | 0.72 | 3.56 | 1.16 | 3.68 | 0.87 | |
| 1 | 5.02 | 1.18 | 3.09 | 0.80 | 3.59 | 1.08 | ||
| 2 | 5.28 | 1.14 | 3.82 | 0.99 | 3.90 | 1.16 | ||
| >2 | 5.64 | 0.55 | 3.94 | 1.01 | 4.43 | 0.63 | ||
Table 3.
Relative differences and significance levels comparing levels of histologic variables
| Histologic variable | Level | 95% confidence interval | ||
|---|---|---|---|---|
| CXCL10 | CXCL9 | CXCL11 | ||
| Lobular grade | ≤ 1 vs. > 1 | 1.3, 3
p = 0.0015 |
1, 2
p = 0.0241 |
1.4, 3
p = 0.003 |
| Portal grade | ≤ 1 vs. 2 | 1.05, 2.89
p = 0.045 |
||
| ≤ 1 vs. > 2 | 1.17, 4.65
p = 0.0106 |
1, 4
p = 0.0167 |
1, 4
p = 0.0192 |
|
| Stage | 0 vs. > 2 | 1, 7
p = 0.05 |
||
| 1 vs. 2 | 1.14, 4
p = 0.0093 |
|||
| 1 vs. > 2 | 1.18, 4.62
p = 0.0064 |
1.17, 4.57
p = 0.0017 |
||
Exponentiation of the 95% confidence interval limits generates the relative untransformed differences between the levels as reported in Results and shown above.
Intrahepatic chemokine levels and fibrosis
Patients were grouped according to the stage of fibrosis as none (stage = 0), minimal/mild (stage = 1), mild/moderate (stage = 2) and moderate/advanced (stage > 2). Analysis of all three chemokines simultaneously, using MANOVA, in the absence of demographic or virologic variables, we found a significant association between fibrosis and chemokine expression (Wilks λ = 0.792, p=0.006). By univariate analysis, we found that CXCL10 levels were 1 to 7 (p = 0.05) times higher among stage > 2 compared to those with stage = 0 (Table 3). CXCL11 levels were 1.17 to 4.57 (p = 0.0017) higher in patients with stage > 2 compared to those with stage = 1. In terms of CXCL9, we found that patients with stage > 2 were 1.18 to 4.62 (p = 0.0064) higher and those with stage = 2 were 1.14 to 4 (p = 0.0093) higher compared to those with stage = 1 (Fig 3a–c). In conclusion, similar to the results obtained with inflammation, CXCL10 expression increases most markedly with higher stage of fibrosis in comparison to other chemokines.
Figure 3.


Association between chemokine expression and fibrosis and hepatitis C virus (HCV) genotype. Box and whisker plots illustrate differences in intrahepatic chemokine mRNA levels in patients according to differences in fibrosis stage for a) CXCL10 (interferon γ–inducible protein-10: IP-10), b) CXCL9 (monokine induced by interferon γ: Mig), and c) CXCL11 (interferon inducible T-cell alpha chemoattractant: I-TAC). Patients were grouped according to the fibrosis stage as none (stage = 0), minimal/mild (stage = 1), mild/moderate (stage = 2) and moderate/advanced (stage >2). CXCL10 levels are significantly (p = 0.05) elevated in those with stage = 0 compared to those with stage > 2. CXCL9 and CXCL11 levels are significantly (p = 0.0064 and p = 0.0017, respectively) elevated in those with stage > 2 compared to those with stage = 1. CXCL9 levels are also significantly (p = 0.0093) elevated in those with stage = 2 compared to those with stage = 1. The lower row of the box and whisker plots illustrate the expression levels of d) CXCL10, e) CXCL9, and f) CXCL11 among patients with chronic HCV infection stratified according to viral genotype. The Y-axis indicates the logarithmic-transformed levels for each chemokine as determined by real-time PCR. The number of patients per group is indicated in parenthesis. Patients with extreme values were the same for all three chemokines. Note different Y-axis values between CXCL10 and CXCL9/CXCL11.
Association between demographic, histologic, and virologic variables and intrahepatic chemokine expression
We next sought to evaluate the potential association between chemokine expression levels and histologic (lobular grade, portal grade, and stage), demographic (ethnicity, age, and gender), and virologic (HCV RNA and genotype) factors. On univariate analysis, we found a significant association between genotype and CXCL10, as indicated by levels that are 1 to 4 times higher in subjects with genotype 1 in comparison to those infected with HCV genotype 2 (95% CI 0.03 – 1.35) (Fig 3d–f). The significant genotype effect persisted when included in individual multivariate, multivariable models with lobular inflammation (F = 4.28, p = 0.0165), portal inflammation (F = 3.65, p =0.0295) and stage (F = 4.01, p = 0.0214) adjusted for age, sex, race, and HCV RNA. In addition, CXCL10 expression and lobular inflammation were also significantly associated on multivariate, multivariable analysis (F = 4.10, p=0.046). None of the other variables included in the model were significant.
Intrahepatic localization of chemokines
An example of histological changes observed in chronic HCV infection includes lymphocytic infiltration into the portal tract with extension into the lobular parenchyma (Fig 4a). To evaluate the intrahepatic distribution of CXCR3-associated chemokines and to determine their producer-cells in chronic HCV, we performed immunostaining for CXCL10, CXCL9, and CXCL11 on liver biopsies from a group of 20 patients.
Figure 4.

Hepatic parenchymal expression of interferon γ–inducible protein-10 (IP-10/CXCL10) in chronic hepatitis C virus infection with representative hepatic histology. a) Hematoxylin and eosin stain of a representative liver biopsy illustrates portal tract lymphocytic infiltration with extension into the lobular parenchyma (x100). b) CXCL10 is not detected on a liver specimen from an uninfected individual (x200). In chronic HCV-infected patients, CXCL10 is detected primarily in c) lobular hepatocytes (black arrow; x400). d) CXCL10-expressing hepatocytes are localized in an area with heavy lymphocyte infiltration (x400). Dual immunostaining with anti-CXCL10 (red) and anti-CXCR3 (brown) in e) liver parenchyma (x400) and f) periportal (x200) areas reveals co-localization of CXCL10+ hepatocytes with CXCR3+ lymphocytes. CXCL10-expressing hepatocytes are indicated by black arrows (c and e). A CXCR3-expressing lymphocyte is indicated by a white arrow (e).
Lobular area
In chronic HCV-infected patients, CXCL10 and CXCL9 expression was primarily detected on hepatocytes and rarely on intralobular lymphocytes (Fig 4c and 5a). In the lobular area, CXCL10 was detected in all patients while 90% had detectable CXCL9 (Table 4). CXCL11 was observed in all patients and primarily detected on sinusoidal endothelial cells (SEC) and intralobular lymphocytes (Fig 5f). A few SEC also expressed CXCL10. In healthy liver, CXCL10 and CXCL9 staining was not detected although occasional CXCL11-expressing lymphocytes were observed (Fig 4b, 5e, 5g).
Figure 5.

Hepatic parenchymal expression of monokine induced by interferon γ (Mig/CXCL9) and interferon inducible T-cell alpha chemoattractant (I-TAC/CXCL11) in chronic hepatitis C virus infection and an uninfected individual. CXCL9 is detected primarily in a) lobular hepatocytes (black arrow; x400). b) CXCL9-stained hepatocytes are localized in an area with heavy lymphocyte infiltration (x400). Dual immunostaining with anti-CXCL9 (red) and anti-CXCR3 (brown) in c) parenchyma (x400) and d) periportal (x200) areas reveal co-localization of CXCL9+ hepatocytes (black arrow in c) with CXCR3+ lymphocytes (white arrow in c). e) CXCL9 is not detected in a liver specimen from an uninfected individual (x200). f) CXCL11 is observed primarily on sinusoidal endothelial cells (left arrow) and lobular lymphocytes (right arrow; x400). g) In uninfected liver, CXCL11 staining was detected on an occasional lymphocyte (black arrow; x200). h) CXCR3 is detected on the majority of lobular lymphocytes (white arrow; x100). i) CXCR3-expressing lymphocytes were not detected in uninfected liver.
Table 4.
Semi quantitative assessment of chemokine expression levels by immunohistochemistry in 20 chronic HCV infected patients
| Chemokine expression level | Lobular Chemokines | Portal Chemokines | ||||
|---|---|---|---|---|---|---|
| CXCL10 | CXCL9 | CXCL11 | CXCL10 | CXCL9 | CXCL11 | |
| 0 | 2 (10) | 20 (100) | ||||
| 1 | 3 (15) | 3 (15) | 18 (90) | 1 (5) | ||
| 2 | 8 (40) | 6 (30) | 8 (40) | 1 (5) | 10 (50) | |
| 3 | 6 (30) | 9 (45) | 6 (30) | 1 (5) | 8 (40) | |
| 4 | 3 (15) | 3 (15) | 3 (15) | 1 (5) | ||
Number (percent) positive individuals is shown based upon semiquantitative assessment as described in methods.
CXCL10 and CXCL9 expression was most intense in liver parenchyma with necroinflammatory activity (Fig 4d, 5b). Dual immunostaining, performed on a surgical specimen obtained from a patient with chronic HCV infection, revealed co-localization of CXCL10 and CXCL9-expressing hepatocytes with CXCR3+ lymphocytes (Fig 4e–f, 5c–d). Together with the results of the mRNA expression analysis, this finding suggests a role for chemokines as mediators of lymphocyte recruitment to the liver parenchyma in chronic HCV-infected patients.
Portal tracts
While CXCL10 was not detected in the portal tracts, CXCL9- and CXCL11-expressing lymphocytes were observed in the portal tracts of all chronic HCV-infected patients. However, the numbers of chemokine-expressing cells varied markedly between portal tracts even within the same patient (Fig 6a–d). In the majority of patients (90%) CXCL9 expression was detected in less than 25% of portal lymphocytes. In contrast, CXCL11 expression was detected on 25–100% of portal lymphocytes in 95% of patients (Table 4).
Figure 6.

Portal expression of non-ELR CXC chemokines and their receptor. Immunohistochemistry for interferon inducible T-cell alpha chemoattractant (I-TAC/CXCL11) (a, b), monokine induced by interferon γ (Mig/CXCL9) (c, d), and their receptor CXCR3 (e, f) was performed on sequential sections obtained from two representative portal tracts (x100).
Intrahepatic localization of CXCR3+ lymphocytes
Consistent with previously published reports, we found that the majority of lobular and portal lymphocytes in chronic HCV-infected patients express the CXCR3 receptor (Fig 5h, 6e–f). As a result of CXCR3+ quantitation, we observed that patients with lobular and portal necroinflammatory grade < 2 had substantially fewer CXCR3+ lymphocytes compared to those with more severe inflammation (Fig 7a–b).
Figure 7.
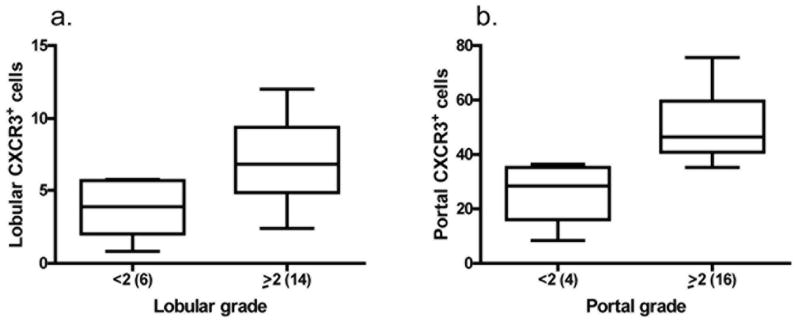
Association between CXCR3+ cells and necroinflammation. Chronic hepatitis C virus-infected patients with higher necroinflammation have increased numbers of a) lobular and b) portal CXCR3+ cells as determined by immunohistochemical staining. The number of CXCR3+ cells was determined by counting in 5 portal tracts (x200) and 5 lobular high power fields (x400) in each patient. Mild lobular or portal inflammation was defined as grade < 2 while severe inflammation was defined as ≥ 2. The number of patients per group is indicated in parenthesis. Note different Y-axis values between panels.
Interestingly, comparing sequential sections, we noted co-localization of CXCL11 and CXCR3 expression in portal lymphoid aggregates, formations frequently observed in chronic HCV-infected patients. CXCL11 expression was detected in all lymphoid aggregates and it co-localized with areas with CXCR3 staining as observed through the analysis of sequential sections obtained from all 20 patients (Fig 6a–b, 6e–f). In contrast, CXCL9 expression was detected in some, but not all, lymphoid aggregates (Fig 6c–d).
Discussion
The present study suggests that CXCL10, CXCL9, and CXCL11, through the recruitment of CXCR3-expressing lymphocytes, regulate the development of intrahepatic inflammation in chronic HCV-infected patients. Intrahepatic mRNA levels of all three chemokines were significantly elevated in patients with more severe lobular and portal inflammation and higher stages of fibrosis. Among the three chemokines, CXCL10 was the most significantly associated with both inflammation and fibrosis. After controlling for the effects of demographic and virologic parameters, the only significant association detected was between CXCL10 and intrahepatic lobular inflammation. The number of intrahepatic CXCR3+ lymphocytes was also increased in patients with higher inflammation. Furthermore, CXCR3+ lymphocytes co-localized with CXCL10- and CXCL9-producing cells in the liver parenchyma. Taken together, these findings highlight the important role of CXCR3-associated chemokines, particularly CXCL10, in chronic HCV infection.
The development of liver injury varies considerably among chronic hepatitis C patients with some progressing rapidly toward cirrhosis while others progress minimally or not at all (2, 4, 5). Although the mechanisms of fibrogenesis are incompletely understood, hepatic inflammation has been shown to be an important determinant of histological progression in these patients (4, 8–10). However, despite its potential importance, inflammation and the factors that promote its development have not been extensively explored. Several early studies suggested a role for CXCR3-associated chemokines in the development of intrahepatic inflammation in chronic HCV infection (reviewed in (19)). Although these studies reported an association between individual chemokines and inflammation, they were limited by small numbers of patients and/or the use of insensitive techniques (13, 14, 20, 21). To further elucidate the role of CXCR3-associated chemokines in chronic hepatitis C, we measured their intrahepatic expression levels in a large number of patients infected with different viral genotypes. Our results confirm the previously proposed relationship between CXCR3-associated chemokines, especially CXCL10, and liver inflammation in chronic hepatitis C. In addition, we found a significant relationship between these chemokines and hepatic fibrosis that suggests their potential role in the development of progressive liver injury in chronic HCV-infected patients.
Through their role as chemoattractants, chemokines initiate a cascade of events that may lead to diverse outcomes of HCV infection. In acutely infected patients, cells in the liver most likely start secreting chemokines in an attempt to attract effector cells to clear the virus. Although intrahepatic chemokine expression has not been analyzed during acute HCV infection in humans, in a chimpanzee intrahepatic CXCL10 mRNA levels start to increase during the first week of infection and remain elevated until viral resolution (22, 23). In the 50–80% of patients in whom the immune response is incapable of viral eradication, continued chemokine secretion maintains inflammation in the liver. Direct cytotoxicity and/or cytokine release from intrahepatic inflammatory cells can subsequently promote liver cell injury and fibrogenesis potentially leading to cirrhosis and/or hepatocellular carcinoma.
In addition to the associations between chemokines and histologic variables, we also found an effect of viral genotype on intrahepatic CXCL10 expression. CXCL10 mRNA levels were significantly higher in patients infected with HCV genotype 1 than in those infected with genotype 2. In agreement with this finding, other studies have observed that peripheral CXCL10 levels are significantly (24) or nearly significantly (25) elevated in HCV genotype 1 patients compared with those infected with genotypes 2 or 3. These observations may partially explain the findings of Fontaine et al. who reported increased liver inflammation in genotype 1-infected patients (8). However, the association between inflammation and HCV genotype has not been confirmed by other studies (4, 10).
Due to conflicting reports regarding intrahepatic localization of CXCR3-associated chemokines (19), we sought to determine their producer cells in the liver of our study subjects. We identified hepatocytes as the predominant source of CXCL10 and CXCL9, and SEC and lymphocytes as the major CXCL11-expressing cells in chronic HCV-infected patients. While CXCL10 expression was only observed in the lobular areas, CXCL9 and CXCL11 were both expressed by portal lymphocytes. We consistently observed strong CXCL11 expression in portal lymphoid aggregates that always co-localized with CXCR3 expression. Portal lymphoid aggregates, ranging from diffuse lymphoid clusters to well developed follicles with germinal centers, are a disease-defining characteristic in HCV infection. The reasons underlying the formation of these aggregates remain elusive, but may be related to intrahepatic chemokine expression, as suggested by our results. Whether CXCL11 plays a role in that process and what triggers its expression requires further investigation.
In summary, CXCR3-associated chemokines, through the attraction of inflammatory cells to the hepatic parenchyma, may be important determinants of liver cell injury and fibrogenesis. The association between these chemokines and liver inflammation and fibrosis in chronic hepatitis C also suggests their potential as markers of disease progression. Longitudinal studies that utilize serial biopsies to determine the rate of fibrosis progression will be required to address that issue. As inflammation plays a central role in HCV-associated liver injury, further studies of the role of chemokines and their receptors in HCV pathogenesis might have clinical relevance. These chemokines might even have a potential as therapeutic targets to prevent the development of inflammation and subsequent fibrogenesis in chronic HCV infection.
Acknowledgments
We acknowledge Raymond Peterson for assistance with sample identification, Gary Dorante, Jennifer Davila, and Gertrudis Soto for assistance with sample processing.
Financial support: This research was supported, in part, by a General Clinical Research Center Grant (M01-RR00047) from the National Center for Research Resources, National Institutes of Health, the Greenberg Foundation for Medical Research, the William J. Clinton Foundation, and the Rita J. and Stanley H. Kaplan Comprehensive Cancer Center.
Abbreviations
- HCV
hepatitis C virus
- IFN
interferon
- CXCL10/IP-10
interferon
- γ
inducible protein 10
- CXCL9/Mig
monokine induced by interferon γ, CXCL11/I-TAC, interferon - inducible T cell α chemoattractant
- MANOVA
multivariate analysis of variance
- SEC
sinusoidal endothelial cells
References
- 1.Shepard CW, Finelli L, Alter MJ. Global epidemiology of hepatitis C virus infection. Lancet Infect Dis. 2005;5:558–567. doi: 10.1016/S1473-3099(05)70216-4. [DOI] [PubMed] [Google Scholar]
- 2.Afdhal NH. The natural history of hepatitis C. Semin Liver Dis. 2004;24(Suppl 2):3–8. doi: 10.1055/s-2004-832922. [DOI] [PubMed] [Google Scholar]
- 3.Davis GL, Keeffe EB, Balart LA. Advances in Liver Disease: Highlights from the 56th Annual Meeting of the American Association for the Study of Liver Diseases. Rev Gastroenterol Disord. 2006;6:48–61. [PubMed] [Google Scholar]
- 4.Ghany MG, Kleiner DE, Alter H, Doo E, Khokar F, Promrat K, et al. Progression of fibrosis in chronic hepatitis C. Gastroenterology. 2003;124:97–104. doi: 10.1053/gast.2003.50018. [DOI] [PubMed] [Google Scholar]
- 5.Poynard T, Ratziu V, Charlotte F, Goodman Z, McHutchison J, Albrecht J. Rates and risk factors of liver fibrosis progression in patients with chronic hepatitis c. J Hepatol. 2001;34:730–739. doi: 10.1016/s0168-8278(00)00097-0. [DOI] [PubMed] [Google Scholar]
- 6.Bertolino P, Klimpel G, Lemon SM. Hepatic inflammation and immunity: a summary of a conference on the function of the immune system within the liver. Hepatology. 2000;31:1374–1378. doi: 10.1053/jhep.2000.8376. [DOI] [PubMed] [Google Scholar]
- 7.Cerny A, Chisari FV. Pathogenesis of chronic hepatitis C: immunological features of hepatic injury and viral persistence. Hepatology. 1999;30:595–601. doi: 10.1002/hep.510300312. [DOI] [PubMed] [Google Scholar]
- 8.Fontaine H, Nalpas B, Poulet B, Carnot F, Zylberberg H, Brechot C, et al. Hepatitis activity index is a key factor in determining the natural history of chronic hepatitis C. Hum Pathol. 2001;32:904–909. doi: 10.1053/hupa.2001.28228. [DOI] [PubMed] [Google Scholar]
- 9.Yano M, Kumada H, Kage M, Ikeda K, Shimamatsu K, Inoue O, et al. The long-term pathological evolution of chronic hepatitis C. Hepatology. 1996;23:1334–1340. doi: 10.1002/hep.510230607. [DOI] [PubMed] [Google Scholar]
- 10.Lagging LM, Westin J, Svensson E, Aires N, Dhillon AP, Lindh M, et al. Progression of fibrosis in untreated patients with hepatitis C virus infection. Liver. 2002;22:136–144. doi: 10.1034/j.1600-0676.2002.01623.x. [DOI] [PubMed] [Google Scholar]
- 11.Rossi D, Zlotnik A. The biology of chemokines and their receptors. Annu Rev Immunol. 2000;18:217–242. doi: 10.1146/annurev.immunol.18.1.217. [DOI] [PubMed] [Google Scholar]
- 12.Murphy PM, Baggiolini M, Charo IF, Hebert CA, Horuk R, Matsushima K, et al. International union of pharmacology. XXII Nomenclature for chemokine receptors. Pharmacol Rev. 2000;52:145–176. [PubMed] [Google Scholar]
- 13.Harvey CE, Post JJ, Palladinetti P, Freeman AJ, Ffrench RA, Kumar RK, et al. Expression of the chemokine IP-10 (CXCL10) by hepatocytes in chronic hepatitis C virus infection correlates with histological severity and lobular inflammation. J Leukoc Biol. 2003;74:360–369. doi: 10.1189/jlb.0303093. [DOI] [PubMed] [Google Scholar]
- 14.Apolinario A, Majano PL, Alvarez-Perez E, Saez A, Lozano C, Vargas J, et al. Increased expression of T cell chemokines and their receptors in chronic hepatitis C: relationship with the histological activity of liver disease. Am J Gastroenterol. 2002;97:2861–2870. doi: 10.1111/j.1572-0241.2002.07054.x. [DOI] [PubMed] [Google Scholar]
- 15.Bonecchi R, Bianchi G, Bordignon PP, D'Ambrosio D, Lang R, Borsatti A, et al. Differential expression of chemokine receptors and chemotactic responsiveness of type 1 T helper cells (Th1s) and Th2s. J Exp Med. 1998;187:129–134. doi: 10.1084/jem.187.1.129. [DOI] [PMC free article] [PubMed] [Google Scholar]
- 16.Qin S, Rottman JB, Myers P, Kassam N, Weinblatt M, Loetscher M, et al. The chemokine receptors CXCR3 and CCR5 mark subsets of T cells associated with certain inflammatory reactions. J Clin Invest. 1998;101:746–754. doi: 10.1172/JCI1422. [DOI] [PMC free article] [PubMed] [Google Scholar]
- 17.Scheuer PJ. Classification of chronic viral hepatitis: a need for reassessment. J Hepatol. 1991;13:372–374. doi: 10.1016/0168-8278(91)90084-o. [DOI] [PubMed] [Google Scholar]
- 18.Biosystems A. ABI Prism 7700 Sequence Detection System: User Bulletin #2. Foster City: CA; 1997. pp. 11–15. Updated 2001. [Google Scholar]
- 19.Zeremski M, Petrovic LM, Talal AH. The role of chemokines as inflammatory mediators in chronic hepatitis C virus infection. J Viral Hepat. 2007;14:675–687. doi: 10.1111/j.1365-2893.2006.00838.x. [DOI] [PubMed] [Google Scholar]
- 20.Bieche I, Asselah T, Laurendeau I, Vidaud D, Degot C, Paradis V, et al. Molecular profiling of early stage liver fibrosis in patients with chronic hepatitis C virus infection. Virology. 2005;332:130–144. doi: 10.1016/j.virol.2004.11.009. [DOI] [PubMed] [Google Scholar]
- 21.Helbig KJ, Ruszkiewicz A, Semendric L, Harley HA, McColl SR, Beard MR. Expression of the CXCR3 ligand I-TAC by hepatocytes in chronic hepatitis C and its correlation with hepatic inflammation. Hepatology. 2004;39:1220–1229. doi: 10.1002/hep.20167. [DOI] [PubMed] [Google Scholar]
- 22.Bigger CB, Brasky KM, Lanford RE. DNA microarray analysis of chimpanzee liver during acute resolving hepatitis C virus infection. J Virol. 2001;75:7059–7066. doi: 10.1128/JVI.75.15.7059-7066.2001. [DOI] [PMC free article] [PubMed] [Google Scholar]
- 23.Lanford RE, Guerra B, Chavez D, Bigger C, Brasky KM, Wang XH, et al. Cross-genotype immunity to hepatitis C virus. J Virol. 2004;78:1575–1581. doi: 10.1128/JVI.78.3.1575-1581.2004. [DOI] [PMC free article] [PubMed] [Google Scholar]
- 24.Diago M, Castellano G, Garcia-Samaniego J, Perez C, Fernandez I, Romero M, et al. Association of pretreatment serum interferon {gamma} inducible protein 10 levels with sustained virological response to peginterferon plus ribavirin therapy in genotype 1 infected patients with chronic hepatitis C. Gut. 2006;55:374–379. doi: 10.1136/gut.2005.074062. [DOI] [PMC free article] [PubMed] [Google Scholar]
- 25.Romero AI, Lagging M, Westin J, Dhillon AP, Dustin LB, Pawlotsky JM, et al. Interferon (IFN)- gamma -Inducible Protein-10: Association with Histological Results, Viral Kinetics, and Outcome during Treatment with Pegylated IFN- alpha 2a and Ribavirin for Chronic Hepatitis C Virus Infection. J Infect Dis. 2006;194:895–903. doi: 10.1086/507307. [DOI] [PubMed] [Google Scholar]