

Abstract
The exposure of the developing human embryo to ethanol results in a spectrum of disorders involving multiple organ systems, including the visual system. One common phenotype seen in humans exposed to ethanol in utero is microphthalmia. The objective of this study was to describe the effects of ethanol during retinal neurogenesis in a model organism, the zebrafish, and to pursue the potential mechanisms by which ethanol causes microphthalmia. Zebrafish embryos were exposed to 1% or 1.5% ethanol from 24 to 48 h after fertilization, a period during which the retinal neuroepithelium undergoes rapid proliferation and differentiation to form a laminated structure composed of different retinal cell types. Ethanol exposure resulted in significantly reduced eye size immediately following the treatment, and this microphthalmia persisted through larval development. This reduced eye size could not entirely be accounted for by the accompanying general delay in embryonic development. Retinal cell death was only slightly higher in ethanol-exposed embryos, although cell death in the lens was extensive in some of these embryos, and lenses were significantly reduced in size as compared to those of control embryos. The initiation of retinal neurogenesis was not affected, but the subsequent waves of cell differentiation were markedly reduced. Even cells that were likely generated after ethanol exposure—rod and cone photoreceptors and Müller glia—were delayed in their expression of cell-specific markers by at least 24 h. We conclude that ethanol exposure over the time of retinal neurogenesis resulted in persistent microphthalmia due to a combination of an overall developmental delay, lens abnormalities, and reduced retinal cell differentiation.
Keywords: Microphthalmia, Ethanol, Retina, Neurogenesis, Fetal Alcohol Syndrome
Introduction
Prenatal exposure to ethanol results in a spectrum of disorders in humans, ranging from fetal alcohol syndrome (FAS) as the most severe, to subtle effects as seen in alcohol related birth defects, and alcohol related neurodevelopmental defects (Stratton, 1996). These disorders are characterized by prenatal and postnatal growth deficiencies, central nervous system manifestations, congenital heart defects, ocular anomalies, and cranio-facial defects. Children with FAS show a variety of ophthalmic defects ranging from microphthalmia, coloboma of iris, optic nerve hypoplasia, and visual impairment, to minor anomalies such as strabismus. Retinal function is known to be affected by prenatal ethanol exposure. Retrospective studies in children with FAS have shown abnormal electroretinograms with reduced responses from photoreceptors, and decreased visual acuity (Hug et al., 2000).
Microphthalmia—reduced eye size—is seen in 90% of children with FAS (Stromland & Pinazo-Duran, 2002). Microphthalmia can occur as a consequence of a number of potential mechanisms, including but not limited to general developmental delay, increased cell death, reduced cell proliferation, and reduced cell differentiation within the developing eye (Stenkamp et al., 2002). A general developmental delay in children exposed prenatally to ethanol has been observed in that growth retardation, and decreased learning ability are common manifestations of FAS (Stratton, 1996). Apoptosis within the developing nervous system has been documented in various studies of embryonic ethanol exposure among different animal models (Smith, 1997; Sulik, 2005). A study in mice (Tenkova et al., 2003) has shown the apoptogenic potential of acute ethanol intoxication in the visual system during synaptogenesis. In zebrafish, cell death within the CNS and the eye takes place following early embryonic ethanol exposure (Loucks & Carvan, 2004; Reimers et al., 2006), suggesting that ethanol may cause its deleterious effects by a similar mechanism across vertebrate species. However, apoptosis specifically within the retina has not been studied following ethanol exposure during retinal neurogenesis, and the remaining mechanisms (decreased proliferation, decreased cell differentiation) have not been pursued.
Various animal models ranging from rats, mice, and Xenopus to zebrafish are being used to gain an understanding of the mechanisms through which embryonic ethanol exposure generates FAS-like defects. In zebrafish, ethanol exposure to embryos results in phenotypes similar to those seen in other animal models, and in humans (Blader & Strahle, 1998; Bilotta et al., 2002, 2004; Carvan et al., 2004; Loucks & Carvan, 2004; Arenzana et al., 2006; Matsui et al., 2006). Zebrafish embryos are semi-transparent and develop externally over a very short, and experimentally manipulable, period. The addition of ethanol to the embryos’ environment results in rapid equilibration of ethanol concentration within the embryos (Bradfield et al., 2006). Potential mechanisms mediating the effects of ethanol exposure on the visual system can be tested through the use of molecular and genetic methods (Easter & Malicki, 2002). Studies pursuing effects of ethanol on the visual system have shown effects on eye morphogenesis and growth (Blader & Strahle, 1998; Bilotta et al., 2004), retinal lamination (Arenzana et al., 2006), photoreceptor differentiation and optic nerve development (Matsui et al., 2006), and visual function (Bilotta et al., 2002; Matsui et al., 2006).
The vertebrate retina is a highly conserved, laminated structure, with specific retinal cell types residing within specific retinal layers. In teleosts, the retina undergoes rapid proliferation from 24 to 36 hpf (Schmitt & Dowling, 1996; Hu & Easter, 1999). The first cells to differentiate in the zebrafish retina are the ganglion cells (~32 hpf) along the vitreal border, followed by the appearance of an inner plexiform layer and amacrine cells. Formation of the photoreceptor layer follows that of inner retinal neurons, at approximately 48 hpf (Raymond et al., 1995; Hu & Easter, 1999; Schmitt & Dowling, 1999). Neurogenesis and differentiation of the teleost retina is initiated in ventral retina, adjacent to the optic stalk and future site of the optic nerve head, and subsequent waves of retinal differentiation (ganglion cells, then inner nuclear layer neurons, then photoreceptors) follow a spiral pattern, from ventral to dorsal to nasal to temporal (Raymond et al., 1995; Schmitt & Dowling, 1996; Stenkamp et al., 1996; Hu & Easter, 1999).
FAS has been known to us for a long time (Jones & Smith, 1973). Although the teratogenic potential of ethanol is known, it is still unclear as to how it exerts it toxicity. Several mechanisms have been put forth for its action. Morphogens like retinoic acid (RA) (Duester, 1991; Deltour et al., 1996; Zachman & Grummer, 1998) and sonic hedgehog (Ahlgren et al., 2002; Sulik, 2005) have been suggested as mediating the effects of ethanol. The purpose of this study was to characterize the effects of embryonic ethanol exposure on the neurogenesis of the zebrafish retina, and to evaluate the potential mechanisms through which ethanol exposure may result in microphthalmia. We exposed embryos to ethanol over a restricted developmental period, 24 to 48 hpf, which corresponds to the time of retinal neurogenesis and initial retinal cell differentiation. This time frame has previously been shown to result in microphthalmia in eyes measured 24 h later (Bilotta et al., 2004). We demonstrate that this ethanol exposure regime causes immediate, as well as persistent, microphthalmia due to a combination of general developmental delay, reduced lens size, and reduced retinal cell differentiation. We also document unexpected effects on the later differentiation of rod and cone photoreceptors and of Müller glia.
Materials and methods
Animals, ethanol treatments, and tissue processing
All experiments involving animals conformed to the principles adopted by the Society for Neuroscience, and were approved by the University of Idaho Animal Care and Use Committee. Adult zebrafish were maintained according to Westerfield (2000) on a 14:10 h light/dark cycle at 28.5°C in aquatic housing units using recirculating system water. Fish of the AB strain (specifically transgenics of the RGnY line, a gift of Dr. Elwood Linney, Duke University) and those of a strain originally purchased from Scientific Hatcheries (now called Aquatica Habitats) (Huntington CA) were used. Fish of the AB strain have been shown to be sensitive to ethanol exposure (Loucks & Carvan, 2004).
Embryos were treated with 0.003% phenylthioiurea (PTU) at 12 h post fertilization (hpf) (Westerfield, 2000) to inhibit melanin synthesis, unless otherwise specified. The presence of PTU did not appear to interact with ethanol exposure (data not shown).
Embryos were treated with 1% or 1.5% ethanol solution between 24 and 48 hpf in glass beakers maintained at 28.5°C and loosely covered with parafilm to minimize evaporation. The ethanol solution was made using 100% ethanol diluted with system water. The concentrations of ethanol used have been shown, in a chronic treatment situation, to result in an embryonic phenotype in zebrafish similar to that seen in human fetal alcohol syndrome (Bilotta et al., 2004). Treated and control embryos were either fixed at 36 hpf, 48 hpf, or were transferred to fresh system water (without ethanol), and fixed at 72 hpf, or 96 hpf.
Embryos were fixed using 4% paraformaldehyde in phosphate buffered saline and 5% sucrose, and were washed with increasing concentrations of buffered sucrose solution prior to cryoprotection in 20% sucrose overnight at 4°C. The tissue was then embedded in a 1:2 mixture of OCT embedding medium (Sakura Finetek, Torrance, CA):20% sucrose. Using a cryostat, the tissue was sectioned at 5μm. Some fixed embryos were processed as whole mounts and stored in 100% methanol.
Histology and cell death assay
Retinal histology was evaluated by staining embryo cryosections with 1% methylene blue/1% azure II (1:1). Cell death analysis by terminal dUTP nick-end labeling (TUNEL) was performed on cryosectioned embryos, using an in situ cell death detection kit from Roche (Indianapolis, IN), according to the manufacturer’s instructions, with a peroxidase-based signal amplification step (Stenkamp et al., 2002). The processed tissue was mounted in glycerol and viewed under Nomarski optics using a Leica DMR compound microscope.
Expression of Cell Specific Markers
In situ hybridization
Probes for in situ hybridization were synthesized using full-length cDNAs corresponding to zebrafish crx (gift of Pamela Raymond, University of Michigan), ath5 (gift of Steve Wilson, Kings College), rx1 (gift of Peter Mathers, University of West Virginia), neuroD (gift of Vladimir Korzh, University of Singapore), and pax6 (gift of Steve Ekker, University of Minnesota). These cDNAs were used to synthesize digoxigenin- (dig) or fluorescein- (fl) labeled cDNA probes using components of the Genius Kit (Roche). In situ hybridization was performed on cryosectioned embryos and whole mounts according to Barthel and Raymond (1993). In brief, tissue was rehydrated in a descending ethanol series and treated with 10 μg/mL proteinase K. Sections were then dehydrated and hybridized at 56°C overnight with probe (1 mg/mL) in a solution containing 50% formamide. Visualization of hybridization was performed using an anti-dig (or anti-fl) antibody coupled to alkaline phosphatase (Roche), and color substrates 4-nitroblue tetrazolium chloride and 5-bromo-4-chloro-3-indolyl phosphate (NBT0BCIP).
Immunocytochemistry
To analyze the expression of cell specific proteins, immunocytochemistry was done using various cell specific markers for different retinal cell types. 20% goat serum in phosphate buffered saline containing 0.5% Triton X-100 (Sigma; St. Louis, MO) (PBST) was used to block the sections prior to application of antibodies. Sections were incubated at 4°C overnight with one of the following primary antibodies, diluted in PBST: zpr-1 (1:200), zpr-3 (1: 200), and zn-8 (1:25), were purchased from the University of Oregon zebrafish monoclonal stock center (Eugene, OR); anti-phosphohistone H3 (1:1000) from Upstate Cell Signaling Solutions (Lake Placid, NY); anti-PKC (H-300) sc-10800 (1:200) from Santa Cruz Biotechnology, Inc (Santa Cruz, CA); anti-glutamine synthetase (1:5000) from BD Biosciences Pharmingen (San Jose, CA); and anti-islet-1 from University of Iowa monoclonal stock center (Ames, IA). Sections were washed with PBST and were then incubated at room temperature for 2 h with a Cy-3 conjugated secondary antibody, either donkey anti-rabbit or donkey anti-mouse (both 1:200), purchased from Jackson Immuno-Research Laboratories, Inc. (West Grove, PA). Sections were then washed with PBST and mounted using an antifade medium (Prolong Gold; Molecular Probes, Invitrogen, Carlsbad, CA) and viewed under Nomarski and epifluorescence optics on a Leica DMR compound microscope.
Eye and body measurements, cell counts, and statistics
Fixed embryos were arranged on their sides in a petri dish, and were photographed with a Nikon stereomicroscope equipped with a CCD digital camera, using a focal plane that provided clear boundaries to establish the circumference of one eye and one lens (usually the left eye). Images were imported into ScionImage software, and lens and eye circumferences were measured around these boundaries (as shown in Fig. 1A), by using the free transform measuring tool. Overall developmental delay was assessed through measurement of the head-trunk angle (Westerfield, 2000). This assay is based on the angle the notochord makes with a line drawn through the middle of the ear and eye. The embryo is superimposed on an imaginary clock, with 6:00 (= 0°) as the beginning of this axis (see http://zfin.org/zf_info/zfbook/stages/figs/fig33.html; Westerfield, 2000). Between 20 hpf and 70 hpf, this angle increases as embryos straighten.
Fig. 1.
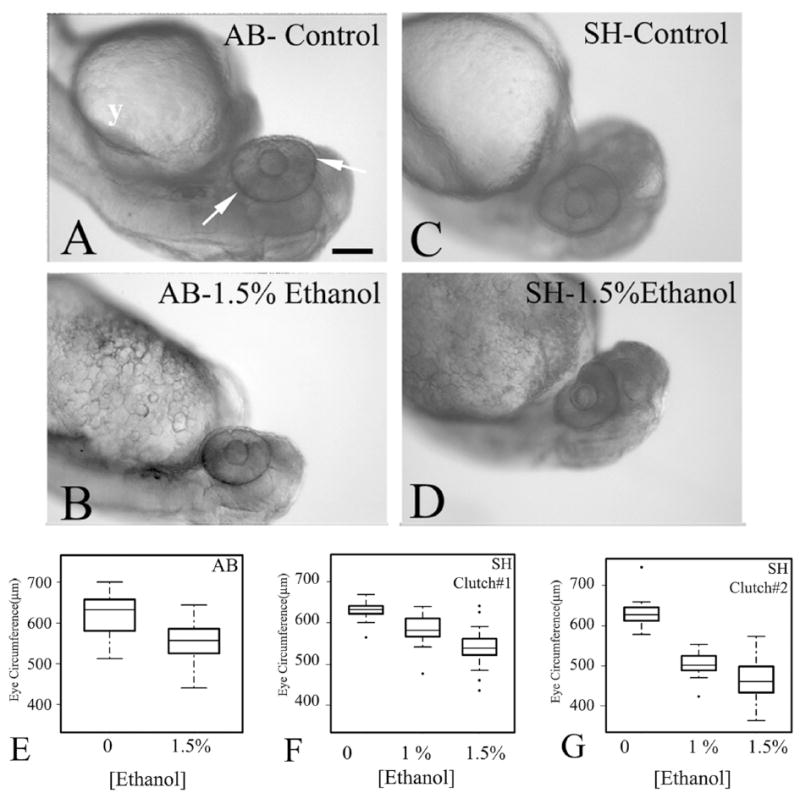
Ethanol exposure from 24 to 48 hpf results in microphthalmia in two strains of zebrafish. Panels A–D show representative photos of untreated (A, C), and ethanol-exposed (B, D) embryos of the AB (A, B) and SH (C, D) strains. The white arrows in panels A indicate the boundaries used for circumference measurements. Bar =100 μm (magnification same for A–D); y, yolk. Panels E-G show boxplots of eye circumference measurements from one clutch of AB embryos (E: control n = 24; ethanol n = 22), and two clutches of SH embryos (F: control n =11; 1% ethanol n =19; 1.5% ethanol n = 22; G: control n =12; 1% ethanol n = 29; 1.5% ethanol = 33). In the boxplots, the boxes delineate the 25th to 75th percentiles, the dark horizontal lines depict the medians, the whiskers depict the upper and lower limits, and the filled circles depict outliers as defined by R statistical software.
Counts of cells labeled by a specific procedure (anti-H3-positive and TUNEL-positive) were performed on images collected by a SPOT camera and associated software. Counts were averaged from at least three sections per individual embryo, for at least three embryos per count. To avoid double counting of labeled cells, alternate sections were used for these analyses, and sections were not used if they showed labeled cells in identical positions to those of a previously counted section.
Statistical tests included Student’s t-tests or ANOVAs, as appropriate, and were done using R statistical software (R, 2006). Figures were assembled in Adobe PhotoShop CS.
Results
Ethanol treatment results in microphthalmia in zebrafish embryos
Chronic treatment of zebrafish embryos with ethanol has been shown to result in reduced eye size at three days in development (Bilotta et al., 2004). We tested whether selective exposure to ethanol over the period of retinal differentiation was sufficient to immediately result in reduced eye size. We evaluated the effects of ethanol exposure from 24 hpf to 48 hpf, a time frame that includes neurogenesis of most major retinal cell types, as well as an increase in volume of the eye (Li et al., 2000a). We measured eye size in animals from two strains, AB, and a strain obtained from Scientific Hatcheries (now called Aquatica Habitats), which will be referred to as SH. The AB strain has been shown to be sensitive to ethanol treatment (Loucks & Carvan, 2004). Embryos treated with 1% or 1.5% ethanol displayed several morphological differences as compared to untreated controls (Figs. 1A to 1D). Embryos appeared smaller, and their heads and eyes were reduced in size. Other abnormalities included edema around the developing heart, increased size of the yolk sac, and a reduction in spontaneous movement. Mortality rates (at 48 hpf) averaged 7.5% for embryos treated with 1.5%, 3.9% for those treated with 1% ethanol, and 2% for untreated control embryos. The exception was one small clutch (n = 30, out of five clutches) in which all of the embryos treated with 1.5% ethanol had died by 36 hpf.
Eye circumferences were measured in the focal plane of the largest apparent circumferential boundary of the eye (Fig. 1A). A Student’s t-test revealed significant differences in eye size for ethanol-treated compared to control embryos of the AB strain (Fig. 1E; p =1.008e-05) The SH strain is also sensitive to ethanol exposure, and in a dose-dependent manner (results from two different clutches of embryos are shown in Figs. 1F and 1G). One-way ANOVAs performed on these data indicated significant differences among the three treatment groups in each clutch, and a post-hoc Fisher’s Least Significant Difference test detected significant differences between each group within a clutch (p-values were all ≪ 0.001). We statistically compared eye sizes between strains and among the three clutches (those shown in Fig. 1E–G), and found no significant differences among the controls, and no significant differences among the 1.5% ethanol treatment groups, suggesting that the AB and SH strains respond to ethanol in a similar, and predictable manner, and have similar eye growth rates over the time of the experiment. Eyes from a separate clutch of untreated SH embryos (n =11) were measured at 24 hpf, and these eyes were approximately the same circumference (median = 565.0 μm) as those of embryos treated with ethanol from 24 to 48 hpf (Figs. 1E to 1G). These results suggest that eye growth may have been arrested by the ethanol treatment.
The ethanol-induced microphthalmia documented here may have been generated through one or more of several mechanisms (Stenkamp et al., 2002), including (1) a general delay in development that includes the eye; (2) increased cell death within the eye; (3) reduced proliferation of cells within the eye; and/or (4) reduced or altered cell differentiation, a process that adds volume to the eye as retinal cells mature and form processes (Li et al., 2000a, 2000b). Each topic will be addressed separately below. For all remaining experiments, the 1.5% ethanol treatment was used on SH embryos.
Ethanol treatment results in a general developmental delay
A simple assay to assess the general developmental state of the zebrafish embryo is measurement of the head trunk angle (HT angle; Westerfield, 2000). We used this assay to determine the extent to which ethanol-treated embryos lagged behind their control counterparts. HT angle was measured at 36 hpf and 48 hpf for two clutches, and the ethanol-treated embryos were indeed found to be substantially delayed in general development (Fig. 2). Student’s t-tests indicated significant differences in HT angle at 36 hpf and for each of two clutches measured at 48 hpf (p values ≪ 0.001). We estimated the approximate predicted age of treated versus untreated embryos, based upon the HT angle data of Westerfield (2000); these predicted ages are included as a modified Y-axis in Fig. 2. They suggest a developmental delay of approximately 6 h (between means) to 9 h (between medians) in the 1.5% ethanol-treated embryos. These data are consistent with a general developmental delay playing a role in the generation of microphthalmia in zebrafish embryos exposed to ethanol, but they also indicate that additional, eye-specific mechanisms may be involved, since eye measurements were consistent with a 24 h delay in eye development.
Fig. 2.
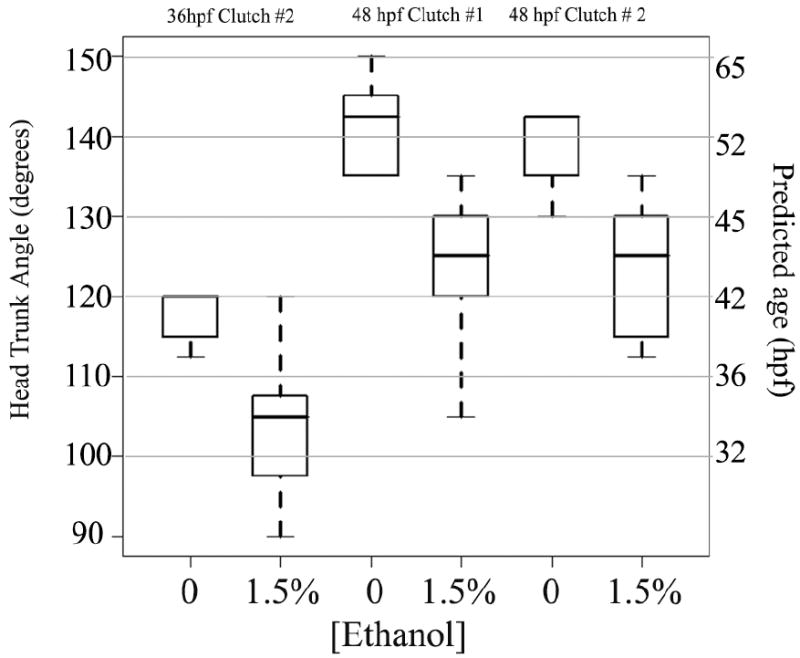
Ethanol exposure from 24 to 48 hpf results in progressive developmental delay. Head-trunk angle (Y-axis on the left) was measured according to Westerfield (1995; see Materials and methods, and see figure at http://zfin.org/zf_info/zfbook/stages/figs/fig33.html), and used to predict an estimated corresponding developmental age (Y-axis on the right; Westerfield, 1995). Measurements were performed at 36 hpf (control n = 5; ethanol n = 7) and 48 hpf (control clutch#1 n = 9; ethanol n = 13; clutch#2 control n=9; ethanol n=9). In the boxplots, the boxes delineate the 25th to 75th percentiles, the dark horizontal lines depict the medians, and the whiskers depict the upper and lower limits as defined by R statistical software.
Ethanol treatment results in modest effects on retinal histology and retinal cell death
Histology of the eyes was examined in methylene blue-stained embryos (Figs. 3A to 3F). During the period of 24 hpf to 36 hpf the zebrafish retina undergoes rapid proliferation to form a 3–4 layer thick, pseudo-stratified, undifferentiated epithelium (Schmitt & Dowling, 1999). At 36 hpf (Figs. 3A, 3B), retinas of embryos exposed to 1.5% ethanol show more haphazard and clustered cells in the retina when compared to the controls, suggesting that ethanol may cause subtle changes during retinal histogenesis. During the next 12 h of development, the zebrafish retina undergoes differentiation of ganglion cells and amacrine cells, resulting in retinal lamination around 50 hpf (Schmitt & Dowling, 1999). In embryos exposed to 1.5% ethanol between 24 and 48 hpf, the inner retinal layers were not as well defined as compared to controls, and the retina appeared to be reduced in overall thickness (Figs. 3C, 3D). In some experiments, ethanol-treated embryos were returned to unmodified system water at 48 hpf and were examined at 72 hpf, a time when all retinal layers are well-established (Schmitt & Dowling, 1999). In these embryos, retinal histology appeared remarkably similar. Apoptosis has been proposed as a possible mechanism through which ethanol results in the various clinical manifestations seen in FAS (Smith, 1997; Sulik, 2005). To test whether cell death mediates the effects of ethanol on eye growth in the zebrafish embryo, we detected dying cells using a TUNEL assay in embryos exposed to ethanol from 24 hpf to 48 hpf (Figs. 3E-3I). The numbers of TUNEL-positive cells in control retinas were very low at 36 hpf, 48 hpf, and 72 hpf (Figs. 3E, 3G, 3I, 3M), and on average, slightly lower than those reported by others (Biehlmaier et al., 2001; Cole & Ross, 2001). The numbers of TUNEL-positive cells in retinas of ethanol-treated embryos were only slightly greater (Fig. 3M), and only in the 48 hpf embryos did this difference approach significance (p = 0.011). The distribution of these cells did not suggest any cell- or regional-specificity of cell death (Figs. 3H, 3J, 3L, 3M). These results suggest that the reduced eye size observed in ethanol-treated zebrafish embryos is not likely the result of increased cell death within the retina. However, this mechanism cannot be ruled out, since it is possible that high levels of cell death will have been present at time points we did not evaluate.
Fig. 3.
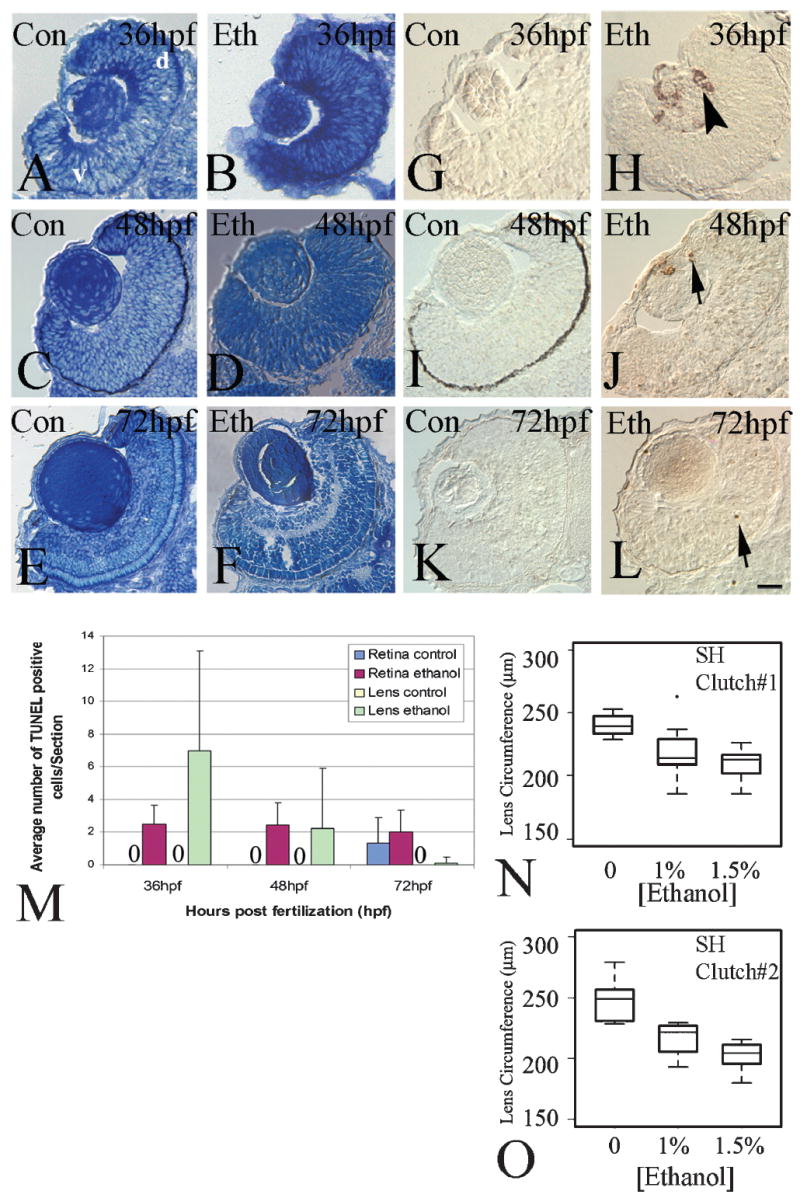
Histology, cell death, and lens circumference in the retinas of ethanol-treated embryos. Panels A–F show representative photos of methylene blue/azure II-stained retinas of untreated (A, C, E), and ethanol-exposed embryos (B, D, F), processed at 36 hpf (A, B), 48 hpf (C, D) and 72 hpf (E,F). Panels G–L show representative photos of TUNEL-stained retinas of untreated (G, I, K), and ethanol-exposed embryos (H, J, L), processed at 36 hpf (G, H), 48 hpf (I, J), and 72 hpf (K, L). Arrows in J and L show TUNEL-positive profiles in the retina and arrowhead in panel H shows TUNEL positive profiles in lens. Bar = 50 μm; v, ventral; d, dorsal (magnification and orientation is the same for panels A-H). Embryos in panels C and I were not treated with PTU and therefore have dark retinal pigmented epithelium. Panel M shows average numbers of TUNEL-positive cells ± s.d at 36 (control n = 3; ethanol n=3), 48 (control n=3; ethanol n=9), and 72 hpf (control n=3; ethanol n=9) in retinas and lenses of untreated and ethanol-exposed embryos. Panels N and O show boxplots of lens circumference from two clutches of SH embryo strains at 48 hpf (N: Control n=12, 1% ethanol n=29, and 1.5% ethanol n = 33; O: Control n =11, 1% ethanol n =19, 1.5% ethanol n = 22). In the boxplots, the boxes delineate the 25th to 75th percentiles, the dark horizontal lines depict the medians, the whiskers depict the upper and lower limits, and the filled circles depict outliers as defined by R statistical software.
The most striking feature of the TUNEL-processed sections was the presence of numerous TUNEL-positive cells in the lenses of ethanol-treated embryos (Figs. 3H, 3J, 3M), although this feature was not seen consistently, and the differences in numbers of dying cells were therefore not statistically significant. However, because dying cells were never seen in the lenses of control eyes, we wished to pursue abnormal lens development as a contributing factor for the microphthalmic effects of embryonic ethanol exposure. Therefore, we measured lens circumferences in the focal plane of the largest apparent circumferential boundary of the eye (Figs. 3N, 3O). One-way ANOVAs performed on these data indicated significant differences among the three treatment groups in each clutch, and a post-hoc Fisher’s Least Significant Difference test confirmed significantly reduced lens circumferences in treated vs. untreated embryos within each clutch (p-values were all ≪ 0.001).
Ethanol exposure does not affect retinal cell proliferation
To evaluate the effects of ethanol on retinal cell proliferation, we performed immunocytochemistry using an antibody against phosphohistone H3 (a-H3), an M-phase (mitotic) marker. In eyes from untreated controls, and from embryos exposed to 1.5% ethanol, H3-positive cells were found in the outer layer of the developing retina (Figs. 4A to 4D), where mitotic figures are typically located (Hu & Easter, 1999). Mitotic cells were also observed in the ciliary margin, the lens, and occasionally in the inner nuclear layer. There was no significant difference in the number of proliferating cells at either 36 hpf or 48 hpf in the ethanol-treated embryos as compared to untreated controls (Student’s t-test; 36 hpf, p = 0.2807; 48 hpf, p = 0.06275; Fig. 4K). We noted that the ethanol-treated embryos (at 48 hpf) were more likely to display M-phase nuclei in positions not directly apposed to the retinal pigmented epithelium, and were more likely to show mitotic nuclei having unusual orientations (Fig. 4D). Six out of 13 of the ethanol-exposed retinas showed this phenotype, as compared to zero out of eight control retinas.
Fig. 4.
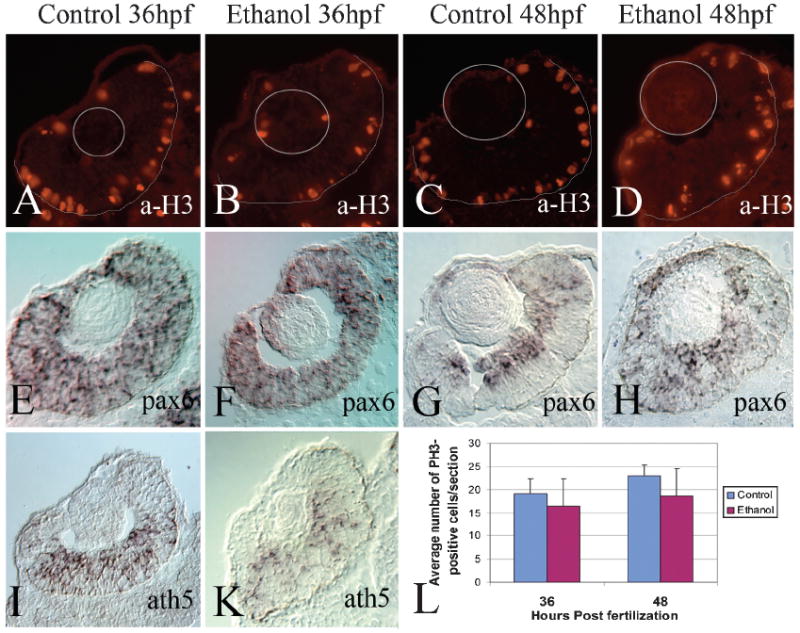
Cell proliferation and early retinal neurogenesis in the retinas of ethanol-treated embryos. Panels A–D show representative photos of retinas of untreated (A, C), and ethanol-exposed embryos (B, D), processed for anti-phospho histone H3 indirect immunofluorescence at 36 hpf (A, B), and 48 hpf (C, D). Thin gray circles indicate the locations of the lenses in the sections; thin gray semicircles indicate the positions of the retinal pigmented epithelium. Panels E–H show representative photos of retinas of untreated (E, G), and ethanol-exposed embryos (F, H), processed for pax6 in situ hybridization at 36 hpf (E, F), and 48 hpf (G, H). Panels I, K show representative photos of retinas of untreated (I), and ethanol-exposed embryos (K), processed for ath5 in situ hybridization at 36 hpf. Bar =50 μm; v, ventral; d, dorsal (magnification and orientation is the same for panels A-H); cm, ciliary margin; gcl, ganglion cell layer; inl, inner nuclear layer. Panel L shows average numbers ± s.d. of pH3-positive cells at 36 (control n = 8; ethanol n = 7) and 48 hpf (control n = 8; ethanol n = 13) in retinas of untreated and ethanol-exposed embryos.
The production of most of the neurons of the embryonic retina takes place coincident with our ethanol exposure regime of 24–48 hpf (Hu & Easter, 1999). To test whether ethanol treatment may influence retinal neurogenesis, we examined the expression patterns of two transcription factors known to be involved in this process, pax6 and ath5. Pax6 was of particular interest as it has been shown to have a critical role in ethanol-induced microcephaly in Xenopus embryos (Peng et al., 2004). At 36 hpf, pax6 expression was distributed throughout the retinal neuroepithelia of untreated control embryos (Fig. 4E; Nornes et al., 1998), but at 48 hpf had become restricted to the newly forming ganglion cell layer and inner nuclear layers (Fig. 4G), the pattern seen in adult retinas (Hitchcock et al., 1996). At 36 hpf, ethanol-treated embryos showed a pax6 expression domain virtually indistinguishable from that of the control embryos (Fig. 4F), but at 48 hpf, the neuroepithelial pattern of staining persisted (Fig. 4H), suggesting a delay or other defect in retinal neurogenesis. The bHLH transcription factor, ath5, is the earliest known marker for the initiation of retinal neurogenesis (Masai et al., 2000), and is required for ganglion cell neurogenesis specifically (Kay et al., 2001). The control and ethanol-exposed embryos showed similar expression patterns for this transcription factor (Figs. 4I, 4K), suggesting that, if ethanol affects retinal neurogenesis, this effect is not likely mediated though effects on ath5 expression and the initiation of neurogenesis.
Ethanol exposure affects retinal cell differentiation
To evaluate the effects of ethanol exposure on retinal cell differentiation, cell-selective retinal cell markers were detected using indirect immunofluorescence. Retinal ganglion cells differentiate between 30 hpf and 40 hpf, beginning at the ventro-nasal region of the eye (Schmitt & Dowling, 1996, 1999; Hu & Easter, 1999) and spreading in a wave-like fashion to temporal and dorsal retina by 40 hpf. We examined ganglion cell development in the ethanol exposed embryos by using an antibody that detects islet-1, a LIM-homeobox protein found in ganglion and amacrine cells (Galli-Resta et al., 1997; Korzh et al., 1998). At 36 hpf, ethanol exposed embryos show reduced islet-1 expression as compared to controls (Figs. 5A, 5B), and a difference in expression is also seen at 48 hpf (Figs. 5C, 5D). At this time, the ethanol-exposed embryos also showed fewer islet-1-positive cells in the developing amacrine cell layer (Figs. 5C, 5D); amacrine cells begin to appear around 40 hpf (Schmitt & Dowling, 1999). These results suggest that ethanol exposure results in a delay or some other defect in differentiation of inner retinal neurons. However, initiation of neuronal differentiation was not affected, consistent with the apparently normal expression of ath5. Because ganglion cells and amacrine cells both generate cell processes as they differentiate, and this contributes to eye growth (Li et al., 2000a), this delay in neuronal differentiation very likely contributes to microphthalmia as a consequence of embryonic ethanol exposure. Interestingly, embryos transferred to unmodified system water at 48 hpf and then examined at 72 hpf, showed a reasonably normal pattern of islet-1 expression as compared to controls (Figs. 5E, 5F), suggesting that the effects of ethanol on ganglion and amacrine cell differentiation are not permanent, and that the process of differentiation of inner retinal neurons can “catch up.” This finding was confirmed through the use of another neuronal marker that labels retinal ganglion cells and amacrine cells, anti-Hu C/D (Kim et al., 1996) (data not shown).
Fig. 5.
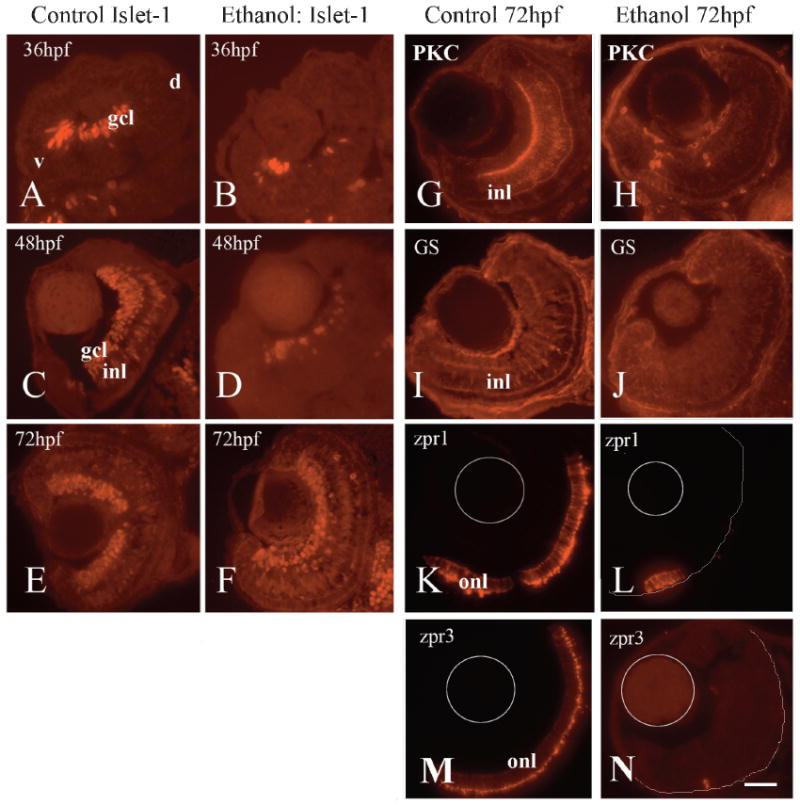
Expression of retinal specific cell markers in ethanol-treated embryos. Panels A–F show representative photos of retinas of untreated embryos (A, C, E) and embryos exposed to ethanol from 24–48 hpf (B, D, F), processed for anti-islet-1 indirect immunofluorescence at 36 hpf (A, B), 48 hpf(C, D) and 72 hpf (E, F). Panels G–N show representative photos of retinas of untreated embryos (G, I, K, M) and embryos exposed to ethanol from 24–48 hpf and transferred to unmodified system water (H, J, L, N) at 72 hpf. Embryos were processed for indirect immunofluorescence using anti-PKC to detect rod bipolar cells (G, H), anti-GS to detect Müller glia (I, J), zpr1 to detect cone photoreceptors (K, L), and zpr3 to detect rod photoreceptors (M, N). Thin gray circles represent the lens, and thin gray semicircles represent the positions of the RPE in panels L, N. Bar=50 μm; v, ventral; d, dorsal; (magnification and orientation is the same for panels A–N); gcl, ganglion cell layer; inl, inner nuclear layer; onl, outer nuclear layer.
Rod bipolar cells were examined using an antibody against protein kinase C (PKC), and the major glial cells of the retina, Müller glia, were examined using an antibody against glutamine synthetase (GS). These antibodies did not reliably detect retinal cells at 48 hpf (Peterson et al., 2001), so we performed indirect immunofluorescence experiments on ethanol-exposed embryos that were transferred to unmodified system water and maintained until 72 hpf. Rod bipolar cells were reduced in number and appeared disorganized in the retinas subjected to the earlier ethanol treatment (Figs. 5G, 5H). Müller glia were apparently absent from the ethanol-treated embryos, although they were widespread in their control counterparts (Figs. 5I, 5J). This was a surprise because immunocytochemically-detectable Müller glia do not appear in the retina until 60 hpf (Peterson et al., 2001), well after the period of ethanol exposure.
Differentiation of retinal photoreceptors also takes place after our ethanol exposure regime, with photoreceptors first becoming detectable in ventro-nasal retina at 48–50 hpf, and populating the entire embryonic outer nuclear layer by 72 hpf (Raymond et al., 1995; Schmitt & Dowling, 1996). Photoreceptor development is sensitive to ethanol exposure from 48 to 72 hpf (Matsui et al., 2006). To determine if ethanol exposure from 24 to 48 hpf affects subsequent photoreceptor differentiation, treated embryos were transferred to unmodified system water, and then processed at 72 hpf for indirect immunofluorescence using zpr1, an antibody that labels a cell-surface epitope on red/green double cones (Larison & Bremiller, 1990) and zpr3, an antibody that labels rod photoreceptors. Control embryos showed labeled cone and rod photoreceptors throughout the outer nuclear layer (Figs. 5K, 5L). In contrast, ethanol-exposed embryos showed either no zpr1-positive or zpr3-positive cells (not shown), or very few (Figs. 5M, 5N), suggesting that ethanol treatment resulted in a delay in differentiation of photoreceptors that was more dramatic than the delay in differentiation of inner retinal neurons. However, the spatial features of initiation of photoreceptor differentiation were not affected by the ethanol exposure, because the few detectable photoreceptors were always located in a small ventro-nasal patch. This finding was confirmed in separate experiments by in situ hybridization of whole-mounted embryos with probes detecting rod opsin or blue cone opsin mRNA (data not shown). These results suggest that, prior to the differentiation of rod bipolar cells, Müller glia and photoreceptors, ethanol exposure affected some developmental feature of the retina that is required for the later spread of differentiation of these retinal cell types.
Ethanol exposure does not affect photoreceptor neurogenesis
To establish whether ethanol treatment prevented photoreceptor determination, we performed in situ hybridization experiments using cRNA probes that hybridize to the mRNA for three photoreceptor-specific transcription factors. The cone-rod homeobox (crx), retinal homeobox 1 (rx1), and NeuroD genes have been shown to either regulate expression of retinal cell specific genes (crx: Chen et al., 1997; rx1: Kimura et al., 2000), or otherwise influence development of photoreceptors (neuroD: Yan & Wang, 1998; Hitchcock & Kakuk-Atkins, 2004). All three of these transcription factors were expressed in ethanol-exposed embryos, in a pattern identical to that of non-exposed embryos (Fig. 6). These labeling experiments highlighted the presence of a clearly delineated outer nuclear layer in ethanol-exposed embryos (Fig. 6). These findings indicate that photoreceptor determination is not affected by ethanol, and that the effects of ethanol treatment on photoreceptor differentiation are not likely to be mediated by crx, rx1, or NeuroD.
Fig. 6.
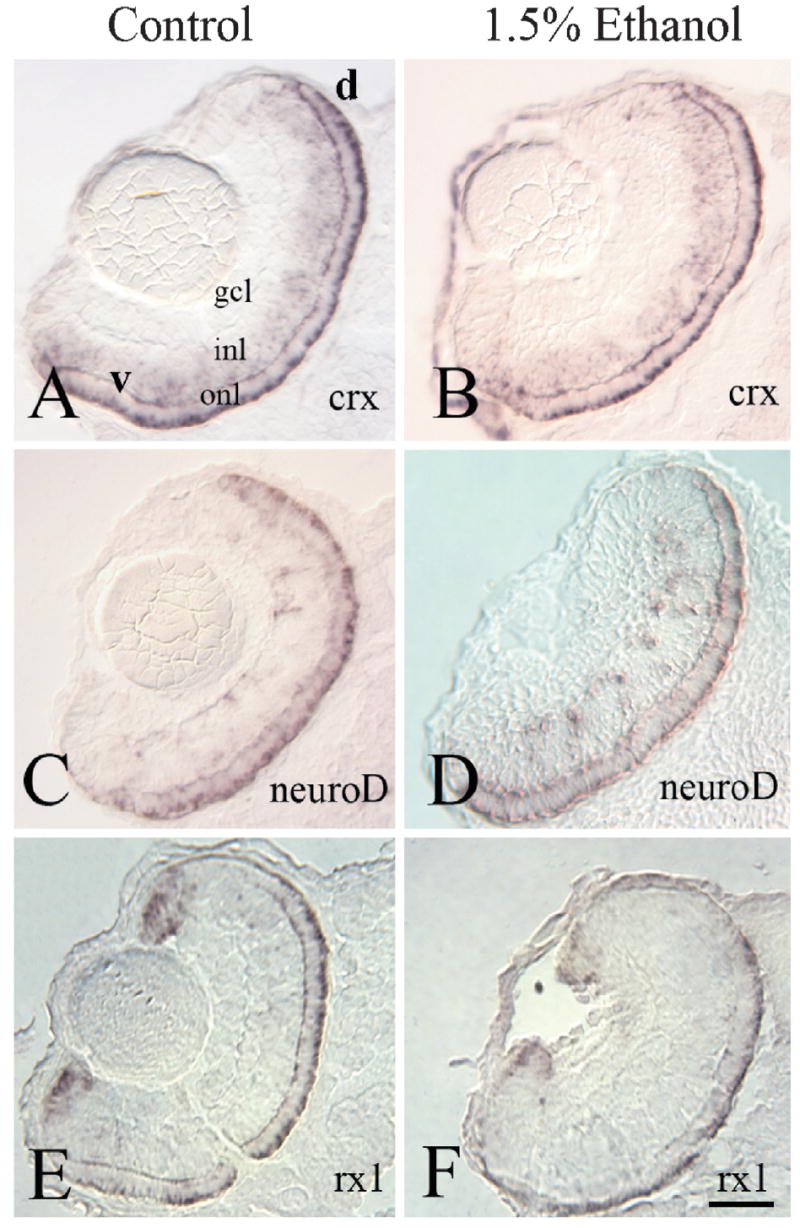
Expression of photoreceptor transcription factors at 72 hpf in embryos exposed to ethanol from 24–48 hpf. Panels A–F show representative photos of retinas of untreated (A, C, E) and ethanol exposed embryos (B, D, F) at 72 hpf. Tissue was processed for in situ hybridization using crx (A, B), neuroD (C, D) and rx1 (E, F). Bar= 50μm; v, ventral; d, dorsal; (magnification and orientation is the same for panels A–F); gcl, ganglion cell layer; inl, inner nuclear layer; onl, outer nuclear layer.
All retinal cell types recover at 96 hpf although microphthalmia persists
Embryos were exposed to ethanol from 24 to 48 hpf, and then were transferred to unmodified system water until 96 hpf. These embryos were processed for indirect immunofluorescence with photoreceptor and Müller glial markers. Remarkably, the ethanol treated embryos appeared to recover from the effects of ethanol exposure, with labeling of zpr1 (cones; Figs. 7A, 7B), zpr3 (rods; Figs. 7C, 7D), and GS (glia; Figs. 7E, 7F), showing normal patterns of cell differentiation. The effects of ethanol on the differentiation of photoreceptors and Müller glia are therefore transient.
Fig. 7.
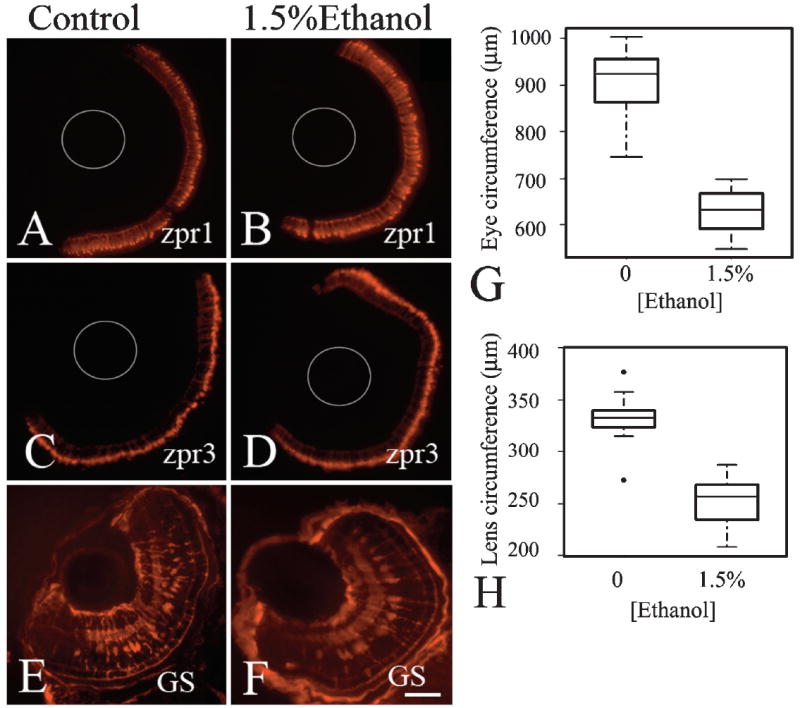
Differentiation of glia and photoreceptors recovers, although microphthalmia and reduced lens size persist in ethanol-exposed embryos. Panels A–F shows representative photos of retinas of untreated embryos (A, C, E) and embryos exposed to ethanol from 24–48 hpf and then transferred to unmodified system water (B, D, E) at 48 hpf and fixed at 96hpf. Embryos were processed for indirect immunofluorescence using zpr1 to detect cone photoreceptors (A, B), zpr3 to detect rod photoreceptors (C, D) and anti-GS to detect Müller glia (E, F). In A–D, thin gray circles represent the positions of the lenses. Bar = 50 μm; v, ventral; d, dorsal; (magnification and orientation is the same for panels A–F). Panels G and H show boxplots of eye and lens circumference measurements, respectively, from one clutch of SH embryos (control n =12; ethanol n =13). In the boxplots, the boxes delineate the 25th to 75th percentiles, the dark horizontal lines depict the medians, the whiskers depict the upper and lower limits, and the filled circles depict outliers as defined by R statistical software.
Eye circumferences of these embryos were measured prior to sectioning. Eyes of the ethanol-treated embryos had remained significantly smaller than those of the untreated controls (Student’s t-test: p ≪ 0.001), indicating that, although the differentiation of retinal cell types was not permanently inhibited, microphthalmia had persisted through larval development. The median eye circumference of ethanol-treated embryos at 96 hpf was 632 μm, similar to the median eye circumference of untreated control embryos at 48 hpf (620–640 μm). Collectively, these data are consistent with significantly delayed differentiation of retinal cells—most prominently photoreceptors and Müller glia—resulting in persistently smaller than normal eyes. To determine if lenses also remain persistently smaller, we measured the lens circumference at 96 hpf (Fig. 7H). The median lens circumference of ethanol treated embryo was 257 μm, slightly higher than the lens circumference observed in untreated control embryos at 48 hpf (240–250 μm) and significantly different from control embryos at 96 hpf (p ≪ 0.001).
Discussion
Ethanol exposure during retinal neurogenesis results in immediate and persistent microphthalmia
This study reveals that ethanol exposure during the major period of retinal neurogenesis results in significant microphthalmia, which is both immediately measurable, and which persists well beyond the initial 24-h exposure period. Our data are consistent with, and extend those of Bilotta et al. (2004), in that the effect of ethanol on eye growth is shown to be dose-dependent over a range of concentrations equal to or less than those previously used by others (Bilotta et al., 2002, 2004; Loucks & Carvan, 2004; Arenzana et al., 2006; Reimers et al., 2006), and that two strains of zebrafish are shown to have similar sensitivities. Ethanol exposure during zebrafish retinal neurogenesis may have lasting effects on the visual system. Therefore, although teleost fish have considerable capacity for post-embryonic retinal neurogenesis (Otteson & Hitchcock, 2003), this capacity is not sufficient to recover from the effects of embryonic ethanol treatment on eye size. A persistent phenotype following embryonic ethanol exposure highlights the utility of the zebrafish as a model for the persistent and deleterious effects of embryonic ethanol exposure in humans. In humans, prenatal ethanol exposure results in microphthalmia, along with various abnormalities in the eye including optic nerve hypoplasia and retinal abnormalities, contributing to lasting visual difficulties (Stromland, 1985, 1987; Stromland & Pinazo-Duran, 2002).
Disrupted retinal cell differentiation is a mechanism for ethanol-induced microphthalmia
Microphthalmia due to teratogenic insult or genetic abnormalities may result from a number of different mechanisms, including general developmental delay, increased cell death, decreased cell proliferation, or decreased retinal cell differentiation (Stenkamp et al., 2002). Our data suggest that the microphthalmic phenotype seen after ethanol exposure during retinal neurogenesis, is due to a cumulative impact of three of these four mechanisms: general delay, increased cell death within the lens, and decreased retinal cell differentiation.
Ethanol exposure resulted in a moderate general developmental delay of six to nine hours, as indicated by our measurements of the HT angle in treated vs. untreated embryos. This degree of delay is not sufficient to account for the virtual arrest of eye growth over the period of ethanol treatment, nor is it sufficient to account for the near absence of photoreceptors in embryos moved to unmodified system water for an additional 24 h, as these features are consistent with at least a 24 h delay in development. Therefore, some eye-specific mechanisms must also be involved.
We were surprised to find that retinal cell death remains relatively low during, and after the period of ethanol exposure, since neuronal apoptosis has been observed in other model systems as a consequence of ethanol treatment (Ikonomidou et al., 2000; Tenkova et al., 2003), and was recently documented in the zebrafish following ethanol exposure from 3 to 24 hpf (Reimers et al., 2006). Our observation of apparently high (although variable) levels of apoptosis in the developing lens was consistent with this recent study, which reported a dose-dependent increase in cell death at the “center of the eye” in response to early ethanol exposure (Reimers et al., 2006). Our measurements of lens circumference confirmed that ethanol exposure resulted in reduced lens size. Lens abnormality should therefore be considered as an additional mechanism involved in generating the microphthalmic phenotype. We estimate that the reduced lens size accounts for only approximately 4% of the reduced eye size (calculated based upon spherical geometry), and so is not likely a major direct contributor to microphthalmia. It is possible, however, that pathological effects on the lens may contribute indirectly to microphthalmia, since the lens may serve as a source of regulatory factors for the adjacent developing retina (Hyer et al., 2003). We also acknowledge that we may have not documented the key developmental time point for revealing cell death within the retina. Similarly, we may also have missed a key developmental time point for revealing effects on cell proliferation.
Ethanol treatment had a notable effect on the production and differentiation of retinal neurons, and it is likely that the lack of developing retinal cells—generating cell processes and growing in size individually (Li et al., 2000a) —contributed to the reduced volume of the ethanol-exposed eyes as compared to controls. Interestingly, the initiation of retinal neurogenesis and differentiation was not affected, as the spatiotemporal expression pattern of ath5 appeared relatively normal. However, the spread of retinal cell differentiation was affected, in that the pattern of pax6 expression retained a neuroepithelial character, even at 48 hpf, and the expression domains of all retinal cell-specific marker tested were delayed in spreading beyond the ventro-nasal region of the eye.
Effects of ethanol exposure may be retinal cell-selective
Several cell types within the developing retina were affected by ethanol exposure over the time of retinal neurogenesis, including ganglion cells, amacrine cells, Müller glia, and rod and cone photoreceptors. The reduction in cell differentiation was most profound for rod and cone photoreceptors, and for Müller glia, all of which showed severely limited differentiation at 72 hpf. This finding is especially remarkable given that this phenotype was observed in embryos that had been exposed to ethanol for 24 h, and then transferred to unmodified system water for 24 h of “recovery” prior to examination. Furthermore, early ethanol exposure did not affect photoreceptor determination, since three photoreceptor-specific transcription factors, crx, rx1, and NeuroD, were all expressed in a well-defined outer nuclear layer. Rather, the expression of photoreceptor subtype-specific markers, zpr1, zpr3, and rod and cone opsin mRNA, was reduced.
These findings complement the recent study by Matsui et al. (2006), who observed photoreceptor maturation defects and corresponding abnormalities in visual function in zebrafish exposed to ethanol beginning at 48 hpf, over the time frame of photoreceptor differentiation and maturation. Specifically, the growth of photoreceptor outer segments was inhibited by ethanol treatment, and electroretinograms revealed reduced photopic and scotopic sensitivities (Matsui et al., 2006). In the present study, an earlier ethanol exposure regime also resulted in photoreceptor differentiation abnormalities, suggesting that this retinal cell population is sensitive to ethanol from the time of cell birth (and possibly earlier) through the time of outer segment maturation. One mechanism proposed to mediate the teratogenic effects of ethanol is inhibition of synthesis of retinoic acid (RA) (DeJonge & Zachman, 1995; Deltour et al., 1996; Zachman & Grummer, 1998). This inhibition may take place either by ethanol competing with retinol for alcohol dehydrogenase, or by acetaldehyde, an ethanol metabolite, competing with retinaldehyde for aldehyde dehydrogenase (Han et al., 1998). Consistent with this proposed mechanism, exogenous RA influences photoreceptor differentiation in zebrafish (Hyatt et al., 1996; Prabhudesai et al., 2005), and other model organisms (Stenkamp et al., 1993; Kelley et al., 1994), and a source of RA is present within the developing vertebrate retina (Marsh-Armstrong et al., 1994; Prabhudesai et al., 2005). We plan to further pursue this hypothesis as it suggests targeted treatments for at least some of the ophthalmic defects of fetal alcohol syndrome.
The apparent sensitivity of Müller glia differentiation to ethanol exposure was not entirely unexpected. In rats, glial cells surrounding the optic nerve are also sensitive to embryonic ethanol exposure (Pinazo-Duran et al., 2005). In this study, the expression of glial fibrillary acidic protein (GFAP) was reduced in the ethanol-treated rats, and this was correlated with significant optic nerve abnormalities. Müller glial cells also express GFAP, suggesting a mechanism whereby ethanol exposure may inhibit expression of genes essential for glial cell differentiation.
A stereotyped microphthalmic phenotype may indicate stress to the embryonic retina
The microphthalmic phenotype reported in the present study bears considerable resemblance to microphthalmic phenotypes seen after experimental manipulation of extracellular and intracellular factors important for eye and retinal development. For example, the sonic-you mutant, a deletion mutant of the sonic hedgehog gene, is microphthalmic, with delayed spread of retinal cell differentiation (Neumann & Nuesslein-Volhard, 2000; Stenkamp et al., 2002). Experimental knock-down of expression of crx (Shen & Raymond, 2004), and rx1 (Rojas-Munoz et al., 2005; S. Nelson, L. Park, D. Stenkamp, unpublished observations), also results in microphthalmia and reduced retinal cell differentiation. Microphthalmia in general has been used to screen for novel developmental mutations (Malicki et al., 1996). While it is possible that ethanol exposure has its microphthalmic effects by an interaction with one or more eye-specific developmental factors (such as with RA signaling, as discussed above), alternative interpretations cannot be ruled out. One such interpretation is that the developing visual system may respond to both eye-selective and more general toxins (such as ethanol) through a conserved pathway, resulting in a common, microphthalmic, phenotype. Human microphthalmia is a common endpoint for a number of teratogens, including ethanol, as well as for increased temperature (fever), and it has been proposed that the gene regulatory activities of heat shock factors may be involved (Lele et al., 1997; Edwards, 1998; Krone et al., 2003). This hypothesis is testable in the zebrafish embryo, which is now developmentally well characterized and a useful model for fetal alcohol syndrome.
Acknowledgments
The authors thank Peter Mathers, Pamela Raymond, Steven Wilson, and Vladimir Korzh for the gifts of cDNAs, and Ruth Frey, Steven Nelson, and Sam Hunter for technical and statistical assistance. We are grateful to the late Joseph Bilotta for encouraging us to use the zebrafish as an experimental model for understanding mechanisms of the microphthalmic effects of embryonic ethanol exposure, and to Peter Hitchcock for a helpful discussion of the microphthalmic phenotype in zebrafish. This work was supported by R01EY012146 (DLS), and by graduate (BK) and undergraduate (LCF) research assistantships from P20RR016454 (Idaho INBRE).
References
- Ahlgren SC, Thakur V, Bronner-Fraser M. Sonic hedgehog rescues cranial neural crest from cell death induced by ethanol exposure. Proceedings of the National Academy of Sciences. 2002;99:10476–10481. doi: 10.1073/pnas.162356199. [DOI] [PMC free article] [PubMed] [Google Scholar]
- Arenzana FJ, Carvan MJ, 3rd, Aijon J, Sanchez-Gonzalez R, Arevalo R, Porteros A. Teratogenic effects of ethanol exposure on zebrafish visual system development. Neurotoxicology and Teratology. 2006;28:342–348. doi: 10.1016/j.ntt.2006.02.001. [DOI] [PubMed] [Google Scholar]
- Barthel LK, Raymond PA. Subcellular localization of alpha-tubulin and opsin mRNA in the goldfish retina using digoxigenin-labeled cRNA probes detected by alkaline phosphatase and HRP histochemistry. Journal of Neuroscience Methods. 1993;50:145–152. doi: 10.1016/0165-0270(93)90002-9. [DOI] [PubMed] [Google Scholar]
- Biehlmaier O, Neuhauss SC, Kohler K. Onset and time course of apoptosis in the developing zebrafish retina. Cell Tissue Research. 2001;306:199–207. doi: 10.1007/s004410100447. [DOI] [PubMed] [Google Scholar]
- Bilotta J, Barnett JA, Hancock L, Saszik S. Ethanol exposure alters zebrafish development: A novel model of fetal alcohol syndrome. Neurotoxicology and Teratology. 2004;26:737–743. doi: 10.1016/j.ntt.2004.06.011. [DOI] [PubMed] [Google Scholar]
- Bilotta J, Saszik S, Givin CM, Hardesty HR, Sutherland SE. Effects of embryonic exposure to ethanol on zebrafish visual function. Neurotoxicology and Teratology. 2002;24:759–766. doi: 10.1016/s0892-0362(02)00319-7. [DOI] [PubMed] [Google Scholar]
- Blader P, Strahle U. Ethanol impairs migration of the prechordal plate in the zebrafish embryo. Developmental Biology. 1998;201:185–201. doi: 10.1006/dbio.1998.8995. [DOI] [PubMed] [Google Scholar]
- Bradfield JY, West JR, Maier SE. Uptake and elimination of ethanol by young zebrafish embryos. Neurotoxicology and Teratology. 2006;28:629–633. doi: 10.1016/j.ntt.2006.06.004. [DOI] [PubMed] [Google Scholar]
- Carvan MJ, 3rd, Loucks E, Weber DN, Williams FE. Ethanol effects on the developing zebrafish: Neurobehavior and skeletal morphogenesis. Neurotoxicol Teratol. 2004;26:757–768. doi: 10.1016/j.ntt.2004.06.016. [DOI] [PubMed] [Google Scholar]
- Chen S, Wang QL, Nie Z, Sun H, Lennon G, Copeland NG, Gilbert DJ, Jenkins NA, Zack DJ. Crx, a novel Otx-like paired-homeodomain protein, binds to and transactivates photoreceptor cell-specific genes. Neuron. 1997;19:1017–1030. doi: 10.1016/s0896-6273(00)80394-3. [DOI] [PubMed] [Google Scholar]
- Cole LK, Ross LS. Apoptosis in the developing zebrafish embryo. Developmental Biology. 2001;240:123–142. doi: 10.1006/dbio.2001.0432. [DOI] [PubMed] [Google Scholar]
- DeJonge MH, Zachman RD. The effect of maternal ethanol ingestion on fetal rat heart vitamin A: A model for fetal alcohol syndrome. Pediatric Research. 1995;37:418–423. doi: 10.1203/00006450-199504000-00006. [DOI] [PubMed] [Google Scholar]
- Deltour L, Ang HL, Duester G. Ethanol inhibition of retinoic acid synthesis as a potential mechanism for fetal alcohol syndrome. The FASEB Journal. 1996;10:1050–1057. [PubMed] [Google Scholar]
- Duester G. A hypothetical mechanism for fetal alcohol syndrome involving ethanol inhibition of retinoic acid synthesis at the alcohol dehydrogenase step. Alcoholism: Clinical and Experimental Research. 1991;15:568–572. doi: 10.1111/j.1530-0277.1991.tb00562.x. [DOI] [PubMed] [Google Scholar]
- Easter SS, Jr, Malicki JJ. The zebrafish eye: Developmental and genetic analysis. Results and Problems in Cell Differentiation. 2002;40:346–370. doi: 10.1007/978-3-540-46041-1_17. [DOI] [PubMed] [Google Scholar]
- Edwards MJ. Apoptosis, the heat shock response, hyperthermia, birth defects, disease and cancer. Where are the common links? Cell Stress Chaperones. 1998;3:213–220. doi: 10.1379/1466-1268(1998)003<0213:athsrh>2.3.co;2. [DOI] [PMC free article] [PubMed] [Google Scholar]
- Galli-Resta L, Resta G, Tan SS, Reese BE. Mosaics of islet-1-expressing amacrine cells assembled by short-range cellular interactions. Journal of Neuroscience. 1997;17:7831–7838. doi: 10.1523/JNEUROSCI.17-20-07831.1997. [DOI] [PMC free article] [PubMed] [Google Scholar]
- Han CL, Liao CS, Wu CW, Hwong CL, Lee AR, Yin SJ. Contribution to first-pass metabolism of ethanol and inhibition by ethanol for retinol oxidation in human alcohol dehydrogenase family—Implications for etiology of fetal alcohol syndrome and alcohol-related diseases. Europen Journal of Biochemistry. 1998;254:25–31. doi: 10.1046/j.1432-1327.1998.2540025.x. [DOI] [PubMed] [Google Scholar]
- Hitchcock P, Kakuk-Atkins L. The basic helix-loop-helix transcription factor neuroD is expressed in the rod lineage of the teleost retina. Journal of Comparative Neurology. 2004;477:108–117. doi: 10.1002/cne.20244. [DOI] [PubMed] [Google Scholar]
- Hitchcock PF, Macdonald RE, VanDeRyt JT, Wilson SW. Antibodies against Pax6 immunostain amacrine and ganglion cells and neuronal progenitors, but not rod precursors, in the normal and regenerating retina of the goldfish. Journal of Neurobiology. 1996;29:399–413. doi: 10.1002/(SICI)1097-4695(199603)29:3<399::AID-NEU10>3.0.CO;2-4. [DOI] [PubMed] [Google Scholar]
- Hu M, Easter SS. Retinal neurogenesis: The formation of the initial central patch of postmitotic cells. Developmental Biology. 1999;207:309–321. doi: 10.1006/dbio.1998.9031. [DOI] [PubMed] [Google Scholar]
- Hug TE, Fitzgerald KM, Cibis GW. Clinical and electroretinographic findings in fetal alcohol syndrome. American Association for Pediatric Ophthalmology and Strabismus. 2000;4:200–204. doi: 10.1067/mpa.2000.105278. [DOI] [PubMed] [Google Scholar]
- Hyatt GA, Schmitt EA, Fadool JM, Dowling JE. Retinoic acid alters photoreceptor development in vivo. Proceedings of the National Academy of Sciences. 1996;93:13298–13303. doi: 10.1073/pnas.93.23.13298. [DOI] [PMC free article] [PubMed] [Google Scholar]
- Hyer J, Kuhlman J, Afif E, Mikawa T. Optic cup morphogenesis requires pre-lens ectoderm but not lens differentiation. Developmental Biology. 2003;259:351–363. doi: 10.1016/s0012-1606(03)00205-7. [DOI] [PubMed] [Google Scholar]
- Ikonomidou C, Bittigau P, Ishimaru MJ, Wozniak DF, Koch C, Genz K, Price MT, Stefovska V, Horster F, Tenkova T, Dikranian K, Olney JW. Ethanol-induced apoptotic neurodegeneration and fetal alcohol syndrome. Science. 2000;287:1056–1060. doi: 10.1126/science.287.5455.1056. [DOI] [PubMed] [Google Scholar]
- Jones KL, Smith DW. Recognition of the fetal alcohol syndrome in early infancy. Lancet. 1973;2:999–1001. doi: 10.1016/s0140-6736(73)91092-1. [DOI] [PubMed] [Google Scholar]
- Kay JN, Finger-Baier KC, Roeser T, Staub W, Baier H. Retinal ganglion cell genesis requires lakritz, a Zebrafish atonal Homolog. Neuron. 2001;30:725–736. doi: 10.1016/s0896-6273(01)00312-9. [DOI] [PubMed] [Google Scholar]
- Kelley MW, Turner JK, Reh TA. Retinoic acid promotes differentiation of photoreceptors in vitro. Development. 1994;120:2091–2102. doi: 10.1242/dev.120.8.2091. [DOI] [PubMed] [Google Scholar]
- Kim CH, Ueshima E, Muraoka O, Tanaka H, Yeo SY, Huh TL, Miki N. Zebrafish elav/HuC homologue as a very early neuronal marker. Neuroscience Letters. 1996;216:109–112. doi: 10.1016/0304-3940(96)13021-4. [DOI] [PubMed] [Google Scholar]
- Kimura A, Singh D, Wawrousek EF, Kikuchi M, Nakamura M, Shinohara T. Both PCE-1/RX and OTX/CRX interactions are necessary for photoreceptor-specific gene expression. Journal of Biological Chemistry. 2000;275:1152–1160. doi: 10.1074/jbc.275.2.1152. [DOI] [PubMed] [Google Scholar]
- Korzh V, Sleptsova I, Liao J, He J, Gong Z. Expression of zebrafish bHLH genes ngn1 and nrd defines distinct stages of neural differentiation. Developmental Dynamics. 1998;213:92–104. doi: 10.1002/(SICI)1097-0177(199809)213:1<92::AID-AJA9>3.0.CO;2-T. [DOI] [PubMed] [Google Scholar]
- Krone PH, Evans TG, Blechinger SR. Heat shock gene expression and function during zebrafish embryogenesis. Seminars in Cell and Developmental Biology. 2003;14:267–274. doi: 10.1016/j.semcdb.2003.09.018. [DOI] [PubMed] [Google Scholar]
- Larison KD, Bremiller R. Early onset of phenotype and cell patterning in the embryonic zebrafish retina. Development. 1990;109:567–576. doi: 10.1242/dev.109.3.567. [DOI] [PubMed] [Google Scholar]
- Lele Z, Engel S, Krone PH. hsp47 and hsp70 gene expression is differentially regulated in a stress- and tissue-specific manner in zebrafish embryos. Developmental Genet. 1997;21:123–133. doi: 10.1002/(SICI)1520-6408(1997)21:2<123::AID-DVG2>3.0.CO;2-9. [DOI] [PubMed] [Google Scholar]
- Li Z, Hu M, Ochocinska MJ, Joseph NM, Easter SS., Jr Modulation of cell proliferation in the embryonic retina of zebrafish (Danio rerio) Developmental Dynamics. 2000a;219:391–401. doi: 10.1002/1097-0177(2000)9999:9999<::AID-DVDY1063>3.0.CO;2-G. [DOI] [PubMed] [Google Scholar]
- Li Z, Joseph NM, Easter SS., Jr The morphogenesis of the zebrafish eye, including a fate map of the optic vesicle. Developmental Dynamics. 2000b;218:175–188. doi: 10.1002/(SICI)1097-0177(200005)218:1<175::AID-DVDY15>3.0.CO;2-K. [DOI] [PubMed] [Google Scholar]
- Loucks E, Carvan MJ., 3rd Strain-dependent effects of developmental ethanol exposure in zebrafish. Neurotoxicology and Teratology. 2004;26:745–755. doi: 10.1016/j.ntt.2004.06.017. [DOI] [PubMed] [Google Scholar]
- Malicki J, Neuhauss SC, Schier AF, Solnica-Krezel L, Stemple DL, Stainier DY, Abdelilah S, Zwartkruis F, Rangini Z, Driever W. Mutations affecting development of the zebrafish retina. Development. 1996;123:263–273. doi: 10.1242/dev.123.1.263. [DOI] [PubMed] [Google Scholar]
- Marsh-Armstrong N, McCaffery P, Gilbert W, Dowling JE, Drager UC. Retinoic acid is necessary for development of the ventral retina in zebrafish. Proceedings of the National Academy of Sciences. 1994;91:7286–7290. doi: 10.1073/pnas.91.15.7286. [DOI] [PMC free article] [PubMed] [Google Scholar]
- Masai I, Stemple DL, Okamoto H, Wilson SW. Midline signals regulate retinal neurogenesis in zebrafish. Neuron. 2000;27:251–263. doi: 10.1016/s0896-6273(00)00034-9. [DOI] [PubMed] [Google Scholar]
- Matsui JI, Egana AL, Sponholtz TR, Adolph AR, Dowling JE. Effects of ethanol on photoreceptors and visual function in developing zebrafish. Investigative Ophthalmology & Visual Science. 2006;47:4589–4597. doi: 10.1167/iovs.05-0971. [DOI] [PMC free article] [PubMed] [Google Scholar]
- Neumann CJ, Nuesslein-Volhard C. Patterning of the zebrafish retina by a wave of sonic hedgehog activity. Science. 2000;289:2137–2139. doi: 10.1126/science.289.5487.2137. [DOI] [PubMed] [Google Scholar]
- Nornes S, Clarkson M, Mikkola I, Pedersen M, Bardsley A, Martinez JP, Krauss S, Johansen T. Zebrafish contains two pax6 genes involved in eye development. Mechanisms of Development. 1998;77:185–196. doi: 10.1016/s0925-4773(98)00156-7. [DOI] [PubMed] [Google Scholar]
- Otteson DC, Hitchcock PF. Stem cells in the teleost retina: Persistent neurogenesis and injury-induced regeneration. Vision Research. 2003;43:927–936. doi: 10.1016/s0042-6989(02)00400-5. [DOI] [PubMed] [Google Scholar]
- Peng Y, Yang PH, Ng SS, Wong OG, Liu J, He ML, Kung HF, Lin MC. A critical role of Pax6 in alcohol-induced fetal microcephaly. Neurobiology of Disease. 2004;16:370–376. doi: 10.1016/j.nbd.2004.03.004. [DOI] [PubMed] [Google Scholar]
- Peterson RE, Fadool JM, McClintock J, Linser PJ. Muller cell differentiation in the zebrafish neural retina: Evidence of distinct early and late stages in cell maturation. The Journal of Comparative Neurology. 2001;429:530–540. doi: 10.1002/1096-9861(20010122)429:4<530::aid-cne2>3.0.co;2-c. [DOI] [PubMed] [Google Scholar]
- Pinazo-Duran MD, Cervera R, Pons S, Zanon-Moreno VC, Gallego-Pinazo R, Guerri C. Mechanisms of protein expression in the rat optic nerve. Modifications by alcohol exposure. Archivos de la Sociedad Española de Oftalmología. 2005;80:99–104. doi: 10.4321/s0365-66912005000200008. [DOI] [PubMed] [Google Scholar]
- Prabhudesai SN, Cameron DA, Stenkamp DL. Targeted effects of retinoic acid signaling upon photoreceptor development in zebrafish. Developmental Biology. 2005;287:157–167. doi: 10.1016/j.ydbio.2005.08.045. [DOI] [PMC free article] [PubMed] [Google Scholar]
- R, D.C.T. R: A language and environment for statistical computing. R Foundation for statistical computing; Vienna, Austria: 2006. [Google Scholar]
- Raymond PA, Barthel LK, Curran GA. Developmental patterning of rod and cone photoreceptors in embryonic zebrafish. The Journal of Comparative Neurology. 1995;359:537–550. doi: 10.1002/cne.903590403. [DOI] [PubMed] [Google Scholar]
- Reimers MJ, La Du JK, Periera CB, Giovanini J, Tanguay RL. Ethanol-dependent toxicity in zebrafish is partially attenuated by antioxidants. Neurotoxicology and Teratology. 2006;28:497–508. doi: 10.1016/j.ntt.2006.05.007. [DOI] [PubMed] [Google Scholar]
- Rojas-Munoz A, Dahm R, Nusslein-Volhard C. chokh/rx3 specifies the retinal pigment epithelium fate independently of eye morphogenesis. Developmental Biology. 2005;288:348–362. doi: 10.1016/j.ydbio.2005.08.046. [DOI] [PubMed] [Google Scholar]
- Schmitt EA, Dowling JE. Comparison of topographical patterns of ganglion and photoreceptor cell differentiation in the retina of the zebrafish, Danio rerio. Journal of Comparative Neurology. 1996;371:222–234. doi: 10.1002/(SICI)1096-9861(19960722)371:2<222::AID-CNE3>3.0.CO;2-4. [DOI] [PubMed] [Google Scholar]
- Schmitt EA, Dowling JE. Early retinal development in the zebrafish, Danio rerio: Light and electron microscopic analyses. Journal of Comparative Neurology. 1999;404:515–536. [PubMed] [Google Scholar]
- Shen YC, Raymond PA. Zebrafish cone-rod (crx) homeobox gene promotes retinogenesis. Developmental Biology. 2004;269:237–251. doi: 10.1016/j.ydbio.2004.01.037. [DOI] [PubMed] [Google Scholar]
- Smith SM. Alcohol-induced cell death in the embryo. Alcohol Health & Research World. 1997;21:287–297. [PMC free article] [PubMed] [Google Scholar]
- Stenkamp DL, Frey RA, Mallory DE, Shupe EE. Embryonic retinal gene expression in sonic-you mutant zebrafish. Developmental Dynamics. 2002;225:344–350. doi: 10.1002/dvdy.10165. [DOI] [PubMed] [Google Scholar]
- Stenkamp DL, Gregory JK, Adler R. Retinoid effects in purified cultures of chick embryo retina neurons and photoreceptors. Investigative Ophthalmology & Visual Science. 1993;34:2425–2436. [PubMed] [Google Scholar]
- Stenkamp DL, Hisatomi O, Barthel LK, Tokunaga F, Raymond PA. Temporal expression of rod and cone opsins in embryonic goldfish retina predicts the spatial organization of the cone mosaic. Investigative Ophthalmology & Visual Science. 1996;37:363–376. [PubMed] [Google Scholar]
- Stratton KR, Howe C, Battaglia FC. Fetal Alcohol Syndrome: Diagnosis, Epidemiology, Prevention, and Treatment. Washington, DC: National Academy Press; 1996. [Google Scholar]
- Stromland K. Ocular abnormalities in the fetal alcohol syndrome. Acta Ophthalmologica Scandinavica. 1985;171:1–50. [PubMed] [Google Scholar]
- Stromland K. Ocular involvement in the fetal alcohol syndrome. Survey of Ophthalmology. 1987;31:277–284. doi: 10.1016/0039-6257(87)90028-2. [DOI] [PubMed] [Google Scholar]
- Stromland K, Pinazo-Duran MD. Ophthalmic involvement in the fetal alcohol syndrome: clinical and animal model studies. Alcohol and Alcoholism. 2002;37:2–8. doi: 10.1093/alcalc/37.1.2. [DOI] [PubMed] [Google Scholar]
- Sulik KK. Genesis of alcohol-induced craniofacial dysmorphism. Experimental Biology and Medicine (Maywood) 2005;230:366–375. doi: 10.1177/15353702-0323006-04. [DOI] [PubMed] [Google Scholar]
- Tenkova T, Young C, Dikranian K, Labruyere J, Olney JW. Ethanol-induced apoptosis in the developing visual system during synaptogenesis. Investigative Ophthalmology & Visual Science. 2003;44:2809–2817. doi: 10.1167/iovs.02-0982. [DOI] [PubMed] [Google Scholar]
- Westerfield M. The zebrafish book A guide for the laboratory use of zebrafish (Danio rerio) 4. Eugene, OR: University of Oregon; 2000. [Google Scholar]
- Yan RT, Wang SZ. neuroD induces photoreceptor cell overproduction in vivo and de novo generation in vitro. Journal of Neurobiology. 1998;36:485–496. [PMC free article] [PubMed] [Google Scholar]
- Zachman RD, Grummer MA. The interaction of ethanol and vitamin A as a potential mechanism for the pathogenesis of Fetal Alcohol syndrome. Alcoholism: Clinical and Experimental Research. 1998;22:1544–1556. [PubMed] [Google Scholar]