Abstract
Krüppel-like factor 6 (KLF6) is a DNA-binding protein containing a triple zinc-fingered motif and plays a key role in the regulation of cell proliferation, differentiation, and development. More recently it has been implicated in hepatic fibrosis via its binding to the transforming growth factor (TGF)-β control element. In the kidney, epithelial-mesenchymal transition (EMT) is a major contributor to the pathogenesis of renal fibrosis, with TGF-β1 being a key mediator of EMT. The present study aimed to determine the role of KLF6 and TGF-β1 in EMT in proximal tubule cells. To determine the relevance in clinical disease, KLF6 was measured in kidneys of streptozotocin-induced diabetic Ren-2 rats and in cells exposed to high (30 mM) glucose. TGF-β1 was confirmed to induce EMT by morphological change, loss of E-cadherin, and gain in vimentin expression. KLF6 mRNA expression was concomitantly measured. To determine the role of KLF6 in EMT, the above markers of EMT were determined in KLF6-silenced (small interfering RNA) and KLF6-overexpressing proximal tubule cells. KLF6 overexpression significantly promoted a phenotype consistent with EMT. High glucose induced KLF6 in proximal tubule cells (P < 0.05). This increase in KLF6 in response to high glucose was TGF-β1 mediated. In an in vivo model of diabetic nephropathy KLF6 increased at week 8 (P < 0.05). KLF6 plays a permissive role in TGF-β1-induced EMT in proximal tubule cells. Its upregulation in in vivo models of diabetic nephropathy suggests it as a potential therapeutic target.
Keywords: diabetic nephropathy, interstitial fibrosis, transcription factor
most chronic nephropathies share pathogenic mechanisms that contribute to disease progression, independent of the original cause or disease. Renal fibrosis represents a failed wound-healing process of renal tissue after chronic, sustained injury and is typically characterized by the remarkably consistent histopathological features of glomerulosclerosis, interstitial fibrosis, and tubular atrophy—implying a “final common pathway” of injury. This process is typically progressive and irreversible, with the degree of interstitial fibrosis appearing to be the most important predictor of the rate of progression of chronic kidney disease (CKD) (24).
Given the urgent need for new therapeutic agents that directly address this process, the major intracellular signaling pathways involved in mediating this “final common pathway” have been the focus of intense research interest, in particular, the mechanisms whereby increased myofibroblast recruitment and activation in the interstitium leads to increased extracellular matrix (ECM) formation and ultimately CKD.
While resident renal fibroblasts are traditionally considered to be the principal mediators of fibrosis, convincing evidence now exists to suggest that the appearance of interstitial myofibroblasts is also critical, with myofibroblasts being more profibrotic than resident interstitial fibroblasts. In addition, the proximal tubular epithelial cell (PTC) also plays an important role in the deposition of ECM. Like myofibroblasts, PTCs are of mesenchymal origin and appear capable of reverting to a mesenchymal phenotype via a process known as epithelial-mesenchymal transition (EMT) in response to certain physiological cues. Defined as a process whereby PTCs lose their epithelial phenotype and acquire new characteristics of mesenchyme, EMT is characterized by four pivotal steps that occur in a highly regulated fashion and is driven predominantly by the pleiotropic cytokine transforming growth factor (TGF)-β1 (20, 34). In essence, these PTCs appear capable of altering their morphology, expressing myofibroblastic markers, breaching the tubular basement membrane, and migrating into the interstitium, thus joining the pool of matrix-producing fibroblasts. It is suggested that EMT contributes up to one-third of the total interstitial fibroblast population (12, 35), with disruption of the tubular basement membrane being a necessary step in facilitating the transition (3).
While the process itself and the intracellular pathways regulating it, such as the TGF-β1/Smad pathway, have been well described, less is known about the upstream signaling factors responsible for its initiation.
The transcription factor Krüppel-like factor 6 (KLF6) belongs to a 17-member family of DNA binding transcriptional regulators that play diverse roles during differentiation and development—capable of functioning as an activator of transcription, a repressor, or both. The list of cellular “target” genes of KLF6 includes collagen α1 (28), urokinase plasminogen activator (uPA) (16), TGF-β1, and type I and II TGF-β1 receptors (15). It also directly transactivates the E-cadherin promoter (6). While most commonly described in terms of its role as a tumor suppressor gene (11, 13, 17, 23, 29), KLF6 has also been shown to act as an immediate-early gene in in vivo models of hepatic fibrosis (15, 28, 31) and more recently was identified to be one of seven genes whose expression is upregulated >10-fold within the first few hours of renal ischemia-reperfusion injury in mice, with the expression of TGF-β1 mRNA and protein following a pattern similar to that of KLF6 both in vivo and in vitro (32).
The present study aimed to establish the nature of total KLF6 expression in EMT occurring in vivo and in vitro and to specifically examine the role of KLF6 in EMT mediated by the proinflammatory cytokine TGF-β1. The in vivo relevance of KLF6 was assessed in a model of diabetic nephropathy associated with overproduction of activated TGF-β1 (14) and was subsequently confirmed in vitro.
MATERIALS AND METHODS
Cell culture.
HK-2 cells, a human proximal tubule cell line from American Type Culture Collection (ATCC), were used in this study as previously described (27). HK-2 cells were 10% subconfluent when seeded onto a six-well plate, and cells were maintained in medium containing TGF-β1 (Sigma-Aldrich, St. Louis, MO) at a concentration of 0.5 ng/ml in 5 mmol/l d-glucose or 5 mmol/l d-glucose alone for 72 h. Medium was changed after 48 h to maintain TGF-β1 levels in the desired range. The cellular adhesion molecule E-cadherin, which is responsible for maintaining structural integrity between cells, was selected as a marker to denote epithelial cell phenotype; the intermediate filament vimentin was chosen as a myofibroblast marker. RNA was extracted with the RNeasy mini kit (Qiagen, Valencia, CA), and E-cadherin and vimentin mRNA expression were measured by reverse transcription-PCR (RT-PCR) and KLF6 mRNA expression by real-time RT-PCR. The role of the KLF6 splice variant KLF6-SV1 has been well described in several cancer cell lines to antagonize wild-type KLF6, with the ratio between the two determining the net effect of KLF6. We investigated the role of KLF6-SV1 in HK-2 cells undergoing EMT while maintained in medium containing TGF-β1 (Sigma-Aldrich) at a concentration of 0.5 ng/ml in 5 mmol/l d-glucose or 5 mmol/l d-glucose alone for 72 h. KLF6-SV1 mRNA expression was measured by both RT-PCR and real-time RT-PCR.
To determine the relevance of total KLF6 in a model of diabetic nephropathy, KLF6 expression was measured in HK-2 cells maintained in medium containing 5 or 30 mmol/l d-glucose or 30 mmol/l l-glucose for 11 days. Total KLF6 mRNA expression was measured by real-time RT-PCR. To determine the role of TGF-β1 in high-glucose-induced KLF6 mRNA expression, total KLF6 expression was measured in TGF-β1-silenced HK-2 cells treated with or without 30 mmol/l d-glucose for 72 h. To determine this at a later time point (11 days), a TGF-β neutralizing antibody was used to treat the cells exposed to 30 mmol/l d-glucose for 11 days and then KLF6 mRNA was measured.
HK-2 cells were exposed to 30 mmol/l d-glucose for 4, 8, 15, 24, 48, and 72 h and 11 days. Total KLF6 and TGF-β1 mRNA expression were measured by real-time RT-PCR.
KLF6 plasmid construction.
KLF6 cDNA fragment was cloned into pCMV6-XL5 vector and was then sequenced to confirm that KLF6 cDNA had been cloned into the vector. Four micrograms of KLF6 plasmid was introduced into HK-2 cells with Lipofectamine 2000 according to manufacturer's instructions (Invitrogen). In parallel, cells were transfected with an empty pCMV6-XL5 vector containing nontargeting sequence that served as negative control. Cells were treated with or without 0.5 ng/ml TGF-β1 for 72 h. RNA was extracted with the RNeasy Mini kit (Qiagen) to verify KLF6 gene expression levels and to measure E-cadherin and vimentin mRNA expression.
Gene silencing by small interfering RNA.
Double-stranded RNA molecules (27-mer) were chemically synthesized (Ambion). The complementary oligonucleotides were 2′-deprotected, annealed, and purified by the manufacturer. The sequence specifically targeting human KLF6 (accession no. NM_001008490) was 5′-AAGCCAGGTGACAAGGGAAATGGCGAT-3′. Thirty nanomoles/liter of KLF6 small interfering RNA (siRNA) was introduced into HK-2 cells with Lipofectamine 2000 according to manufacturer's instructions (Invitrogen). In parallel, cells were transfected with 30 nmol/l of nonspecific siRNA, which served as the control data set. Cells were treated with or without 0.5 ng/ml TGF-β1 for 72 h. The sequence specifically targeting human TGF-β1 as previously described (27) was introduced into HK-2 cells with the method described above. Cells were then treated with or without 30 mmol/l d-glucose for 72 h. RNA was extracted with the RNeasy Mini kit (Qiagen) to verify KLF6 gene expression levels and to measure E-cadherin and vimentin mRNA expression.
Reverse transcription-polymerase chain reaction.
Total RNA was extracted with the RNeasy Mini kit (Qiagen) according to manufacturer's instructions. RNA was then DNased, and RT-PCR was performed with SuperScript III One-Step RT-PCR System and Platinum Taq DNA polymerase (Invitrogen). Both water blank and non-reverse-transcribed RNA samples were used as negative controls. The number of amplification cycles in the semiquantitative PCR was determined from the linear portion of the PCR cycle, and amplification was performed with increasing numbers of cycles for KLF6, E-cadherin, vimentin, TGF-β, and β-actin. Primers were designed to be suitable for both RT-PCR and real-time RT-PCR (SYBR Green) uses (Table 1). Amplified products for KLF6, E-cadherin, vimentin, TGF-β, and β-actin were electrophoresed through 1.5% (wt/vol) agarose gels and visualized by ethidium bromide staining. Bands were scanned with Gel Documentation (Bio-Rad) and quantitated by densitometry with Quantity One software (Bio-Rad). β-Actin was used as an internal control for sample normalization.
Table 1.
Primer sequences for RT-PCR
| Gene Name | Accession No. | Sense | Antisense | Size, bp |
|---|---|---|---|---|
| KLF6 | NM_001008490 | TCCACGCCTCCATCTTCT | CATCGCATTTCCCTTGT | 136 |
| KLF6-SV1 | CCTCGCCAGGGAAGGAGAA | TCCACAGATCTTCCTGGCTGTC | ||
| E-cadherin | NM_004360 | TCTTCAATCCCACCACG | TCTCCAAATCCGATATGTTA | 461 |
| Vimentin | NM_003380 | GGACTCGGTGGACTTCTC | CGCATCTCCTCCTCGTAG | 221 |
| TGF-β | NM_000660 | GCAACAATTCCTGGCGATACC | CTCCACGGCTCAACCACTG | 111 |
| Actin | AY582799 | ATCGTGCGTGACATTAAG | ATTGCCAATGGTGATGAC | 135 |
KLF6, Krüppel-like factor 6; TGF, transforming growth factor.
Real-time RT-PCR.
Real-time PCR was performed with Brilliant SYBR Green Single-Step QRT-PCR Master Mix (Stratagene, La Jolla, CA) to assess transcript levels of KLF6. Both water blank and non-reverse-transcribed RNA samples were used as negative controls. Real-time quantitations were performed on the Bio-Rad iCycler iQ system. The fluorescence threshold value was calculated with iCycle iQ system software. The calculation of relative change in mRNA was performed with the delta-delta method (26), with normalization for the housekeeping gene β-actin as described previously (22).
In vivo studies in diabetic transgenic (mRen-2)27 rats.
Eight-week-old female homozygous (mRen-2)27 rats (St. Vincent's Hospital Animal House) weighing 170 ± 20 g were randomized to receive either 55 mg/kg of streptozotocin (STZ; Sigma, St Louis, MO) diluted in 0.1 M citrate buffer pH 4.5 or citrate buffer (nondiabetic) by tail vein injection after an overnight fast (9, 14). Each week, rats were weighed and their blood glucose was determined with an AMES glucometer (Bayer Diagnostics, Melbourne, Australia), and only STZ-treated animals with blood glucose >20 mmol/l were considered diabetic (Table 2). Every 4 wk, systolic blood pressure (SBP) was determined in conscious rats via tail-cuff plethysmography with a noninvasive blood pressure (NIBP) controller and PowerLab (AD Instruments). All animals were housed in a stable environment maintained at 22 ± 1°C with a 12:12-h light-dark cycle commencing at 6 AM. Diabetic rats received injections of insulin (2–4 U ip; Humulin NPH, Eli Lilly, Indianapolis, IN) twice a week to reduce mortality and to promote weight gain. Experimental procedures adhered to the guidelines of the National Health and Medical Research Council of Australia's Code for the Care and Use of Animals for Scientific Purposes and were approved by the Animal Research Ethics Committee of St. Vincent's Hospital.
Table 2.
Animal characteristics
| Treatment Groups | n | BW, g | SBP, mmHg | BG, mmol/l |
|---|---|---|---|---|
| Control | 8 | 478±9 | 215±6 | 6.69±0.17 |
| Diabetic | 8 | 368±8* | 213±13 | 30.62±0.84† |
Values are means ± SE for n rats. BW, body weight; SBP, systolic blood pressure; BG, blood glucose.
P < 0.05,
P < 0.01 vs. control.
Tissue preparation and immunohistochemistry.
Rats were anesthetized (Nembutal 60 mg/kg body wt ip, Boehringer-Ingelheim), and the abdominal aorta was cannulated with an 18-gauge needle. Perfusion-exsanguination commenced at SBP of 180–220 mmHg via the abdominal aorta with 0.1 M PBS pH 7.4 (20–50 ml) to remove circulating blood, and the inferior vena cava adjacent to the renal vein was simultaneously severed, allowing free flow of the perfusate. After clearance of circulating blood, 4% paraformaldehyde in 0.1 M phosphate buffer, pH 7.4, was perfused for a further 5 min (100–200 ml of fixative). Kidneys were then excised, decapsulated, sliced transversely, immersed in 4% paraformaldehyde in 0.1 M phosphate buffer for overnight fixation, and then paraffin embedded for subsequent light microscopic evaluation (14).
Immunohistochemistry for KLF6, E-cadherin, and vimentin.
In brief, 4-μm sections were placed into Histosol to remove the paraffin wax, rehydrated in graded ethanol, and immersed into tap water (distilled H2O) before being incubated for 20 min with normal swine serum diluted 1:10 with 0.1 mol/l PBS, pH 7.4. Sections were then incubated with rabbit anti-KLF6 (Santa Cruz Biotechnology, Santa Cruz, CA) diluted 1:100, rabbit anti-E-cadherin (Santa Cruz Biotechnology) diluted 1:50, and rabbit anti-vimentin (Santa Cruz Biotechnology) diluted 1:100 with PBS overnight (18 h) at 4°C. The following day the sections were thoroughly washed in PBS (3 × 5-min changes), incubated with 3% hydrogen peroxide for 10 min to block endogenous peroxide, and then rinsed with PBS (2 × 5 min) and incubated with biotinylated swine anti-rabbit IgG antibody (DAKO, Carpinteria, CA) diluted 1:200 with PBS. Sections were rinsed with PBS (2 × 5 min), followed by incubation with an avidin-biotin peroxidase complex (Vector, Burlingame, CA) diluted 1:200 with PBS. After rinsing with PBS (2 × 5 min), localization of the peroxidase conjugates was achieved by using diaminobenizidine tetrahydrochloride as a chromagen for 1–3 min. Sections were rinsed in tap water for 5 min to stop the reaction and then counterstained in Mayer's hematoxylin, in Scott's tap water, dehydrated, cleared, and mounted in DPX. Sections incubated with 1:10 normal swine serum, instead of the primary antiserum, served as the negative controls (14).
Quantitation of E-cadherin and vimentin expression.
The extent of immunostaining of E-cadherin or vimentin was quantified by computer-assisted image analysis, as previously reported (18, 19). Briefly, 10 random nonoverlapping fields in the cortex area from 6 rats per group were captured and digitized with a BX50 microscope attached to a Fujix HC5000 digital camera. Digital images were then loaded onto a Pentium III IBM computer. An area of brown on immunostained sections (E-cadherin or vimentin) was selected for its color ranges, and the proportional area of tissue with their respective ranges of color was then quantified. Calculation of the proportional area stained brown (E-cadherin or vimentin) was then determined by image analysis (AIS, Analytical imaging Station version 6.0).
Statistical analysis.
All results are expressed as a percentage of the control value, with the exception of real-time RT-PCR results, which are expressed as a fold change compared with the control value. Each experiment was performed independently a minimum of three times. Results are expressed as means ± SE. Statistical comparisons between groups were made by analysis of variance (ANOVA), with pairwise multiple comparisons made by Fisher's protected least significant difference test. Analyses were performed with the software package Statview version 4.5 (Abacus Concepts, Berkley, CA). P values <0.05 were considered significant.
RESULTS
EMT markers in diabetic transgenic (mRen2)27 rats.
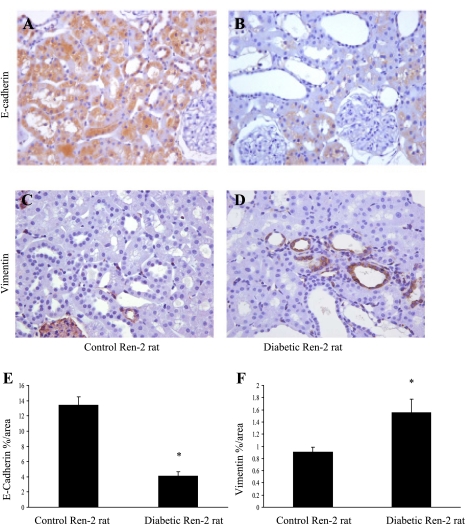
At 4 wk after induction of diabetes, E-cadherin immunostaining in the proximal tubule cells of diabetic Ren-2 rats was reduced compared with controls (Fig. 1, A and B), while vimentin immunostaining was increased at the same time point (Fig. 1, C and D). The percentage of total surface area that stained positive for E-cadherin was 4.1 ± 0.53% in the diabetic Ren-2 rats versus 13.42 ± 1.1% in control rats (Fig. 1E), while the percentage of total surface area that stained positive for vimentin was 0.91 ± 0.08% in control rats versus 1.56 ± 0.22% in diabetic Ren-2 rats (Fig. 1F), suggesting that the proximal tubule cells had begun to lose their epithelial phenotype and begin to express myofibroblastic markers.
Fig. 1.
Markers of epithelial-mesenchymal transition (EMT) in streptozotocin-induced diabetic Ren-2 rats. A–D: representative photomicrographs of E-cadherin (A and B) and vimentin (C and D) immunohistochemistry in control and diabetic rats at 8 wk. Magnification ×350. E and F: quantitation of E-cadherin and vimentin expression in control and diabetic Ren-2 rats. Proximal tubule cells have reduced levels of E-cadherin expression (E) and increased levels of vimentin expression (F) in the diabetic Ren-2 rats compared with controls, suggesting that these cells are undergoing EMT. Results are expressed as means ± SE. *P < 0.05 vs. control.
KLF6 expression in diabetic conditions in vitro and in vivo.
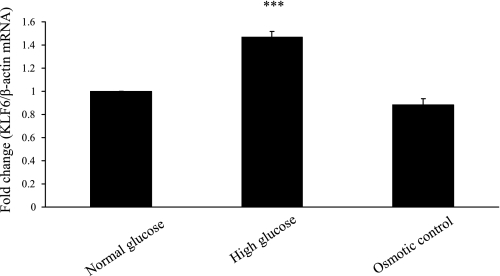
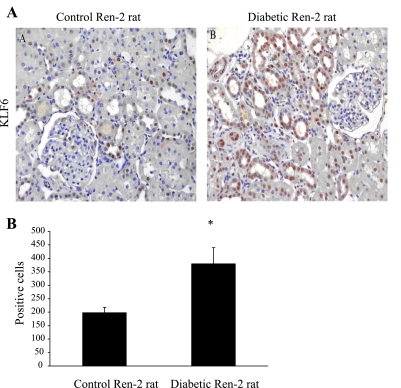
KLF6 was measured in cells exposed to high (30 mM) glucose and in kidneys of STZ-induced diabetic Ren-2 rats. The role of high glucose in inducing KLF6 is confirmed in Fig. 2, where exposure of HK-2 cells to 30 mmol/l d-glucose for 11 days increased KLF6 mRNA by 1.47-fold (P < 0.0005) compared with 5 mmol/l d-glucose and 30 mmol/l l-glucose. KLF6 was detected in the tubules of diabetic Ren-2 rats at week 4, while only weak staining was observed in control animals (Fig. 3A), the number of KLF6-positive cells increasing from 198 ± 20% to 380 ± 60% proportional area of staining (Fig. 3B).
Fig. 2.
Krüppel-like factor 6 (KLF6) expression following exposure to 30 mmol/l d-glucose (high glucose) compared with 5 mmol/l d-glucose (normal glucose) and 30 mmol/l l-glucose (osmotic control) at 11 days measured by real-time RT-PCR. Result is expressed as fold change. ***P < 0.0005 vs. control.
Fig. 3.
KLF6 expression in diabetic Ren-2 rats. A: representative photomicrographs of KLF6 immunohistochemistry in control and diabetic rats at 8 wk. Magnification ×350. B: no. of KLF6-positive cells in control and diabetic rats as percentage proportional area of staining.
High-glucose-induced KLF6 expression is mediated by TGF-β1.
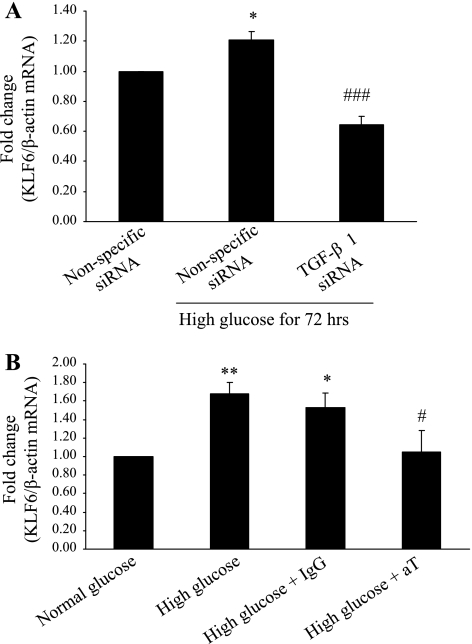
To determine whether KLF-6 expression induced by high glucose is mediated by TGF-β1 in HK-2 cells, KLF6 mRNA was measured in cells exposed to high glucose for 72 h where TGF-β1 was effectively silenced. KLF6 mRNA expression was reduced to 65 ± 5.0% of control (P < 0.0005) (Fig. 4A). siRNA can only be effective up to 72 h; hence TGF-β neutralizing antibody was also used in the study of 11 days. KLF6 mRNA expression was measured in HK-2 cells exposed to high glucose and treated with either 3.0 μg/ml of TGF-β neutralizing antibody or normal rabbit IgG (control) for 11 days. Medium was refreshed every 48 h. Treatment with high glucose alone increased KLF6 mRNA expression by 1.68 ± 0.13-fold (P < 0.005), whereas treatment with high glucose and TGF-β neutralizing antibody resulted in a 1.05 ± 0.23-fold increase (P < 0.05 vs. IgG + high glucose) (Fig. 4B).
Fig. 4.
A: KLF6 expression in transforming growth factor (TGF)-β1-silenced HK-2 cells measured by real-time RT-PCR at 72 h. Results are expressed as fold change. *P < 0.05 vs. nonspecific small interfering RNA (siRNA); ###P < 0.0005 vs. nonspecific siRNA + high glucose. B: KLF6 expression in HK-2 cells treated with TGF-β1 neutralizing antibody for 11 days measured by real-time RT-PCR. Results are expressed as fold change. *P < 0.05, **P < 0.005 vs. normal glucose; #P < 0.0005 vs. high glucose + IgG. aT, TGF-β neutralizing antibody (30 μg/ml); IgG, normal rabbit IgG (30 μg/ml).
High-glucose-induced KLF6 expression remains elevated at 11 days in vitro.
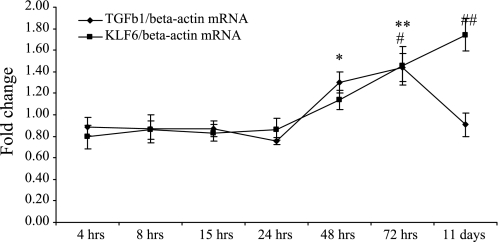
An 11-day time course study was conducted to measure the induction of TGF-β1 and KLF6 in response to high glucose. The induction of KLF6 was of a magnitude and a temporal pattern similar to those of TGF-β1 up to 72 h, at which point KLF6 mRNA expression continued to rise to 1.74 ± 0.15-fold compared with normal glucose (control) (P < 0.005) whereas TGF-β1 mRNA expression had returned to pretreatment levels of 0.91 ± 0.11-fold compared with normal glucose (control) (P = not significant) (Fig. 5). These data suggest that KLF6 and TGF-β1 may have functionally distinct roles at different time points along the temporal sequence in high-glucose-mediated cell injury.
Fig. 5.
High-glucose-induced KLF6 and TGF-β1 expression over 11 days measured by real-time RT-PCR. Results are expressed as fold change. TGF-β1: *P < 0.05, **P < 0.005 vs. normal glucose. KLF6: #P < 0.05, ##P < 0.005 vs. normal glucose.
TGF-β1 induces EMT and KLF6 in HK-2 cells.
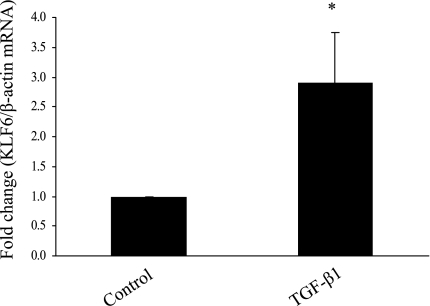
TGF-β1 has long been recognized as a potent inducer of EMT in HK-2 cells (8, 33). The levels of E-cadherin and vimentin mRNA expression were measured at 72 h in response to 0.5 ng/ml TGF-β1. The reduction in E-cadherin mRNA expression in response to TGF-β1 was accompanied by an increase in vimentin mRNA expression in preliminary experiments, confirming that these cells underwent EMT in response to TGF-β1 (data not shown). KLF6 expression was found to increase almost threefold (P < 0.05) with exposure to 0.5 ng/ml TGF-β1 for 72 h by real-time RT-PCR (Fig. 6). KLF6-SV1 was also measured with real-time RT-PCR; however, no PCR product was amplified.
Fig. 6.
KLF6 expression following exposure to 0.5 ng/ml TGF-β1 for 72 h measured by real-time RT-PCR. Results are expressed as fold change. *P < 0.05 vs. control.
EMT markers in KLF6-overexpressing or -silenced HK-2 cells.
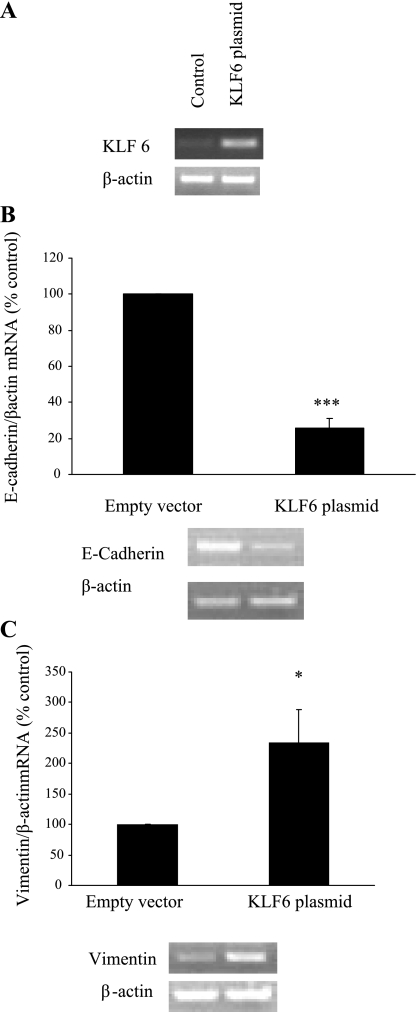
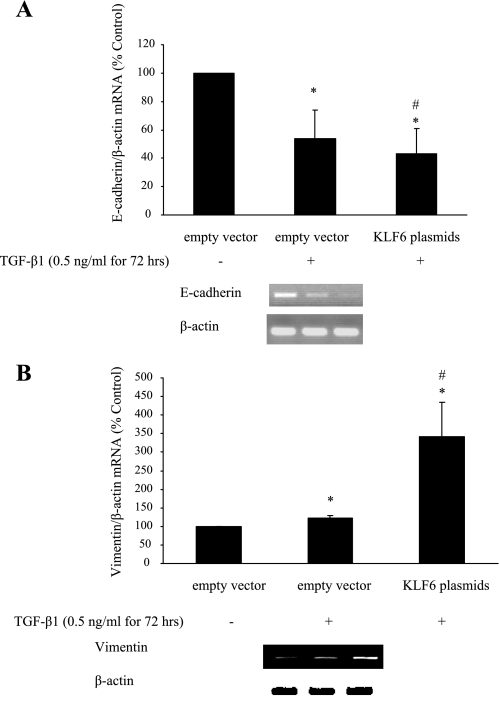
KLF6 plasmid transfection in HK-2 cells resulted in markedly increased KLF6 mRNA expression at 72 h; a representative RT-PCR gel is shown in Fig. 7A. E-cadherin mRNA expression was reduced to 25.85 ± 5.84% of control (P < 0.005) in cells transfected with KLF6 plasmid (Fig. 7B), whereas vimentin mRNA expression was increased to 254.41 ± 59.67% of control (P < 0.05) (Fig. 7C). E-cadherin mRNA expression was also reduced to 54.40 ± 20% of control (P < 0.05) after exposure to 0.5 ng/ml TGF-β1 for 72 h. In addition, a trend in which E-cadherin mRNA expression was further decreased in HK-2 cells containing KLF6 plasmid exposed to 0.5 ng/ml TGF-β1 for 72 h compared with TGF-β1-treated control (43.22 ± 18%) was observed, although this did not reach statistical significance (Fig. 8A). Vimentin mRNA expression increased significantly in cells transfected with KLF6 plasmid after exposure to 0.5 ng/ml TGF-β1 for 72 h compared with both nontreated and treated controls [342.05 ± 90% (P < 0.05) and 122.35 ± 7% (P < 0.05) respectively] (Fig. 8B).
Fig. 7.
Effectiveness of KLF6 plasmid gene overexpression. Four micrograms of KLF6 plasmid was transfected into HK-2 cells on 6-well plates with Lipofectamine 2000 (Invitrogen) according to manufacturer's instructions. In parallel, cells were transfected with 4 μg of empty vector, which served as the control (A). B and C: E-cadherin (B) and vimentin (C) expression in KLF6-overexpressing cells. Results are expressed as means ± SE. *P < 0.05, ***P < 0.005 vs. control. All experimental conditions were in duplicate, and cell culture preparation was repeated 3 times, giving 6 individual measurements in each experimental group.
Fig. 8.
E-cadherin (A) and vimentin (B) mRNA expression in KLF6-overexpressing cells following exposure to 0.5 ng TGF-β1 for 72 h. All experimental conditions were in duplicate, and cell culture preparation was repeated 3 times, giving 6 individual measurements in each experimental group. *P < 0.05 compared with empty vector alone. #P < 0.05 compared with empty vector plus TGF-β1.
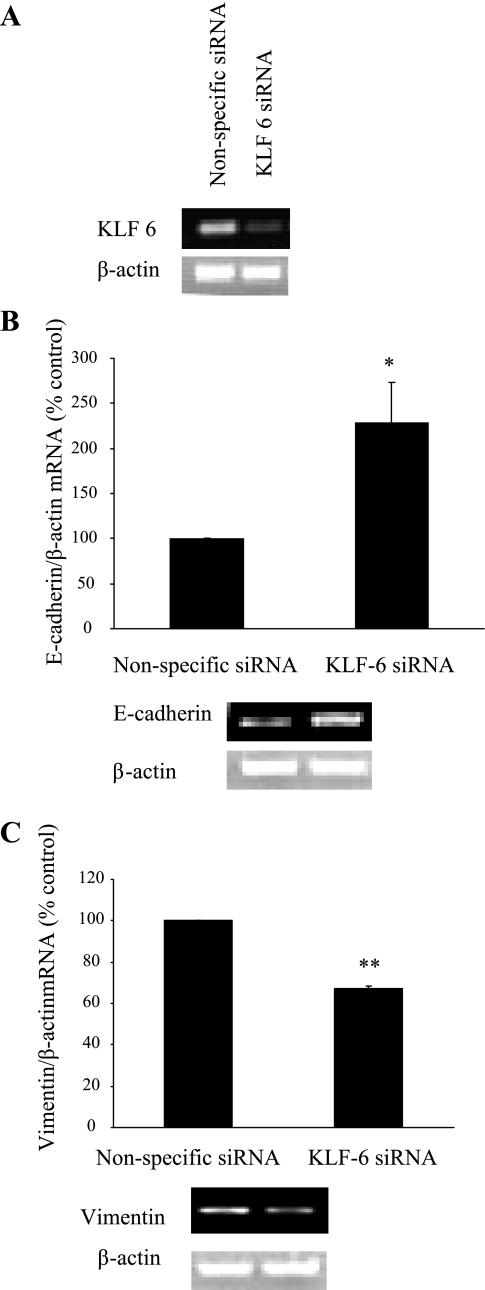
KLF6 siRNA transfection in HK-2 cells resulted in markedly reduced KLF6 mRNA expression at 72 h; a representative RT-PCR gel is shown in Fig. 9A. E-cadherin expression was increased to 225.5 ± 44.12% of control (P < 0.05) in cells transfected with KLF6 siRNA (Fig. 9B), whereas vimentin mRNA expression was reduced to 66.52 ± 01.25% of control (P < 0.005) (Fig. 9C). Together, these data would suggest that while KLF6 gene silencing appears to support the maintenance of an epithelial cell phenotype in basal conditions in vitro, increased KLF6 gene expression is associated with EMT in basal conditions in vitro.
Fig. 9.
Effectiveness of KLF6 siRNA-mediated gene silencing. Thirty nanomolar KLF6 siRNA (Ambion) was transfected into HK-2 cells on 6-well plates with Lipofectamine 2000 according to manufacturer's instructions. In parallel, cells were transfected with 30 nM nonspecific siRNA, which served as the control (A). B and C: E-cadherin (B) and vimentin (C) expression in KLF6-overexpressing cells. Results are expressed as means ± SE. *P < 0.05, **P < 0.05 vs. control. All experimental conditions were in duplicate, and cell culture preparation was repeated 3 times, giving 6 individual measurements in each experimental group.
DISCUSSION
The findings in this report confirm that expression of the transcription factor KLF6 is increased under diabetic conditions in vivo and in vitro and after exposure to TGF-β1. High glucose (25) and TGF-β1 (23, 26) are both known to increase intracellular reactive oxygen species (ROS) in the kidney and contribute to the development and progression of interstitial fibrosis through mechanisms such as EMT (10). Indeed, TGF-β1 has long been recognized as a pivotal driver of EMT both in vivo and in vitro (25, 36). In the diabetic Ren-2 rat, a model that develops progressive renal injury with tubulointerstitial fibrosis, we have demonstrated increased immunostaining of total KLF6 in the tubules, suggesting that upregulation of KLF6 is a precursor to EMT occurring in PTCs. In addition to the upregulation of KLF6 in these conditions, we have demonstrated that overexpression of KLF6 promotes the development of EMT in HK-2 cells exposed to TGF-β1, whereas the silencing of KLF6 appears to maintain an epithelial phenotype, through an increase in E-cadherin expression. Although this might suggest that the HK-2 cells used were not fully “epithelial” to begin with, we attempted to ensure minimal heterogeneity by using only early-passage (passages 1–2) cells for all our experiments. While it is acknowledged that different HK-2 cells in the same culture may show marked heterogeneity in epithelial versus mesenchymal characteristics, nevertheless the ability of KLF6 silencing to increase E-cadherin expression (and reduce vimentin expression) is noteworthy and affirms its role in EMT.
KLF6 is known to be a transactivator of the TGF-β1 promoter (15), and Starkel et al. (31) previously demonstrated a temporal link between oxidative stress, KLF6, and TGF-β1 in the induction of hepatic fibrosis. The similarities with renal fibrosis, in particular diabetic nephropathy, where the generation of ROS is a key pathogenic feature, are striking. We found significantly increased levels of KLF6 expression in the tubules of the diabetic Ren-2 rat at 4 wk. At the same time, the proximal tubule cells of these animals were demonstrating early phenotypic features of EMT, namely, a reduction in E-cadherin expression and an increase in expression of the intermediate filament vimentin.
Similarly in vitro, exposure to high glucose led to an increase in KLF6 expression in HK-2 cells, and we have demonstrated that this increase in KLF6 expression was mediated by TGF-β1. HK-2 cells overexpressing KLF6 demonstrated reduced expression of epithelial cell phenotypic characteristics, and this loss of epithelial cell phenotype was more dramatic when cells were treated with TGF-β1. In addition, this reduction in the expression of E-cadherin in HK-2 cells overexpressing KLF6 was associated with increased vimentin expression, which increased further after treatment with TGF-β1. In contrast, E-cadherin expression was increased in HK-2 cells in which KLF6 was silenced. Together, these data suggest that total KLF6 expression is increased in conditions known to cause EMT, and its overexpression promotes the development of EMT in HK-2 cells exposed to TGF-β1.
The fact that KLF6 should be increased in conditions known to cause EMT is not surprising; in its well-defined role as a tumor suppressor it acts by promoting cell cycle arrest in response to cellular stress (23). Within the cancer setting, the role of the KLF6-antagonistic splice variant KLF6-SV1 has been well defined in several epithelial cell cancer lines (5, 7, 21, 22). These splice variants are capable of acting as dominant-negative proteins that antagonize full-length KLF6, and thus the net ratio between KLF6 and the splice variants determines the net biological effect. While the ratio of KLF6 to KLF6-SV1 may be important in the context of EMT, we note that in recent studies only the net effects of total KLF6 have been reported (1, 2, 4, 30). Because a specific antibody against KLF6-SV1 is not commercially available, we attempted to identify it with RT-PCR using the published primer sequences for KLF6-SV1 (7); however, we were unable to identify any PCR product for KLF6-SV1. So while the net effect of total KLF6 appears to be associated with EMT in proximal tubule cells, the question of the precise role of the antagonistic splice variants of KLF6 (and their therapeutic potential) in EMT remains unanswered. A functional role for KLF6 in regulating renal cell differentiation and a propensity for fibrosis having been determined, future studies will be required to assess the consequences of splice variants in renal epithelial cells as opposed to cancer.
Although initially thought to be constitutively expressed in a diverse array of tissues, KLF6 has more recently been shown to be an inducible gene with characteristics resembling an immediate-early gene. In a model of early hepatic fibrosis, KLF6 expression and biosynthesis was noted to be increased in activated rat stellate cells in vivo compared with cells from normal rats (28). The transactivation of the collagen α-1(I) promoter, a key driver of fibrogenesis, by KLF6 was found to be context specific, with stronger transactivation occurring in activated stellate cells compared with HepG2 cells and not at all in Drosophila Schneider cells; in other words, transactivation was most active in the cell type that expresses matrix genes in vivo. Similarly, we found that KLF6 protein was markedly upregulated in the epithelial cells of the proximal tubule segments of the diabetic Ren-2 rat, whereas the glomeruli were essentially devoid of staining. Via the process of EMT, these proximal tubule cells become significant contributors to the process of interstitial fibrosis. In a model of vascular endothelial injury, increased KLF6 expression upregulated uPA activity, which in turn led to increased levels of bioactive TGF-β1 as a result of uPA's ability to proteolytically activate the latent molecule, thus providing another mechanism through which TGF-β1 activity is augmented by KLF6 (16). Finally, in the kidney Tarabishi et al. (32) identified KLF6 as one of seven genes whose expression is upregulated >10-fold within the first few hours of ischemia-reperfusion injury in mice. The expression of TGF-β1 mRNA and protein was found to follow a similar pattern to that of KLF6 both in vivo and in vitro. When KLF6 was downregulated with antisense oligonucleotides in vitro the induction of TGF-β1 in response to ATP depletion was essentially abrogated, suggesting that the upregulation of TGF-β1 was largely dependent on KLF6. The apoptotic response to ATP depletion was also blunted in cells incubated with antisense KLF6 primers compared with controls. In our studies, we also found that the expression of TGF-β1 mRNA followed a pattern similar to that of KLF6 in vitro up to 72 h. Thereafter, expression of KLF6 continued to rise up to the 11-day time point, whereas TGF-β1 levels returned to normal. This has interesting parallels with the observations made by Tarabishi et al. (32) in their ischemia-reperfusion injury model. In that study the investigators noted that KLF6 remained significantly induced at later time points after ischemic injury and postulated that KLF6 and its target factors like TGF-β1 may have functionally distinct roles at different time points within the same cellular model of injury. So whereas in the early phase KLF6 and its targets may contribute to cell injury, at a later time point these same factors may play a role in cellular repair/regeneration.
In summary, these studies have demonstrated for the first time that KLF6 expression is increased in conditions known to promote kidney injury and fibrosis, specifically EMT, in an animal model of progressive diabetic nephropathy. In addition, the overexpression of KLF6 promoted EMT in HK-2 cells. Given the important role that EMT plays in the development and progression of interstitial fibrosis, the identification of KLF6 as a key regulator of TGF-β1-induced EMT represents an important finding. Further studies may confirm it as a potentially useful target for therapeutic intervention in an attempt to limit EMT and with it the decline in renal function seen in patients with CKD.
GRANTS
These studies were supported by the National Health and Medical Research Council of Australia (NHMRC). W. Qi is supported by an NHMRC Peter Doherty Fellowship.
The costs of publication of this article were defrayed in part by the payment of page charges. The article must therefore be hereby marked “advertisement” in accordance with 18 U.S.C. Section 1734 solely to indicate this fact.
REFERENCES
- 1.Bentov I, Narla G, Schayek H, Akita K, Plymate SR, LeRoith D, Friedman SL, Werner H. Insulin-like growth factor-I regulates Kruppel-like factor-6 gene expression in a p53-dependent manner. Endocrinology 149: 1890–1897, 2008. [DOI] [PubMed] [Google Scholar]
- 2.Bureau C, Peron JM, Bouisson M, Danjoux M, Selves J, Bioulac-Sage P, Balabaud C, Torrisani J, Cordelier P, Buscail L, Vinel JP. Expression of the transcription factor Klf6 in cirrhosis, macronodules, and hepatocellular carcinoma. J Gastroenterol Hepatol 23: 78–86, 2008. [DOI] [PubMed] [Google Scholar]
- 3.Cheng S, Lovett DH. Gelatinase A (MMP-2) is necessary and sufficient for renal tubular cell epithelial-mesenchymal transformation. Am J Pathol 162: 1937–1949, 2003. [DOI] [PMC free article] [PubMed] [Google Scholar]
- 4.Cullingford TE, Butler MJ, Marshall AK, Tham el L, Sugden PH, Clerk A. Differential regulation of Krüppel-like factor family transcription factor expression in neonatal rat cardiac myocytes: effects of endothelin-1, oxidative stress and cytokines. Biochim Biophys Acta 1783: 1229–1236, 2008. [DOI] [PMC free article] [PubMed] [Google Scholar]
- 5.DiFeo A, Feld L, Rodriguez E, Wang C, Beer DG, Martignetti JA, Narla G. A functional role for KLF6-SV1 in lung adenocarcinoma prognosis and chemotherapy response. Cancer Res 68: 965–970, 2008. [DOI] [PMC free article] [PubMed] [Google Scholar]
- 6.DiFeo A, Narla G, Camacho-Vanegas O, Nishio H, Rose SL, Buller RE, Friedman SL, Walsh MJ, Martignetti JA. E-cadherin is a novel transcriptional target of the KLF6 tumor suppressor. Oncogene 25: 6026–6031, 2006. [DOI] [PubMed] [Google Scholar]
- 7.DiFeo A, Narla G, Hirshfeld J, Camacho-Vanegas O, Narla J, Rose SL, Kalir T, Yao S, Levine A, Birrer MJ, Bonome T, Friedman SL, Buller RE, Martignetti JA. Roles of KLF6 and KLF6-SV1 in ovarian cancer progression and intraperitoneal dissemination. Clin Cancer Res 12: 3730–3739, 2006. [DOI] [PubMed] [Google Scholar]
- 8.Docherty NG, O'Sullivan OE, Healy DA, Murphy M, O'Neill AJ, Fitzpatrick JM, Watson RW. TGF-β1-induced EMT can occur independently of its proapoptotic effects and is aided by EGF receptor activation. Am J Physiol Renal Physiol 290: F1202–F1212, 2006. [DOI] [PubMed] [Google Scholar]
- 9.Gilbert RE, Wilkinson-Berka JL, Johnson DW, Cox A, Soulis T, Wu LL, Kelly DJ, Jerums G, Pollock CA, Cooper ME. Renal expression of transforming growth factor-beta inducible gene-h3 (beta ig-h3) in normal and diabetic rats. Kidney Int 54: 1052–1062, 1998. [DOI] [PubMed] [Google Scholar]
- 10.Ha H, Lee HB. Reactive oxygen species and matrix remodeling in diabetic kidney. J Am Soc Nephrol 14: S246–S249, 2003. [DOI] [PubMed] [Google Scholar]
- 11.Ito G, Uchiyama M, Kondo M, Mori S, Usami N, Maeda O, Kawabe T, Hasegawa Y, Shimokata K, Sekido Y. Kruppel-like factor 6 is frequently down-regulated and induces apoptosis in non-small cell lung cancer cells. Cancer Res 64: 3838–3843, 2004. [DOI] [PubMed] [Google Scholar]
- 12.Iwano M, Plieth D, Danoff TM, Xue C, Okada H, Neilson EG. Evidence that fibroblasts derive from epithelium during tissue fibrosis. J Clin Invest 110: 341–350, 2002. [DOI] [PMC free article] [PubMed] [Google Scholar]
- 13.Jeng YM, Hsu HC. KLF6, a putative tumor suppressor gene, is mutated in astrocytic gliomas. Int J Cancer 105: 625–629, 2003. [DOI] [PubMed] [Google Scholar]
- 14.Kelly DJ, Skinner SL, Gilbert RE, Cox AJ, Cooper ME, Wilkinson-Berka JL. Effects of endothelin or angiotensin II receptor blockade on diabetes in the transgenic (mRen-2)27 rat. Kidney Int 57: 1882–1894, 2000. [DOI] [PubMed] [Google Scholar]
- 15.Kim Y, Ratziu V, Choi SG, Lalazar A, Theiss G, Dang Q, Kim SJ, Friedman SL. Transcriptional activation of transforming growth factor beta1 and its receptors by the Kruppel-like factor Zf9/core promoter-binding protein and Sp1. Potential mechanisms for autocrine fibrogenesis in response to injury. J Biol Chem 273: 33750–33758, 1998. [DOI] [PubMed] [Google Scholar]
- 16.Kojima S, Hayashi S, Shimokado K, Suzuki Y, Shimada J, Crippa MP, Friedman SL. Transcriptional activation of urokinase by the Kruppel- like factor Zf9/COPEB activates latent TGF-beta1 in vascular endothelial cells. Blood 95: 1309–1316, 2000. [PubMed] [Google Scholar]
- 17.Kremer-Tal S, Reeves HL, Narla G, Thung SN, Schwartz M, Difeo A, Katz A, Bruix J, Bioulac-Sage P, Martignetti JA, Friedman SL. Frequent inactivation of the tumor suppressor Kruppel-like factor 6 (KLF6) in hepatocellular carcinoma. Hepatology 40: 1047–1052, 2004. [DOI] [PubMed] [Google Scholar]
- 18.Lehr HA, Mankoff DA, Corwin D, Santeusanio G, Gown AM. Application of Photoshop-based image analysis to quantification of hormone receptor expression in breast cancer. J Histochem Cytochem 45: 1559–1565, 1997. [DOI] [PubMed] [Google Scholar]
- 19.Lehr HA, van der Loos CM, Teeling P, Gown AM. Complete chromogen separation and analysis in double immunohistochemical stains using Photoshop-based image analysis. J Histochem Cytochem 47: 119–126, 1999. [DOI] [PubMed] [Google Scholar]
- 20.Liu Y Epithelial to mesenchymal transition in renal fibrogenesis: pathologic significance, molecular mechanism, and therapeutic intervention. J Am Soc Nephrol 15: 1–12, 2004. [DOI] [PubMed] [Google Scholar]
- 21.Narla G, Difeo A, Fernandez Y, Dhanasekaran S, Huang F, Sangodkar J, Hod E, Leake D, Friedman SL, Hall SJ, Chinnaiyan AM, Gerald WL, Rubin MA, Martignetti JA. KLF6-SV1 overexpression accelerates human and mouse prostate cancer progression and metastasis. J Clin Invest 118: 2711–2721, 2008. [DOI] [PMC free article] [PubMed] [Google Scholar]
- 22.Narla G, DiFeo A, Yao S, Banno A, Hod E, Reeves HL, Qiao RF, Camacho-Vanegas O, Levine A, Kirschenbaum A, Chan AM, Friedman SL, Martignetti JA. Targeted inhibition of the KLF6 splice variant, KLF6 SV1, suppresses prostate cancer cell growth and spread. Cancer Res 65: 5761–5768, 2005. [DOI] [PubMed] [Google Scholar]
- 23.Narla G, Heath KE, Reeves HL, Li D, Giono LE, Kimmelman AC, Glucksman MJ, Narla J, Eng FJ, Chan AM, Ferrari AC, Martignetti JA, Friedman SL. KLF6, a candidate tumor suppressor gene mutated in prostate cancer. Science 294: 2563–2566, 2001. [DOI] [PubMed] [Google Scholar]
- 24.Nath KA The tubulointerstitium in progressive renal disease. Kidney Int 54: 992–994, 1998. [DOI] [PubMed] [Google Scholar]
- 25.Oldfield MD, Bach LA, Forbes JM, Nikolic-Paterson D, McRobert A, Thallas V, Atkins RC, Osicka T, Jerums G, Cooper ME. Advanced glycation end products cause epithelial-myofibroblast transdifferentiation via the receptor for advanced glycation end products (RAGE). J Clin Invest 108: 1853–1863, 2001. [DOI] [PMC free article] [PubMed] [Google Scholar]
- 26.Pfaffl MW A new mathematical model for relative quantification in real-time RT-PCR. Nucleic Acids Res 29: e45, 2001. [DOI] [PMC free article] [PubMed] [Google Scholar]
- 27.Qi W, Chen X, Gilbert RE, Zhang Y, Waltham M, Schache M, Kelly DJ, Pollock CA. High glucose-induced thioredoxin-interacting protein in renal proximal tubule cells is independent of transforming growth factor-beta1. Am J Pathol 171: 744–754, 2007. [DOI] [PMC free article] [PubMed] [Google Scholar]
- 28.Ratziu V, Lalazar A, Wong L, Dang Q, Collins C, Shaulian E, Jensen S, Friedman SL. Zf9, a Kruppel-like transcription factor up-regulated in vivo during early hepatic fibrosis. Proc Natl Acad Sci USA 95: 9500–9505, 1998. [DOI] [PMC free article] [PubMed] [Google Scholar]
- 29.Reeves HL, Narla G, Ogunbiyi O, Haq AI, Katz A, Benzeno S, Hod E, Harpaz N, Goldberg S, Tal-Kremer S, Eng FJ, Arthur MJ, Martignetti JA, Friedman SL. Kruppel-like factor 6 (KLF6) is a tumor-suppressor gene frequently inactivated in colorectal cancer. Gastroenterology 126: 1090–1103, 2004. [DOI] [PubMed] [Google Scholar]
- 30.Sirach E, Bureau C, Peron JM, Pradayrol L, Vinel JP, Buscail L, Cordelier P. KLF6 transcription factor protects hepatocellular carcinoma-derived cells from apoptosis. Cell Death Differ 14: 1202–1210, 2007. [DOI] [PubMed] [Google Scholar]
- 31.Starkel P, Sempoux C, Leclercq I, Herin M, Deby C, Desager JP, Horsmans Y. Oxidative stress, KLF6 and transforming growth factor-beta up-regulation differentiate non-alcoholic steatohepatitis progressing to fibrosis from uncomplicated steatosis in rats. J Hepatol 39: 538–546, 2003. [DOI] [PubMed] [Google Scholar]
- 32.Tarabishi R, Zahedi K, Mishra J, Ma Q, Kelly C, Tehrani K, Devarajan P. Induction of Zf9 in the kidney following early ischemia/reperfusion. Kidney Int 68: 1511–1519, 2005. [DOI] [PubMed] [Google Scholar]
- 33.Tian YC, Chen YC, Chang CT, Hung CC, Wu MS, Phillips A, Yang CW. Epidermal growth factor and transforming growth factor-beta1 enhance HK-2 cell migration through a synergistic increase of matrix metalloproteinase and sustained activation of ERK signaling pathway. Exp Cell Res 313: 2367–2377, 2007. [DOI] [PubMed] [Google Scholar]
- 34.Yang J, Liu Y. Dissection of key events in tubular epithelial to myofibroblast transition and its implications in renal interstitial fibrosis. Am J Pathol 159: 1465–1475, 2001. [DOI] [PMC free article] [PubMed] [Google Scholar]
- 35.Yang J, Shultz RW, Mars WM, Wegner RE, Li Y, Dai C, Nejak K, Liu Y. Disruption of tissue-type plasminogen activator gene in mice reduces renal interstitial fibrosis in obstructive nephropathy. J Clin Invest 110: 1525–1538, 2002. [DOI] [PMC free article] [PubMed] [Google Scholar]
- 36.Zavadil J, Bitzer M, Liang D, Yang YC, Massimi A, Kneitz S, Piek E, Bottinger EP. Genetic programs of epithelial cell plasticity directed by transforming growth factor-beta. Proc Natl Acad Sci USA 98: 6686–6691, 2001. [DOI] [PMC free article] [PubMed] [Google Scholar]


