

Abstract
Some minor histocompatibility antigens (mHags) are expressed exclusively on patient hematopoietic and malignant cells, and this unique set of antigens enables specific targeting of hematological malignancies after human histocompatability leucocyte antigen (HLA)–matched allogeneic stem cell transplantation (allo-SCT). We report the first hematopoietic mHag presented by HLA class II (HLA-DQA1*05/B1*02) molecules to CD4+ T cells. This antigen is encoded by a single-nucleotide polymorphism (SNP) in the B cell lineage-specific CD19 gene, which is an important target antigen for immunotherapy of most B cell malignancies. The CD19L-encoded antigen was identified using a novel and powerful genetic strategy in which zygosity-genotype correlation scanning was used as the key step for fine mapping the genetic locus defined by pairwise linkage analysis. This strategy was also applicable for genome-wide identification of a wide range of mHags. CD19L-specific CD4+ T cells provided antigen-specific help for maturation of dendritic cells and for expansion of CD8+ mHag-specific T cells. They also lysed CD19L-positive malignant cells, illustrating the potential therapeutic advantages of targeting this novel CD19L-derived HLA class II–restricted mHag. The currently available immunotherapy strategies enable the exploitation of these therapeutic effects within and beyond allo-SCT settings.
Leukemia, lymphoma, and myeloma together account for ∼500,000 deaths per year worldwide (1). HLA-matched allogeneic stem cell transplantation (allo-SCT) is a widely applied immunotherapeutic approach for several of these hematological malignancies. The therapeutic effect of allo-SCT is largely mediated by alloreactive donor T cells directed at polymorphic peptides presented by HLA molecules on the recipient's malignant cells (2). These polymorphic peptides, also known as minor histocompatibility antigens (mHags), are frequently derived from cellular proteins encoded by allelic genes on autosomal chromosomes. Although several mHags are expressed ubiquitously, some mHags are exclusively expressed on hematopoietic cells and their malignant counterparts (2–4). Hence, targeting donor T cells toward such hematopoietic mHags is considered an ideal strategy to establish specific antitumor effects after allo-SCT (2, 4). Because CD8+ T cells are traditionally considered as the effector cells of antitumor responses, over the past years the major focus was to identify hematopoietic mHags presented to CD8+ CTLs (5–12). Nonetheless, several reports, including ours, indicate that not only CD8+ CTLs but also CD4+ T cells may possess immunotherapeutic potential (13–15). Yet no hematopoietic mHag presented by HLA class II has been identified, partly because the available techniques are not well suited for identification of such antigens. More importantly, several of the apparently hematopoietic mHags recognized by CD4+ T cells are not derived from genuine hematopoietic antigens. For instance, the recently identified autosomal mHag presented to CD4+ T cells is derived from the broadly expressed phosphatidylinositol 4-kinase type II β gene (16).
We previously isolated an HLA-DQA1*05/B1*02–restricted mHag-specific CD4+ T cell (clone 21) from the PBMC of a multiple myeloma patient after HLA-identical allo-SCT. This clone recognized recipient-derived EBV-transformed B cells (EBV-transformed lymphoblastoid cell lines [EBV-LCLs]) but not the nonhematopoietic fibroblasts and stromal cells, suggesting that its target antigen was encoded by a hematopoietic gene (unpublished data). To identify the mHag recognized by clone 21, we developed a nonlaborious but powerful genetic strategy in which a zygosity-genotype correlation analysis was used for fine mapping of the genomic locus mHag identified by classical pair-wise two-point linkage analysis. The new gene-mapping method was also genomewide applicable for a broad range of mHags. Further investigation on the identified locus revealed that the antigen recognized by clone 21 was encoded by a single-nucleotide polymorphism (SNP) in the B cell lineage-specific CD19 gene, which is a highly important target antigen for immunotherapy of almost all B cell malignancies. The CD19L-specific CD4+ T cells not only mediated antigen-specific help for the induction and expansion of CD8+ mHag-specific T cells but also displayed antigen-specific and HLA-restricted lysis of CD19L-positive malignant cells, illustrating the potential therapeutic advantages of targeting this CD19L-derived HLA class II–restricted mHag.
RESULTS
Genetic mapping of the mHag recognized by HLA class II–restricted T cell clone 21
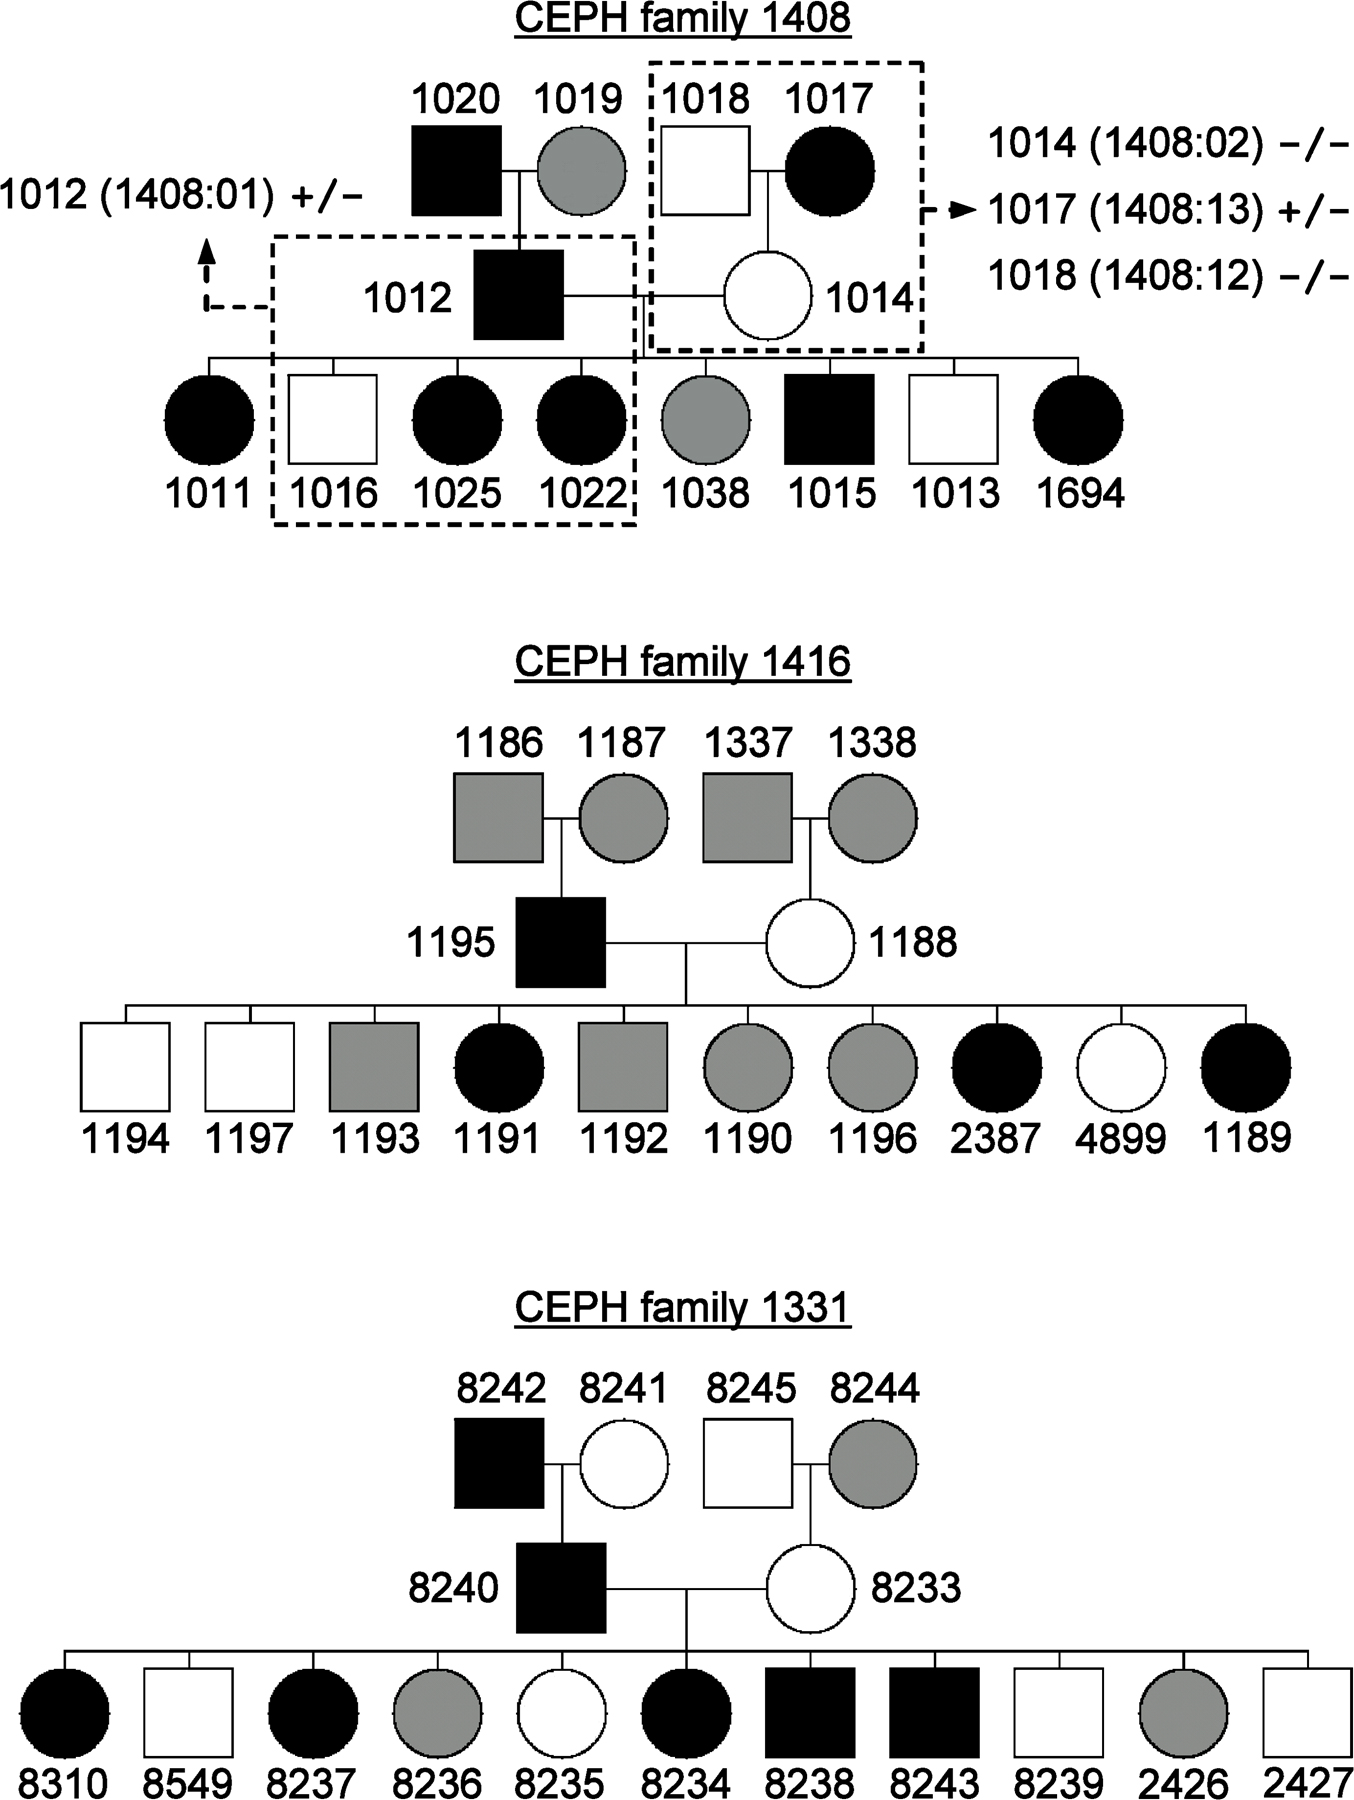
To identify the mHag recognized by clone 21, we started with a genetic approach, the pair-wise two-point linkage analysis. In this method, the genomic locus of the mHag is identified by association of thousands of predefined genetic markers to mHag phenotypes (mHag+ or mHag−) in large pedigrees registered in the Centre d'Etude du Polymorphisme Humain (CEPH) (17). The CEPH families are suitable for this approach because not only have their genomes been screened for genetic markers but also EBV-LCLs are available from each individual. Upon transduction with the appropriate HLA molecules, these cell lines are used as APCs for mHag-specific T cells to determine the mHag phenotype of the CEPH individuals. Thus, we first tested the reactivity of clone 21 against (HLA-DQA1*05/B1*02 transduced) EBV-LCLs of several CEPH families (Fig. 1 A and Fig. S1, available at http://www.jem.org/cgi/content/full/jem.20080713/DC1) and performed the pairwise two-point linkage analysis in which the mHag phenotype data were correlated with predefined genetic markers. Analysis of the data from three families (1331, 1362, and 1408; Fig. 1 A and Fig. S1) revealed a significant linkage between the mHag phenotypes and a large cluster of markers on chromosome 16, with multiple lod scores >3 (θ = 0.001; Fig. 1 B). According to the CEPH database, two children (1189 and 2387) in a fourth family (1416) displayed a crossing over or recombinant haplotype in this region. As depicted in Fig. 1 C, the mHag in this family was inherited together with the indicated paternal allele because the mHag− child 1197 inherited the other allele from the mHag+ father. Thus, because the two children with recombinant haplotypes were mHag+, the mHag gene should be located in the shared part of their paternal allele, between markers D16S3093 and D16S3034. This area was 16.8 cM on the Marshfield Map and contained 270 genes according to National Center for Biotechnology Information Map Viewer.
Figure 1.

Five-step identification of the SNP encoding for the mHag recognized by clone 21. (A) mHag phenotypes of CEPH families (indicated with Utah database ID numbers) were determined using methods described in the Materials and methods section. CEPH family 1362 is depicted as an example (male, square; female, circle; mHag+, black; mHag−, white; undetermined, gray). Phenotypes of families 1331, 1408, and 1416 are given in Fig. S1 (available at http://www.jem.org/cgi/content/full/jem.20080713/DC1). (B) Genome-wide pairwise two-point linkage analysis using the mHag phenotypes from families 1331, 1362, and 1408. Multiple significant lod scores >3 (at a recombination fraction of θ = 0.001) were identified on chromosome 16 in the depicted region. (C) Narrowing of the mHag locus using haplotype data from family 1416. As depicted, the mHag+ children 1189 and 2387 inherited the dark gray recombinant haplotype from the father, who is also mHag+. Thus the mHag locus was narrowed to the 16.8-cM region, which is defined by the shared part of the paternal allele of children 1189 and 2387. (D) Zygosity-genotype correlation analysis for fine mapping the mHag locus. The r2 values in the y axis represent the correlation between the mHag zygosity of 15 CEPH individuals (Table S1) with the genotypes for 4146 HapMap SNPs in this region. Each bar represents a single SNP. Two SNPs (rs7184597 and rs3924376) with 100% correlation (r2 = 1) are indicated. (E) The location of rs7184597 and rs3924376 (both light gray) in the intronic regions of the RABEP2 gene, which is neighbored by the CD19 gene. Also indicated are the nine nonsynonymous or transcription/translating-altering SNPs in these two genes. The mHag phenotypes and zygosities (Pheno./Zyg.) and the SNP genotypes for five informative CEPH individuals, the SC donor, and the SC recipient are depicted (−, deletion of the base pair). Only rs2904880 matched exactly with the phenotypes.
Development of a novel strategy for fine mapping of the mHag locus
The identified mHag locus in chromosome 16 contained too many genes to be analyzed with previously reported strategies (8, 9, 17). Therefore, we sought an alternative strategy. Over the last decade, millions of SNPs have been genotyped in CEPH individuals by the International HapMap Project (http://www.hapmap.org/) to facilitate the identification of polymorphic genes associated with human diseases (18). We hypothesized that direct correlation of mHag phenotypes with the HapMap SNP genotypes might be useful to fine map the genetic locus of our mHag. From the previous linkage analyses, we already knew the mHag phenotype of 23 CEPH individuals included in the HapMap databases. For 15 of these individuals, we also could deduce the mHag zygosity (+/+, +/−, or −/−) from the inheritance pattern of the mHag in the pedigrees (Fig. S1 and Table S1). Thus, using a specific software that can correlate the zygosity information with the SNP genotypes, we correlated the mHag zygosity information of 15 CEPH individuals with the 4146 HapMap SNPs present in the defined region. Despite the seemingly too low numbers of CEPH individuals entered in the analysis, we found a 100% correlation between the mHag zygosities and the genotypes of two intronic SNPs (rs7184597 and rs3924376; Fig. 1 D). According to HapMap, these two SNPs were located within the same linkage disequilibrium (LD) block, posing the possibility that the SNP encoding for our mHag could also be located in this block.
Identification of the CD19L-derived mHag
Within the LD block defined by rs7184597 and rs3924376, RABEP2 and CD19 were the only genes with hematopoietic-restricted expression. Therefore, we explored whether RABEP2 and CD19 genes contained nonsynonymous or transcription/translation-altering SNPs that were linked with the SNPs rs7184597 and rs3924376. Genotyping of five representative CEPH family members for nine additional SNPs in RABEP2 and CD19 (Fig. 1 E) revealed a single SNP, rs2904880, that was fully matching with the LD block defined by rs7184597 and rs3924376. The substitution of guanine for cytosine involved in this SNP causes a change of the valine (V) at position 174 into a leucine (L) within the third exon of CD19 (Fig. 2 A). The fact that the SC recipient was positive for both CD19L- and CD19V-encoding alleles, whereas the SC-donor lacked the CD19L-encoding allele (Fig. 1 E), substantiated the idea that the mHag could be derived from the CD19L allele. Confirming this possibility, clone 21 showed strong reactivity against donor EBV-LCLs transduced with a CD19L-encoding vector but not with an empty vector (Fig. 2 B). Furthermore, clone 21 showed a dose-dependent reactivity against a 15-meric CD19L peptide PEIWEGEPPCLPPRD, but not against the allelic counterpart peptide, demonstrating the crucial importance of leucine at position 174 for the immunogenicity of the CD19L-derived mHag (Fig. 2 C). Finally, testing the reactivity of clone 21 against the overlapping 15-mer peptides derived from the polymorphic region revealed that only those peptides containing the core sequence WEGEPPCLP were recognized (Fig. 2 D). Analysis of eight other CD4+ mHag-specific T cell clones isolated from the same patient revealed the CD19L specificity of three additional T cell clones (unpublished data). All CD19L-specific T cell clones used the same TCR Vβ16-CDR3 sequence (unpublished data). We could trace this CD19L-specific TCR in the patient ∼3 mo after SCT, concomitant with the occurrence of an acute graft versus host disease (GvHD) grade III and a strong anti-tumor response, resulting in significant reduction of serum M protein levels (Fig. 2 E). The TCR signal disappeared rapidly after starting immunosuppressive treatment but reappeared soon after tapering immunosuppression, indicating the long-term persistence of CD19L-specific T cells. Discontinuation of immunosuppression led to the development of an extensive and steroid-resistant chronic GvHD, despite the disappearance of CD19L-specific TCR signal from periphery (Fig. 2 E).
Figure 2.

CD19L encodes for the mHag recognized by clone 21. (A) The CD19 gene with rs2904880 in the third exon encoding a valine (V) to leucine (L) substitution at position 174. (B) IFN-γ response of clone 21 to mHag− donor (Do) EBV-LCLs transduced either with an empty vector (mock) or with the CD19L-encoding vector. Response to mHag+ recipient (Rt) EBV-LCLs (LCLs) is depicted as positive control. The mean and SEM of three experiments are depicted. (C and D) IFN-γ response of clone 21 toward serial concentrations of 15-mer peptides derived either from CD19L (▪) or from CD19V (○; C) or toward CD19L-derived overlapping 15-mer peptides (D). Donor EBV-LCLs were used as APCs. The core sequence recognized by clone 21 is highlighted in gray. Error bars represent the SEM of triplicate cultures. (E) In vivo presence of CD19L-specific clone 21. Genomic DNA isolated from patient PBMCs at the indicated days after allo-SCT was used to amplify the TCR of clone 21. Vβ16-specific PCR was used as positive control. Genomic DNA from clone 21 (cl.21) and third-party PBMCs (irrel.) were used as positive and negative controls, respectively. Also indicated are the severity of acute and chronic GvHD, the serum M protein levels, and the immunosuppressive prednisone treatment during the monitoring period.
Genome-wide application of the novel mHag fine-mapping strategy
Our novel strategy was highly effective to fine map the genetic locus of the CD19L-mHag defined on chromosome 16. Because it would be more convenient if our strategy could be directly executed on a genome-wide basis, we correlated the mHag zygosity of 15 CEPH individuals with the complete set of HapMap SNPs from all chromosomes (public release 21a). This first attempt revealed, in addition to the correct locus, several other 100% false-positive correlations throughout the genome (unpublished data), suggesting that mHag zygosity data from more individuals was required. Therefore, we extracted the mHag zygosity of eight additional CEPH individuals from a recent HapMap release (public release 22), which included the genotypes for the CD19L-encoding SNP. Indeed, by analyzing the data from 23 CEPH individuals we identified the precise mHag locus (Fig. 3) without any other false positive 100% correlations, demonstrating the feasibility of genome-wide application of our strategy.
Figure 3.

Genome-wide mapping of the CD19L-mHag locus by zygosity-genotype correlation analysis. The r2 values on the y axis represent the correlation between the mHag zygosities of 23 CEPH individuals with the genotypes for all HapMap SNPs (public release 21a). 15 of these CEPH individuals are depicted in Table S1. For eight other individuals that were also phenotyped by clone 21 recognition, the zygosity information was derived from the rs2904880 genotype information in the latest HapMap release (public release 22; unpublished data). Each bar represents a single SNP; only r2 values >0.5 are shown. Chromosome 16 was analyzed in more detail (bottom). All r2 values are depicted.
The overall power of the novel mHag fine-mapping strategy
To determine whether our method is able to locate the genomic locus of other mHags, we first selected six known clinically relevant mHags (Table S2, available at http://www.jem.org/cgi/content/full/jem.20080713/DC1). After deriving the zygosity of 14 CEPH trios (father-mother-child) for these mHags from the HapMap database, we executed a series of correlation analyses by including data from an increasing number of trios. The results for the representative example mHag HMSD are depicted in Fig. 4. Although the analysis of the data from seven trios revealed several loci with 100% correlations, false-positive correlations were effectively reduced by entering data from more trios. Finally, the correct mHag locus was revealed after analyzing the data from 11 trios. Similarly, the genomic locus of the other five mHags could be identified after analysis of, at most, 14 trios (Table I). These successfully mapped mHags displayed frequencies between 35 and 70%. As there are not many known mHags beyond these ranges, in further evaluation, we analyzed 149 nonsynonymous nonlinked HapMap SNPs with frequencies between 5 and 95% (Table S3) as if they are encoding for immunogenic mHags. As depicted in Fig. 5 A, we successfully mapped 121/124 mHags with frequencies of 10–85%, 4/10 mHags with frequencies of 90%, and 1/15 mHags with frequencies of 5 or 95% using 11–30 trios. These analyses illustrated that our approach was highly powerful for mapping of mHags with frequencies between 10 and 85%. The power beyond these limits decreased significantly.
Figure 4.

Retrospective genome-wide mapping of the HMSD-mHag locus by zygosity-genotype correlation analysis. The correlation analysis of the HMSD mHag, using zygosity data from 7–14 CEPH trios, is depicted as a representative example. On the y axis, r2 values >0.5 are depicted representing the correlation between the HapMap-derived mHag zygosities of the CEPH individuals (Table S2, available at http://www.jem.org/cgi/content/full/jem.20080713/DC1) and the indicated number of trios with their genotypes for all HapMap SNPs (public release 23). The single r2 = 1 peak after analysis with 11 trios consisted of seven SNPs within the same LD block.
Table I.
Retrospective genome-wide mapping of known mHag loci by zygosity-genotype correlation analysis
| mHag | SNP | Frequency (literature) |
Frequency (in 14 trios) |
Number of trios | Useful number of individuals |
Locus: number of r2 = 1 SNPs |
Source |
|---|---|---|---|---|---|---|---|
| % | % | ||||||
| HMSD | rs9945924 | 35.6 | 31 | 11 | 30 | 7 | reference 12 |
| ACC-1Y | rs1138357 | 46.5* | 47.6 | 10 | 23 | 8 | reference 8 |
| ACC-2 | rs3826007 | 44.5* | 47.6 | 10 | 23 | 8 | reference 8 |
| ADIR | rs2296377 | 37 | 42.9 | 13 | 27 | 8 | reference 20 |
| HA-8 | rs2173904 | 70.2* | 64.3 | 10 | 16 | 11 | reference 21 |
| HB-1Y | rs161557 | 46.3* | 14.3 | 14 | 41 | 1 | reference 22 |
Results of the correlation analyses for six mHags. Published phenotype frequencies are derived from Spierings et al. (19; *) or from the indicated reference. Analyses were performed as described in Fig. 4. Depicted is the minimal number of trios (Number of trios) resulting in only a single genome locus with 100% correlation, together with the number of CEPH individuals for whom zygosity data was available (Useful number of individuals). Also depicted is the number of SNPs with 100% correlation that was found at this genome locus (Locus: number of r2 = 1 SNPs).
Figure 5.

Retrospective genome-wide mapping of nonsynonymous SNPs with various allele frequencies by zygosity-genotype correlation analysis. Summary of correlation analyses for 149 HapMap SNPs (Table S3, available at http://www.jem.org/cgi/content/full/jem.20080713/DC1). From each SNP one of the alleles was designated to encode for a fictive mHag. For each 5% mHag frequency interval between 5 and 95%, and 10, 5, or 4 mHags were analyzed. The analyses were executed for a dataset without phenotyping errors (A) or with 7–10% false-positive phenotypes (B). The false-positive phenotypes were introduced in the corresponding datasets by randomly changing −/− typings into +/−, avoiding Mendelian segregation errors. The criterion for positive identification is r2 = 1 at the genomic locus of the analyzed mHag without any r2 = 1 false-positive hits at other genomic loci (A), or the criterion is r2 is above the theoretical r2 (Fig. S2, available at http://www.jem.org/cgi/content/full/jem.20080713/DC1) at the mHag genomic locus without any false-positive r2 above this value at irrelevant genomic loci (B). The tables show the number of mHags analyzed for each frequency indicated below in the figures, as well as the number of successfully identified mHags. The figures show the number of used trios for only the successfully mapped mHags.
A potential technical problem of genetic analyses is phenotyping errors. Therefore, we also questioned whether our approach still has any power if the datasets would contain ∼10% false-positive phenotypes. Calculations revealed that such errors cause a certain frequency-dependent reduction in the r2 values (Fig. S2, available at http://www.jem.org/cgi/content/full/jem.20080713/DC1). Nonetheless, we evaluated whether these calculated r2 values could be used as threshold to discriminate true and false correlations by reexecuting the analyses with 149 SNPs after introducing 7–10% false-positive phenotypes in the datasets. These analyses resulted in the successful mapping of 96/124 (77%) mHags with frequencies of 10–85% and only 2/10 SNPs with frequencies of 90% (Fig. 5 B), indicating that, despite significant power loss at extreme allele frequencies, our approach may still be useful for the genomic mapping of mHags with frequencies between 10 and 85%, even if the datasets contain 10% false-positive phenotypes.
The immunotherapeutic potential of CD19L-specific T cells
Finally, we explored the possible immunotherapeutic advantages of targeting the CD19L-encoded HLA class II–restricted antigen by testing the helper and effector functions of clone 21. In a coculture system, antigen-specific activation of clone 21 with the synthetic peptide or with mHag+ APCs facilitated antigen-dependent proliferation of a CD8+ T cell clone specific for the mHag LRH-1 (9) (Fig. 6 A). In another assay, clone 21 induced CD19L peptide-dependent maturation of HLA-DQ–matched DCs and polarized them to produce significant levels of IL-12 (Fig. 6 B), which is considered essential for licensing DCs to induce CTL responses (23). Clone 21 also maturated the DCs that were loaded with apoptotic CD19L-positive EBV-LCLs (Fig. 6 C). In evaluation of its effector functions, clone 21 appeared to secrete high levels of granzyme-B and displayed antigen-specific cytotoxic activity against recipient-derived but not against donor-derived EBV-LCLs (Fig. 7, A and B). Furthermore, when tested against malignant cells derived from various B cell chronic lymphoid leukemia (B-CLL) patients, clone 21 produced significant levels of IFN-γ (Fig. 7 C) and displayed significant antigen-specific cytotoxic activity only toward HLA-matched and CD19L-positive malignant cells (Fig. 7 D). Collectively, these results indicated that upon adoptive transfer, CD19L-mHag–specific CD4+ T cells may not only provide effective help to other effector cells but may also directly contribute to an antitumor effect by lysing CD19L-positive tumor cells.
Figure 6.

The helper activity of CD19L-specific clone 21. (A) The LRH-1–specific HLA-B7–restricted CD8+ clone cocultured with CD19L-negative or -positive HLA-B7/DQA1*05/B1*02 EBV-LCLs (LCLs) in the presence of its own epitope. Different dilutions of irradiated clone 21 were added in the cultures and in some conditions were supplemented with the 15-mer CD19L peptide. The proliferation of the LRH-1–specific CD8+ clone after 48 h is depicted. Error bars represent the SEM of triplicate cultures. The proliferation in the presence of CD19L-positive EBV-LCLs was significantly higher than CD19L- negative EBV-LCLs (*, P < 0.05). (B and C) Immature DCs generated from HLA-DQ2–matched monocytes loaded with 15-mer CD19L peptide PEIWEGEPPCLPPRD or irrelevant peptide LPPRDSLNQSLSQDL (irr.pept.; B) or with apoptotic CD19L-negative EBV-LCLs (apCD19Lneg-LCL) transduced with CD19L (apCD19Lpos-LCL; C) were cultured with clone 21 (cl.21). Apoptosis was induced by incubation of EBV-LCLs with FasL. The CD4+ mHag-specific T cell clone 3AB11 (irr.cl.) or CD40L-expressing fibroblasts were used as negative and positive controls, respectively. DC maturation was assessed as described in Materials and methods.
Figure 7.

The effector function of CD19L-mHag–specific clone 21. (A) Granzyme B production of clone 21 in response to recipient (Rt) or donor (Do) EBV-LCLs (LCLs). (B) The lysis of recipient EBV-LCLs or donor EBV-LCLs by clone 21 in the absence or presence of 15-mer CD19L-peptide at an effector/target ratio of 50:1. The error bars represent the SEM of duplicate cultures. (C) IFN-γ response of clone 21 toward CD19+ malignant cells from 18 B-CLL patients. The mHag genotypes of the patients were determined by partial sequencing of the chromosomal DNA extracted from PBMCs. The mean and SEM are shown for the indicated number of patient samples. The difference between the HLA-matched CD19L-positive patients and the others was statistically significant (*, P < 0.05). (D) The lysis of HLA-DQB1*02 and CD19L-positive (n = 3) and CD19L-negative (n = 2) B-CLL samples by clone 21 at different effector/target ratios. Error bars indicate the SEM of the different B-CLL samples.
DISCUSSION
In this paper, we describe the first genuine hematopoietic mHag presented by HLA class II (HLA-DQA1*05/B1*02) molecules to CD4+ T cells. This antigen is encoded by a SNP in the B cell lineage-specific CD19 gene. To identify the CD19L-encoded mHag, we developed a powerful genetic strategy, which is nonlaborious and genome-wide applicable to identify a wide range of HLA class I– as well as HLA class II–restricted mHags.
What may be the clinical importance of this novel HLA class II–restricted mHag? Like CD20, CD19 is a B cell lineage-specific molecule, with constitutive expression in acute and chronic B cell lymphoid leukemias, B cell lymphomas, and in a subset of acute myeloid leukemias. The expression of CD19 is rarely down-regulated in B cell malignancies. Furthermore, CD19 is not expressed in pluripotent stem cells (24). For these reasons, CD19 is widely considered to be an ideal target for immunotherapy of several B cell malignancies. Immunotherapy strategies based on CD19 antibodies (immunotoxins and chimeric TCRs) have been developed and have used both CD4+ and CD8+ T cells as effector cells (25, 26). Numerous investigators have searched for HLA class I CTL epitopes on the CD19 molecule (27). Although these approaches may be very beneficial, we think that in an immunotherapy setting, targeting of CD19 with CD4+ T cells also may provide several additional benefits; in our assays, the CD19L-specific CD4+ T cells not only mediated potent helper functions to activate DCs and stimulate CD8+ CTLs but also directly functioned as effector cells to lyse HLA-matched CD19L-positive malignant cells. Thus, immunotherapy with CD19L-specific CD4+ CTLs alone or in combination with CD8+ T cells may permit the exploitation of both helper and effector functions whereby more effective and durable antitumor responses may be established. Because CD19 is a B cell–specific molecule, CD19L-specific therapy may be feasible not only within but also beyond the allo-SCT settings. The CD19L allele is expressed in 53% of the Caucasian population, and its antigen-presenting molecule HLA-DQA1*05/B1*02 has a frequency of 15.3% in the Caucasian population. Thus, after an HLA-matched SCT, ∼2.3% of the donor-recipient pairs will be CD19L mismatched and eligible for a treatment with CD19L-specific CD4+ T cells or vaccination with peptide-loaded or gene-transfected DCs. This percentage can increase up to 8.1% (15.3 × 53%) in an HLA-matched unrelated donor SCT setting or when patients are not transplanted. In all settings, adoptive immunotherapy with ex vivo–generated CD19L-specific T cells may be feasible, in particular after generation of CD19L-specific T cells using the so-called TCR transfer approach (15).
What may be the impact of our mHag identification strategy? Our novel genetic approach involves a correlation analysis between mHag zygosities and HapMap SNP genotypes to locate the genetic locus of the mHag. Our results demonstrate that this approach is genome-wide applicable and able to precisely map the genetic locus of a wide range of mHags with phenotype frequencies of 10–85%. The basic idea behind our strategy is similar to a recently introduced method, which utilizes genome association scans after performing SNP array analysis on DNA samples pooled from mHag+ and mHag− individuals (28). A major advantage of our strategy is that it covers more SNPs. Although the other method can only analyze 65% of the HapMap SNPs after performing 500,000 SNP arrays, we analyze millions of HapMap SNPs covering the whole genome without even performing an SNP array. Furthermore, our strategy is less laborious. In our analyses, the genome-wide identification of the precise LD block of six known mHags required the mHag phenotyping of 27–42 CEPH individuals, whereas the other approach had to phenotype at least 100 individuals to identify the locus of these mHags (28). Thus, our method can dramatically reduce the work load and the time required to identify mHags, which are the two most important drawbacks of all current mHag identification strategies. The only apparent limitation of our strategy may be its difficulty in identifying mHags with allele frequencies beyond 10–85%. Nonetheless, it should be emphasized that mHags with very low or high phenotype frequencies are of limited immunotherapeutic value. As illustrated in Fig. S3 (available at http://www.jem.org/cgi/content/full/jem.20080713/DC1), the chance of an mHag mismatch between the recipient and donor is <10%, if the mHag phenotype frequency is beyond 26–78% in the HLA-matched sibling setting or beyond 11–89% in the HLA-matched unrelated donor setting. Because the number of eligible patients will also be limited by HLA restriction, mHag frequencies beyond these limits are of little practical value for clinical application. Thus, our strategy, with sufficient power to identify mHags with frequencies of 10–85%, is actually very suitable for the identification of a vast majority of mHags that are of high value for immunotherapy.
A frequent problem in genetic linkage analyses is phenotyping errors. In our approach, we devoted an extreme attention to avoid such errors because our analyses are executed with a very limited set of CEPH individuals. As phenotype errors will result in the reduction of correlation coefficient, our standard criterion of r2 = 1 to discriminate true-positive hits from false-positive ones cannot be applied for datasets containing phenotype errors. Yet our analyses with datasets containing 10% false-positive phenotypes revealed that the reduction in correlation coefficient can be calculated (Fig. S2) and that these calculated values could be used as threshold values to eliminate false hits without dramatically reducing the power of the analyses. Thus, our approach, with theoretically adjusted threshold values, may still be useful for identification of clinically relevant mHags even when phenotyping errors cannot be excluded. Nonetheless, as the power decreases significantly we still think that the best strategy for success is to use all means to avoid phenotype errors.
Finally, we think that our strategy is universally applicable because there are five ethnic panels with trios genotyped in the Phase III HapMap. Using one of these panels may be sufficient for analysis of a wide range of mHag-specific T cell clones, even if they are obtained from a different population. In fact, using the Caucasoid CEPH panel, we have been able to map the genomic locus of HMSD, ACC-1Y, and ACC-2, mHags which were originally described in the Japanese population. Nonetheless, not all HapMap panels consist of trios, which are required for deducing the zygosity information. Because this may still be a potential limitation for identification of mHags in some ethnic populations, we are currently evaluating the possibility of using unrelated HapMap individuals in our strategy. In conclusion, the first HLA class II–restricted hematopoietic mHag as well as the powerful mHag identification strategy described here can significantly facilitate the application of mHag-based immunotherapy in a broader clinical setting.
MATERIALS AND METHODS
Cells.
The HLA-DQA1*05/B1*02-restricted CD4+ T cell clone 21 and the HLA-DP4–restricted CD4+ control clone 3AB11 were previously isolated from a multiple myeloma patient during the development of acute GvHD grade III and a strong GvT response after allo-SCT from his HLA-identical brother (29). In brief, after SCT, PBMCs of the recipient were stimulated with irradiated pre-SCT PBMCs for 3 wk and thereafter expanded with EBV-LCLs derived from pre-SCT PBMCs. T cell clones were obtained by limiting dilution. The HLA-B7–restricted CD8+ T cell clone specific for the mHag LRH-1 was described elsewhere (9). T cell clones were expanded using a feeder cell–cytokine mixture as previously described (15). EBV-LCLs were cultured in RPMI-1640, 10% FBS (Integro), and antibiotics. The Phoenix packaging line (φ-NX-A) and the CD40L-expressing fibroblasts were cultured in DMEM (Invitrogen), 10% FBS, and antibiotics. PBMCs containing 84–99% CD5+ malignant B cells (partly provided by R. van Gent, University Medical Center Utrecht, Utrecht, Netherlands) were obtained from 18 B-CLL patients after written informed consent. Experiments with these human materials were approved by local medical ethical committee of the University Medical Center Utrecht.
Immunophenotyping.
Cells labeled with fluorochrome-conjugated antibodies (all obtained from BD, except the anti–ΔNGF-R [culture supernatant of clone 20.4]) were analyzed with a FACSCalibur flow cytometer (BD). FACS data were analyzed with CellQuest software (BD).
CD19-derived peptides.
Commercially synthesized and purified (Pepscan) 15-mer peptides were dissolved in DMSO to 100 mM and diluted in PBS to 6 mM to use in functional assays.
Retroviral vectors.
The LZRS-based retroviral vectors containing HLA-DQA1*0501-IRES-GFP or HLA-DQB1*0201-IRES-ΔNGF-R were provided by F. Koning (Leiden University Medical Center, Leiden, Netherlands). The pMX-CD19174L-IRES-GFP vector was generated by cloning the CD19L gene derived from an expression vector (OriGene Technologies). Generation of retroviral supernatants and retroviral transduction of EBV-LCLs were described elsewhere (15).
mHag phenotyping of CEPH families.
To determine the mHag phenotype (mHag+ or mHag−) of the CEPH individuals, their HLA-DQA1*05/B1*02–positive (naturally positive or positive after retroviral transduction) EBV-LCLs were used as APCs for the mHag-specific clone 21 at a 1:1 ratio, in a final volume of 200 μl in U-bottomed 96-well plates. After 18 h of incubation, supernatants were collected and tested for the presence of IFN-γ using standard ELISA kits. EBV-LCLs were judged mHag+ if the mean OD value at 450 nm of triplicate cultures was >0.250, about four times the background OD value. For <10% of the CEPH individuals, the OD value was between 0.1 and 0.25. In these cases, assays were repeated at least four times to exactly determine the mHag phenotype of the CEPH individual. Individuals remaining doubtful after five attempts were excluded from the analyses.
ELISA.
Cytokine content of cell-free supernatants was determined using commercial ELISA kits according to the manufacturer's instructions (IFN-γ, Invitrogen; granzyme-B, Sanquin [provided by P de Koning, University Medical Center Utrecht, Utrecht, Netherlands]; IL-12-p70, eBioscience). The SEM of triplicate measurements never exceeded 10%.
Two-point pairwise linkage analysis.
The mHag phenotypes of the CEPH individuals and 533 markers genotyped on CEPH families 1331, 1362, and 1408 were used as input to perform a genome-wide two-point linkage analysis using the subroutine MLINK of the FASTLINK program as previously described (8, 9, 17, 30, 31).
Recombinant haplotype analysis.
Genotype data for chromosome 16 were extracted from the CEPH database (version 10; http://www.cephb.fr/cephdb/) to determine recombinant haplotypes in the CEPH families (32, 33). Candidate genes and SNPs were derived from Map Viewer (http://www.ncbi.nih.gov/mapview/) and Ensembl (release 45; http://www.ensembl.org/), respectively.
Correlation of mHag zygosities with HapMap SNP genotypes.
The software ssSNPer (provided by D. Nyholt, Queensland Institute of Medical Research, Brisbane, Australia), a program for identifying genetically indistinguishable SNPs (34), was used to analyze the correlation between the mHag zygosities and individual HapMap SNPs. For genome-wide analyses, ssSNPer was slightly modified. We have shared this modified ssSNPer at http://www.umcutrecht.nl/subsite/dcch/Research/Hemato-Oncology/Identification-of-novel-GvT-associated-minor-H-antigens.htm. mHag zygosities (+/+, +/−, and −/−) of CEPH individuals were deduced from the Mendelian segregation pattern of the mHag phenotypes in their pedigrees. The HapMap SNP genotypes were downloaded from the HapMap website (http://www.hapmap.org/). The input file for ssSNPer was assembled by inserting the deduced mHag zygosities of CEPH individuals as a fictive SNP in the downloaded HapMap file.
SNP and TCR sequencing.
60 ng of genomic DNA isolated from PBMCs or EBV-LCLs was amplified at 94°C for 5 min for 35 cycles (94°C for 30 s, 55°C for 30 s, and 72°C for 30 s) and 72°C for 10 min using primers (Table S4, available at http://www.jem.org/cgi/content/full/jem.20080713/DC1) and directly sequenced using BigDye Terminator kit (v3.1; Applied Biosystems) in an automated ABI PRISM 3100 sequencer (Applied Biosystems).
Monitoring of the CD19L-specific TCR.
The TCR-β chain of clone 21 was amplified from genomic DNA isolated from PBMCs collected periodically after allo-SCT using a TCR-specific primer set (Table S4). The specificity of the PCR was controlled using genomic DNA of clone 21 (positive control) and of several irrelevant PBMCs (negative control).
T cell help for expansion of CD8+ mHag-specific T cells.
LRH-1–specific CD8+ T cell clone (9) was stimulated with HLA-matched CD19L-mHag–negative or –positive EBV-LCLs at a ratio of 1:2.5 in the presence of 5 μM LRH-1 peptide. 30 Gray–irradiated clone 21 was added with or without 0.6 μM of the 15-mer CD19L-peptide. 3H-Thymidine incorporation was determined after 48 h.
DC maturation assay.
Immature DCs, generated from HLA-matched monocytes culturing with GM-CSF and IL-4, were maturated by coculture with T cell clones at a DC/T cell ratio of 1:2.5 in the presence of 6 μM of either the CD19L peptide PEIWEGEPPCLPPRD or irrelevant peptide LPPRDSLNQSLSQDL. In some assays, apoptotic CD19L-positive EBV-LCLs (apoptosis was induced by incubation with 500 ng/ml FasL for 24 h) were added as the source of CD19L antigen (DC/EBV-LCL ratio, 1:20). As positive control, DCs were cocultured with CD40L-expressing fibroblasts in a DC/fibroblast ratio of 1:1. After 72 h, DC maturation was assessed by determining the percentage of CD80+ and CD83+ cells, the mean fluorescence intensity of CD86, HLA-DR, and/or CD40 on the cells, and the content of IL-12 in the culture supernatants.
FACS-based cytotoxicity assays.
The capacity of clone 21 to lyse various mHag+ or mHag− targets (EBV-LCLs or B-CLL cells) was measured in FACS-based 48-h cytotoxicity assays as previously described (15). The SEM of duplicate cultures never exceeded 15%.
Statistical analyses.
Where indicated, differences between groups were analyzed in two tailed Student's t tests with Prism software (GraphPad Software, Inc.). P-values < 0.05 were considered significant.
Online supplemental material.
Fig. S1 shows the mHag phenotypes for the individuals of CEPH families 1408, 1416, and 1331. Fig. S2 shows the reduction in correlation coefficient in datasets containing 10% false-positive phenotypes. Fig. S3 shows the chance of mHag mismatch between recipient/donor pairs (sibling or unrelated). Table S1 shows detailed phenotypes and zygosities of 15 CEPH individuals and Table S2 shows the input phenotype/zygosity data for retrospective genome-wide analysis. Table S3 shows the 149 SNPs used in the power analyses. Table S4 displays the used PCR primer sets. Online supplemental material is available at http://www.jem.org/cgi/content/full/jem.20080713/DC1.
Supplementary Material
Acknowledgments
We thank Drs. M. Theobald, J. Kuball, and B. Koeleman for stimulating discussions and critical reading of the manuscript, Dr. F. Koning for providing the HLA-DQ retroviral constructs, Dr. D. Nyholt for providing the standalone version of ssSNPer, P. de Koning for providing reagents for granzyme-B assays, and R. van Gent for providing B-CLL samples.
This work was supported by the University Medical Center Utrecht (Utrecht, Netherlands).
The authors have no conflicting financial interests.
Abbreviations used: allo-SCT, allogeneic stem cell transplantation; B-CLL, B cell chronic lymphoid leukemia; CEPH, Centre d'Etude du Polymorphisme Humain; EBV-LCL, EBV-transformed lymphoblastoid cell line; GvHD, graft versus host disease; LD, linkage disequilibrium; mHag, minor histocompatibility antigen; SNP, single-nucleotide polymorphism.
References
- 1.Parkin, D.M., F. Bray, J. Ferlay, and P. Pisani. 2005. Global cancer statistics, 2002. CA Cancer J. Clin. 55:74–108. [DOI] [PubMed] [Google Scholar]
- 2.Goulmy, E. 1997. Human minor histocompatibility antigens: new concepts for marrow transplantation and adoptive immunotherapy. Immunol. Rev. 157:125–140. [DOI] [PubMed] [Google Scholar]
- 3.de Bueger, M., A. Bakker, J.J. van Rood, F. Van der Woude, and E. Goulmy. 1992. Tissue distribution of human minor histocompatibility antigens. Ubiquitous versus restricted tissue distribution indicates heterogeneity among human cytotoxic T lymphocyte-defined non-MHC antigens. J. Immunol. 149:1788–1794. [PubMed] [Google Scholar]
- 4.Warren, E.H., P.D. Greenberg, and S.R. Riddell. 1998. Cytotoxic T-lymphocyte-defined human minor histocompatibility antigens with a restricted tissue distribution. Blood. 91:2197–2207. [PubMed] [Google Scholar]
- 5.den Haan, J.M., N.E. Sherman, E. Blokland, E. Huczko, F. Koning, J.W. Drijfhout, J. Skipper, J. Shabanowitz, D.F. Hunt, and V.H. Engelhard. 1995. Identification of a graft versus host disease-associated human minor histocompatibility antigen. Science. 268:1476–1480. [DOI] [PubMed] [Google Scholar]
- 6.den Haan, J.M., L.M. Meadows, W. Wang, J. Pool, E. Blokland, T.L. Bishop, C. Reinhardus, J. Shabanowitz, R. Offringa, D.F. Hunt, et al. 1998. The minor histocompatibility antigen HA-1: a diallelic gene with a single amino acid polymorphism. Science. 279:1054–1057. [DOI] [PubMed] [Google Scholar]
- 7.Dolstra, H., H. Fredrix, F. Maas, P.G. Coulie, F. Brasseur, E. Mensink, G.J. Adema, T.M. de Witte, C.G. Figdor, and E. van de Wiel-van Kemenade. 1999. A human minor histocompatibility antigen specific for B cell acute lymphoblastic leukemia. J. Exp. Med. 189:301–308. [DOI] [PMC free article] [PubMed] [Google Scholar]
- 8.Akatsuka, Y., T. Nishida, E. Kondo, M. Miyazaki, H. Taji, H. Iida, K. Tsujimura, M. Yazaki, T. Naoe, Y. Morishima, et al. 2003. Identification of a polymorphic gene, BCL2A1, encoding two novel hematopoietic lineage-specific minor histocompatibility antigens. J. Exp. Med. 197:1489–1500. [DOI] [PMC free article] [PubMed] [Google Scholar]
- 9.Rijke, B., A. van Horssen-Zoetbrood, J. M. Beekman, B. Otterud, F. Maas, R. Woestenenk, M. Kester, M. Leppert, A.V. Schattenberg, T. de Witte, E. van de Wiel-van Kemenade, and H. Dolstra. 2005. A frameshift polymorphism in P2X5 elicits an allogeneic cytotoxic T lymphocyte response associated with remission of chronic myeloid leukemia. J. Clin. Invest. 115:3506–3516. [DOI] [PMC free article] [PubMed] [Google Scholar]
- 10.Brickner, A.G., A.M. Evans, J.K. Mito, S.M. Xuereb, X. Feng, T. Nishida, L. Fairfull, R.E. Ferrell, K.A. Foon, D.F. Hunt, et al. 2006. The PANE1 gene encodes a novel human minor histocompatibility antigen that is selectively expressed in B-lymphoid cells and B-CLL. Blood. 107:3779–3786. [DOI] [PMC free article] [PubMed] [Google Scholar]
- 11.Warren, E.H., N.J. Vigneron, M.A. Gavin, P.G. Coulie, V. Stroobant, A. Dalet, S.S. Tykodi, S.M. Xuereb, J.K. Mito, S.R. Riddell, and B.J. Van den Eynde. 2006. An antigen produced by splicing of noncontiguous peptides in the reverse order. Science. 313:1444–1447. [DOI] [PubMed] [Google Scholar]
- 12.Kawase, T., Y. Akatsuka, H. Torikai, S. Morishima, A. Oka, A. Tsujimura, M. Miyazaki, K. Tsujimura, K. Miyamura, S. Ogawa, et al. 2007. Alternative splicing due to an intronic SNP in HMSD generates a novel minor histocompatibility antigen. Blood. 110:1055–1063. [DOI] [PubMed] [Google Scholar]
- 13.Riddell, S.R., M. Bleakley, T. Nishida, C. Berger, and E.H. Warren. 2006. Adoptive transfer of allogeneic antigen-specific T cells. Biol. Blood Marrow Transplant. 12:9–12. [DOI] [PubMed] [Google Scholar]
- 14.Jiang, Y.Z., and J. Barrett. 1997. The allogeneic CD4+ T-cell-mediated graft-versus-leukemia effect. Leuk. Lymphoma. 28:33–42. [DOI] [PubMed] [Google Scholar]
- 15.Spaapen, R., K. van den Oudenalder, R. Ivanov, A. Bloem, H. Lokhorst, and T. Mutis. 2007. Rebuilding human leukocyte antigen class II-restricted minor histocompatibility antigen specificity in recall antigen-specific T cells by adoptive T Cell receptor transfer: implications for adoptive immunotherapy. Clin. Cancer Res. 13:4009–4015. [DOI] [PubMed] [Google Scholar]
- 16.Griffioen, M., E.D. van der Meijden, E.H. Slager, M.W. Honders, C.E. Rutten, S.A. van Luxemburg-Heijs, P.A. von dem Borne, J.J. van Rood, R. Willemze, and J.H. Falkenburg. 2008. Identification of phosphatidylinositol 4-kinase type II beta as HLA class II-restricted target in graft versus leukemia reactivity. Proc. Natl. Acad. Sci. USA. 105:3837–3842. [DOI] [PMC free article] [PubMed] [Google Scholar]
- 17.Warren, E.H., B.E. Otterud, R.W. Linterman, A.G. Brickner, V.H. Engelhard, M.F. Leppert, P.J. Martin, and S.R. Riddell. 2002. Feasibility of using genetic linkage analysis to identify the genes encoding T cell-defined minor histocompatibility antigens. Tissue Antigens. 59:293–303. [DOI] [PubMed] [Google Scholar]
- 18.The International HapMap Consortium. 2003. The International HapMap Project. Nature. 426:789–796. [DOI] [PubMed] [Google Scholar]
- 19.Spierings, E., M. Hendriks, L. Absi, A. Canossi, S. Chhaya, J. Crowley, H. Dolstra, J.F. Eliaou, T. Ellis, J. Enczmann, et al. 2007. Phenotype frequencies of autosomal minor histocompatibility antigens display significant differences among populations. PLoS. Genet. 3:e103. [DOI] [PMC free article] [PubMed] [Google Scholar]
- 20.van Bergen, C.A., M.G. Kester, I. Jedema, M.H. Heemskerk, S.A. van Luxemburg-Heijs, F.M. Kloosterboer, W.A. Marijt, A.H. de Ru, M.R. Schaafsma, R. Willemze, et al. 2007. Multiple myeloma-reactive T cells recognize an activation-induced minor histocompatibility antigen encoded by the ATP-dependent interferon-responsive (ADIR) gene. Blood. 109:4089–4096. [DOI] [PubMed] [Google Scholar]
- 21.Brickner, A.G., E.H. Warren, J.A. Caldwell, Y. Akatsuka, T.N. Golovina, A.L. Zarling, J. Shabanowitz, L.C. Eisenlohr, D.F. Hunt, V.H. Engelhard, and S.R. Riddell. 2001. The immunogenicity of a new human minor histocompatibility antigen results from differential antigen processing. J. Exp. Med. 193:195–206. [DOI] [PMC free article] [PubMed] [Google Scholar]
- 22.Dolstra, H., B. de Rijke, H. Fredrix, A. Balas, F. Maas, F. Scherpen, M.J. Aviles, J.L. Vicario, N.J. Beekman, F. Ossendorp, T.M. de Witte, and E. van de Wiel-van Kemenade. 2002. Bi-directional allelic recognition of the human minor histocompatibility antigen HB-1 by cytotoxic T lymphocytes. Eur. J. Immunol. 32:2748–2758. [DOI] [PubMed] [Google Scholar]
- 23.Cella, M., D. Scheidegger, K. Palmer-Lehmann, P. Lane, A. Lanzavecchia, and G. Alber. 1996. Ligation of CD40 on dendritic cells triggers production of high levels of interleukin-12 and enhances T cell stimulatory capacity: T-T help via APC activation. J. Exp. Med. 184:747–752. [DOI] [PMC free article] [PubMed] [Google Scholar]
- 24.Scheuermann, R.H., and E. Racila. 1995. CD19 antigen in leukemia and lymphoma diagnosis and immunotherapy. Leuk. Lymphoma. 18:385–397. [DOI] [PubMed] [Google Scholar]
- 25.Kowolik, C.M., M.S. Topp, S. Gonzalez, T. Pfeiffer, S. Olivares, N. Gonzalez, D.D. Smith, S.J. Forman, M.C. Jensen, and L.J. Cooper. 2006. CD28 costimulation provided through a CD19-specific chimeric antigen receptor enhances in vivo persistence and antitumor efficacy of adoptively transferred T cells. Cancer Res. 66:10995–11004. [DOI] [PubMed] [Google Scholar]
- 26.Brentjens, R.J., J.B. Latouche, E. Santos, F. Marti, M.C. Gong, C. Lyddane, P.D. King, S. Larson, M. Weiss, I. Riviere, and M. Sadelain. 2003. Eradication of systemic B-cell tumors by genetically targeted human T lymphocytes co-stimulated by CD80 and interleukin-15. Nat. Med. 9:279–286. [DOI] [PubMed] [Google Scholar]
- 27.Voss, R.H., C. Lotz, A. Cellary, and M. Theobald. 2000. Targeting p53, hdm2, and CD19: vaccination and immunologic strategies. Bone Marrow Transplant. 25:S43–S45. [DOI] [PubMed] [Google Scholar]
- 28.Kawase, T., Y. Nannya, H. Torikai, G. Yamamoto, M. Onizuka, S. Morishima, K. Tsujimura, K. Miyamura, Y. Kodera, Y. Morishima, et al. 2008. Identification of human minor histocompatibility antigens based on genetic association with highly parallel genotyping of pooled DNA. Blood. 111:3286–3294. [DOI] [PubMed] [Google Scholar]
- 29.Holloway, P.A., N. Kaldenhoven, H.M. Kok-Schoemaker, M. Dijk, H.G. Otten, M. Tilanus, S. Postma, T. Mutis, H.M. Lokhorst, and A.C. Bloem. 2005. A class II-restricted cytotoxic T-cell clone recognizes a human minor histocompatibility antigen with a restricted tissue distribution. Br. J. Haematol. 128:73–81. [DOI] [PubMed] [Google Scholar]
- 30.Schaffer, A.A., S.K. Gupta, K. Shriram, and R.W. Cottingham Jr. 1994. Avoiding recomputation in linkage analysis. Hum. Hered. 44:225–237. [DOI] [PubMed] [Google Scholar]
- 31.Cottingham, R.W. Jr., R.M. Idury, and A.A. Schaffer. 1993. Faster sequential genetic linkage computations. Am. J. Hum. Genet. 53:252–263. [PMC free article] [PubMed] [Google Scholar]
- 32.Murray, J.C., K.H. Buetow, J.L. Weber, S. Ludwigsen, T. Scherpbier-Heddema, F. Manion, J. Quillen, V.C. Sheffield, S. Sunden, and G.M. Duyk. 1994. A comprehensive human linkage map with centimorgan density. Cooperative Human Linkage Center (CHLC). Science. 265:2049–2054. [DOI] [PubMed] [Google Scholar]
- 33.Dausset, J., H. Cann, D. Cohen, M. Lathrop, J.M. Lalouel, and R. White. 1990. Centre d'etude du polymorphisme humain (CEPH): collaborative genetic mapping of the human genome. Genomics. 6:575–577. [DOI] [PubMed] [Google Scholar]
- 34.Nyholt, D.R. 2006. ssSNPer: identifying statistically similar SNPs to aid interpretation of genetic association studies. Bioinformatics. 22:2960–2961. [DOI] [PubMed] [Google Scholar]
Associated Data
This section collects any data citations, data availability statements, or supplementary materials included in this article.