Abstract
mRNA stability, localization, and translation are largely determined by sequences in the 3′ untranslated region (UTR). Here, we describe a conserved increase in expression of mRNAs terminating at upstream polyadenylation sites (PAS) following activation of primary murine CD4+ T lymphocytes. This program, resulting in shorter 3′ UTRs, is a characteristic of gene expression during immune cell activation and correlates with proliferation across diverse cell types and tissues. Forced expression of full-length 3′ UTRs conferred reduced protein expression. In some cases the reduction in protein expression could be reversed by deletion of predicted microRNA target sites in the variably included region. Our data indicate that gene expression is coordinately regulated such that states of increased proliferation are associated with widespread reductions in the 3′ UTR-based regulatory capacity of mRNAs.
The 3′ untranslated region (UTR) of messenger RNA has known functions in the stability, localization, and translation of mRNA (1). These roles are mediated by interactions with regulatory proteins and RNAs, including microRNAs (miRNAs) (2) that act as positive or negative regulators. About half of mammalian genes use alternative cleavage and polyadenylation (APA) to generate multiple mRNA isoforms differing in their 3′ UTRs (3-5). However, the extent to which differential expression of these isoforms is used to regulate mRNA and protein levels in cellular proliferation and differentiation programs is poorly understood.
T lymphocyte activation is central to the immune response, and much is known about the associated gene expression and regulation (6). Earlier work demonstrated that APA is regulated in activated T cells (4, 7, 8). In order to provide a better understanding of how APA is used in an active gene expression program, we performed a global analysis of alternative 3′ UTR isoforms during T cell activation. We developed a method for probe-level alternative transcript analysis (PLATA) that uses variation in hybridization of individual oligonucleotide probes on Affymetrix Mouse Exon 1.0 ST microarrays. This platform was used to compare transcripts in resting primary murine T cells expressing CD4 (CD4+) to cells stimulated through the T cell antigen receptor (TCR) for 6 or 48 hours (Figs. S1-S4, Tables S1-S4).
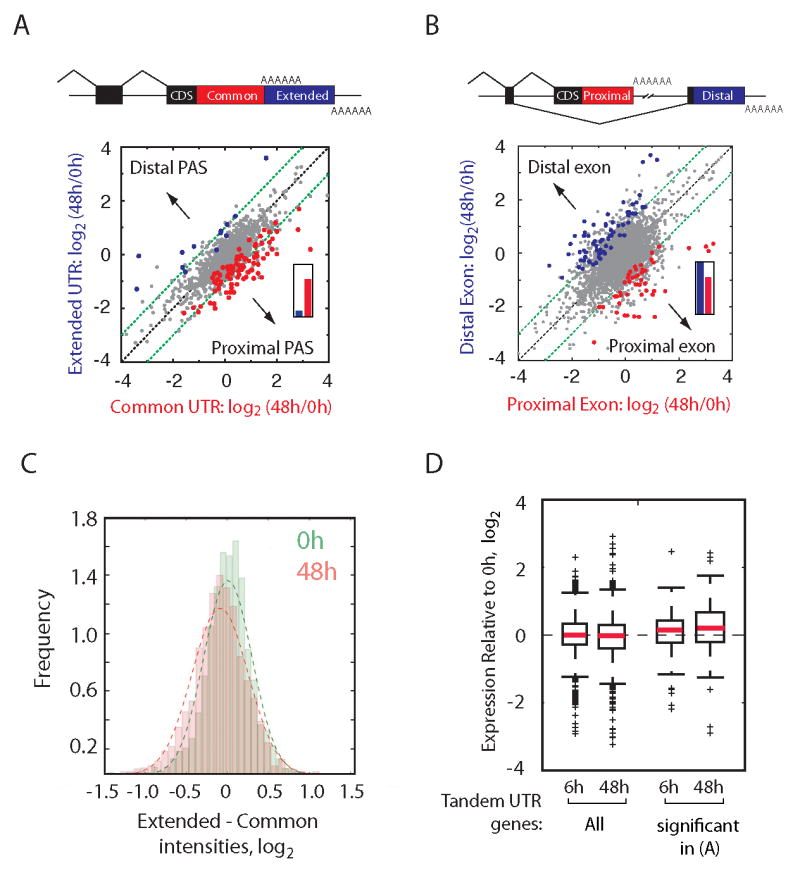
APA occurs in both a splicing-independent form (multiple PAS in a terminal exon – here called tandem UTRs) and a splicing-dependent form (mutually exclusive terminal exons - here called 3′ exon switching), diagrammed in Figs. 1A, 1B, respectively (4). These classes were considered separately in stimulated and resting cells. We first compared the relative expression of the common 3′ UTR regions (between stop codon and first or ‘proximal’ PAS) and of the extended 3′ UTR regions (between proximal PAS and second, ‘distal’ PAS) of 1,190 genes with EST-supported tandem UTRs and then compared the relative expression of mutually exclusive 3′ exons for 1,991 genes (Figs. 1A-B, S5-6, Tables S5-6). Patterns of splicing-independent and splicing-dependent APA events in stimulated cells were markedly different. Statistically significant 3′ exon switching events were observed at both early (n = 89; Fig. S6) and late (n = 203; Fig. 1B, Table S6) stages of activation, but statistically significant changes in tandem UTR events were observed only at late stages of activation (n = 99; Figs. 1A, S6). Proximal to distal and distal to proximal switching of 3′ exons were similarly represented (Figs. 1B, S6 insets; 143 versus 149 overall). However, 86% of changes in genes with tandem UTRs occurred in the direction of decreased expression of the extended 3′ UTR region (Fig. 1A inset). Changes in isoform expression estimated by PLATA were confirmed by qRT-PCR (Fig. S4D, Table S7). Genes with significantly reduced relative expression of extended 3′ UTR regions had an average 2.2-fold reduction in expression of extended region probes relative to common region probes. Since probes querying the common 3′ UTR region assess the aggregate expression of both isoforms, this value underestimates changes in APA isoform expression. Increased relative expression of shorter isoforms derived from tandem UTR-containing genes was independently validated by Northern analysis (Fig. S4E). A comprehensive analysis of all genes with tandem UTRs expressed at 48 hours revealed a highly significant (P < 6.6×10⁻¹⁹, t-test) reduction in extended 3′ UTR expression at late stages of T lymphocyte activation (Fig. 1C, Fig. S6). This reduction was not associated with significant changes in median gene expression (assessed by common region probes), although median expression of genes with highly significant individual events was slightly increased in activated cells (Fig. 1D). To determine whether the apparent global decrease in relative expression of extended UTR isoforms was unique to late stages of murine CD4+ T lymphocyte activation, we developed a tandem UTR length index (TLI) that assesses aggregate expression of extended 3′ UTR regions relative to overall gene expression levels (Fig. S7, Table S9).
Figure 1. Reduced relative expression of extended 3′ UTR regions 48h after T lymphocyte activation.

(A) Scatter plot of common and extended UTR region expression of tandem APA genes in resting and stimulated (48h) T lymphocytes. Significantly increased expression of isoforms resulting from distal PAS (blue) or proximal PAS (red) (P < 0.02, 20% FDR) are colored. Inset: Direction of change (13 distal, 86 proximal; P < 2.3×10⁻¹⁴, binomial test). (B) Relative expression of mutually exclusive 3′ exons in resting and stimulated (48h) T lymphocytes. Significant events (P < 0.0031; 5% FDR) and inset are as in (A). (C) Expression of common versus extended 3′ UTR regions in resting (0h, n = 1768) versus activated (48h, n = 1761) cells. Difference P < 6.6×10⁻¹⁹, t-test. (D) Relative expression (activated/resting) of all tandem UTR genes and in the set of significant events from (A) after stimulation.
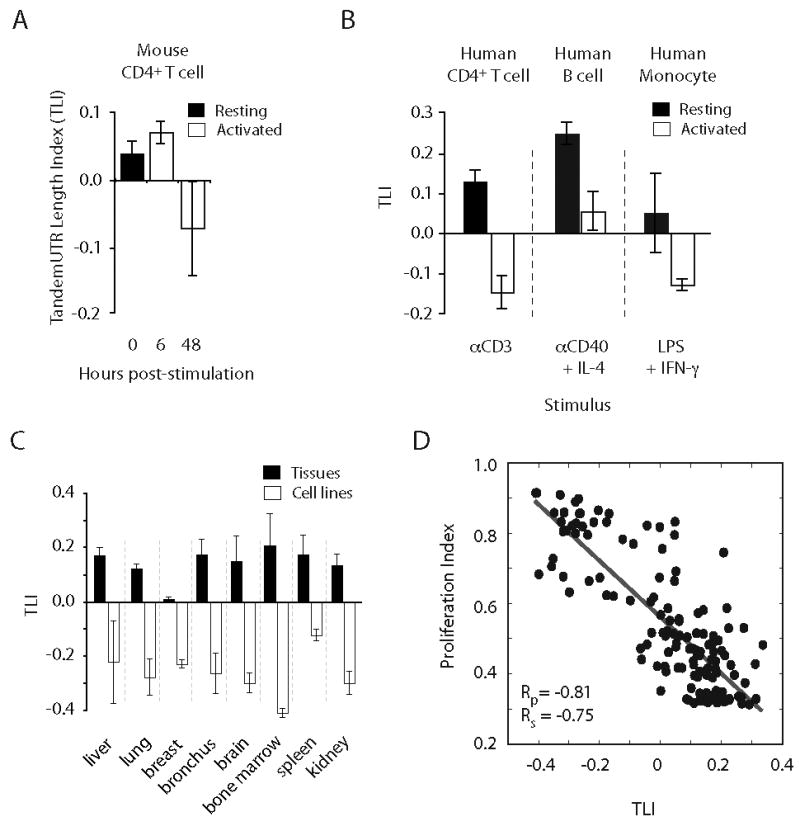
In our mouse CD4+ T cell data, TLI changed very little at 6 hours post-stimulation but showed a marked decrease at 48 hours (Fig. 2A). Analysis of array data from human T lymphocytes stimulated through the TCR revealed that decreased relative expression of distal PAS isoforms in tandem UTR genes is conserved between mouse and human (Fig. 2B). TLI also decreased following stimulation of human B cells with anti-CD40 and interleukin-4, and stimulation of human monocytes with lipopolysaccharide and interferon-gamma (Fig. 2B, Fig. S8A). Thus, a global decrease in relative expression of distal 3′ UTRs occurs following activation of several immune cell types with a variety of activating/proliferative stimuli.
Figure 2. Reduced expression of extended 3′ UTR regions is widespread, conserved to human, and correlated with proliferation.

(A) TLI analysis of murine CD4+ T lymphocytes stimulated with anti-CD3/anti-28 beads (this study). (B) TLI values from human CD4+ T cells, B cells, and monocytes activated for 30 h with the indicated stimulus. (C) TLI values of cultured cancer cell lines and of matched normal tissues. (D) Correlation of TLI with proliferation index across a panel of 135 different tissues and samples (Rs = Pearson; Rp = Spearman correlations). Data in (A-D) are mean +/- SD of 2-33 replicates (Table S8).
Analysis of a broader panel of human and mouse tissues revealed tissue-biased usage of APA isoforms in agreement with previous studies (3, 5) (Fig. S8B). TLI values from cell lines were consistently lower than for the normal tissue type from which the line was derived (Fig. 2C). Considering that cultured cell lines have been selected for rapid proliferation, and that activation of hematopoietic cells is often associated with a dramatic increase in proliferation rate, these observations suggested that decreased relative expression of distal PAS isoforms might be generally associated with cellular proliferation. To address this hypothesis, a gene expression-based measure of cellular proliferation, the proliferation index (PI) was developed (SOM). Analysis of array data over hundreds of individual samples revealed a strong negative correlation between PI and TLI, indicating that reduced relative expression of distal PAS isoforms is broadly associated with cellular proliferation (Fig. 2D).
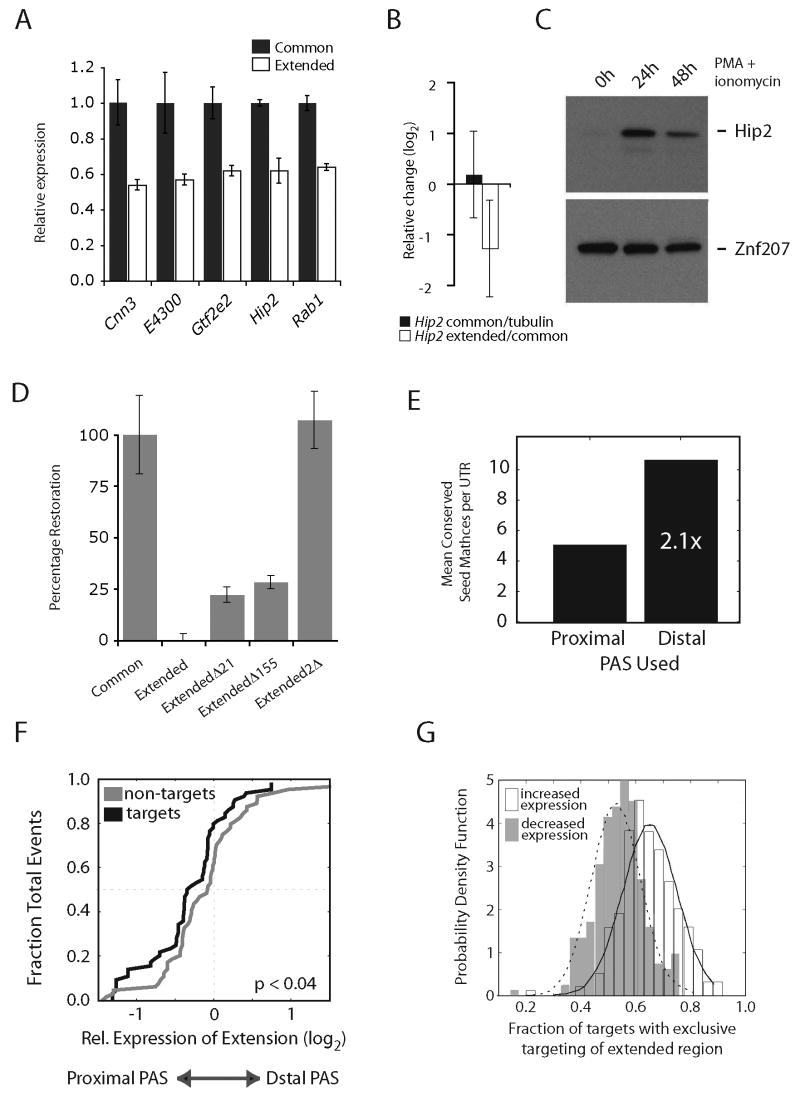
To assay how different 3′ UTR isoforms influence protein expression, common and full-length 3′ UTRs from several tandem APA genes were fused to a luciferase reporter. To isolate the effects of the UTR on protein expression from efficiency of polyadenylation, a heterologous SV40 PAS was used to terminate both transcripts. Use of the SV40 PAS in the full-length transcript was ensured by deletion of the sequence encoding the proximal PAS (Fig. S9A). In all cases tested, the full-length UTR reporter yielded significantly lower luciferase activity in stimulated primary T cells than the construct containing only the common UTR region (P < 0.01 by two-tailed t-test; Fig. 3A). Thus, sequences within the extended UTR regions of tandem UTR genes commonly reduced protein output, likely by affecting mRNA stability and/or translation.
Figure 3. Differential protein expression conferred by extended 3′ UTR regions and miRNA seed matches.
(A) Luciferase activity in stimulated primary murine T lymphocytes transfected with reporter constructs encoding common and extended 3′ UTR isoforms of indicated genes (Cnn3, acidic calponin 3; E4300, putative phosphodiesterase; Gtf2e2, General transcription factor II E, polypeptide 2; Hip2, Huntingtin-interacting protein 2; Rab1, Ras-associated protein Rab1). (B) Mean expression +/- SD of common transcript expression and relative 3′ UTR expression of the Hip2 transcript at 48 h post-stimulation. (C) Immunoblot of Hip2 protein in resting and stimulated (24 hour and 48 hour) primary CD4+ T cells. Znf207 serves as a loading control. (D) Percentage restoration of luciferase activity in stimulated primary murine T lymphocytes transfected with the indicated reporter constructs (Fig. S9). (E) Mean number of conserved 3′ UTR miRNA seed matches in proximal and distal PAS isoforms of genes with tandem APA sites. (F) Cumulative density plot of mean relative expression of extended regions (log2) for conserved targets (n = 64) and non-targets (n = 64) of activation and proliferation-associated miRNAs (mir-155, miR-17-92 cluster) at 48h post-stimulation. (G) Distribution of fraction of mRNA targets lost for each miRNA upon shift from distal to proximal PAS in genes with tandem UTRs that increase or decrease in expression 48h post-stimulation. Data in (A) and (D) are mean +/- SD of triplicate measurements and are representative of 3-4 independent experiments.
The extended 3′ UTR region of one tested gene, Hip2, contains conserved seed matches to miR-21 and miR-155, both of which are expressed in activated mouse T cells (9, 10). Overall Hip2 transcript expression was very similar between naïve and activated T lymphocytes; however upon activation relative expression of the extended UTR region decreased while protein levels increased substantially (Fig. 3B, C). This pattern is consistent with a model in which elimination of the extended region of the Hip2 3′ UTR in activated T cells releases this transcript from negative regulation by mir-21 and mir-155. In luciferase assays, whereas deletion of either miRNA seed match in the full-length construct resulted in a modest increase in expression, elimination of both sites restored luciferase expression to levels indistinguishable from those observed with the shorter UTR (Fig. 3D). We concluded that in activated T lymphocytes the extended region of the Hip2 3′ UTR confers reduced protein expression, and that the mir-21 and mir-155 seed matches within this region contribute to this regulation.
In agreement with previous studies (11), we found that extended UTR regions contained slightly higher numbers of conserved miRNA seed matches than common regions (Fig. 3E), but no single target site was significantly enriched in extended regions. However, the set of genes containing conserved seed matches to proliferation-associated T cell miRNAs (mir-155 and the oncogenic mir-17-92 cluster) exhibited significantly reduced expression of the distal PAS isoform relative to non-targets (P < 0.05; Fig. 3F) in stimulated T cells, where expression of these miRNAs is increased ((9) and Fig. S10)). Furthermore, tandem APA genes whose overall transcript expression increased following activation were more likely to be targeted exclusively in their extended UTR region by miRNAs than tandem APA genes whose expression decreased (Fig. 3G, P = 3.2e-6, t-test). Taken together, these data are consistent with a model in which reduced expression of distal PAS isoforms in genes upregulated following activation results in reduced potential for targeting by proliferation-associated negative regulatory factors.
Comparisons of tissue-specific EST libraries have been used to catalog genes with APA and to identify motifs enriched around the PASs of these genes (3, 5, 11, 12). However, to our knowledge a widespread pattern of directed changes in 3′ UTR isoform expression has not been previously described as part of a gene expression program. The observed pattern of decreased relative expression of longer mRNA isoforms could result from a systematic shift in APA or from preferential destabilization of longer mRNA isoforms. The available evidence tends to support regulated APA as being more important, e.g., a stability-based mechanism would predict a significant decrease in mean expression of genes with altered 3′ UTR isoform expression following activation, but no general decrease was observed (Fig. 1F), and Northern blots (Fig. S4) generally showed increased expression of the shorter isoform, which is more consistent with APA regulation. However, our data do not conclusively distinguish between these two mechanisms.
Stimulation of B lymphocytes, T cells, and monocytes results in increased protein expression of the general polyadenylation factor Cstf-64, which plays a role in increased usage of “weaker” upstream PAS in certain 3′ exon switching events in these cell types (7, 13-16). Since Cstf-64 protein expression is also increased as cultured fibroblasts initiate proliferative programs (13), one could imagine that this factor might function as a “master regulator” of PAS selection controlling all of the events that we observe. However, given that Igμ heavy chain PAS selection can be functionally uncoupled from both proliferation and Cstf-64 protein levels in the B cell model (13), and that tandem UTR events respond very differently from 3′ exon switching events in this study, it is likely that additional factors are involved (17-20).
The general association of the program of increased relative expression of shorter 3′ UTR isoforms with states of higher proliferation may indicate that UTR-based mRNA regulation plays distinct roles in the regulatory networks of non- or slowly-proliferating cells as compared to actively proliferating cells. It is tempting to speculate that in some cases a shift toward expression of proximal PAS isoforms may be required to evade regulation that would otherwise restrict cell cycle progression. Both of these ideas are consistent with the observation that global downregulation of miRNA expression is observed in human cancers (21) and promotes cellular transformation and tumorigenesis (22).
Supplementary Material
Acknowledgments
We thank members of the Burge and Sharp labs as well as M. Winslow, K. Cante-Barrett, and O. Larsson. This research was supported by the Knut and Alice Wallenberg Foundation (R.S.); the Cancer Research Institute (J.R.N.); the Gina De Felice and Robert M. Lefkowitz (1975) Fund (A.S.); United States Public Health Service grants RO1-GM34277 from the National Institutes of Health, PO1-CA42063 and U19 AI056900 from the National Cancer Institute to PAS and partially by Cancer Center Support (core) grant P30-CA14051 from the National Cancer Institute; and by R01-HG002439 from the NHGRI (C.B.B.). Array data have been deposited in Gene Expression Omnibus (GSE10666).
Footnotes
This manuscript has been accepted for publication in Science. This version has not undergone final editing. Please refer to the complete version of record at http://www.sciencemag.org/. Their manuscript may not be reproduced or used in any manner that does not fall within the fair use provisions of the Copyright Act without the prior, written permission of AAAS.
References and notes
- 1.Moore MJ. Science. 2005 Sep 2;309:1514. doi: 10.1126/science.1111443. [DOI] [PubMed] [Google Scholar]
- 2.Bartel DP, Chen CZ. Nat Rev Genet. 2004;5:396–400. doi: 10.1038/nrg1328. [DOI] [PubMed] [Google Scholar]
- 3.Beaudoing E, Gautheret D. Genome Res. 2001;11:1520–6. doi: 10.1101/gr.190501. [DOI] [PMC free article] [PubMed] [Google Scholar]
- 4.Edwalds-Gilbert G, Veraldi KL, Milcarek C. Nucleic Acids Res. 1997;25:2547–61. doi: 10.1093/nar/25.13.2547. [DOI] [PMC free article] [PubMed] [Google Scholar]
- 5.Zhang H, Lee JY, Tian B. Genome Biol. 2005;6:R100. doi: 10.1186/gb-2005-6-12-r100. [DOI] [PMC free article] [PubMed] [Google Scholar]
- 6.Crabtree GR. Science. 1989 Jan 20;243:355. doi: 10.1126/science.2783497. [DOI] [PubMed] [Google Scholar]
- 7.Chuvpilo S, et al. Immunity. 1999 Feb;10:261. doi: 10.1016/s1074-7613(00)80026-6. [DOI] [PubMed] [Google Scholar]
- 8.Peattie DA, Hsiao K, Benasutti M, Lippke JA. Gene. 1994;150:251–7. doi: 10.1016/0378-1119(94)90434-0. [DOI] [PubMed] [Google Scholar]
- 9.Monticelli S, et al. Genome Biol. 2005;6:R71. doi: 10.1186/gb-2005-6-8-r71. [DOI] [PMC free article] [PubMed] [Google Scholar]
- 10.Wu H, et al. PLoS ONE. 2007;2:e1020. doi: 10.1371/journal.pone.0001020. [DOI] [PMC free article] [PubMed] [Google Scholar]
- 11.Legendre M, Ritchie W, Lopez F, Gautheret D. PLoS Comput Biol. 2006;2:e43. doi: 10.1371/journal.pcbi.0020043. [DOI] [PMC free article] [PubMed] [Google Scholar]
- 12.Ara T, Lopez F, Ritchie W, Benech P, Gautheret D. BMC Genomics. 2006;7:189. doi: 10.1186/1471-2164-7-189. [DOI] [PMC free article] [PubMed] [Google Scholar]
- 13.Martincic K, et al. Proc Natl Acad Sci U S A. 1998 Sep 15;95:11095. doi: 10.1073/pnas.95.19.11095. [DOI] [PMC free article] [PubMed] [Google Scholar]
- 14.Shell SA, Hesse C, Morris SM, Jr, Milcarek C. J Biol Chem. 2005 Dec 2;280:39950. doi: 10.1074/jbc.M508848200. [DOI] [PubMed] [Google Scholar]
- 15.Takagaki Y, Seipelt RL, Peterson ML, Manley JL. Cell. 1996 Nov 29;87:941. doi: 10.1016/s0092-8674(00)82000-0. [DOI] [PubMed] [Google Scholar]
- 16.Takagaki Y, Manley JL. Mol Cell. 1998 Dec;2:761. doi: 10.1016/s1097-2765(00)80291-9. [DOI] [PubMed] [Google Scholar]
- 17.Brown KM, Gilmartin GM. Mol Cell. 2003 Dec;12:1467. doi: 10.1016/s1097-2765(03)00453-2. [DOI] [PubMed] [Google Scholar]
- 18.Quesada V, Macknight R, Dean C, Simpson GG. Embo J. 2003 Jun 16;22:3142. doi: 10.1093/emboj/cdg305. [DOI] [PMC free article] [PubMed] [Google Scholar]
- 19.Simpson GG, Dijkwel PP, Quesada V, Henderson I, Dean C. Cell. 2003 Jun 13;113:777. doi: 10.1016/s0092-8674(03)00425-2. [DOI] [PubMed] [Google Scholar]
- 20.Veraldi KL, et al. Mol Cell Biol. 2001 Feb;21:1228. doi: 10.1128/MCB.21.4.1228-1238.2001. [DOI] [PMC free article] [PubMed] [Google Scholar]
- 21.Lu J, et al. Nature. 2005;435:834–8. doi: 10.1038/nature03702. [DOI] [PubMed] [Google Scholar]
- 22.Kumar MS, Lu J, Mercer KL, Golub TR, Jacks T. Nat Genet. 2007;39:673–7. doi: 10.1038/ng2003. [DOI] [PubMed] [Google Scholar]
Associated Data
This section collects any data citations, data availability statements, or supplementary materials included in this article.


