

Abstract
Background
Quadrature surface MRI/MRS detectors comprised of circular loop and figure-8 or butterfly-shaped coils offer improved signal-to-noise-ratios (SNR) compared to single surface coils, and reduced power and specific absorption rates (SAR) when used for MRI excitation. While the radius of the optimum loop coil for performing MRI at depth d in a sample is known, the optimum geometry for figure-8 and butterfly coils is not.
Materials and methods
The geometries of figure-8 and square butterfly detector coils that deliver the optimum SNR are determined numerically by the electromagnetic method of moments. Figure-8 and loop detectors are then combined to create SNR-optimized quadrature detectors whose theoretical and experimental SNR performance are compared with a novel quadrature detector comprised of a strip and a loop, and with two overlapped loops optimized for the same depth at 3 T. The quadrature detection efficiency and local SAR during transmission for the three quadrature configurations are analyzed and compared.
Results
The SNR-optimized figure-8 detector has loop radius r8 ∼ 0.6d, so r8/r0 ∼ 1.3 in an optimized quadrature detector at 3 T. The optimized butterfly coil has side length ∼ d and crossover angle of ≥ 150° at the center.
Conclusions
These new design rules for figure-8 and butterfly coils optimize their performance as linear and quadrature detectors.
Keywords: Quadrature detectors, SNR, MR, surface coils
Introduction
Quadrature MRI detectors are comprised of elements whose principal radiofrequency (RF) magnetic field components are orthogonal or nearly orthogonal, such that they can directly receive the circularly polarized MRI or MRS signals from a sample [1-4]. By combining the raw signals from a pair of quadrature elements with a hybrid that provides the appropriate 90° phase shift, or by means of a root-of-the-sum-of-the-squares combination of the detected signals, a quadrature detector coil can provide up to a √2-fold gain in the signal-to-noise-ratio (SNR) compared to coils of the same geometry used as linear detectors [1,5]. Quadrature surface coils comprised of a circular loop and a figure-8 or butterfly coil with long axis perpendicular to the main magnetic field, B0, have been adopted for both multinuclear MRS, and for commercial MRI phased arrays in applications including the spine [4,6,7], where their use with quadrature hybrids can halve the number of MRI receiver channels required to service the array.
For the circular loops in these quadrature detectors, the geometry that produces the maximum intrinsic SNR (ISNR), the SNR excluding MRI system losses and conductive losses in the detector [8], at a desired depth d is known from numerical [9] and theoretical [10] analyses in the low-field (low-frequency) limit to have radius:
| (1) |
Unfortunately, no similar design rule exists for the construction of a figure-8 or butterfly detector. Consequently, there is neither a design rule for optimizing the ISNR performance of the figure-8 detector by itself, nor a recipe for designing one whose ISNR performance is matched to that of a loop to achieve an appropriately performance-matched quadrature detector.
We recently used an electromagnetic (EM) method-of-moments (MoM) full-wave analysis to numerically determine design rules that optimize the SNR performance of the MRI strip detector [11]. Here we extend this approach to develop a design rule for optimizing the SNR performance of the figure-8 coils depicted in Fig. 1, and experimentally validate it on a 3 T scanner. First, the coils are numerically tuned and the numerical tuning is tested by comparison with experimental component values on four prototypes. The ISNR is then computed for circular-shaped figure-8 coils of different sizes, from which a design rule for the coil geometry that optimizes ISNR at a given depth is derived. The performance is compared with the related, squared-off butterfly coil. Next, we compare the numerical and experimental ISNR performance of a quadrature detector formed from a figure-8 and a circular coil with geometries chosen to optimize the ISNR at the same depth, with that of two other quadrature configurations shown in Fig. 2. The first comparison is with a detector comprised of two loops of the same size overlapped to form a simple dual-coil phased array, known to deliver some quadrature advantage when oriented with long axis perpendicular to B0. The second comparison is with a novel quadrature detector, introduced herein, comprised of a MRI strip detector plus a loop surface coil with ISNR optimized for the same depth. Together they form a Greek-phi-shaped quadrature detector with the strip oriented parallel to B0, so that its principle RF field component is perpendicular to the loop’s axis. Finally, to compare the relative efficiency of the three surface quadrature detector geometries when used for transmission and/or reception, the specific absorption rate (SAR) and the quadrature efficiency are evaluated numerically for transmit and receive modes, respectively, in a homogeneous bio-analogous phantom.
Fig. 1.
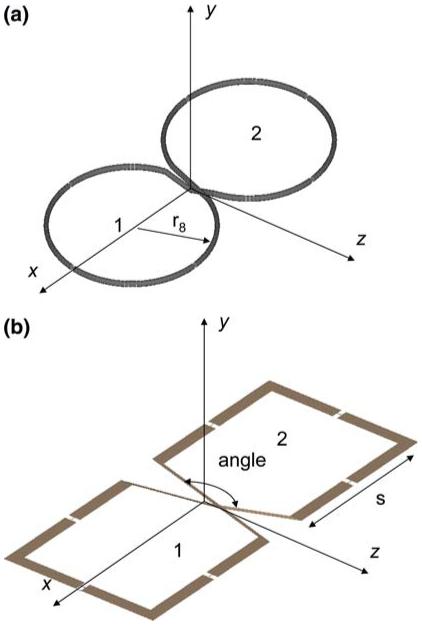
Quadrature coils oriented with long axes orthogonal to that of the main field B0 along the z-axis. a Ideal figure-8-shaped coil made out of copper wire of circular cross-section. b Square or butterfly shaped figure-8 coil made with copper strip
Fig. 2.
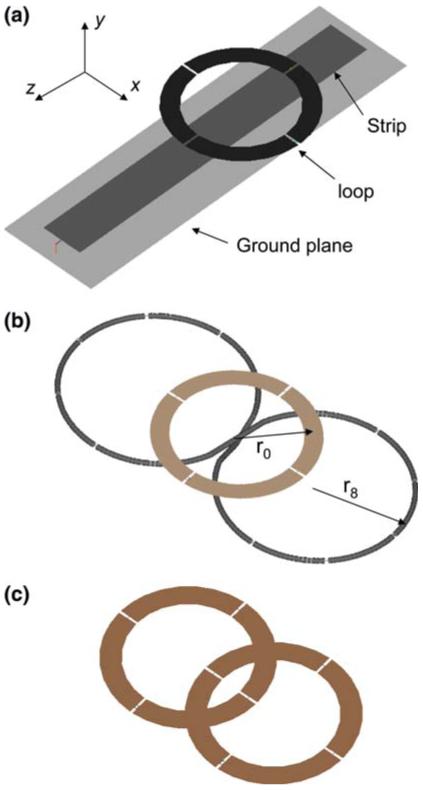
Quadrature surface coil detector prototypes optimized for a depth of 90 mm. a Phi-detector. The circular loop of 10-mm-wide copper strip has an inner radius of 35 mm, and is tuned and matched with n = 3 series and one parallel capacitor. The strip detector is 200 mm long by 25 mm wide, and is tuned with three capacitors connected to a 220 mm by 60 mm ground plane. The loop is offset 20 mm toward the grounded end of the strip. b Figure-8 plus circular loop coil. The circular loop geometry is the same as for the phi-detector. The figure-8 is made of 1.5-mm-radius copper tubing with r = 52 mm, one parallel and n = 9 series capacitors. c Dual-loop array employing the same circular loop geometry. The two coils are overlapped by ∼25% to minimize coupling [15]
Theory and methods
Numerical optimization
The circular figure-8 and squared-off butterfly geometries are illustrated in Fig. 1. The size of the figure-8 coil yielding the maximum ISNR for a given depth is determined by calculating the ISNR of coils formed of two circular loops (radius 5 ≤ r8 ≤ 70 mm) twisted about the middle, and a square butterfly (side length, 5 ≤ s ≤ 85 mm), varied in 5 mm increments. These parameter ranges include receiver coil geometries that have previously been used for multinuclear MRS of the heart and liver, and for MRI phased arrays for the spine [4,6,7]. The absolute ISNR is calculated from the formula [10]:
| (2) |
where Vsig and Vnoise are, respectively, the peak signal and the standard deviation of the noise voltages, ω is the Larmor frequency in rad/s, ΔV is the voxel volume, M0 is the magnetization, is the magnitude of the left-hand circularly polarized component of the transverse RF magnetic field produced by the coil with a one ampere current in the loop, k is Boltzmann’s constant, T is the absolute temperature, Δ f is the receiver bandwidth, and RL is the noise resistance of the sample-loaded detector.
Coils are first tuned to a parallel resonance with one parallel input capacitor (Cp) and n = 5 - 9 equally spaced series capacitors (Cs; see below). Then is calculated using the numerical MoM (FEKO solver, EM software and systems, South Africa) [11]. RL is determined from the input impedance of the coil loaded with a homogeneous semi-infinite plane of muscle of relative magnetic permeability μr = 1, dielectric constant εr = 63.5 and conductivity σ = 0.72 S/m at 127.7 MHz, as determined from a parametric model of the tissue properties [12]. The numerical computation of RL for the ISNR includes, but does not differentiate, both sample losses associated with the eddy currents induced by magnetic fields in the sample that inductively couple to the coils, and direct E-field (or capacitive) losses associated with coil-sample interactions. The latter are minimized, in theory as in practice, by distributing the tuning capacitance around the coils [10]. The tissue is laid on top of the detector with a 3 mm acrylic overlay to provide insulation and mechanical support. The circular figure-8 detectors are modeled with 3.2-mm-diameter copper tubing, while the butterfly and circular loop detectors use a 10 mm copper strip. The strip detector is made of 25 mm copper strip with n = 3 equally spaced capacitors connected to the ground plane and the distal end of the strip also grounded [11]. This design maintains better tuning stability when a tuned resonant loop is overlaid, and, for depths d < 40 mm, realizes a 10-20% higher SNR than that achieved when the capacitors are located only at each end [13], albeit at the expense of uniformity in the sensitivity profile along the strip’s long axis.
The ISNR is computed for figure-8 loops of radii 5-70 mm at 5 mm increments, and the radii that produce the maximum ISNR for a given depth d on the axis above the crossover of the figure-8 are determined for 0 mm ≤ d ≤ 100 mm, at 1 mm increments. The curve of best fit to these data is used to derive the design rule for the figure-8 loop size that produces the optimum ISNR for a target depth of interest. In order to derive accurate design rules from these plots for coils that are reduced to practice, we included for these plots alone the conductivity (σ = 5.882 × 10⁷S/m) and skin depth (δ = 5.8 μm) for a copper detector [14] in the computations. For the squared-off butterfly coil, the optimal crossover angle at the midpoint (Fig. 1b) is first determined, followed by the square side length that produces the optimum ISNR for a given depth, as for the figure-8 coil.
The theoretical ISNR for optimized quadrature detectors, consisting of: (i) a single-loop coil element and a figure-8 coil (Fig. 2b); (ii) two overlapped loops forming a phased array with long axis orthogonal to B0 (Fig. 2c); and (iii) a single loop and a strip parallel to B0 forming a phi-detector, was calculated numerically with an Agar gel phantom (εr = 78, σ = 0.45 S/m) load. For these calculations, each detector geometry in the quadrature pair is chosen to maximize the ISNR at substantially the same depth (d) to yield ISNR-matched pairs. For the single loop this condition is met by Eq. (1); for the figure-8 and butterfly coils the design rules obtaining from the analyses herein are used; for the phi-detector the optimum strip has length L ∼ 1.3d and an air dielectric [11]. Combining this with Eq. (1) for the ISNR-matched phi-detector yields L ∼ -3r0 ∼ 3d/√5. The theoretical ISNR performance of the quadrature detectors are calculated from the root of the sum of the squares of the ISNR from the composite elements [15], assuming that the effects of correlated noise are negligible.
Coil tuning
The figure-8 and butterfly coils are constructed by twisting two identical loops about their midpoint so that their currents are the same but in counter-rotating directions (Fig. 1). The magnetic flux Φ11 generated just by the current flowing through one loop of the symmetric structure is equal but opposite to the flux, Φ22, due to the current in the second loop:
| (3) |
where B1 and B2 are the magnetic flux densities of the two loops and ds1 is the vector surface element normal to the plane of the coil. Similarly, the flux through the second loop generated by the field B12 of the first loop, Φ12, is equal but opposite to the flux through the first loop generated by the field B21 in the second loop, Φ21:
| (4) |
The total inductance is equal to the sum of the self (L11) and mutual (L12) inductances:
| (5) |
where
| (6) |
μ0 is the permeability of free space, and a is the radius of the wire or tube [16] used for the figure-8 coil. Other expressions for inductance calculations are available for loops made of flat strips [16].
The figure-8 coils are tuned by setting the reactive part of their total parallel impedance to zero at the resonant frequency, and solving for the values of the series capacitors. The reactive part of the parallel impedance is:
| (7) |
where κ is the mutual coupling constant for coplanar circular loops with parallel axis from Table 45 of Ref. [16], ω is the resonant frequency, and μ = μ0μr. Equating the numerator to zero provides an exact solution for Cs for a particular number of series capacitors, n. The parallel or matching (Cp) capacitor value is selected to match the optimum preamplifier impedance under sample-loaded conditions: typically 50Ω.
The other coil elements (the loop, and the strip used for the ISNR-matched quadrature pairs) are tuned numerically, as described previously [11].
Quadrature efficiency
Bt is computed numerically for the phi-detector (Fig. 2a), the figure-8 plus loop (Fig. 2b), and two overlapped loops (Fig. 2c) implemented as quadrature surface detectors, by appropriately phase-shifting the current applied to one detector element by 90°. Because the detector elements are designed to optimize the ISNR at a given depth on axis, by reciprocity they are also optimized for generating the maximum Bt per ampere at that depth. However, the magnitude of Bt generated per ampere will generally differ between detectors due to intrinsic differences in sensitivity. This would result in an elliptically polarized field when each detector is excited by the same current, even if the transverse components are perfectly orthogonal. Therefore, for the purpose of computing the quadrature efficiency, intrinsic differences in the Bt generated per ampere are first compensated by normalizing the Bt produced by the two elements to the same value at the depth for which the geometries are optimized. In practice this can be accomplished by adjusting the balance of currents in each detector, for example, using attenuators in the transmit line. The left and right circularly polarized receiver components are determined from the phasor sum of the x- and y-components (Bx, By) and their conjugate pairs of the transverse field (in the laboratory frame):
| (8) |
The quadrature efficiency is then calculated as [17]:
| (9) |
A value of β = 1 or 0, corresponds to perfect left or right circular polarization, respectively. β = 0.5 is equivalent to a linear polarization. Values of 0.5 ≤ β ≤ 1 reflect imperfect circular polarization, including, for example, elliptic polarization where the efficiency of one of the detectors underperforms the other. Values of β ≤ 0.5 imply a polarization component rotating in phase with the MRI signal.
SAR analysis
The SAR gives the measure of the power dissipated in a lossy sample such as biological tissue, during RF transmission. The local SAR distribution is calculated for the three quadrature elements deployed as quadrature transmitters from the electric fields , via:
| (10) |
for a sample of conductivity σ S/m and density ρ kg/m3, respectively. The input power at each element of the quadrature transmitter was adjusted to produce a 90° RF pulse (rectangular, 3 ms, 10% duty cycle) at the same optimum depth d, for which the detectors are designed for. The local SAR at each point in the semi-infinite lossy dielectric gel is determined in an axial slice through the center of each quadrature pair, employing Greens functions in the MoM field calculations.
Experimental validation
To test the numerical analysis of the optimum figure-8 coil experimentally, four figure-8 coils were fabricated from a = 1.6 mm copper tubing, with r8 = 20, 30, 40, and 50 mm, and polyamide electrical insulation where the conductors cross. Each coil is tuned with one parallel, and either n = 5 (for r8 = 20 - 40 mm coils) or n = 9 (the r8 = 50 mm coil) series high-quality factor (Q) ceramic capacitors (Dielectric Laboratories, NY, USA). The choice of number of capacitors, n is based on a rule of thumb that avoids using capacitors of less than 20 pF lest stray capacitance (in the range of 1-10 pF) alters the tuning in the scanner. This rule is responsible for the higher n used for the r8 = 50 mm coil. Once Cs is determined, the value of Cp is adjusted empirically to match the coils to 50 Ω with a reflection coefficient |Γ| ∼ 0.1. The calculated values of the tuning capacitors are compared with the experimental values.
To test the computed performance of the quadrature detectors experimentally, the figure-8 plus loop coil, phi-detector, and the two-loop phased-array prototypes were fabricated. The figure-8 coil, with r8 = 50 mm and a = 1.6 mm, is tuned with one parallel and n = 9 series capacitors. It is matched with an r0 = 40 mm circular loop made from 10-mm-wide copper strip, tuned with one parallel and three series capacitors (Fig. 2b). The phi-detector is made with a straight L = 200 mm long, 25-mm-wide copper strip (3M Corporation, MN, USA) tuned to a quarter wavelength (λ/4) at 128 MHz with the three lumped capacitors. To facilitate tuning the chosen length of the strip is longer than the optimal strip length (L ∼ 120mm) sacrificing only 2% of the SNR at the optimal depth for the chosen loop geometry [11]. The strip detector has a narrow ground plane (60 mm) to reduce interactions with the loop coil. The ground plane is separated from the strip by a 6 mm air gap and the strip is covered with a 3 mm acrylic dielectric (εr = 2.6) overlay. An r0 = 40 mm circular loop made from 10 mm copper strip and tuned with n = 3 series and one parallel capacitors completes this quadrature detector. Because the strip detector’s sensitivity profile is slightly shifted towards its grounded end, the circular loop is positioned 20 mm off-center from the strip (Fig. 2a). The two-loop quadrature detector utilizes r0 = 40 mm circular loops of the 10 mm copper strip, overlapped to maximize decoupling of the elements.
Coils are actively decoupled with a PIN diode at the feed point and with a passive blocking circuit utilizing a Schottky diode on each detector element. A balun formed from a coaxial inductor-capacitor tank circuit is placed on each coil to suppress common-mode currents on the cable shield. Each detector element is connected via a λ/2 coaxial cable to the preamplifier interface and scanner.
The SNR of the detectors is measured under loaded conditions with a 35 mM NaCl, 2 mM CuSO4, 1% by weight Agar gel phantom (width=220 mm, depth=300 mm, height=120 mm). Two drops of concentrated H2SO4 are added before the Agar to avoid CuSO4 precipitation. The spin lattice relaxation time (T1) of the gel phantom is 625 ms, as determined by the inversion-recovery method. Experiments were performed with a Philips Achieva 3 T MRI scanner employing a gradient refocused echo (GRE) pulse sequence.
RF inhomogeneity correction at 3 T
RF field inhomogeneity has long been recognized as problematic for high-field MRI where the body behaves as a lossy dielectric with dimensions comparable to the wavelength,
| (11) |
in the tissue [18,19]. Based on the estimated dielectric properties of the gel phantom used in the experiments, the EM wavelength of fields in the gel phantom is 248 mm and therefore potentially a problem for ISNR measurements. To correct for differences between the true local flip angle, α=90°, and the nominal flip angle provided by the scanner, α*, signals are acquired with five different nominal flip angles under fully relaxed conditions (TR=3,500 ms, TE=3.2 ms, NEX=1; α*=45°, 65°, 90°, 135°, 150°; 10 mm slice thickness). Because the signal is given by
| (12) |
where is the right-circularly polarized transmitter field and γ and τ are the gyromagnetic ratio and pulse width, a nonlinear least-squares fit to
| (13) |
for each pixel provides the fitting factors F and G, of which F is used to correct the pixel intensity to the expected value for a true 90° pulse at each location.
SNR comparisons
Pixel SNR at a given depth d is derived from the ratio of the signal level to the offset-corrected standard deviation of the real part of a complex noise image collected without RF excitation or gradients applied [20]. As TE ≪ T2 and TR ≫ T1 for the gel phantom, the SNR calculations are not corrected for relaxation. ISNR is determined by first normalizing the pixel SNR (SNRpixel) by the voxel volume, and then determining the receiver bandwidth (BW) per pixel. For a Nx × Ny(256 × 256) image matrix, the absolute experimental SNR is thus:
| (14) |
Detector conductive losses are then accounted for via measurements of coil Qs, with (QL) and without (QU) the sample load, on a Hewlett Packard HP 23605 network analyzer with an impedance test module. The system noise figure (η, in dB) is measured by the cold resistor method [21]. The measured experimental ISNR is thus [8]:
| (15) |
Finally, T2-weighted turbo-spin echo (TR=3,000 ms; TE = 90 ms; NEX = 4; 5 mm slice) images of the lumbar spine of a healthy volunteer were acquired with the figure-8 plus loop coil set, and with the phi-detector, for comparison.
Results
Figure-8 performance
Figure 3 compares the calculated values of the matching and tuning capacitors for the 128 MHz figure-8 coils with experimental values measured from the r8 = 20, 30, 40 and 50 mm prototypes. The values agree within 2%, except for r8 = 50 mm, where a matching inductor was added to avoid possible stray capacitance effects with the low computed CP value. The horizontal lines indicate the solution to Eq. (7) for Cs value for each coil radii. These data show that use of Eqs. (5-7), for the figure-8 coil yield correct values of the tuning capacitances within their tolerances. The unloaded and loaded coil Qs are listed in Table 1. As the coil size (r) increases, QL decreases, consistent with an increasing sample load [8].
Fig. 3.
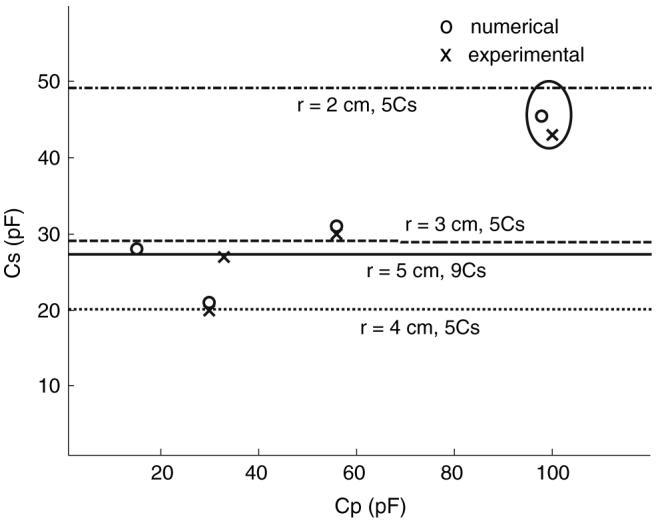
Comparison of experimental (crosses) and computed (open circles) series tuning (Cs) and parallel matching (Cp) capacitor values for r = 20, 30, 40, and 50 mm figure-8 coils at 128 MHz. Horizontal lines indicate the series tuning (Cs) capacitor values determined by analytically solving the reactive part of the input impedance of the loop
Table 1.
Unloaded and loaded Q values of the prototype detectors
| Detector | QU | QL |
|---|---|---|
| Figure-8, r = 20 mm | 158 | 78 |
| Figure-8, r = 30 mm | 159 | 42 |
| Figure-8, r = 40 mm | 152 | 27 |
| Figure-8, r = 50 mm | 177 | 21 |
| Loop, r = 40 mm | 122 | 20 |
| With figure-8, r = 50 mm | 177 | 21 |
| Loop, r = 40 mm on phi-coil | 77 | 25 |
| Strip on phi-coil | 55 | 44 |
| Overlapped loops, r = 40 mm | ||
| Element 1 | 127 | 26 |
| Element 2 | 154 | 31 |
Figure 4a plots the computed figure-8 coil radii that produce maximum ISNR at each depth. Including the copper conductivity in the analysis does not significantly affect SNR for radii r8 ≥ 10 mm, but does limit the advantage of using smaller coils at shallower depths. Replacing the 3.2-mm-diameter copper tube with a strip of the same width (6 mm) also has negligible affect (<1%) on SNR, at least for coils with r8 ≥ 30 mm. The line of best fit to the data yields the result that the optimum figure-8 for a depth d has radius
| (16) |
Fig. 4.
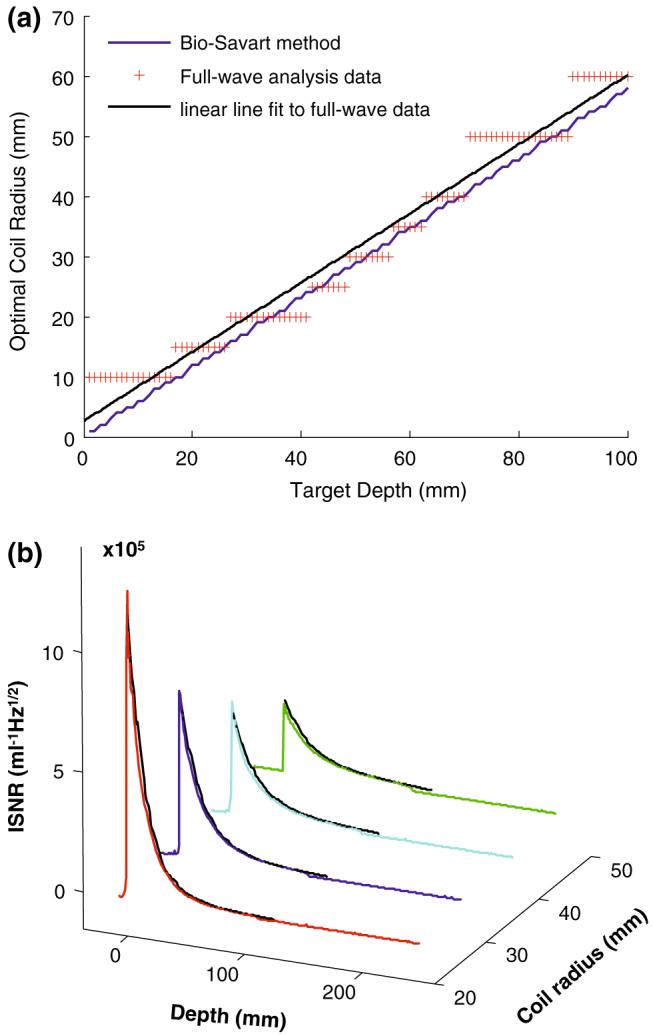
a Numerical EM calculations of the figure-8 coils producing the maximum ISNR for target depths 1 ≤ d ≤ 100 mm at 1 mm increments above the coil’s central crossover point. The data are based on 14 figure-8 coils of radius (r) of 5-70 mm at 5 mm increments. The slope of the line of best fit to the data is 0.57. The curve that results from using the Bio-Savart law is overlaid and has slope of 0.58. b Comparison of experimental (colored curves) and computed (black dashed line curves) absolute ISNR (√Hz/ml) as a function of depth, d (mm) above the coil’s central crossover point, for prototype figure-8 coils of radius r = 20, 30, 40, and 50mm
Equation (16) is a design rule for producing figure-8 surface coils whose ISNR is optimized for regions of interest at depth d in a sample. As the figure-8 coil sizes considered in the analysis are smaller than the wavelength in the medium, we found the design rule in Eq. (16) resulting from numerical full-wave simulations is essentially in agreement with that resulting from calculations using the Bio-Savart law, as shown in Fig. 4a. For sample noise-dominant detectors, equating Eqs. (1) and (16) yields a design ratio for the radii of the two elements of a quadrature figure-8 plus loop detector that optimizes ISNR for a given depth:
| (17) |
Figure 4b compares experimental and computed absolute ISNR (√Hz/ml) as a function of depth above the coil’s central crossover point, for prototype figure-8 coils with four different radii. The excellent agreement shows that the numerical EM calculations can accurately predict the real experimental performance of figure-8 coils.
The results of a similar analysis for the square butterfly-shaped loops are shown in Fig. 5. Based on the ISNR above the center, Fig. 5a shows that the optimal angle between cross overlapping conductors at the midpoint is ≥ 150°. The side lengths of coil that produce the maximum ISNR at each depth built with a 150° crossover angle are plotted in Fig. 5b. Again, as the side length is reduced below ∼20 mm, coil conductor losses become a factor limiting performance at shallower depths. The line of best fit yields the finding that the optimal butterfly coil has side length:
| (18) |
An ISNR performance comparison of a circular figure-8 loop optimized for a depth based on Eq. (16) with an optimally performing square butterfly loop at the same depth on axis based on Eq. (18) shows that both designs perform with equivalent ISNR to within 2% variation on axis.
Fig. 5.
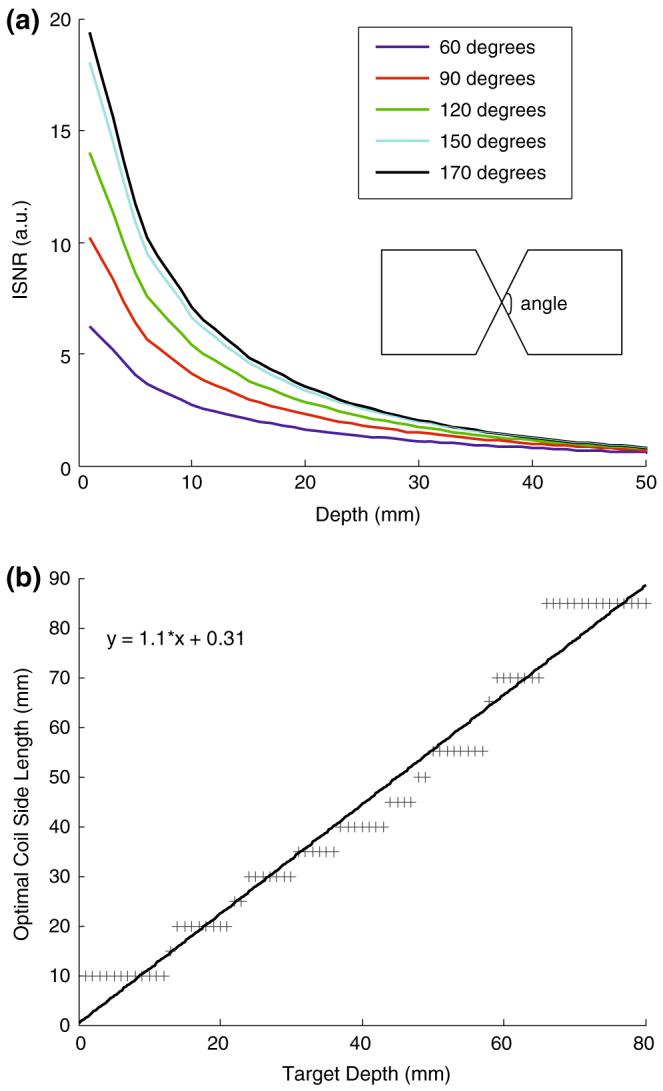
a ISNR (arbitrary units) as a function of depth at the central crossover point of a 60 mm square-sided butterfly coil at five different crossover angles. The optimal angle is ≥150°. b Numerical EM calculations of square butterfly figure-8 coils with maximum ISNR for target depths (d) of 1 ≤ d ≤ 80 mm at 1 mm increments above the coil’s central crossover point. The data are based on 17 butterfly loops of side length (a) of 5-85 mm at 5 mm increments, with a 150° crossover angle. The slope of the line of best fit to the data is 1.1
Quadrature surface coil performance
The coupling between the quadrature elements of the three surface quadrature detector prototypes, both unloaded and loaded with the saline phantom, are listed in Table 2. The phi-detector exhibits the best isolation when loaded, and the dual-loop array fares worst, reflecting the fact that the primary magnetic fields produced by the two coplanar loop coils are substantially parallel, while those of the phi-detector are intrinsically orthogonal. Figure 6 compares their theoretical and experimental SNR profiles in the axial plane through the middle of the detectors. All three detectors appear to have essentially similar signal penetration into the sample and similar sensitivities, however, the axial field of view (FOV) of the figure-8 plus loop and dual-loop array is wider than that of the phi-coil along the x-axis because their windings physically extend to nearly double its width (Fig. 6c, d versus a), whereas the FOV of the phi-coil is greatest along the z-axis due to the strip (Fig. 6b). For loop detectors with ro ≥ 30 mm, repeat analysis replacing the 10 mm copper strip with the a = 1.6 mm tube did not significantly affect (<2%) the SNR. Note the asymmetry of the axial SNR profiles both in the theoretical and experimental results at this MRI frequency.
Table 2.
Coupling (S21) between quadrature detector elements
| Detectors | Coupling (S21) between elements |
|
|---|---|---|
| Unloaded (dB) | Loaded (dB) | |
| Phi-coil | -43 | -40 |
| Figure-8 plus loop | -13 | -35 |
| Overlapped loops | -32 | -20 |
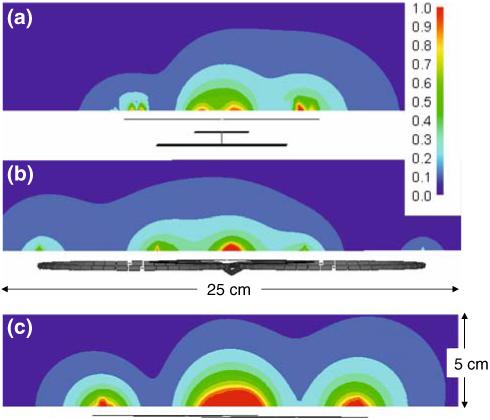
Fig. 6.

Numerical ISNR contour profiles and experimental image profiles of surface quadrature detectors: a on the left the axial ISNR contour profile of the phi-detector (strip length, 200 mm; strip width, 25 mm; circular loop radius, 40 mm) and on the right the experimental image profile; b on the left the sagittal ISNR contour profile of the phi-detector and on the right the sagittal ISNR contour profile of the figure-8 plus loop (figure-8 radius, 52mm; circular loop radius, 40 mm); c on the left the axial ISNR contour profile of the figure-8 plus circular loop coil and on the right the experimental image profile; and d on the left axial ISNR contour profile of overlapped dual loop array (circular loop radii, 40 mm) and on the right the experimental image profile. Contour intervals are in arbitrary units
The absolute ISNR performance of the phi-detector, the figure-8 plus loop, and the dual-loop array are plotted as a function of depth above each detector’s center in Fig. 7. The numerical results (Fig. 7a) show that the phi-detector has a higher ISNR than the others up to about 20 mm into the sample, beyond which all three detectors perform essentially equally. The experimental data (Fig. 7b) show that the phi-detector and overlapped loops perform slightly better than the figure-8 plus loop at shallow (<25 mm) depths. Except for the phi-detector at shallow depths, the experimental and computed ISNR performance agree within about 10% across the sample. Images of the lumbar spine obtained with the phi-detector and the figure-8 plus loop as quadrature detectors with identical acquisition parameters are shown in Fig. 8. The slices are selected at locations where the SNR is highest for each detector. The figure-8 plus loop has a wider FOV coverage in the axial plane (Fig. 8b), and the phi-detector has a high SNR close to the strip detector, consistent with Fig. 7.
Fig. 7.
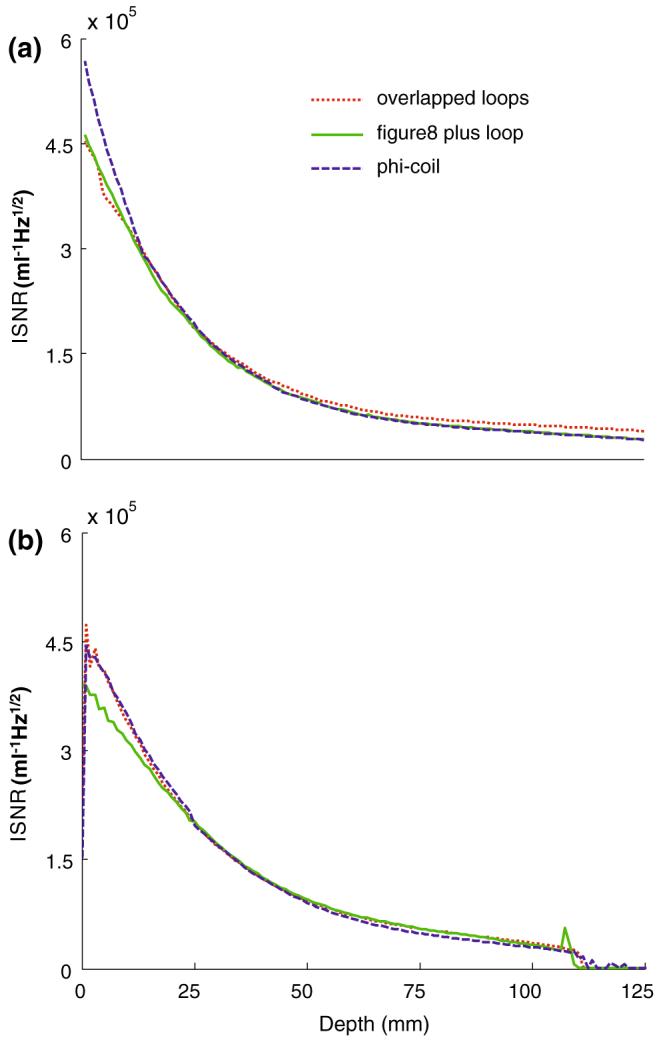
Computed a and experimental b ISNR (ml-1 Hz1/2) as a function of depth (mm) for the phi-coil (dashed blue lines), figure-8 plus loop (solid green lines), and overlapped dual loops (dotted red lines) from the middle of the axial plane shown in Fig. 6a-c
Fig. 8.
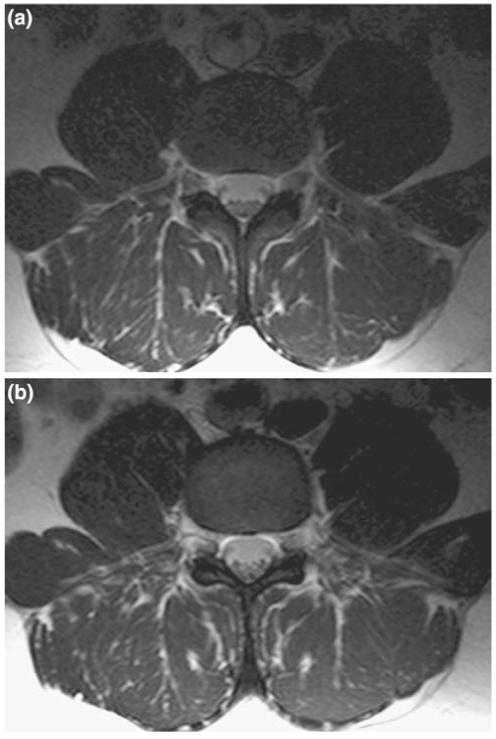
a T2-weighted lumbar spine axial image of a normal volunteer collected with the phi-coil: turbo-spin echo sequence with TE=90 ms, TR=2,550 ms, FOV=20 cm, matrix size = 256 × 196, slice thickness=5 mm, NEX=4. Signals from each detector element are combined by the sum-of-squares method. b The same anatomical region imaged with the figure-8 plus circular loop with identical imaging parameters and signal combination method
Figure 9 shows the quadrature efficiency (β) of the three quadrature detectors in the axial planes. As in Fig. 6, though more pronounced, each detector exhibits an asymmetric distribution in β in the axial plane. Values of β < 0.5 in some locations suggest a net counter-rotating component. In the center, the quadrature efficiency of the figure-8 plus loop and the phi-detector approach unity, performing better than the dual-loop detector. Note that normalization of the Bt field for the figure-8, loop, and strip quadrature detectors at their optimal depths ensures that β = 1 at this point because the phases of these detectors are in quadrature on axis.
Fig. 9.
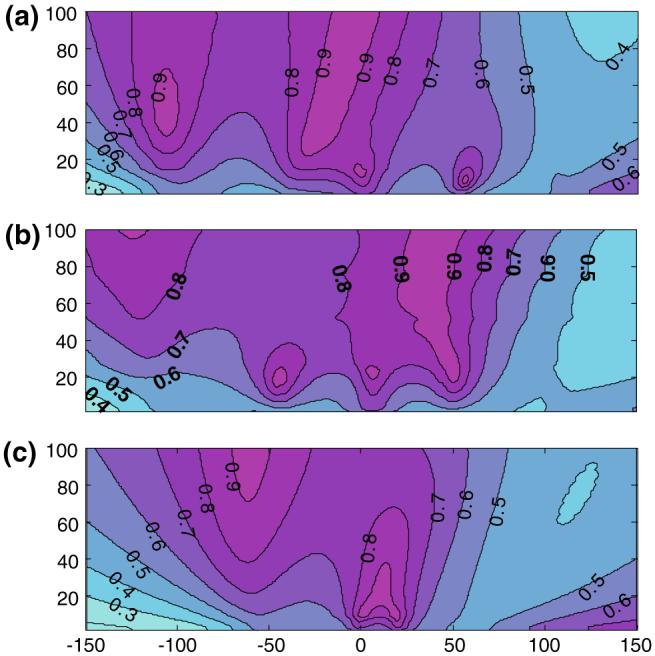
Detector quadrature field efficiency (β) of phi-coil (a), figure-8 plus loop (b), and two-element overlapped circular loops (c) excited with quadrature phase shift between elements. β = 1 or 0, corresponding to a perfectly circular rotating or counter-rotating field
Figure 10 shows the local SAR (watts/kg) for the axial slices selected at the center of each quadrature pair. The peak SAR (watts/kg) occurs on the top (z = 0) of the acrylic overlay for each transmitter pair. And for the figure-8 plus loop and the dual overlapped loops the peak SAR occurs at one of the two locations where the coil conductors overlap. For the phi-coil the peak SAR occurs near where the circular loop and strip cross nearest the strip’s ground terminated end.
Fig. 10.
SAR (watts/kg, color scale upper right) values in the axial plane where the peak SAR averaged over 1 g of sample (red square) occurs for the three quadrature elements: a phi-coil, peak SAR=3.7 watts/kg at (x =∼ 0, y = 0, z = -50mm) b figure-8 plus loop, peak SAR=3.7 watts/kg at (x = 0, y = 0, z = -40mm) and c overlapped loops, peak SAR=3.2 watts/kg at (x = 0, y = 0, z = -30mm) in transmit mode in the Agar gel phantom (εr = 78 and σ = 0.45 S/m). The input power at each element is applied to generate ∼2 μT at a depth of 90 mm with a 10% duty cycle. The detector profiles are sketched below each plot
Discussion
After the simple loop, the figure-8 loop with counter-rotating currents is the second most commonly used surface coil element in MRI and MRS. Its most useful property derives from its principal RF magnetic field being substantially orthogonal to that of a coplanar coaxial loop surface coil. This provides essential value for applications including quadrature detection, and inherent isolation when multiple coplanar transmitters and receivers are used. Despite its importance, an optimum design rule for the figure-8 coil analogous to that available for loop coils did not exist. Here, for the first time, we derive a simple rule for designing the figure-8 detector which produces the maximum ISNR at a given depth. Equation (16) reveals that the optimal radius for an ideal figure-8 coil is about 0.6 times the depth of interest. We determine that for square butterfly-shaped loops the optimal square side length is about equal to the depth of interest with the wires crossing at an internal angle of ≥150°. We used numerical MoM analysis, which accounted for losses and wave propagation effects in the sample and the conductor, and the fields generated by the loops in practical configurations.
Albeit less elegant than analytical solutions, numerical approaches were originally applied to optimizing the simple loop surface coil [9], and more recently, the strip detector [11]. This approach can give accurate predictions of performance for complicated coil configurations and is best suited to analysis of specific design prototypes. A caveat is that, because such approaches are strictly limited to a specific set of design parameters, they cannot be used to provide conclusions that are globally valid without an investigation of the entire range of variables, either iteratively or through sampling. Even so, in the case of the loop, the original numerical solution turned out to be essentially global in practical designs, at least at lower RF frequencies [10] (Eq. 1). The present analysis relates to figure-8 coils with minimum to maximum diameter dimension ranging from 1 to 13 cm (Fig. 5) at 128 MHz for 3 T MRI. Although many shape variations other than the circular figure-8 are conceivable, our analysis showed equivalent MRI performance for the butterfly coil (Fig. 1b) and suggests that ISNR variations with shape are relatively small for similar-sized loops.
The numerical full-wave EM approach to determine the optimal coil radius for a given depth involved determining: (i) the lumped capacitor elements needed to tune the figure-8 loop elements; (ii) the spatial distribution of transverse field; and (iii) the noise resistances. The validity of the tuning calculation was tested by its ability to accurately predict the tuning capacitances in experimental 128 MHz figure-8 prototypes with four different radii (Fig. 3). This shows that the analytical expressions (Eqs. 5-7), can be reliably used for this purpose. The validity of the ISNR analysis for the figure-8 detector is supported by the agreement between measured and computed ISNR for the four experimental prototypes (Fig. 4b). When comparing experimental and computed ISNR, we found it essential to account for variations in flip angle due to inhomogeneity (>30%) in the RF excitation field caused by penetration and phase-shift effects in the large gel phantom at 128 MHz [17,18,22].
Our ISNR analysis is based on homogeneous muscle tissue at 128 MHz which, excluding fluids, has one of the higher tissue RF conductivities in the body [17,18,22], and is therefore more susceptible to potential RF field nonuniformity arising from penetration effects [17,18,22] that could conceivably affect the optimum design [23]. However, when our full-wave analysis is applied to determine the optimum circular loop size for sample depths of 5-10 cm, we find that the prior expression for optimizing the loop, Eq. (1), is still valid within 3% for muscle at 128 MHz. Similarly, if muscle is replaced by brain, whose conductivity is about half, or with adipose, whose conductivity is about 20-fold lower than muscle, repeat SNR calculations on loops and figure-8 detectors at d = 5 and 10 cm show that, although noise levels change, the optimum coil size does not change by more than 3% from that predicted by Eqs. (1) and (16). Because such large changes in tissue properties do not significantly affect the design rules for these coils in homogeneous models at 128 MHz, we do not expect the optimum design rule to change significantly for heterogeneous models, at least at these limited depths for muscle, head, and spine studies. Nevertheless, we expect that repeat full-wave EM analysis will ultimately be required to determine optimum coil design as frequencies increase significantly above 130 MHz.
We further examined the performance of the figure-8 coil in its common quadrature configuration with a circular loop. This yielded, for the first time, a design rule for the ratio of the radii of the two elements that optimizes ISNR at the same depth. As given by Eqs. (16, 17), the ideal figure-8 loop radius should be larger, about 1.3 times the circular loop radius, and the squared-off butterfly side length should be about twice the radius size of its accompanying circular loop. However, the SNR advantage from using the derived optimal design rule in Eq. (17) for a circular figure-8 plus loop compared to a crude design that employed, for example, r0 = r8 = 0.5d for a quadrature coil is only 7% for d = 90 mm.
The ISNR performance of an ideal figure-8 plus loop quadrature configuration was evaluated in the context of two other quadrature surface detector designs: the overlapped dual-loop array, and the phi-detector, a novel loop/strip design introduced herein. The design rule for an ISNR-matched phi-detector calls for a strip length of about three times the loop radius of its quadrature partner.
The three quadrature surface detectors were analyzed numerically and with measurements on experimental prototypes optimized for a depth of approximately 90 mm. The ISNR performances of each of the quadrature detectors is 21-22% higher compared to that of an optimal single circular loop on axis, in agreement with an earlier estimate of a 24% gain for quadrature loop detectors [9,15]. The theoretical ISNR calculations assume that the detector elements are perfectly isolated, whereas in practice, coupling for the dual-loop array was inferior while the phi-detector performed best with 40 dB isolation (Table 2). Both theoretical analysis and experimental measurements show that all three detectors exhibit comparable ISNR performance and depth penetration, on axis. The phi-detector’s performance is a little better at shallower depths (Fig. 6), but its sensitive volume in the transverse plane is smaller. Note however, that this ISNR performance excludes coil losses via the Q correction (Eq. 15). The Q correction is much larger for the phi-detector because the measured Q of both elements is much lower (Table 2), due to the presence of the ground plane and inherent differences in the way energy is stored in the strip detector. Note that superior ISNR performance will not result in a real SNR gain in practice if the losses associated with lower Q values cannot be surmounted. Nevertheless, comparison of the spinal images (Fig. 8) indicates that the phi-coil does not underperform the figure-8 plus loop coil at lower depths.
As evidenced in Fig. 6, all three quadrature detectors exhibit some asymmetry in their field profiles at 128 MHz. The asymmetry is more pronounced in the plots of the quadrature polarization efficiency (Fig. 9). The transverse field becomes most homogeneous and symmetric when the dielectric sample load is replaced by an air dielectric. This problem of transverse magnetic field inhomogeneity and phase variations related to the electrical properties of the sample is long known from high-field MRI [18,19,22]. It is ameliorated at 1.5 T by applying circularly polarized fields with bird-cage RF coils [19]. However problems persist at higher fields [17] and the present surface coil configurations are far less symmetric than the bird-cage coil.
The local SAR plots in the axial plane in the center of the detector pairs also show some asymmetry. The computed peak SAR value over 1 g of tissue for a realistic flip-angle requirement (90° at 90 mm depth) for all three quadrature detectors falls within a factor of two of the US Food and Drug Administration (FDA) regulatory guideline of 8 watts/kg. The local hot spots of maximum power deposition all occur close to the conductors and where they overlap, and may be ameliorated by modifying the spacing and/or insulation. Note that, in practice, tissue heterogeneity may cause local peak SAR values to differ from those deduced for the present homogeneous models [24,25].
In conclusion, we have: (i) determined design rules that optimize the ISNR performance of figure-8 and butterfly-shaped surface coils and quadrature detectors that employ them with loop coils; (ii) introduced the quadrature phi-detector; and (iii) examined the relative performance of these quadrature detectors and a conventional dual-loop array at 128 MHz. We hope the findings will benefit the SNR performance in those MRI and MRS applications where quadrature and orthogonal surface excitation and detection elements are needed for MRI and MRS.
Acknowledgments
The work presented in the paper is supported by NIH grant R01 RR15396. The authors would like to thank William A. Edelstein, Ronald Ouwerkerk, and Michael Schar for valuable discussions and help.
This work is supported by NIH grant R01 RR15396.
References
- 1.Hoult DI, Chen CN, Sank VJ. Quadrature detection in the laboratory frame. Magn Reson Med. 1984;1:339–353. doi: 10.1002/mrm.1910010305. [DOI] [PubMed] [Google Scholar]
- 2.Chen C, Hoult DI, Sank VJ. Quadrature detection coils—a further sqrt(2) improvement in sensitivity. J Magn Reson. 1983;54:324–327. [Google Scholar]
- 3.Hyde JS, Jesmanowicz A, Grist TM, Froncisz W, Kneeland JB. Quadrature detection surface coil. Magn Reson Med. 1987;4:179–184. doi: 10.1002/mrm.1910040211. [DOI] [PubMed] [Google Scholar]
- 4.Bottomley PA, Hardy CJ, Roemer PB, Mueller OM. Proton-decoupled, Overhauser-enhanced, spatially localized carbon-13 spectroscopy in humans. Magn Reson Med. 1989;12:348–363. doi: 10.1002/mrm.1910120307. [DOI] [PubMed] [Google Scholar]
- 5.Redpath TW. Quadrature rf coil pairs. Magn Reson Med. 1986;3:118–119. doi: 10.1002/mrm.1910030115. [DOI] [PubMed] [Google Scholar]
- 6.Bottomley PA, Roemer PB. Homogeneous tissue model estimates of RF power deposition in human NMR studies. Local elevations predicted in surface coil decoupling. Ann NY Acad Sci. 1992;649:144–159. doi: 10.1111/j.1749-6632.1992.tb49604.x. [DOI] [PubMed] [Google Scholar]
- 7.Guclu CC, Boskamp E, Zheng T, Becerra R, Blawat L. A method for preamplifier-decoupling improvement in quadrature phased-array coils. J Magn Reson Imaging. 2004;19:255–258. doi: 10.1002/jmri.10449. [DOI] [PubMed] [Google Scholar]
- 8.Edelstein WA, Glover GH, Hardy CJ, Redington RW. The intrinsic signal-to-noise ratio in NMR imaging. Magn Reson Med. 1986;3:604–618. doi: 10.1002/mrm.1910030413. [DOI] [PubMed] [Google Scholar]
- 9.Roemer W, Edelstein WA. Ultimate sensitivity limits of surface coils; SMRM 6th Annual Meeting; 1987.p. 410. [Google Scholar]
- 10.Chen CN, Hoult DI. Biomedical magnetic resonance technology. Adam Hilger; Bristol: 1989. p. 143.p. 161. [Google Scholar]
- 11.Kumar A, Bottomley PA. Optimizing the intrinsic signal-to-noise ratio of MRI strip detectors. Magn Reson Med. 2006;56:157–166. doi: 10.1002/mrm.20915. [DOI] [PMC free article] [PubMed] [Google Scholar]
- 12.Andreuccetti D, Fossi R, Petrucci C. An Internet resource for calculation of the dielectric properties of body tissues. 2002 http://niremf.ifac.cnr.it/tissprop/#refs.
- 13.Lee RF, Hardy CJ, Sodickson DK, Bottomley PA. Lumped-element planar strip array (LPSA) for parallel MRI. Magn Reson Med. 2004;51:172–183. doi: 10.1002/mrm.10667. [DOI] [PMC free article] [PubMed] [Google Scholar]
- 14.Pozar DM. Microwave engineering. Wiley; New York: 1998. [Google Scholar]
- 15.Roemer PB, Edelstein WA, Hayes CE, Souza SP, Mueller OM. The NMR phased array. Magn Reson Med. 1990;16:192–225. doi: 10.1002/mrm.1910160203. [DOI] [PubMed] [Google Scholar]
- 16.Grover FW. Inductance calculations. Dover Publications; Mineola: 1973. [Google Scholar]
- 17.Wang J, Yang QX, Zhang X, Collins CM, Smith MB, Zhu XH, Adriany G, Ugurbil K, Chen W. Polarization of the RF field in a human head at high field: a study with a quadrature surface coil at 7.0 T. Magn Reson Med. 2002;48:362–369. doi: 10.1002/mrm.10197. [DOI] [PubMed] [Google Scholar]
- 18.Bottomley PA, Andrew ER. RF magnetic field penetration, phase shift and power dissipation in biological tissue: implications for NMR imaging. Phys Med Biol. 1978;23:630–643. doi: 10.1088/0031-9155/23/4/006. [DOI] [PubMed] [Google Scholar]
- 19.Glover GH, Hayes CE, Pelc NJ, Edelstein WA, Mueller OM, Hart HR, Hardy CJ, O’Donnell M, Barber WD. Comparison of linear and circular polarization for magnetic resonance imaging. J Magn Reson. 1985;64:255–270. [Google Scholar]
- 20.Edelstein WA, Bottomley PA, Pfeifer LM. A signal-to-noise calibration procedure for NMR imaging systems. Med Phys. 1984;11:180–185. doi: 10.1118/1.595484. [DOI] [PubMed] [Google Scholar]
- 21.Bottomley PA. A practical guide to getting NMR spectra in vivo. In: Budinger TF, editor. Medical magnetic resonance imaging and spectroscopy, a primer. Society of Magnetic Resonance in Medicine; Berkeley: 1986. pp. 81–95. [Google Scholar]
- 22.Wiesinger F, Vande Moortele PF, Adriany G, De Zanche N, Ugurbil K, Pruessmann KP. Parallel imaging performance as a function of field strength—an experimental investigation using electro-dynamic scaling. Magn Reson Med. 2004;52:953–964. doi: 10.1002/mrm.20281. [DOI] [PubMed] [Google Scholar]
- 23.Keltner JR, Carlson JW, Roos MS, Wong ST, Wong TL, Budinger TF. Electromagnetic fields of surface coil in vivo NMR at high frequencies. Magn Reson Med. 1991;22:467–480. doi: 10.1002/mrm.1910220254. [DOI] [PubMed] [Google Scholar]
- 24.Collins CM, Li S, Smith MB. SAR and B1 field distributions in a heterogeneous human head model within a birdcage coil. Specific energy absorption rate. Magn Reson Med. 1998;40:847–856. doi: 10.1002/mrm.1910400610. [DOI] [PubMed] [Google Scholar]
- 25.Davis PL, Shang C, Talagala L, Pasculle AW. Magnetic resonance imaging can cause focal heating in a nonuniform phantom. IEEE Trans Biomed Eng. 1993;40:1324–1327. doi: 10.1109/10.250588. [DOI] [PubMed] [Google Scholar]