Abstract
Reactive oxygen species (ROS) and insulin signaling in the adipose tissue are critical determinants of aging and age-associated diseases. It is not clear, however, if they represent independent factors or they are mechanistically linked. We investigated the effects of ROS on insulin signaling using as model system the p66Shc-null mice. p66Shc is a redox enzyme that generates mitochondrial ROS and promotes aging in mammals. We report that insulin activates the redox enzyme activity of p66Shc specifically in adipocytes and that p66Shc-generated ROS regulate insulin signaling through multiple mechanisms, including AKT phosphorylation, Foxo localization, and regulation of selected insulin target genes. Deletion of p66Shc resulted in increased mitochondrial uncoupling and reduced triglyceride accumulation in adipocytes and in vivo increased metabolic rate and decreased fat mass and resistance to diet-induced obesity. In addition, p66Shc-/- mice showed impaired thermo-insulation. These findings demonstrate that p66Shc-generated ROS regulate the effect of insulin on the energetic metabolism in mice and suggest that intracellular oxidative stress might accelerate aging by favoring fat deposition and fat-related disorders.
Genetic evidence suggests that insulin/IGF1 signaling in the adipose tissue plays a critical role in the regulation of lifespan in both invertebrates and mammals; (i) overexpression in the fat tissue of Foxo, a key target of insulin/IGF-1 signaling that is inactivated by insulin/IGF-1, prolongs lifespan in Drosophila and Caenorhabditis elegans (1-3) (ii) fat-specific disruption of the insulin receptor gene decreases body fat and increases lifespan in mice (FIRKO mice) (4, 5). Furthermore, sirtuin1 (SIRT1), the mammalian ortholog of the life-extending yeast gene silent information regulator 2 (SIR2), inhibits adipogenesis of precursor cells and reduces fat storage in differentiated adipocytes by repressing the peroxisome proliferator-activated receptor-γ nuclear receptor, a master regulator of fat cell development in the insulin/IGF1 signaling pathway (6).
At the molecular level evidence suggests that the most important mechanisms of aging involve damage to cellular macro-molecules. Reactive oxygen species (ROS)2, as generated by mitochondria during respiration, induce oxidative stress, which accumulates over life and is considered the proximal mechanism of aging and a major determinant of lifespan (free radical or mitochondrial theory of aging) (7). Indeed, mutations of p66Shc, a gene that increases production of mitochondrial ROS, or overexpression of catalase, which increases their scavenging, prolong lifespan in mice (8, 9). Whether these lifespan determinants (insulin/IGF1 signaling in the fat tissue and oxidative stress) are mechanistically related is unknown.
Recent data showed that one specific ROS molecule, hydrogen peroxide (H2O2), is directly implicated in the physiological regulation of different signal transduction pathways, including the insulin/IGF1 pathway (10). Induction of cell proliferation by insulin or IGF1 as well as several other growth factors (e.g. epidermal growth factor or platelet-derived growth factor) correlates with a transient increase of intracellular H2O2, whereas anti-oxidant treatments prevent insulin/IGF-1-induced DNA synthesis (10, 11). Exogenously added H2O2 leads to functional inactivation of tyrosine and serine/threonine phosphatases and activation of tyrosine kinases and various transcription factors (see the following supplemental references: Ross et al. (2007), Meng et al. (2004), Chiarugi et al. (2005). Finkel et al. (2000), Paravicini et al. (2006)).
The property of H2O2 to function as signaling molecule is based on its ability to induce fully reversible protein modifications. It has been demonstrated that H2O2 oxidizes directly cysteinyl thiol, inducing disulfide bonds and sulfenic acids formation, and induces glutathionylation of cysteine residues or sulfoxidation of methionine residues in a variety of molecular targets (see the following supplemental references: Song et al. (2006), Bossis et al. (2006), Davis et al. (2000), Ahn et al. (2003)). In the case of the PTP1B and PTEN phosphatases, which are directly involved in the attenuation of the insulin/IGF1 signaling, it has been shown that H2O2-induced protein modifications are functionally relevant (12, 13). It appears, therefore, that H2O2 regulates directly the intensity of insulin/IGF1 signaling within cells.
Indirect evidence suggests that ROS are also involved in the regulation of fat development. Treatment with antioxidants prevents in vitro differentiation of pre-adipocytes and, in mice, diet-induced obesity (14). Caloric restriction in laboratory rodents reduces their adipose tissue mass, extends lifespan, and is associated with decreased oxygen metabolism and, consequently, mitochondrial H2O2 production (15, 16). It is not clear, however, whether these effects of H2O2 or antioxidants on fat development are mediated by modifications of the insulin/IGF1 signaling pathway in the adipose tissue.
A role for ROS as signaling molecules is further supported by recent findings that the generation of H2O2 by mitochondria is not just the byproduct of respiration but can also be the result of specific enzymatic systems, such as p66Shc. p66Shc functions as an inducible redox enzyme, which is activated by stress and generates H2O2 to trigger apoptosis (17). For this function, p66Shc uses reducing equivalents of the mitochondrial electron transfer chain through the direct oxidation of cytochrome c (17). The H2O2 generated by p66Shc is ∼30% that of the total pool of intracellular H2O2 and is biologically relevant, as shown by p66Shc ability in vitro and in vivo to induce mitochondrial permeability transition and by the findings that cells and tissues derived from p66Shc-/- mice accumulate significantly less oxidative stress (17-25). It is not known, however, whether p66Shc-generated H2O2 is also involved in the regulation of receptor-activated signal transduction pathways. We report here that p66Shc-generated H2O2 regulates insulin signaling in adipocytes and fat development and propose that the insulin-p66Shc oxidative signaling pathway regulates energetic metabolism.
EXPERIMENTAL PROCEDURES
Reagents—Antibodies against AKT, pAKT, pMAPK, FOXO1, and pFoxo1 were from Cell Signaling; anti-Shc and anti-pShc were from BD Transduction Laboratories and Alexis; anti-PTEN, anti-IRS-1, anti-p85a, and anti-GLUT4 were from Santa Cruz; the anti-phosphotyrosine was from Upstate, and human recombinant insulin was from Roche Applied Science.
Mice—This study was performed according to national law and following authority guidelines. Experiments were carried out on p66Shc-/- and WT mice (Sv/129 and C57Bl/6), maintained in a temperature-controlled room with a 12-h light/12-h dark cycle. A high fat (HF) diet (D12492 with 60% kcal from fat) was purchased from Research Diets Inc. Eight-week-old mice were fed with standard diet or D12492 diet. C57Bl/6 and 129Sv mice were fed HF diet and tap water or water supplemented with 40 mm N-acetylcysteine.
Blood glucose levels were measured using Accu-Chek active; triglycerides, cholesterol, and free fatty acid levels were measured using the Reflotron Plus system from Roche Applied Science. Body weight was measured weekly. Total body fat mass was evaluated after chemical extraction as described (26). Measurements of energy expenditure were made using a closed-circuit dual-gas respirometer (Micro-Oxymax System, Columbus Instruments).
Adipocyte Preparation and Treatments—Primary brown pre-adipocytes were isolated from brown adipose tissue (BAT) of intrascapular fat pads from 2-day-old newborns upon digestion with 1.5 mg/ml collagenase type IV buffer (125 mm NaCl, 5 mm KCl, 1.3 mm CaCl2, 5 mm glucose, 100 mm Hepes, 4% BSA) for 40 min at 37 °C. Cells were then plated in growth media (Dulbecco's modified Eagle's medium supplemented with 20% fetal bovine serum, 20 mm HEPES). The following day cultures were washed twice with phosphate-buffered saline, then after confluence, 2 × 10⁵ cells were plated in 12-well dishes in Dulbecco's modified Eagle's medium plus 10% fetal bovine serum. The day after, media were supplemented with insulin at different dosages as indicated and in the presence of 1 nm T3 (27). Lipids accumulation was evaluated after 6 days. Differentiation for some experiments was induced with 40 ng/ml insulin plus 250 μm α-lipoic acid or 0.1 μm antimycin A or 1 μm dexamethasone and 1 mm isobutylmethylxanthine.
Primary white adipocytes were isolated from abdominal white fat pads from 1-month-old mice. Fat pieces were minced and digested with 1.5 mg/ml collagenase type IV at 37 °C for 35 min. Cells were filtered through 250-μm cell strainer, centrifuged at 250 g, and plated in the same media as for BAT-derived cells. At day 2 upon confluence, cells were stimulated with 1 μg/ml insulin, and lipid accumulation was evaluated after 10 days with Oil red-O staining.
For retroviral infections, pre-adipocytes were infected on day 2 of culture with empty pBABE vectors or vectors expressing WT p66Shc or the p66Shcqq or p66Shca mutants and selected with 2 μg/ml puromycin.
For ROS analysis, levels of intracellular H2O2 were determined using 6-carboxy-2′,7′-dichlorodihydrofluorescein (DCF) diacetate (H2-DCFDA). Briefly, cells were treated with 20 μm H2-DCFDA for 45 min in dark (20). Intracellular DCF fluorescence was detected and quantified by fluorescence-activated cell sorter. Direct fluorescence imaging of attached cells stained with H2-DCFDA was also performed to confirm fluorescence-activated cell sorter analysis data. For siRNA down-regulation of p66Shc expression, pre-adipocytes were transfected with a p66Shc-specific 5′-GTACAACCCACTTCGGAATG (28) and a scrambled nucleotide sequence as a negative control, siRNAs.
Biochemistry and Immunofluorescent Analysis—For insulin stimulation experiments cells were serum-starved for 24 h and then treated with 1 μg/ml insulin for 90 min (for FOXO1 and p66Shc activation) or for 5 min (for AKT activation). For immunofluorescence cells were fixed in paraformaldehyde, permeabilized for 10 min with 0.4% Triton X-100 in phosphate-buffered saline supplemented with 0.2% BSA, blocked for 30 min in 2% BSA, and incubated with primary anti-FOXO antibodies produced in rabbit and then with secondary anti-rabbit IgC conjugated with Cy3. For biochemical analysis, cells were washed and lysed in a buffer containing 50 mm HEPES, pH 7.5, 150 mm NaCl, 10% glycerol, 1% Triton X-100, 1.5 mm MgCl2, 1 mm EGTA, 100 mm NaF, 10 mm sodium pyrophosphate, and 500 μm sodium orthovanadate supplemented with a protease inhibitors mixture from Calbiochem. Immunoprecipitations were performed on a platform rocker at 4 °C. Equal amounts of proteins were incubated with anti-Shc or anti-IRS-1 antibodies and then with 50 μl of protein A-agarose followed by 3 washes with lysis buffer. Beads were resuspended in 2× Laemmli loading buffer, and proteins were separated by 8% SDS-PAGE. After SDS-PAGE, proteins were transferred to a polyvinylidene difluoride membrane. The immunoprecipitates were analyzed by Western blotting using indicated antibodies. All blotting steps were performed according to the manufacturer's instructions. Chemiluminescence was detected with ECL Western blotting detection reagent from Amersham Biosciences.
Fatty Acid Intake and Oxidation Rate in Cell Cultures—To determine FA intake and oxidation rate, isolated BAT adipocytes were grown to confluence, washed with phosphate-buffered saline, 0.5% BSA, incubated at 37 °C for 90 min with 1 μCi/ml [14C]oleate (Amersham Biosciences) in Dulbecco's modified Eagle's medium supplemented with 10% fetal bovine serum and 0.5% BSA, washed twice with phosphate-buffered saline, 0.5% BSA, and lysed in 200 μl of 0.5 n NaOH. After neutralization, radioactivity was counted with a liquid scintillation analyzer and normalized for protein content. Fatty acid β-oxidation rate was assessed by the release of 14CO2 after [14C]oleate uptake as described (29).
Gene Expression Analysis—Primary BAT pre-adipocytes were grown to confluence and incubated with or without 100 nm insulin for 4 h. Cells then were lysed in a guanidine-isothiocyanate containing buffer, and total RNA was extracted using RNeasy kit (Qiagen) following the manufacturers instructions. For each experiment, total RNA was isolated and pooled from triplicate culture dishes and used for microarrays Affymetrix GeneChip hybridization. Biotin-labeled cRNA targets were obtained from 3 μg of total RNA derived from samples as described above. cDNA synthesis was performed with Invitrogen SuperScript Custom cDNA synthesis kit, and biotin-labeled antisense RNA was transcribed using the in vitro MEGAscript High Yield Transcription kit (Ambion Inc., Austin, TX) and included Bio-11-UTP and Bio-11-CTP (PerkinElmer Life Sciences) in the reaction. GeneChip hybridization, washing, staining, and scanning were performed according to Affymetrix (Santa Clara, CA) protocols. A copy of the Mouse Genome 430 2.0 GeneChip Array was hybridized with each target. Absolute and comparative analyses were performed with Affymetrix GeneChip Operating Software (GCOSv1.4), scaling all images to a TGT value of 500. Results were further exported to GeneSpring GX software Version 7.3 (Agilent Technology). For quantitative PCR (QPCR) validation of gene-chip data, total RNA from three independent experiments was reverse-transcribed using Superscript II reverse transcriptase (Invitrogen), and the obtained cDNA was analyzed by quantitative real-time PCR using specific primers for selected genes and Taqman chemistry. Results were expressed as -fold change relative to the controls after normalization using GAPDH gene expression levels.
Bioenergetics—Fresh mitochondria were prepared from mouse BAT using differential centrifugation protocol as described (30). Each mitochondrial preparation (0.5 mg of protein/ml mitochondrial suspension) was assayed (for state 3 determinations, in 100 mm KCl, 50 mm MOPS, 10 mm K2PO4, 10 mm MgCl2, 1 mm EGTA, and 0.2% BSA when indicated, pH 7.20) for respiration using a Clark-type oxygen electrode according to standard procedures in the presence of different energetic substrates (5 mm succinate, 1 mm pyruvate/1 mm malate, 10 mm glycerol 3-phosphate) and modulators (0.1 μm dinitrophenol, 5 μm carbonyl cyanide-p-trifluoromethoxyphenylhydrazone, 0.4 mm ADP, 0.4 mm GDP, 5 mm palmitate), which were added to glycerol 3-phosphate-energized mitochondria. Mitochondrial transmembrane potential was measured according to the procedure described (31).
Statistical Analysis—Data are presented as the mean ± S.D. and analyzed by Student's t test. Differences between means were assessed by one-way analysis of variance. The minimum level of significance was set at p < 0.05.
RESULTS
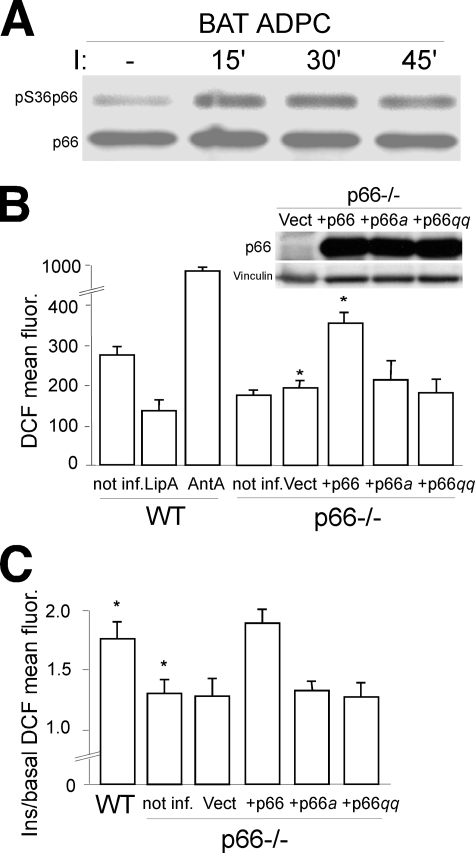
Insulin Activates the Redox Activity of p66Shc in Adipocytes—p66Shc is expressed in primary adipocytes (32) and supplemental Fig. 1A) where it is rapidly phosphorylated on Ser-36 after insulin treatment (Fig. 1A). After phosphorylation in the cytosol, p66Shc binds to the peptidyl-prolyl isomerase Pin-1 and undergoes a major conformational change that favors translocation of p66Shc within mitochondria and activation of its redox enzymatic activity (33).
FIGURE 1.
p66Shc redox activity in adipocyte. A, p66Shc Ser-36 phosphorylation before and after insulin treatment (at the indicated time points) of BAT adipocytes (ADPC). Anti-Shc immunoprecipitates were analyzed by WB using antibodies against phosphorylated (upper panel) or total (lower panel) p66Shc. B, fluorescence-activated cell sorter analysis of the mean DCF fluorescence of DCFDA-stained WT BAT adipocytes under basal conditions (not inf.) or after lipoic acid (LipA) or antimycin A (AntA) treatment, and p66Shc-/- BAT adipocytes under basal conditions (not inf.) or after infection with empty retroviral vector (Vect), or retroviral vectors expressing p66Shc, p66Shca, or p66Shcqq whose expression levels, as detected by WB in one representative experiment, are shown in the pictures on the right. C, insulin induced increase of DCF mean fluorescence (ratio between the mean fluorescence of insulin stimulated and untreated cells) in WT BAT adipocytes and p66Shc-/- BAT adipocytes under basal conditions (not inf.) or after infection with empty retroviral vector (Vect), or retroviral vectors expressing p66Shc, p66Shca, or p66Shcqq.
Phosphorylation-defective mutants of p66Shc are unable to maintain proper levels of intracellular H2O2 and to mediate pro-apoptotic stress signals (17, 33). We investigated whether insulin treatment induces H2O2 accumulation in BAT primary pre-adipocytes, as reported for other cell types (34) and whether this effect is mediated by phosphorylation of p66Shc. Intracellular levels of H2O2 were determined by fluorescence-activated cell sorter analysis of cells stained with H2-DCFDA, a molecular probe that becomes fluorescent upon oxidation by H2O2. Steady-state levels of H2O2 in p66Shc-/- adipocytes were reduced by ∼35% as compared with control WT cells (Fig. 1B). Insulin treatment induced a 2-3-fold increase of H2O2 in WT BAT pre-adipocytes, whereas it had no effect on p66Shc-/- cells (Fig. 1C). Reintroduction of p66Shc but not of the phosphorylation-defective p66Shc Ser36Ala (p66Shca) mutant into p66Shc-/- pre-adipocytes restored insulin-induced H2O2 up-regulation (Fig. 1C), demonstrating that p66Shc phosphorylation is critical to the ability of insulin to increase intracellular H2O2. To demonstrate that p66Shc mediates insulin-dependent H2O2 up-regulation through its redox activity, we used the redox-defective mutant p66ShcE132Q,E133Q (p66Shcqq), which is unable to oxidize cytochrome c and to produce mitochondrial ROS (17). Expression of the p66Shcqq mutant in p66Shc-/- BAT pre-adipocytes failed to mediate H2O2 up-regulation after insulin stimulation (Fig. 1C). Together, these findings demonstrate that insulin activates the redox activity of p66Shc and that p66Shc mediates insulin redox signaling.
p66Shc-generated H2O2 Regulates Insulin-dependent Activation of AKT-FOXO1 in Adipocytes—Insulin-stimulated H2O2 modulates proximal and distal insulin signaling at least in part through the oxidative inhibition of phosphatases that negatively regulate the insulin pathway (PP2A, PTEN) (35).
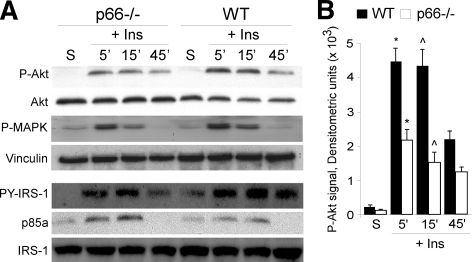
Tyrosine phosphorylation of IRS-1, the intracellular target of activated insulin-receptor, did not differ significantly in the WT and p66Shc-/- samples (Fig. 2A; the slight decrease of IRS-1 phosphorylation at later time points after insulin treatment was not seen in other separated experiments). Once phosphorylated, IRS-1 binds various adapter molecules, such as p85 and Grb-2, which activate, respectively, the phosphatidylinositol 3-kinase-AKT and the Ras-MAPK pathways (36). Analysis of the association of IRS-1 with the p85 subunit of phosphatidylinositol 3-kinase in WT and p66Shc-/- BAT pre-adipocytes revealed no differences (Fig. 2A). On the contrary, in the p66Shc-/- pre-adipocytes, the extent of insulin-induced AKT phosphorylation was markedly reduced as compared with WT adipocytes, whereas MAPK phosphorylation proceeded normally (Fig. 2, A and B), indicating that loss of p66Shc affects the phosphatidylinositol 3-kinase-AKT branch in particular.
FIGURE 2.
p66Shc regulation of Akt phosphorylation. A, WT
and p66Shc-/- BAT adipocytes were starved (S) or treated
with insulin (Ins) and analyzed at the indicated time points. Top
four panels: WB of total (Akt) and phosphorylated
(P-Akt) AKT, phosphorylated MAPK (P-MAPK), and vinculin.
Bottom three panels: WB of anti-IRS1 immunoprecipitates using
antibodies against IRS-1, pY-IRS-1, and p85a. B, densitometric
analysis of P-Akt signals; the phospho-Akt signal was normalized against
total-Akt signal (average values from three independent experiments:
* and  ,
p < 0.01).
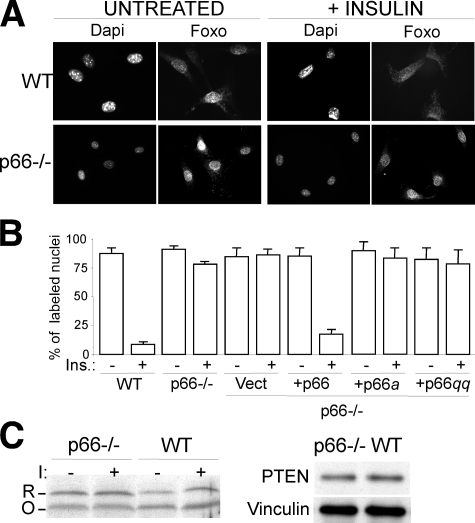
Among the several targets of activated AKT, the Forkhead transcription factor FOXO1 couples insulin signaling to adipocyte differentiation (37). AKT-dependent FOXO1 phosphorylation leads to its cytoplasmic sequestration and inhibition of transcription from FOXO1-target genes (37). Immunofluorescence analysis of WT BAT pre-adipocytes showed massive re-localization of FOXO1 in the cytoplasm after insulin treatment (from 80 to 5% of cells with nuclear FOXO-1), which was markedly reduced in p66Shc-/- cultures (from 80 to 75%) (Fig. 3, A and B). It appears, therefore, that p66Shc expression is indispensable for the activation of the AKT-FOXO1 pathway after insulin treatment. Notably, the effect of p66Shc on FOXO1 appeared more pronounced than the effect on AKT, suggesting that p66Shc regulates insulin signaling at multiple levels.
FIGURE 3.
p66Shc regulation of insulin-induced Foxo re-localization. A, 4,6-diamidino-2-phenylindole (Dapi) staining of nuclei and immunofluorescence analysis of Foxo1 localization in untreated and insulin-treated WT and p66Shc-/- BAT adipocytes. Images are representative of four experiments which gave comparable results. B, percentage of untreated and insulin-treated BAT adipocytes with Foxo1 nuclear localization (results from three experiments). C, Western blot analysis using non-reducing PAGE (left panel) of reduced (R) versus oxidized (O) forms of PTEN in WT and p66Shc-/- BAT adipocytes before (-) and after (+) insulin (I) treatment and using standard reducing SDS-PAGE (right panel) of total PTEN in WT and p66Shc-/- BAT adipocytes. Images are representative of four experiments which gave comparable results.
To determine whether the effect of p66Shc on insulin-mediated AKT-FOXO1 activation was dependent on its redox activity, we analyzed the signaling functions of phosphorylation- and redox-defective p66Shc mutants and the effect of p66Shc on oxidation of PTEN, which dephosphorylates and inactivates PIP3, a lipid second messenger produced by phosphatidylinositol 3-kinase (35). Re-expression of WT p66Shc into p66Shc-/- BAT pre-adipocytes restored a normal response of FOXO1 to insulin treatment (from 70 to 5% cells with nuclear FOXO-1), whereas the p66Shca or p66Shcqq mutants had no effects (Fig. 3B and supplemental Fig. 1B). PTEN is inactivated by endogenous H2O2 that catalyzes the formation of a disulfide bond between the PTEN active sites Cys-124 and Cys-71. This event correlates with a shift in its electrophoretic mobility in non-reducing PAGE (12). In p66Shc-/- pre-adipocytes, the ratio between reduced PTEN (the slowly migrating form) and oxidized PTEN (the fast migrating form) was increased with respect to the same ratio observed in WT pre-adipocytes both in basal conditions (100% of increase) and after insulin treatment (30% of increase) (Fig. 3C, left panel), whereas total PTEN levels, measured by Western blotting (WB) upon reducing SDS-PAGE, was comparable between WT and p66Shc-/- pre-adipocytes (Fig. 3C, right panel). It appears, therefore, that the ability of p66Shc to regulate FOXO1 activation depends on the integrity of its redox center, suggesting that p66Shc regulates insulin signaling by generating H2O2.
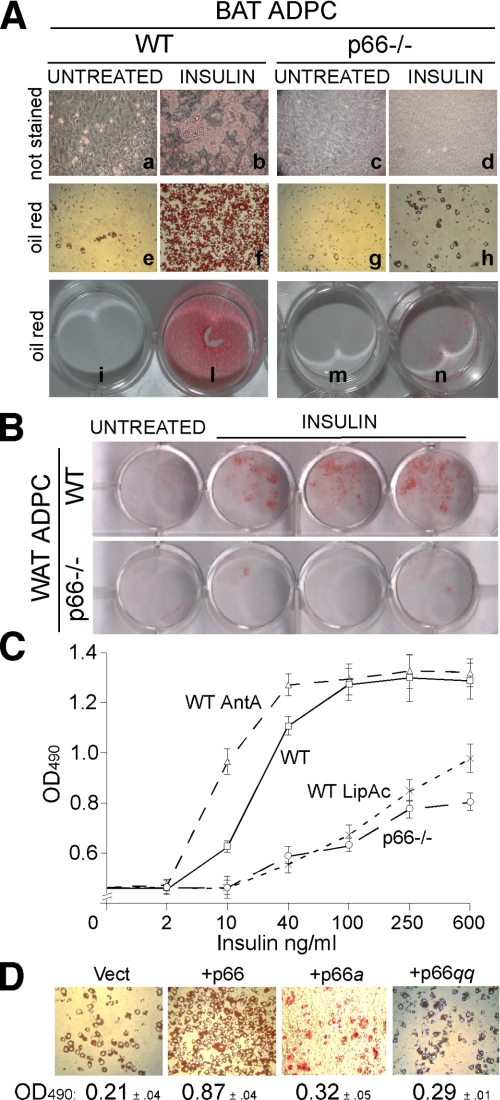
p66Shc Regulates Lipogenesis in Adipocytes by Inhibiting Fatty Acid Oxidation—We then investigated the biological contribution of p66Shc to lypogenesis in adipocytes. Because intracellular ROS are critical mediators of insulin-dependent lipogenesis (38), we measured insulin-induced triglyceride (TG) accumulation in WT and p66Shc-/- adipocytes. Treatment of WT BAT (Fig. 4A) and white adipose tissue (WAT) (Fig. 4B)-derived pre-adipocytes with 40 mg/ml or 1 μg/ml of insulin, respectively, in the presence of 1 nm triiodothyronine (T3) induced TG accumulation in virtually all cells, as seen by Oil red staining 6 and 10 days after treatment (Fig. 4, A and B). Strikingly, p66Shc-/- adipocytes from both BAT and WAT were almost completely Oil red-negative after the same insulin treatment (Fig. 4, A and B). Dose-response analysis of insulin-induced TG accumulation in BAT adipocytes revealed a reduction of insulin sensitivity in the absence of p66Shc expression of about 30-fold (the half-maximal differentiating doses of insulin were 10-20 and 600 ng/ml in WT and p66Shc-/- adipocytes, respectively; Fig. 4C). Notably, the effect of p66Shc loss was comparable with that of antioxidants, such as lipoic acid (Figs. 1B and 4C) or N-acetylcysteine (not shown). Conversely, levels of ROS and insulin-induced lipid accumulation were increased by antimycin A, an inhibitor of respiration that increases mitochondrial ROS generation (Figs. 1B and 4C). Re-expression of p66Shc, but not of the p66Shca or p66Shcqq mutants, in p66Shc-/- BAT pre-adipocytes restored insulin-induced TG accumulation (Fig. 4D). Adipocyte differentiation by other stimuli (3-isobutyl-1-methylxanthine and dexamethasone (supplemental Fig. 1C) proceeded normally in the p66Shc-/- BAT pre-adipocytes, suggesting that the effect of p66Shc is specific for insulin-induced lipogenesis.
FIGURE 4.
p66Shc regulation of insulin-induced triglyceride accumulation. A, white light microscopy pictures (a-h) and plate micrographs (i-n) of unstained (a-d) and Oil red-stained (e-h, i-n) BAT adipocytes (ADPC) from WT and p66Shc-/- mice. Cells were left untreated (a, e, c, g, i, and m) or treated with insulin for 6 days (b, f, d, h, l, and n). B, micrographs of plates of Oil red-stained WT and p66Shc-/- WAT adipocytes (ADPC) untreated and after insulin treatment. C, optical density (OD) values of Oil red extracts from stained WT, antimycin A (AntA)-, or lipoic acid (LipAc)-treated WT and p66Shc-/- BAT adipocytes (average of eight independent experiments for each condition). D, white light microscopy pictures of Oil red-stained p66Shc-/- BAT adipocytes infected with empty (Vect), p66Shc, p66Shca, or p66Shcqq retroviruses and treated with insulin and their corresponding optical density (OD; 490 nm) values.
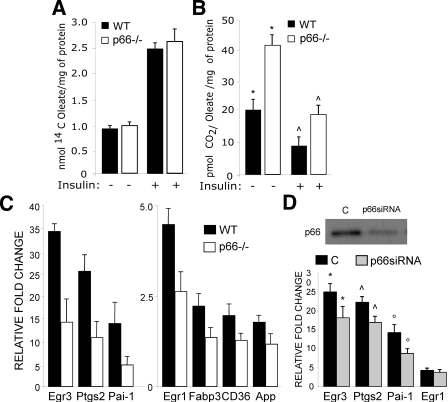
In adipocytes, TG accumulation stimulated by insulin is determined by increased uptake of FA or glucose and inhibition of FA oxidation. To investigate FA metabolism, we measured 14C incorporation (FA uptake) and 14CO2 release (FA β-oxidation) in cells preincubated with [14C]oleate. Although the rate of [14C]oleate uptake was similar in basal and insulin-treated WT and p66Shc-/- BAT pre-adipocytes (Fig. 5A), the release of 14CO2 was higher in p66Shc-/- cells both at the steady state and after insulin treatment (Fig. 5B). Together, these results indicate that p66Shc controls the lipogenic function of insulin in adipocytes by inhibiting FA oxidation.
FIGURE 5.
p66Shc regulation of energetic substrate consumption and
insulin-dependent gene expression in adipocytes. A and
B, cells were labeled with [14C]oleate, left untreated, or
treated with insulin as indicated. FA uptake and release were measured as
14C incorporation (A) and 14CO2
release (B). C, quantitative RT-PCR analysis of transcripts
from the indicated genes in WT and p66Shc-/- adipocytes untreated
or treated with insulin as indicated. Results are shown as ratio of values
from insulin treated versus untreated samples. D, QPCR
analysis of transcripts from the indicated genes in WT adipocytes treated
(p66Shc-siRNA) or not (C) with siRNA oligos for
p66Shc (resulting p66Shc levels are shown in the
upper panel). Results from three QPCR measurements, each performed on
two different siRNA experiments, were reported. *,
 , and °, p <
0.05.
To investigate whether p66Shc regulates selectively downstream adipogenic effectors of the insulin signaling pathway, we performed global gene expression analysis of WT and p66Shc-/- BAT pre-adipocytes treated or not with insulin (4 h). Biotinylated cRNA targets were synthesized from RNA pools of three independent experiments and hybridized to Affymetrix oligonucleotide chips. Analysis of microarray data identified two overlapping lists of 598 and 610 genes regulated by insulin in WT and p66Shc-/- pre-adipocytes, respectively (supplemental Fig. 2).
QPCR validation of 30 gene regulations revealed full concordance (not shown). Cross-comparisons of WT and p66Shc-/- gene sets distinguished three groups of insulin targets; (i) 282 genes regulated by insulin in both WT and p66Shc-/- pre-adipocytes (p66Shc-independent insulin targets); (ii) 316 genes regulated by insulin in WT but not p66Shc-/- pre-adipocytes (p66Shc-dependent targets), and (iii) 328 genes regulated by insulin in p66Shc-/- but not WT pre-adipocytes (p66Shc-repressed insulin targets) (supplemental Fig. 2). Among the 282 p66Shc-independent insulin targets, several genes linked to adipogenesis have been found, some of which are mechanistically implicated in the process of adipogenesis. Notably, the impaired response to insulin in p66Shc -/- BAT pre-adipocytes is accompanied by a lower induction of these adipogenesis-linked genes (Egr1, Egr3, Ptgs2, Pai-1, Fabp3, CD36, App; Fig. 5C and supplementary references). QPCR validation of these targets in p66Shc-/- or in WT BAT pre-adipocytes after depletion of p66Shc expression by siRNA is shown in Fig. 5D. This correlates with the observation that insulin response is impaired in p66Shc-deficient BAT pre-adipocytes, although we can not draw any conclusion regarding the contribution of the genes considered to the observed phenotype. Expression of peroxisome proliferator-activated receptor-α, ERRα, PGC1, which are critical regulators of adipocyte differentiation, was instead normal in p66Shc-/- cells (not shown). Together, these data indicate that the effect of p66Shc on insulin-dependent gene expression is restricted to specific transcriptional targets, which might explain selectivity of the effect of p66Shc on lipid accumulation.
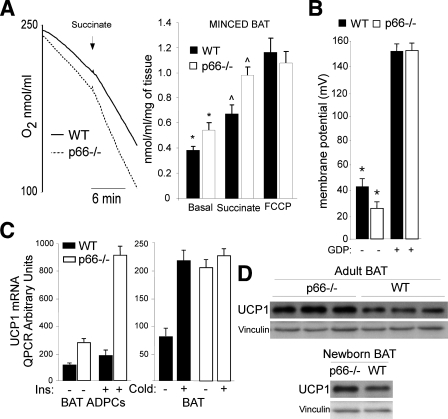
p66Shc Improves Mitochondrial Coupling in Adipocytes—We then investigated mitochondrial energetic functions in WT and p66Shc-/- BAT mitochondria and tissue. Oxygraph analysis of energized mitochondria (using either pyruvate/malate or glycerol 3-phosphate) and in the presence of fatty acid-free albumin (to sequester free fatty-acids) revealed similar levels of oxygen consumption in the WT and p66Shc-/- BAT mitochondria (Table 1). In the absence of albumin, instead, p66Shc-/- mitochondria showed higher levels of oxygen consumption (Table 1). Consistently, the addition of palmitate increased respiration more potently in the p66Shc-/- mitochondria (Table 1), suggesting that respiration is higher in the p66Shc-/- mitochondria when fatty acids are available. Because fatty acids stimulate proton backflow to the mitochondrial matrix (uncoupled respiration), we treated BAT mitochondria with the artificial protonophores dinitrophenol or FCCP. Strikingly, dinitrophenol (not shown) or FCCP (Fig. 6A) increased respiration of WT but not p66Shc-/- mitochondria (Table 1), suggesting that p66Shc-/- mitochondria are uncoupled. Treatment with the inhibitor of uncoupling proteins GDP, instead, reduced respiration of WT and p66Shc -/- BAT mitochondria to equal levels (Table 1). As seen for the isolated BAT mitochondria, minced BAT from p66Shc-/- mice showed increased respiration upon the addition of succinate (p < 0.01), which was not further enhanced by treatment with FCCP. Notably, also basal respiration was higher in p66Shc-/- BAT (Fig. 6A).
TABLE 1.
Respiratory analysis of WT and p66Shc−/− BAT isolated mitochondria
The average values and S.D. of three independent experiments are indicated.
|
Isolated MTC
|
|||||
|---|---|---|---|---|---|
|
+Fat free BSA
|
w/o fat free BSA
|
||||
| WT | p66−/− | WT | p66−/− | ||
| nmol/ml/mg of protein | |||||
| Basal | 11.76 ± 2.43 | 9.14 ± 3.55 | 6.95 ± 1.86 | 6.14 ± 0.40 | |
| Pyruvate/malate | 36.12 ± 5.24 | 35.10 ± 6.78 | 52.68 ± 6.13a | 64.24 ± 5.37a | |
| Glycerol 3-phosphate | 50.61 ± 5.94 | 46.82 ± 5.30 | 70.32 ± 4.51b | 96.15 ± 7.16b | |
| GDP | 35.23 ± 6.36 | 36.51 ± 6.27 | 39.71 ± 5.18 | 42.07 ± 4.23 | |
| FCCP | 102.34 ± 8.12 | 113.45 ± 9.26 | 108.22 ± 9.41 | 104.26 ± 8.51 | |
| Palmitate | 79.24 ± 8.19b | 102.11 ± 9.03b | |||
| ADP | 94.56 ± 8.22 | 110.07 ± 7.48 | |||
p < 0.05.
p < 0.01.
FIGURE 6.
Energetic metabolism of WT and
p66Shc-/-
adipocytes. A, representative oxygraph analysis (left
panel) of WT and p66Shc-/--minced BAT tissue. The
graph on the right reports the results from three
independent experiments. * and
 , p < 0.01.
B, protonmotive force of WT and p66Shc-/- BAT
mitochondria. Results from three independent experiments are reported.
*, p < 0.05. C, quantitative RT-PCR analysis
of UCP1 gene expression in WT and p66Shc-/- adipocytes (BAT ADPCs)
(untreated or after insulin treatment; left panel) and BAT, basal,
and cold exposure (right panel). D, Western blotting
analysis of UCP1 protein expression in BAT from adults and newborn WT and
p66Shc-/- mice.
To characterize directly coupling efficiency, we measured the protonmotive force of WT and p66Shc-/- BAT mitochondria using the potentiometric tetramethylrhodamine methyl ester (TMRM). Results showed a slight, yet statistically significant, reduction of the membrane potential of p66Shc-/- energized mitochondria (Fig. 6B). Treatment with GDP abolished this difference, further supporting our conclusion that p66Shc-/- mitochondria are uncoupled. Together, these findings suggest that the increased oxygen consumption of p66Shc-/- mitochondria is attributable to increased uncoupled state.
Uncoupled respiration in BAT mitochondria is due to expression of the anion-carrier protein UCP1, which mediates a regulated proton-leak across the mitochondrial membranes (39). Inspection of our microarray data showed that UCP1 is up-regulated in p66Shc-/- adipocytes. QPCR analysis confirmed the increased expression of UCP1 mRNA in the p66Shc-/- adipocytes both under basal conditions and after insulin treatment (Fig. 6C). Western blotting showed increased levels of the UCP1 protein in BAT adipose tissue of newborn and adult p66Shc-/- mice as compared with WT controls (Fig. 6D). These data indicate that p66Shc inhibits basal and insulin-induced UCP1 expression in adipocytes. Thus, high levels of UCP1 might be responsible for the observed uncoupling state of mitochondria in p66Shc-/- adipocytes.
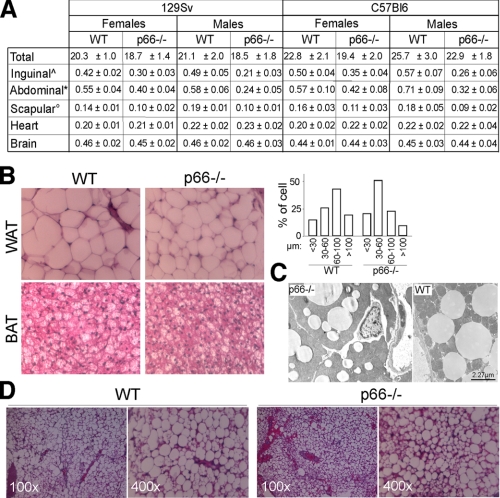
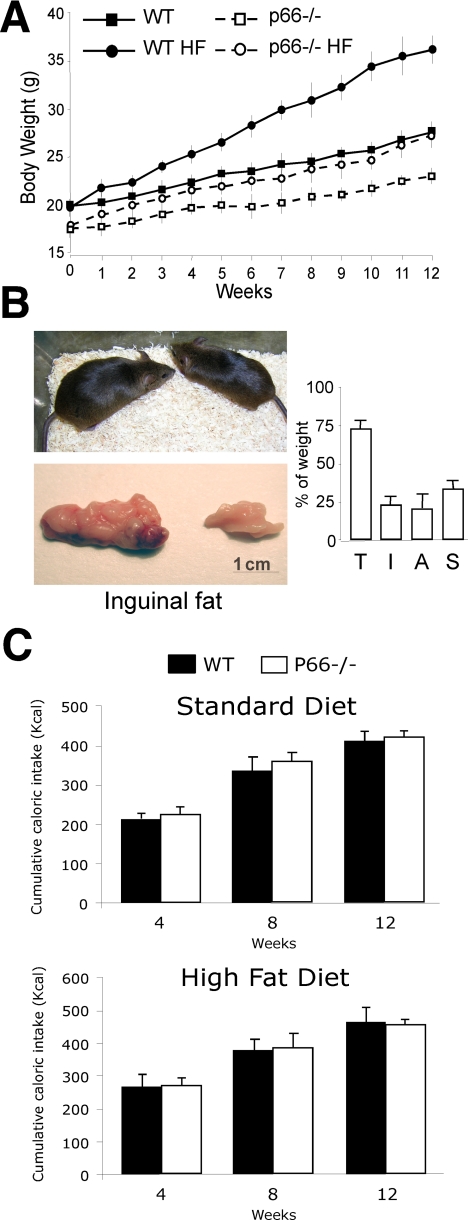
p66Shc Induces Fat Development in Vivo—We then investigated the effect of p66Shc on fat accumulation in vivo. The body weight of p66Shc-/- mice was normal from birth to 4 weeks of age (not shown). Starting at 2 months of age, p66Shc-/- mice maintained 5-10% lower body weights throughout the rest of their lives as compared with WT mice (Fig. 7A) despite normal locomotory activity,3 food intake (Fig. 8C), and overall caloric absorption (as determined by measuring the residual caloric content of feces by calorimetric bomb; not shown). Differences of total body weight between WT and p66Shc-/- mice were mainly due to a ∼35% reduction in fat mass in the p66Shc-/- mice (total-body TG content; not shown). Perigonadal, abdominal, and interscapular fat pads were all reduced in p66Shc-/- mice (Fig. 7A). Differences were more marked in the abdominal district (75% reduction in the p66Shc-/- males) and were observed in both 129Sv and C57Bl6 p66Shc-/- strains (Fig. 7A). No differences between WT and p66Shc-/- mice were observed in the weight of other organs (Fig. 7A).
FIGURE 7.
p66Shc regulation of fat accumulation in vivo.
A, total body (T), fat pad (inguinal, abdominal, and
scapular), heart (H), and brain (B) weight in 129Sv or
C57Bl6 p66Shc-/- mice (±S.D.; n = 20 per group;
 , *, and °
indicates p < 0.01 in the comparison of all WT versus
p66-/- groups in the row). B,
hematoxylin/eosin-staining of WAT and BAT from 8-month-old male mice (left
panel) and cell size distribution from the same samples (right
panel). Data represent the result of the analysis of 10 different mice
per group. C, electron microscopy of WT and p66Shc BAT.
D, hematoxylin/eosin-staining of WT and p66Shc-/- BAT
adipocytes transplants.
FIGURE 8.
p66Shc-/- prevention of obesity. A, body weight curves of WT and p66Shc-/- male mice fed standard or HF diets. B, comparative view of representative p66Shc-/- and WT mice and inguinal fat pads from the same experiment. Total body (T) and fat pads (I, inguinal; A, abdominal; S, intrascapular) weight upon HF diet, expressed as in A (right panel). C, cumulative caloric intake of WT and p66Shc-/- mice at different time points during supplementation with standard (upper graph) and high fat (lower graph) diets.
Histological analysis of the same samples showed high cell size heterogeneity, with a larger frequency of adipocytes below 100 μm diameter (Fig. 7B). Although the functional significance of this heterogeneity in p66Shc-/- adipose tissue is unclear, it resembles that observed in mice with a null mutation in the insulin receptor gene (FIRKO), which also show reduced fat mass and increased lifespan (5). Electron microscopy examination of BAT (interscapular) in adult p66Shc-/- mice revealed smaller sized lipid deposits in the p66Shc-/- BAT (Fig. 7C).
To test whether decreased fat mass in p66Shc-/- mice was due to a cell-autonomous defect of adipocytes, we transplanted WT and p66Shc-/- primary BAT pre-adipocytes into WT nude mice. One month post-transplant, WT adipocytes transplants showed a dramatic increase in size and a decrease in cell heterogeneity, whereas p66Shc-/- adipocyte transplants grew significantly less, and the cell population remained heterogeneous (Fig. 7D and not shown), thus suggesting that reduced fat accumulation in p66Shc-/- mice is the consequence at least in part of an abnormal intrinsic function of adipocytes.
Diet-induced obesity is mediated by insulin-induced lipid accumulation in the fat tissue (5). To determine the role of p66Shc in diet-induced obesity, we studied body weight and fat mass in WT and p66Shc-/- mice fed HF diet for 14 weeks. The profile of circulating lipids after administration of the high fat diet was similar in WT and p66Shc-/- mice (supplemental Fig. 3A). As shown in Fig. 8A, WT mice gained significantly more body weight than the p66Shc-/- mice (144 versus 119% maximal body weight increase, respectively; p < 0.001). Notably, the effects of the HF diet on p66Shc-/- mice body weight were comparable with those observed in WT mice supplemented with the anti-oxidant N-acetylcysteine in drinking water (supplemental Fig. 3B and (40). Gross appearance at sacrifice after 14 weeks of HF diet revealed markedly reduced fat mass in the p66Shc-/- mice as compared with WT animals (Fig. 8B). Energetic intake (Fig. 8C) and residual fecal caloric content (not shown) were comparable in the two groups. Together these findings demonstrate that p66Shc-/- mice are protected from age-related and diet-induced obesity and suggest that p66Shc is a genetic determinant of fat development in adult mice.
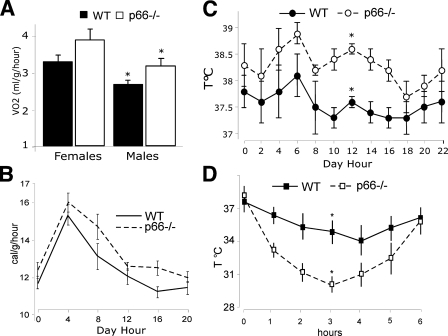
Increased Basal Metabolic Rate and Impaired Cold Adaptation in the p66Shc-/- Mice—We then investigated the functional consequences on energy metabolism of the reduced WAT and BAT in p66Shc-/- mice. WAT is the site where energy is stored after feeding in the form of TG and from where energy is released during periods of fasting in the form of FA. Plasma concentrations of TG, FA, cholesterol, and low density lipoproteins were comparable in WT and p66Shc-/- animals (measured in both the fed and fasted states in age-matched animals of 3, 6, 9, 12, and 18 months; supplemental Fig. 3A). Oxygen consumption normalized per body weight was slightly, yet significantly increased in p66Shc-/- males as compared with matched controls (differences did not reach statistical significance in the female animals; Fig. 9A). Consistently, energetic expenditure measured in a 24-h interval was moderately higher in the p66Shc-/- male mice (Fig. 9B).
FIGURE 9.
Function of the fat tissue in WT and p66Shc-/- mice. A, O2 consumption over 24 h of WT and p66Shc-/- mice (n = 8 per group); *, p < 0.01. B, daily energy expenditure of male WT and p66Shc-/- male mice (n = 8 per group); *, p < 0.01. Shown is the daily body temperature values of WT and p66Shc-/- mice (C) and during cold exposure (D) (n = 12 per group); *, p < 0.01.
WAT has the additional function of protecting from body heat loss (thermo-insulation), whereas BAT generates heat for the maintenance of body temperature when newborn animals are exposed to cold (thermogenesis). The effects of p66Shc loss on thermoregulation were studied by exposing WT and p66Shc-/- mice to cold (5 °C) for 6 h. Basal body temperature was slightly increased in the p66Shc-/- mice (average of 0.6 °C; Fig. 9C). The maximal loss of body heat after cold exposure occurred after 4 h in the WT mice and was in the range of 3 °C of body temperature. In the p66Shc-/- mice, instead, maximal loss was around 6 °C and occurred after 3 h (Fig. 9D). Notably, both WT and p66Shc-/- mice returned to their basal body temperature after 6 h, suggesting that thermogenesis is not impaired in p66Shc-/- mice (Fig. 9D). Thus, abnormal cold adaptation in the p66Shc-/- mice is the consequence of accelerated heat loss, likely due to the reduced thermal insulation effect of fat pads. Notably, levels of UCP1 in p66Shc-/- mice kept at 22 °C were as high as those of WT mice after cold exposure (Fig. 6C, right panel). All together, these findings suggest that the functional alterations observed in the p66Shc-/- adipocytes translate into critical modifications of the energetic metabolism in p66Shc-/- mice, e.g. increased basal body temperature and increased energy expenditure, due to increased BAT metabolism, and accelerated heat loss, due to reduced WAT mass.
DISCUSSION
ROS are implicated in the physiological regulation of the insulin/IGF1 signal-transduction pathway and in the regulation of fat development (10, 11, 14). It is not known, however, whether regulation of fat development by ROS occurs through a direct effect on the insulin/IGF1signaling pathway in the adipose tissue. We reported here that insulin activates the redox enzyme-activity of p66Shc in adipocytes and that p66Shc-generated H2O2, through its effect on the insulin-signaling cascade, reduces mitochondrial oxygen consumption and favors TG accumulation. In vivo, mice lacking p66Shc showed increased basal metabolism, reduced fat development, and increased insulin sensitivity of peripheral tissues. We propose that this newly identified insulin-p66Shc-H2O2 signaling pathway is a critical determinant of energetic metabolism in mammals.
Our findings demonstrate that p66Shc is a downstream target of the insulin signaling pathway and a critical mediator of insulin-dependent ROS-up-regulation in adipocytes. Furthermore, we showed that phosphorylation- and redox-defective mutants of p66Shc are unable to restore redox signaling by insulin, demonstrating that p66Shc phosphorylation and p66Shc redox activity are both integral to insulin signaling. Based on previous characterization of these two mutants (17), we propose a model whereby insulin stimulation induces phosphorylation of p66Shc in the cytosol, its translocation into the mitochondrial intermembrane space, activation of its redox enzymatic activity, and generation of H2O2 (supplemental Fig. 4).
p66Shc-generated H2O2 appears to regulate insulin signaling selectively and at multiple levels. In p66Shc-/- adipocytes, activation of AKT by insulin is attenuated, whereas MAPK activation is normal. Selective activation of AKT by p66Shc might be due to a direct effect of p66Shc-generated H2O2 on phosphatases that regulate phosphatidylinositol 3-kinase, such as PTEN (35). In this respect we noticed that the effect of p66Shc is much more marked on FOXO, a critical transcription factor downstream of AKT (37), than on AKT itself and that the effect of p66Shc on insulin-dependent gene expression is markedly selective. Some of the gene regulations induced by insulin in WT adipocytes were maintained in the absence of p66Shc; others were attenuated or lost, and “new” transcriptional effects of insulin became evident. Thus, the selective effects of p66Shc on the cellular responses to insulin might be achieved through multiple redox-dependent mechanisms that selectively regulate insulin signaling, including AKT phosphorylation, Foxo1 localization, and selected insulin target genes.
Regulation of insulin signaling by p66Shc results into critical modifications of energy metabolism in adipocytes. By studying the effect of p66Shc deletion in BAT adipocytes, we discovered two functions of p66Shc; they are inhibition of insulin-induced FA oxidation and inhibition of basal and insulin-induced UCP1 expression. These activities of p66Shc led, respectively, to increased TG accumulation in WAT and BAT adipocytes and reduced oxygen consumption in BAT adipocytes, thus contributing to switch the energetic balance of adipocytes toward energy conservation.
One implication of these findings is that p66Shc functions to connect mitochondrial respiration to insulin signaling. Because the mitochondrial electron transfer chain is the source of reducing equivalents for the generation of H2O2 by p66Shc, accumulation of energetic substrates in mitochondria is critical for the redox activity of p66Shc. On the other hand, p66Shc-generated H2O2 sets the threshold of cellular sensitivity to specific insulin effects, including inhibition of mitochondrial FA consumption and increase of TG accumulation. In this model p66Shc functions as a specific signal transducer that integrates in adipocytes insulin signaling and the mitochondrial energetic state (supplemental Fig. 4). Notably, the consequences of p66Shc-generated redox signals are not equivalent to generic oxidative damage. In fact, ROS are expected to increase lipid peroxidation in mitochondria and, accordingly, decrease mitochondrial coupling (41). p66Shc, instead, generates specifically H2O2 but has no effect on other oxygen radicals such as O2. p66Shc-generated H2O2 has marginal effects on mitochondrial lipid peroxidation (not shown) and, on the contrary, signals to increase mitochondrial coupling.
The signaling activity of p66Shc in adipocytes has important in vivo consequences. We demonstrated that p66Shc-/- mice have reduced body weight due to reduced mass of both WAT and BAT. In addition, p66Shc-/- mice are protected from diet-induced obesity, suggesting that p66Shc is a genetic determinant of fat development in adult mice. Leanness of the p66Shc-/- mice is not explained by changes in food intake, intestinal absorption of nutrients, or locomotor activity. Rather, it may reflect defective lipogenesis in adipocytes, as suggested by the reduced lipid accumulation of p66Shc-/- adipocytes transplanted into WT recipient mice. This interpretation of the mechanisms leading to decreased fat mass in the p66Shc-/- mice, however, poses the question of how the energy balance is maintained in the absence of p66Shc and why energy storage is reduced. Notably, p66Shc-/- mice showed increased basal body temperature and increased basal metabolic rate, suggesting that the increased uncoupled respiration in the BAT mitochondria of p66Shc-/- mice leads to increased energy expenditure, thus contributing to resistance to body weight gain.
The findings of reduced adiposity in p66Shc-/- mice might have important implications for the effect of p66Shc on lifespan. In conclusion, our findings demonstrate that p66Shc-generated oxidative signal directly regulates the threshold of sensitivity to insulin in adipocytes and the development of fat tissue in vivo, suggesting that regulated generation of H2O2 has evolved to control energy conservation. Attenuation of p66Shc or insulin signaling in the fat tissue, as by genetic mutations, reduces adiposity and increases lifespan, posing the question of why the threshold of insulin sensitivity is apparently “so low” in the fat tissue under physiological conditions. One could hypothesize that the physiological size of the fat tissue is set to serve other functions, which are evolutionarily more critical than longevity. Adaptation to cold, which is altered in the lean p66Shc-/- mice, could be one of such functions or, alternatively, optimization of energy storage when food is available.
Supplementary Material
Acknowledgments
We thank Elena Beltrami, Lucilla Titta, and Carlo Tacchetti for many helpful discussions and experimental advices.
This work was supported, in whole or in part, by National Institutes of Health Grant 1P01AG025532-01A1. This work was also supported by grants from Associazione Italiana per la Ricerca sul Cancro. The costs of publication of this article were defrayed in part by the payment of page charges. This article must therefore be hereby marked “advertisement” in accordance with 18 U.S.C. Section 1734 solely to indicate this fact.
The on-line version of this article (available at http://www.jbc.org) contains supplemental references and Figs. 1-4.
Footnotes
The abbreviations used are: ROS, reactive oxygen species; MAPK, mitogen-activated protein; BSA, bovine serum albumin; HF, high fat; BAT, brown adipose tissue; FA, fatty acid; H2-DCFDA, 6-carboxy-2′,7′-dichlorodihydrofluorescein (DCF) diacetate; WB, Western blotting; FCCP, carbonyl cyanide-p-trifluoromethoxyphenylhydrazone; WT, wild type; siRNA, small interfering RNA; QPCR, quantitative PCR; MOPS, 4-morpholinepropanesulfonic acid; TG, triglyceride; WAT, white adipose tissue.
A. Berry and F. Cirulli, manuscript in preparation.
References
- 1.Clancy, D. J., Gems, D., Harshman, L. G., Oldham, S., Stocker, H., Hafen, E., Leevers, S. J., and Partridge, L. (2001) Science 292 104-106 [DOI] [PubMed] [Google Scholar]
- 2.Giannakou, M. E., Goss, M., Junger, M. A., Hafen, E., Leevers, S. J., and Partridge, L. (2004) Science 305 361. [DOI] [PubMed] [Google Scholar]
- 3.Hwangbo, D. S., Gershman, B., Tu, M. P., Palmer, M., and Tatar, M. (2004) Nature 429 562-566 [DOI] [PubMed] [Google Scholar]
- 4.Bluher, M., Kahn, B. B., and Kahn, C. R. (2003) Science 299 572-574 [DOI] [PubMed] [Google Scholar]
- 5.Bluher, M., Michael, M. D., Peroni, O. D., Ueki, K., Carter, N., Kahn, B. B., and Kahn, C. R. (2002) Dev. Cell 3 25-38 [DOI] [PubMed] [Google Scholar]
- 6.Guarente, L., and Picard, F. (2005) Cell 120 473-482 [DOI] [PubMed] [Google Scholar]
- 7.Harman, D. (1998) Ann. N. Y. Acad. Sci. 854 1-7 [DOI] [PubMed] [Google Scholar]
- 8.Migliaccio, E., Giorgio, M., Mele, S., Pelicci, G., Reboldi, P., Pandolfi, P. P., Lanfrancone, L., and Pelicci, P. G. (1999) Nature 402 309-313 [DOI] [PubMed] [Google Scholar]
- 9.Schriner, S. E., Linford, N. J., Martin, G. M., Treuting, P., Ogburn, C. E., Emond, M., Coskun, P. E., Ladiges, W., Wolf, N., Van Remmen, H., Wallace, D. C., and Rabinovitch, P. S. (2005) Science 308 1909-1911 [DOI] [PubMed] [Google Scholar]
- 10.Stone, J. R., and Yang, S. (2006) Antioxid. Redox Signal. 8 243-270 [DOI] [PubMed] [Google Scholar]
- 11.Finkel, T. (2000) FEBS Lett. 476 52-54 [DOI] [PubMed] [Google Scholar]
- 12.Lee, S. R., Yang, K. S., Kwon, J., Lee, C., Jeong, W., and Rhee, S. G. (2002) J. Biol. Chem. 277 20336-20342 [DOI] [PubMed] [Google Scholar]
- 13.Yu, C. X., Li, S., and Whorton, A. R. (2005) Mol. Pharmacol. 68 847-854 [DOI] [PubMed] [Google Scholar]
- 14.Cho, K. J., Moon, H. E., Moini, H., Packer, L., Yoon, D. Y., and Chung, A. S. (2003) J. Biol. Chem. 278 34823-34833 [DOI] [PubMed] [Google Scholar]
- 15.Gredilla, R., Lopez-Torres, M., and Barja, G. (2002) Microsc. Res. Tech. 59 273-277 [DOI] [PubMed] [Google Scholar]
- 16.Weindruch, R. (1988) The Retardation of Aging and Disease by Dietary Restriction, Charles C. Thomas, Spingfield, IL
- 17.Giorgio, M., Migliaccio, E., Orsini, F., Paolucci, D., Moroni, M., Contursi, C., Pelliccia, G., Luzi, L., Minucci, S., Marcaccio, M., Pinton, P., Rizzuto, R., Bernardi, P., Paolucci, F., and Pelicci, P. G. (2005) Cell 122 221-233 [DOI] [PubMed] [Google Scholar]
- 18.Khanday, F. A., Yamamori, T., Mattagajasingh, I., Zhang, Z., Bugayenko, A., Naqvi, A., Santhanam, L., Nabi, N., Kasuno, K., Day, B. W., and Irani, K. (2006) Mol. Biol. Cell 17 122-129 [DOI] [PMC free article] [PubMed] [Google Scholar]
- 19.Nemoto, S., and Finkel, T. (2002) Science 295 2450-2452 [DOI] [PubMed] [Google Scholar]
- 20.Trinei, M., Giorgio, M., Cicalese, A., Barozzi, S., Ventura, A., Migliaccio, E., Milia, E., Padura, I. M., Raker, V. A., Maccarana, M., Petronilli, V., Minucci, S., Bernardi, P., Lanfrancone, L., and Pelicci, P. G. (2002) Oncogene 21 3872-3878 [DOI] [PubMed] [Google Scholar]
- 21.Zaccagnini, G., Martelli, F., Fasanaro, P., Magenta, A., Gaetano, C., Di Carlo, A., Biglioli, P., Giorgio, M., Martin-Padura, I., Pelicci, P. G., and Capogrossi, M. C. (2004) Circulation 109 2917-2923 [DOI] [PubMed] [Google Scholar]
- 22.Pacini, S., Pellegrini, M., Migliaccio, E., Patrussi, L., Ulivieri, C., Ventura, A., Carraro, F., Naldini, A., Lanfrancone, L., Pelicci, P., and Baldari, C. T. (2004) Mol. Cell. Biol. 24 1747-1757 [DOI] [PMC free article] [PubMed] [Google Scholar]
- 23.Napoli, C., Martin-Padura, I., de Nigris, F., Giorgio, M., Mansueto, G., Somma, P., Condorelli, M., Sica, G., De Rosa, G., and Pelicci, P. (2003) Proc. Natl. Acad. Sci. U. S. A. 100 2112-2116 [DOI] [PMC free article] [PubMed] [Google Scholar]
- 24.Menini, S., Amadio, L., Oddi, G., Ricci, C., Pesce, C., Pugliese, F., Giorgio, M., Migliaccio, E., Pelicci, P., Iacobini, C., and Pugliese, G. (2006) Diabetes 55 1642-1650 [DOI] [PubMed] [Google Scholar]
- 25.Francia, P., delli Gatti, C., Bachschmid, M., Martin-Padura, I., Savoia, C., Migliaccio, E., Pelicci, P. G., Schiavoni, M., Luscher, T. F., Volpe, M., and Cosentino, F. (2004) Circulation 110 2889-2895 [DOI] [PubMed] [Google Scholar]
- 26.Sjogren, K., Hellberg, N., Bohlooly, Y. M., Savendahl, L., Johansson, M. S., Berglindh, T., Bosaeus, I., and Ohlsson, C. (2001) J. Nutr. 131 2963-2966 [DOI] [PubMed] [Google Scholar]
- 27.Champigny, O., Holloway, B. R., and Ricquier, D. (1992) Mol. Cell. Endocrinol. 86 73-82 [DOI] [PubMed] [Google Scholar]
- 28.Nemoto, S., Combs, C. A., French, S., Ahn, B. H., Fergusson, M. M., Balaban, R. S., and Finkel, T. (2006) J. Biol. Chem. 281 10555-10560 [DOI] [PubMed] [Google Scholar]
- 29.Muoio, D. M., Seefeld, K., Witters, L. A., and Coleman, R. A. (1999) Biochem. J. 338 783-791 [PMC free article] [PubMed] [Google Scholar]
- 30.Shabalina, I. G., Jacobsson, A., Cannon, B., and Nedergaard, J. (2004) J. Biol. Chem. 279 38236-38248 [DOI] [PubMed] [Google Scholar]
- 31.Scaduto, R. C., Jr., and Grotyohann, L. W. (1999) Biophys. J. 76 469-477 [DOI] [PMC free article] [PubMed] [Google Scholar]
- 32.Kao, A. W., Waters, S. B., Okada, S., and Pessin, J. E. (1997) Endocrinology 138 2474-2480 [DOI] [PubMed] [Google Scholar]
- 33.Pinton, P., Rimessi, A., Marchi, S., Orsini, F., Migliaccio, E., Giorgio, M., Contursi, C., Minucci, S., Mantovani, F., Wieckowski, M. R., Del Sal, G., Pelicci, P. G., and Rizzuto, R. (2007) Science 315 659-663 [DOI] [PubMed] [Google Scholar]
- 34.Mahadev, K., Wu, X., Zilbering, A., Zhu, L., Lawrence, J. T., and Goldstein, B. J. (2001) J. Biol. Chem. 276 48662-48669 [DOI] [PubMed] [Google Scholar]
- 35.Tang, X., Powelka, A. M., Soriano, N. A., Czech, M. P., and Guilherme, A. (2005) J. Biol. Chem. 280 22523-22529 [DOI] [PubMed] [Google Scholar]
- 36.Bevan, P. (2001) J. Cell Sci. 114 1429-1430 [DOI] [PubMed] [Google Scholar]
- 37.Nakae, J., Kitamura, T., Kitamura, Y., Biggs, W. H., III, Arden, K. C., and Accili, D. (2003) Dev. Cell 4 119-129 [DOI] [PubMed] [Google Scholar]
- 38.May, J. M., and de Haen, C. (1979) J. Biol. Chem. 254 9017-9021 [PubMed] [Google Scholar]
- 39.Rousset, S., Alves-Guerra, M. C., Mozo, J., Miroux, B., Cassard-Doulcier, A. M., Bouillaud, F., and Ricquier, D. (2004) Diabetes 53 S130-135 [DOI] [PubMed] [Google Scholar]
- 40.Kim, J. R., Ryu, H. H., Chung, H. J., Lee, J. H., Kim, S. W., Kwun, W. H., Baek, S. H., and Kim, J. H. (2006) Exp. Mol. Med. 38 162-172 [DOI] [PubMed] [Google Scholar]
- 41.Brand, M. D., Affourtit, C., Esteves, T. C., Green, K., Lambert, A. J., Miwa, S., Pakay, J. L., and Parker, N. (2004) Free Radic. Biol. Med. 37 755-767 [DOI] [PubMed] [Google Scholar]
Associated Data
This section collects any data citations, data availability statements, or supplementary materials included in this article.


