Abstract
An exciting new direction in responsive liposome research is endogenous triggering of liposomal payload release by overexpressed enzyme activity in affected tissues and offers the unique possibility of active and site-specific release. Bringing to fruition the fully expected capabilities of this new class of triggered liposomal delivery system requires a collection of liposome systems that respond to different upregulated enzymes; however, a relatively small number currently exist. Here we show that stable, ~100 nm diameter liposomes can be made from previously unreported quinone-dioleoyl phosphatidylethanolamine (Q-DOPE) lipids, and complete payload release (quenched fluorescent dye) from Q-DOPE liposomes occurs upon their redox activation when the quinone headgroup possesses specific substituents. The key component of the triggerable, contents-releasing Q-DOPE liposomes is a “trimethyl-locked” quinone redox switch attached to the N-terminus of DOPE lipids that undergoes a cleavage event upon two-electron reduction. Payload release by aggregation and leakage of “uncapped” Q-DOPE liposomes is supported by results from liposomes wherein deliberate alteration of the “trimethyl-locked” switch completely deactivates the redox-destructible phenomena (liposome opening). We expect that Q-DOPE liposomes and their variants will be important in treatment of diseases with associated tissues that overexpress quinone reductases, such as cancers and inflammatory diseases, because the quinone redox switch is a known substrate for this group of reductases.
Introduction
Stimuli-responsive macromolecules and self-assembled architectures have piqued the interest of the basic science and biomedical arenas due to the possibility of attaining nanometer-level control over the construction and destruction of covalent and noncovalent interactions.1-15 Systems that allow for manipulation of these molecular-scale interactions may lead to the unprecedented fabrication of complicated nanoscopic and mesoscopic structures with unique physical and chemical properties and unreported biological function. Precise control of stimuli-responsive systems that unravel or self-destruct upon application of a trigger (stimulus) has captured the interest of the biomedical community because of the temporal and spatial specificity it would afford the delivery of therapeutics.16,17 Recently, such self-immolative modalities have been engineered into polymeric and dendritic constructs.18-21
Stimuli-responsive liposomes are highly attractive because local control over payload release should be possible through the use of either an exogenous or endogenous stimulus.22 The lipids in these liposomes generally contain a triggerable subunit that is responsible for gating the stability and/or permeability of the lipid bilayer. These liposomes are sometimes referred to as “smart” delivery systems, because unloading of the encapsulated payload requires stimuli activation.23-25 Ideally, a stimulus triggers the onset of cargo unloading, thereby allowing the carrier—cargo ensemble to be constructed without prematurely sacrificing or exposing the encapsulated cargo to the external environment. Various physiological environments—such as low endosomal pH26,27 and elevated enzymatic activity28-31 or biomarker presence32-34—and external sources, including radiation35-38and hyperthermia,39,40 supply the necessary stimuli that induce the unloading of the liposomal cargo; this occurs either by perturbing the permeability or by completely disrupting the noncovalent stability of the bilayer assembly. For instance, it has been shown that the permeability of pH- and radiation-sensitive liposomes can be perturbed by the acid-triggered depegylation of PEG-conjugated lipids41 and photo-chemical “uncorking” of o-benzyl-protected lipids,35 respectively, leading to the release of the encapsulated dyes.
One of our long-term goals associated with the construction of redox-sensitive liposomes is responsive liposomal carriers that can deliver anticancer agents to tumor tissues. It is our hypothesis that carefully designed redox-sensitive liposomes are structurally optimized to preferentially accumulate (preconcentration via enhanced permeability and retention (EPR) effect)42 and specifically respond to the high quinone reductase activities43 (localized release facilitated by complementary redox potentials) in cancer tissues.
In order to gain an understanding of how to create a new class of redox-responsive liposomal carriers that are structurally and electrochemically optimized for the delivery and triggered release of anticancer drugs to cancer tissues, we herein report on liposomes comprised of trimethyl-locked quinone lipids that require a two-electron reductive activation to liberate the liposomal payload. The integration of a trimethyl-lock quinone switch within the liposome is critical, because such a quinone switch has measurable activities toward several quinone reductases44,45 that are upregulated in numerous types of cancer tissues.43 In addition, due to the fact that liposome-encapsulated drugs retain the pharmacokinetic properties of the carriers—meaning that the drugs are not pharmacologically active until released from the liposomes—it is widely perceived that triggered release of the active ingredients is necessary for the rapid delivery of anticancer drugs.46,47 Thus, the development of new methods for the specific, stimuli-triggered release of liposomal payloads is extremely important. Herein, we demonstrate that liposomes comprised of dioleoyl phosphatidylethanolamine (DOPE) lipids having a trimethyl-locked quinone (Q3) headgroup (1-Q3 in Figure 1) liberate their contents (encapsulated dyes) upon reduction of Q3.
Figure 1.
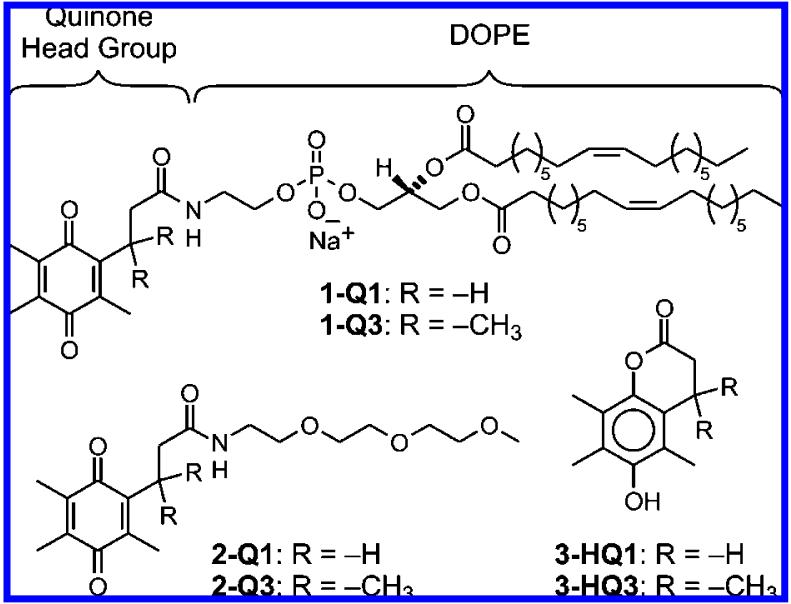
Structures of DOPE-quinones 1-Q1 and 1-Q3, the corresponding model compounds 2-Q1 and 2-Q3, and lactones 3-HQ3 and 3-HQ1 (ref 48).
Results and Discussion
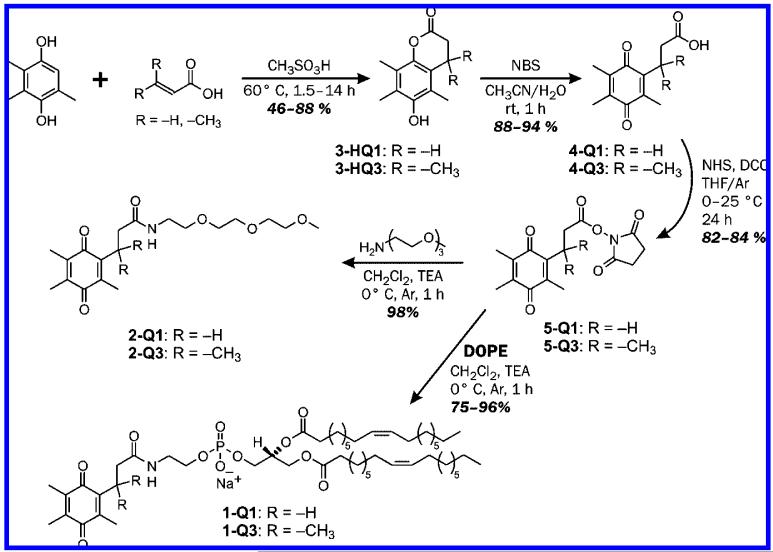
Quinone phospholipids 1-Q1 and 1-Q3 and the model derivatives 2-Q1 and 2-Q3 in Figure 1 were successfully synthesized by condensing the appropriate amines with the N-hydroxysuccinimide esters of the quinone acids, NHS-Qx, x = 1 or 3.48 The precursors of NHS-Q1 were synthesized using strategies that paralleled the preparation of NHS-Q3.49 All compounds yielded the expected outcomes from 1H and 13C NMR spectroscopies and ESI-TOF or GC mass spectrometries. Liposomes of 1-Q1 and 1-Q3 were prepared in pH 7.1/0.1 M phosphate buffer/0.1 M KCl using the technique of hydrated lipid film extrusion.50
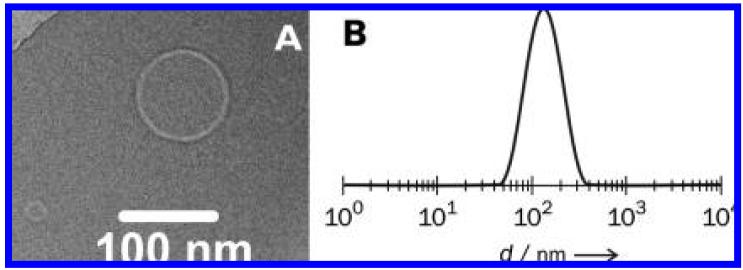
Cryogenic transmission electron microscopy (cryo-TEM) and dynamic light scattering (DLS) experiments reveal that 1-Q1 and 1-Q3 liposomes possess diameters in the 80-200 nm range (representative data in Figure 2). When the liposomes were preloaded with calcein dyes (5 × 10⁻² M), the resulting DLS intensity distributions were indistinguishable from those of the calcein-free liposomes, a result which indicates that the presence of dyes does not lead to significant changes in aggregate morphology. The unchanged, quenched emission from quiescent, aerobic solutions of calcein-loaded liposomes over a 2 day period at room temperature reflects the stability of the liposomes under ambient conditions; in addition, DLS-determined sizes of calcein-free and loaded liposomes did not vary over a period of a week. As expected, addition of excess Triton X-100 detergent to solutions of calcein-loaded liposomes caused release of the encapsulated dye, as evidenced by the rapid increase in emission intensity resulting from the dilution of calcein (Figure 3, trace B for 1-Q3 and trace D for 1-Q1).
Figure 2.
Characterization of calcein-free liposomes: (A) cryo-TEM image of 1-Q1 and (B) size distribution by DLS intensity of 1-Q3 at 25 °C.
Figure 3.
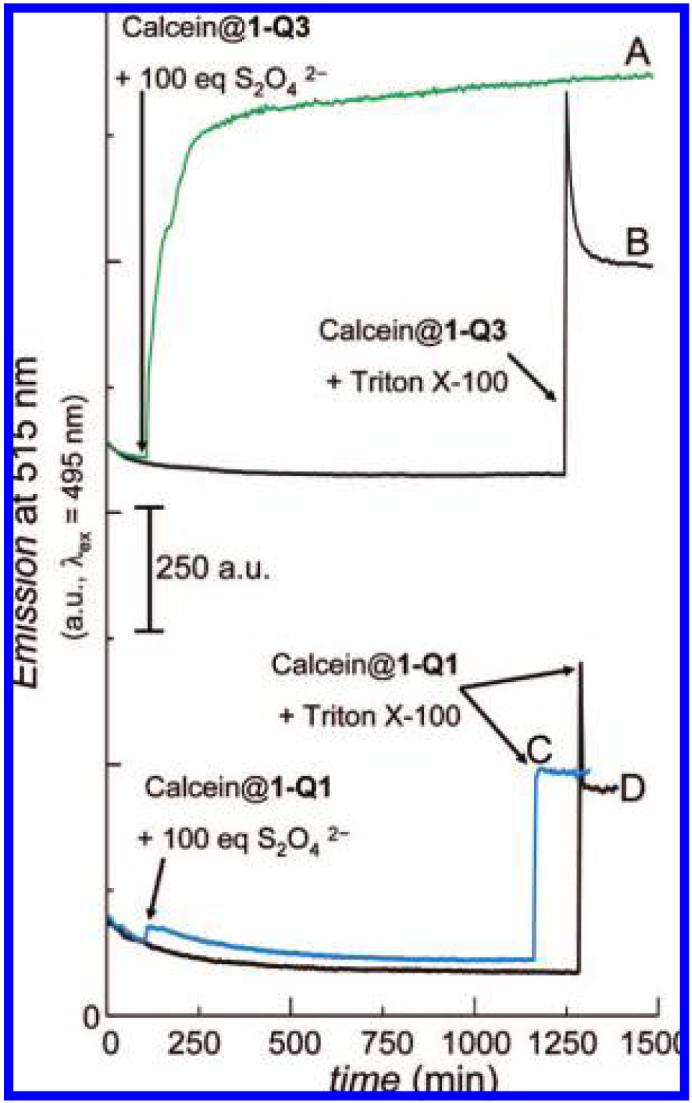
Time-course dependence of the emission intensities of calcein-loaded liposomes at 515 nm (λex = 495 nm) under ambient conditions. Traces A and B are for liposomes of 1-Q3, and traces C and D are for liposomes of 1-Q1, respectively. Addition of 100 equiv of Na2S2O4 for traces A and C occurred at 125 min.
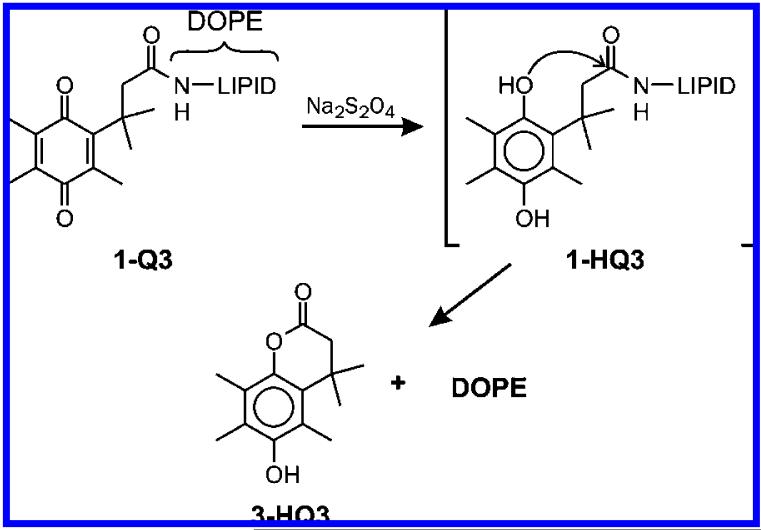
We51,52 and others53,54 previously reported that the two-electron reduction of various quinone trimethyl-lock (Q3) systems by chemical agents (Na2S2O4 or NaBH4) or electrolysis produces the corresponding hydroquinone, HQ3, possessing a sterically congested configuration, and HQ3 spontaneously dissociates from the parent structure as the lactone 3-HQ3. On the basis of time-course data that exhibit an immediate increase in fluorescence intensity of calcein following the addition of the reducing agent Na2S2O4 to the calcein-loaded 1-Q3 liposomes (Figure 3, Curve A), chemical reduction of liposomal 1-Q3 to 1-HQ3 resulted in the liberation of encapsulated calcein from the carrier! Addition of simple salts, such as Na2SO4, at equivalent concentrations does not lead to contents release. This outcome is consistent with the dissociation of in situ generated 1-HQ3-containing liposomes into lactone 3-HQ3 and DOPE inverted micelles (Scheme 1).
Scheme 1.
Reductive Lactonization of 1-Q3 Produces 3-HQ3 and DOPE
Unmodified DOPE is known to exist as hexagonal columnar (HII) inverted micelles at pH 7 due to the head/tail volume ratio of this lipid.55 On the other hand, N-acylated DOPE lipids, such as 1-Q3 and 1-Q1, have larger head/tail volume ratios than DOPE and can be made to readily form liposomes at pH 7. Therefore, as depicted in Scheme 1, the structural transition of lamellar (Lα)/liposomal 1-Q3 to inverted micellar (HII) DOPE (i.e., 1-Q3 (Lα) → DOPE (HII) + 3-HQ3) was accompanied by the release of calcein dyes. It is reasonable to assume that the HII inverted micelles are incapable of encapsulating calcein as efficiently as the lamellar liposomes. Thus, the inevitable expulsion of the entrapped dyes during the Lα → HII structural transition is expected.
The results described herein are the first demonstration of cargo unloading from a non-disulfide-based liposome that is triggered by electron transfer. These outcomes will add to the repertoire of methods for masking non-liposome-forming phospholipids, including DOPE, with a liposome-forming, stimulisensitive N-substituent to induce liposome formation, such as those based on light,38 thiolysis,34 and pH41 stimuli. Furthermore, the potential for this system to be responsive to reductase enzymes is high.43-45
To assess the role of the Lα → HII structural transition in the liberation of the dyes, liposomal 1-Q1 was employed as a control lipid because it lacks the geminal methyl (-CH3) groups that are required to satisfy the trimethyl-lock configuration.56 Such a geometric requirement is a prerequisite for fast lactonization (t1/2 ≤ few hours), and as a result, 1-HQ1 should not lactonize within the time scale of the dye-liberation experiments (vide infra). Thus, when the calcein-loaded liposomes of control lipid 1-Q1 were reduced, the dyes remained encapsulated inside the liposomes (fluctuation of trace C in Figure 3 at 120 min), and addition of Triton X-100 was required to release the dyes (trace C at 1150 min). This observation is in sharp contrast with liposomal 1-Q3, where the dyes were immediately liberated following the addition of Na2S2O4 (compare traces A and C at 120 min in Figure 3). The inability of Na2S2O4 to liberate the dyes from liposomal 1-Q1 remarkably suggests that the lamellar structure was maintained after reduction and that the permeability of the lipid barrier was unaffected by the redox conversion of 1-Q1 to 1-HQ1. These phenomena would be perhaps somewhat unexpected, considering that previous accounts have demonstrated the dramatic effect of redox conversion on the stability of some vesicles and micelles,57-60 but the collapse mechanism of reduced 1-Q3 liposomes is different than that of these redox-vesicle systems, vide infra. The ability of liposomal 1-HQ1 to retain calcein further suggests that the release of calcein from liposomal 1-HQ3 was not merely caused by the redox conversion of the Q3 headgroup to HQ3 but was, rather, imparted by the covalent disconnection of HQ3 from DOPE. The observation that the emission intensities of the liberated dyes remained similar, regardless of the lysing agent used (compare traces A with B and C with D61 in Figure 3), indicates that the release of dyes was effectively quantitative in all cases.62
The dormancy of 1-HQ1 toward lactonization was verified by employing compounds 2-Q1 and 2-Q3 in aqueous milieu to model the relative reactivity, or lack thereof, of 1-HQ1 and 1-HQ3, respectively. Kinetic data from 1H NMR spectroscopy experiments revealed that 2-HQ3, generated in situ by the reduction of 2-Q3 using Na2S2O4, dissociated into lactone 3-HQ3 and 2-[2-(2-methoxy-ethoxy)-ethoxy]-ethylamine following first-order kinetics (k ~ 0.02 min-1, t1/2 ~ 30 min; Supporting Information Figure S1). On the contrary, reduced 2-HQ1, also generated in situ by the reduction of 2-Q1, remained stable over a 48 h period. In other words, within the detection limits of 1H NMR spectroscopy, release of lactone 3-HQ1 from 2-HQ1 was not observed. Therefore, it is indeed reasonable to assume that liposomal 1-HQ1 did not lactonize within the 1500-min window of the dye-liberation experiments in Figure 3.
We conducted voltammetric experiments on the model compounds 2-Q1 and 2-Q3 to provide support for the argument that Na2S2O4 is capable of reducing lipid 1-Q1 as effectively as 1-Q3. Voltammetric data (Supporting Information Figure S2) reveal that two-electron reduction of 2-Q1 is more positive than that of 2-Q3 by +0.12 V (i.e., ΔEp = Ered (2-Q1) - Ered (2-Q3 = +0.12 V). Therefore, assuming that the ΔEp value of the model compounds is similar to the ΔEp gap between lipids 1-Q1 and 1-Q363 (i.e., Ered (1-Q3) - Ered (2-Q3) ~ Ered (1-Q1) - Ered (2-Q1)), it is reasonable to conclude that Na2S2O4 reduces lipid 1-Q1 to the same extent as lipid 1-Q3. If anything, the aforementioned potential gap suggests that reduction of 1-Q1 is thermodynamically easier than 1-Q3.
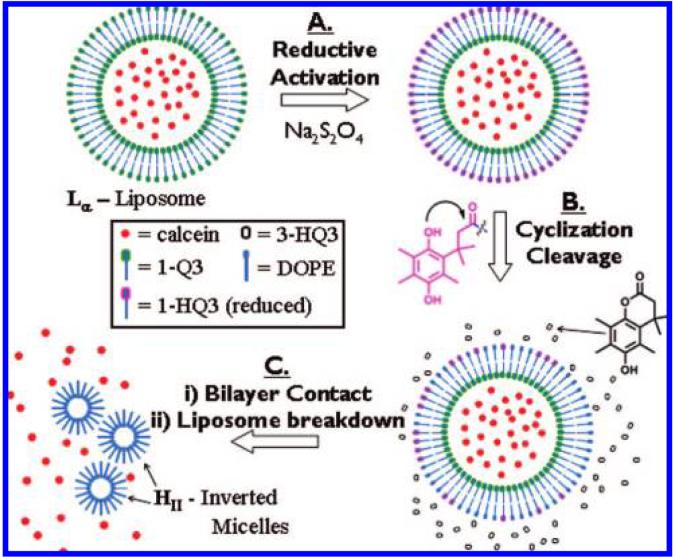
In Scheme 2 is outlined a proposed mechanism describing the sequence of lipid reduction—headgroup cyclization/elimination and liposome destabilization events leading to the release of calcein dyes from liposomal 1-Q3. The addition of Na2S2O4 reduces the 1-Q3 lipids that are located in the outer layer of the liposome to 1-HQ3 (step A).64 On the basis of the results gathered from control experiments that demonstrate the unperturbed fluorescence intensity of calcein following the reduction of 1-Q1 to 1-HQ1 (trace C in Figure 3 at 120 min), it is evident that the calcein dyes remained encapsulated even though the outer lipid layer of the liposomes was already reduced to 1-HQ3. Following reduction, and as described in Scheme 1, 1-HQ3 is removed (cleaved) from the external lipids of the liposome to yield lactone 3-HQ3 and DOPE (step B). As the 1-HQ3 → DOPE + 3-HQ3 dissociation process—caused by intramolecular cyclization—continues, the liposomal surface concentration of DOPE eventually becomes high enough (HII-phase competent)65to allow for DOPE layer-DOPE layer contact between individual66 liposomes (aggregation);65,67 light scattering data support aggregation of reduced 1-HQ3 liposomes (not shown), as the average particle size increases almost 5-fold (~500 nm) after addition of the reducing agent. Liposome collapse ensues to yield DOPE micelles (HII) and released calcein dye; during the collapse process, the remaining 1-Q3 lipids are quantitatively reduced by dithionite via steps A and B to afford the lactone 3-HQ3 and micellar DOPE.
Scheme 2.
Proposed Mechanism for the Conversion of Liposomal 1-Q3 from Lamellar (Lα) Liposomes to Inverted Hexagonal (H∥) DOPE Micellesa. a Step A: Na2S2O4 reduces the 1-Q3 lipids that are located in the outer layer of the liposome to 1-HQ3. Step B: 1-HQ3 dissociates into lactone 3-HQ3 and DOPE, as described in Scheme 1. Step C: release of encapsulated calcein dye occurs as a result of liposome collapse caused by DOPE layer-DOPE layer contact.
Conclusions
We have shown that lysis of liposomal 1-Q3 occurs upon reduction of the Q3 head groups by Na2S2O4 to yield an intermediate which rapidly forms 3-HQ3 and DOPE, the latter being unable to support stable liposomes at pH 7, thereby allowing release of liposome contents. The system presented here has great potential in drug delivery systems that employ bioreductive activation of liposomal anticancer drugs, as most cancer tissues contain overexpressed quinone reductases that are known to activate the Q3 headgroup.43,68 In addition, these redox-triggered lipids and their variants may permit the study of lipid dynamics in bilayers, either in free solution (liposomes) or on surfaces (supported bilayers). Efforts to those ends are currently underway.
Experimental Section
Synthesis
Compounds used here were made according to Scheme 3. 3-HQ3, 4-Q3, and 5-Q3 were synthesized as reported.49 Their Q1 analogues (3-HQ1, 4-Q1, and 5-Q1) were prepared using identical procedures, except as noted. 3-HQ1: reaction time was extended to 14 h. For purification, the concentrated solution of the crude product in ethyl acetate was diluted with n-hexanes, then refrigerated overnight to produce the purified product as a brown precipitate. Yield = 46%; 1H NMR (CDCl3, 300 MHz) δ 4.53 (bs, 1H), 2.92 (t, 2H), 2.72 (t, 2H), 2.22 (s, 3H), 2.19 (s, 3H), 2.18 (s, 3H); 13C NMR (CDCl3, 75 MHz) δ 169.58, 148.43, 144.45, 123.12, 121.99, 119.47, 118.24, 29.27, 21.51, 12.34, 12.21, 11.90; HRMS (ESI) m/z (M + H)+, calcd = 207.1021, obsd = 207.1011, 4.8 ppm error. 4-Q1: reaction time was shortened to 5 min and temperature was 0 °C. The crude product was recrystallized in CH2Cl2/Et2O/n-hexanes to produce the product as dark-yellow crystals. Yield = 88%; 1H NMR (CDCl3, 300 MHz) δ 2.82 (t, 2H), 2.51 (t, 2H), 2.07 (s, 3H), 2.02 (s, 6H); 13C NMR (CDCl3,75 MHz) δ 187.59, 187.00, 178.81, 141.93, 141.67, 140.87, 140.71, 32.77, 22.21, 12.54, 12.43, 12.37; HRMS (ESI) m/z (M + H)+, calcd = 223.0970, obsd = 223.0955, 6.7 ppm error. 5-Q1: Yield = 84%; 1H NMR (CDCl3, 300 MHz) δ 2.89 (m, 2H), 2.83 (m, 6H), 2.07 (s, 3H), 2.02 (s, 6H); 13C NMR (CDCl3, 75 MHz) δ 187.38, 186.86, 169.17, 167.87, 142.39, 140.98, 140.66, 29.74, 25.69, 22.18, 12.54, 12.51, 12.40; HRMS (ESI) m/z (M + H)+ calcd = 320.1134, obsd = 320.1145, 3.4 ppm error.
Scheme 3.
Synthesis of DOPE Quinones 1-Q1 and 1-Q3, and the Corresponding Model Compounds 2-Q1 and 2-Q3
2-Q1 and 2-Q3
2-[2-(2-Methoxy-ethoxy)-ethoxy]-ethylamine was synthesized as reported.69 To a cooled solution (0 °C) of this amine (1.31 mmol) in dry CH2Cl2 (20 mL) was added triethylamine (3.9 mmol), then 5Qx (x = 1 or 3, 1.31 mmol), and the reaction was allowed to reach to completion (1 h) while being maintained under Ar atmosphere. The crude reaction mixture was concentrated, loaded onto a SiO2 column, and eluted using 7:1 ethyl acetate/ methanol. Rf values of 2-Q1 and 2-Q3 in SiO2 plate are ca. 0.75-0.80. The combined fractions were evaporated to dryness and dried under vacuum to yield the products as yellow, viscous oils. 2-Q1: Yield = 98%; 1H NMR (CDCl3, 300 MHz) δ 6.24 (bs, 1H), 3.65 (m, 6H), 3.56 (m, 4H), 3.43 (t, 2H), 3.38 (s, 3H), 2.81 (t, 2H), 2.31 (t, 2H), 2.07 (s, 3H), 2.01 (s, 6H); 13C NMR (CDCl3, 75 MHz) δ 187.65, 187.21, 171.76, 142.74, 141.41, 140.75, 140.53, 71.99, 70.58, 70.53, 70.26, 69.91, 59.09, 39.36, 35.08, 23.17, 12.52, 12.41, 12.31; HRMS (ESI) m/z ((M + H)+), calcd = 368.2073, obsd = 368.2076, 0.8 ppm error. 2-Q3: Yield = 98%; 1H NMR (CDCl3, 300 MHz) δ 6.07 (bs, 1H), 3.66-3.57 (m, 8H), 3.49 (t, 2H), 3.40 (s, 3H), 3.35 (m, 2H), 2.82 (s, 2H), 2.12 (s, 3H), 1.98 (s, 3H), 1.95 (s, 3H), 1.42 (s, 6H); 13C NMR (CDCl3, 75 MHz) δ 191.35, 187.74, 172.06, 153.93, 143.92, 137.84, 137.40, 72.09, 70.61, 70.33, 70.04, 59.18, 49.16, 39.10, 38.37, 28.89, 14.23, 12.91, 12.26; HRMS (ESI) m/z ((M + H)+), calcd = 396.2386, obsd = 396.2388, 0.5 ppm error.
1-Q1 and 1-Q3
The reaction conditions and reagent ratios were identical to the preparation of 2-Qx (x = 1 or 3), except that the reaction times were extended to 4-6 h. For purification, the reaction mixture was diluted with CH2Cl2 to 50 mL, then extracted with 5% NaHCO3 (1 × 50 mL). The organic layer was dried with Na2SO4, concentrated, and loaded to a SiO2 column, then eluted via a gradient of 1:1 CH2Cl2/EtOAc (to elute any unreacted 2-Qx, if any) followed by 3:1:2 CH2Cl2/MeOH/n-hexanes. The combined fractions were evaporated to dryness and dried under vacuum to yield the products as yellow waxes. 1-Q1: Yield: 75%; 1H NMR (CDCl3, 400 MHz) δ 7.38 (bs, 1H), 5.33 (m, 4H), 5.22 (m, 1H), 4.36 (m, 1H), 4.14 (m, 1H), 3.95 (m, 4H), 3.49 (m, 2H), 2.76 (t, 2H), 2.33 (t, 2H), 2.26 (m, 4H), 2.03-1.96 (m, 17H), 1.54 (m, 4H), 1.26 (m, 40H), 0.88 (t, 6H); 13C NMR (CDCl3, 75 MHz) δ 187.50, 187.33, 173.93, 173.68, 142.84, 141.54, 140.91, 140.53, 130.19, 129.80, 70.77, 64.94, 64.06, 63.17, 40.49, 34.78, 34.41, 34.24, 32.10, 29.98, 29.74, 29.52, 27.42, 25.13, 25.03, 22.88, 14.31, 12.57, 12.46, 12.31; HRMS (ESI) m/z (M - Na)-, calcd = 946.6173, obsd = 946.5756, 44 ppm error. 1-Q3: Yield: 96%; 1H NMR (CDCl3, 400 MHz) δ 7.65 (bs, 1H), 5.34 (m, 5H), 4.42 (m, 1H), 4.16 (m, 1H), 3.93 (m, 2H), 3.85 (m, 2H), 3.38 (m, 2H), 2.84 (s, 2H), 2.29 (m, 4H), 2.10 (s, 3H), 1.99 (m, 8H), 1.94 (s, 6H), 1.57 (m, 4H), 1.37 (s, 6H), 1.28 (m, 40H), 0.88 (t, 6H); 13C NMR (CDCl3, 75 MHz) δ 191.49, 187.60, 174.15, 173.93, 172.86, 154.02, 143.73, 138.04, 137.54, 130.25, 129.75, 70.74, 65.21, 63.83, 63.07, 48.67, 39.84, 38.10, 34.50, 34.31, 32.10, 29.97, 29.74, 29.53, 28.84, 27.42, 25.08, 22.88, 14.32, 12.92, 12.29; HRMS (ESI) m/z (M - Na)-, calcd = 974.6486, obsd = 974.6485, 0.1 ppm error.
Liposome Preparation
1-Q1 or 1-Q3 (5-7 mg) was dissolved in CHCl3 (10 mL) in a 25 mL round-bottom flask, and the lipid solution was evaporated to a thin lipid film using a rotary evaporator. The films were dried under vacuum for 1 h and redissolved in pH 7.1 0.1 M phosphate buffer/0.1 M KCl at a concentration of 1 mg/mL. The solution was aged (1 h) with occasional vortexing (ca. 10-15 s at 20 min intervals), after which it was freeze-thawed in a dry ice/acetone bath (7 times), followed by extrusion (12 times) at ambient temperature through two stacked, 100-nm pore Whatman Nuclepore polycarbonate track-etched membranes using a Lipex lipid extruder (Northern Lipids, Vancouver, BC, Canada). The buffer solutions used to prepare liposomes subjected to DLS measurements were filtered through a Whatman Anotop 20 nm membrane. For the preparation of calcein-loaded liposomes, the entire “extrusion” procedure described above was used, except that the buffered solvent also contained dissolved calcein (5 × 10⁻² M, Sigma-Aldrich, Milwaukee, WI). Following extrusion, the nonencapsulated dyes were separated from the liposome-encapsulated dyes by gel filtration (two times) of the extruded solution through a column of Sephadex G-50 resin (GE Healthcare BioSciences, Piscataway, NJ).
Calcein-Release Experiments
The purified calcein-encapsulated liposomes were diluted with buffer to achieve an arbitrary concentration in the 10 μg/mL range (based on lipid). This concentration was determined spectrophotometrically using ε495,free = ε495,encapsulated = 7.0 × 10⁴ M-1 cm-1 for calcein24 and an estimated bilayer thickness = 4 nm, cross-sectional area of lipids = 0.7 nm2 and [encapsulated calcein] = 5 × 10⁻² M. Solid Na2S2O4 (85%, Sigma-Aldrich) or/and an appropriate aliquot of 7% (w/v) Triton X-100 (Sigma-Aldrich) were added to the cuvettes to attain the concentrations described in Figure 3. Fluorescence intensities were recorded using a Perkin-Elmer LS 50 luminescence spectrophotometer.
Liposome Characterization
Dynamic light scattering measurements were obtained from backscatter intensities (173°, 633 nm red laser) obtained at 25 °C on calcein-free and calcein-loaded liposomes using a Zetasizer Nano ZS (Malvern Instruments, Worcestershire, U.K.) particle size analyzer. Cryo-TEM images were obtained using the method of vitrification of frozen hydrated samples.25 Buffered liposomal solution (2.5 μL) was deposited on a 400 mesh Cu grid covered with holey carbon film (Quantifoil Micro Tools EmbH, Jena, Germany) and suspended in a Vitrobot (FEI, Hillsboro, OR). The grid was blotted for 2 s with filter paper, then the sample was vitrified using liquified ethane. A JEOL 2010F TEM (Tokyo, Japan) was used to image the specimens at 200 kV using a low-dose method, with the Gatan model 626 cryostage (Gatan, Pleasanton, CA) maintained at 92 K during the whole experiment. Images were recorded with a Gatan 4k × 4k CCD camera (Gatan, Pleasanton, CA) and processed with custom-built EMAN software.26
Acknowledgment
This work was supported by the U.S. National Science Foundation, the State of Louisiana, Louisiana State University, and the U.S. National Institutes of Health (P41RR02250). We thank Dr. R. Cueto at LSU for access to the DLS and luminescence instruments and Nicole M. Hollabaugh for synthesis of 3-HQ1.
Footnotes
Supporting Information Available: Voltammetry of 2-Q1 and 2-Q3, the kinetics of reductive lactonization of 2-Q3, and the NMR and mass spectra of compounds. This material is available free of charge via the Internet at http://pubs.acs.org.
Supplementary Material
References
- (1).Savariar EN, Ghosh S, Gonzalez DC, Thayumanavan S. J. Am. Chem. Soc. 2008;130:5416–5417. doi: 10.1021/ja800164z. [DOI] [PubMed] [Google Scholar]
- (2).Liu JW, Lu Y. J. Am. Chem. Soc. 2007;129:8634–8643. doi: 10.1021/ja072075+. [DOI] [PubMed] [Google Scholar]
- (3).Nijhuis CA, Ravoo BJ, Huskens J, Reinhoudt DN. Coord. Chem. Rev. 2007;251:1761–1780. [Google Scholar]
- (4).Bellomo EG, Wyrsta MD, Pakstis L, Pochan DJ, Deming TJ. Nat. Mater. 2004;3:244–248. doi: 10.1038/nmat1093. [DOI] [PubMed] [Google Scholar]
- (5).Dillenback LM, Goodrich GP, Keating CD. Nano Lett. 2006;6:16–23. doi: 10.1021/nl0508873. [DOI] [PubMed] [Google Scholar]
- (6).Wang W, Kaifer AE. Angew. Chem., Int. Ed. 2006;45:7042–7046. doi: 10.1002/anie.200602220. [DOI] [PubMed] [Google Scholar]
- (7).Serizawa T, Yamaguchi M, Akashi M. Angew. Chem., Int. Ed. 2003;42:1115–1118. doi: 10.1002/anie.200390293. [DOI] [PubMed] [Google Scholar]
- (8).Whitaker-Brothers K, Uhrich K. J. Biomed. Mater. Res., Part A. 2004;70A:309–318. doi: 10.1002/jbm.a.30083. [DOI] [PubMed] [Google Scholar]
- (9).Gugliotti LA, Feldheim DL, Eaton BE. J. Am. Chem. Soc. 2005;127:17814–17818. doi: 10.1021/ja055039o. [DOI] [PubMed] [Google Scholar]
- (10).Eastoe J, Vesperinas A. Soft Matter. 2005;1:338–347. doi: 10.1039/b510877m. [DOI] [PubMed] [Google Scholar]
- (11).Goodwin AP, Mynar JL, Ma YZ, Fleming GR, Frechet JMJ. J. Am. Chem. Soc. 2005;127:9952–9953. doi: 10.1021/ja0523035. [DOI] [PubMed] [Google Scholar]
- (12).Jiang JQ, Tong X, Zhao Y. J. Am. Chem. Soc. 2005;127:8290–8291. doi: 10.1021/ja0521019. [DOI] [PubMed] [Google Scholar]
- (13).Menger FM, Gabrielson K. J. Am. Chem. Soc. 1994;116:1567–1568. [Google Scholar]
- (14).Rui YJ, Wang S, Low PS, Thompson DH. J. Am. Chem. Soc. 1998;120:11213–11218. [Google Scholar]
- (15).Van Horn BA, Wooley KL. Macromolecules. 2007;40:1480–1488. [Google Scholar]
- (16).Allen TM, Cullis PR. Science. 2004;303:1818–1822. doi: 10.1126/science.1095833. [DOI] [PubMed] [Google Scholar]
- (17).Dreher MR, Chilkoti A. J. Natl. Cancer Inst. 2007;99:983–985. doi: 10.1093/jnci/djm042. [DOI] [PubMed] [Google Scholar]
- (18).Szalai ML, Kevwitch RM, McGrath DV. J. Am. Chem. Soc. 2003;125:15688–15689. doi: 10.1021/ja0386694. [DOI] [PubMed] [Google Scholar]
- (19).de Groot FMH, Albrecht C, Koekkoek R, Beusker PH, Scheeren HW. Angew. Chem., Int. Ed. 2003;42:4490–4494. doi: 10.1002/anie.200351942. [DOI] [PubMed] [Google Scholar]
- (20).Amir RJ, Shabat D. Polymer Therapeutics I: Polymers as Drugs, Conjugates and Gene Delivery Systems. Vol. 192. Springer-Verlag Berlin; Berlin: 2006. pp. 59–94. [Google Scholar]
- (21).Sagi A, Weinstain R, Karton N, Shabat D. J. Am. Chem. Soc. 2008;130:5434–ff. doi: 10.1021/ja801065d. [DOI] [PubMed] [Google Scholar]
- (22).Guo X, Szoka FC. Acc. Chem. Res. 2003;36:335–341. doi: 10.1021/ar9703241. [DOI] [PubMed] [Google Scholar]
- (23).Sawant RM, Hurley JP, Salmaso S, Kale A, Tolcheva E, Levchenko TS, Torchilin VP. Bioconjugate Chem. 2006;17:943–949. doi: 10.1021/bc060080h. [DOI] [PMC free article] [PubMed] [Google Scholar]
- (24).Andresen TL, Jensen SS, Kaasgaard T, Jorgensen K. Curr. Drug Delivery. 2005;2:353–362. doi: 10.2174/156720105774370203. [DOI] [PubMed] [Google Scholar]
- (25).Fattal E, Couvreur P, Dubernet C. Adv. Drug Delivery Rev. 2004;56:931–946. doi: 10.1016/j.addr.2003.10.037. [DOI] [PubMed] [Google Scholar]
- (26).Gerasimov OV, Boomer JA, Qualls MM, Thompson DH. AdV. Drug Delivery Rev. 1999;38:317–338. doi: 10.1016/s0169-409x(99)00035-6. [DOI] [PubMed] [Google Scholar]
- (27).Zhang JX, Zalipsky S, Mullah N, Pechar M, Allen TM. Pharmacol. Res. 2004;49:185–198. doi: 10.1016/j.phrs.2003.09.003. [DOI] [PubMed] [Google Scholar]
- (28).Davidsen J, Jorgensen K, Andresen TL, Mouritsen OG. Biochim. Biophys. Acta. 2003;1609:95–101. doi: 10.1016/s0005-2736(02)00659-4. [DOI] [PubMed] [Google Scholar]
- (29).Meers P. Adv. Drug Delivery Rev. 2001;53:265–272. doi: 10.1016/s0169-409x(01)00205-8. [DOI] [PubMed] [Google Scholar]
- (30).Huang Z, Szoka FC. In: Liposome Technology. 3rd ed. Gregoriadis G, editor. Vol. 3. CRC Press; Boca Raton, FL: 2006. pp. 165–196. [Google Scholar]
- (31).Sarkar N, Banerjee J, Hanson AJ, Elegbede AI, Rosendahl T, Krueger AB, Banerjee AL, Tobwala S, Wang RY, Lu XN, Mallik S, Srivastava DK. Bioconjugate Chem. 2008;19:57–64. doi: 10.1021/bc070081p. [DOI] [PubMed] [Google Scholar]
- (32).Kirpotin D, Hong KL, Mullah N, Papahadjopoulos D, Zalipsky S. FEBS Lett. 1996;388:115–118. doi: 10.1016/0014-5793(96)00521-2. [DOI] [PubMed] [Google Scholar]
- (33).Tang FX, Hughes JA. Biochem. Biophys. Res. Commun. 1998;242:141–145. doi: 10.1006/bbrc.1997.7923. [DOI] [PubMed] [Google Scholar]
- (34).Zalipsky S, Qazen M, Walker JA, Mullah N, Quinn YP, Huang SK. Bioconjugate Chem. 1999;10:703–707. doi: 10.1021/bc990031n. [DOI] [PubMed] [Google Scholar]
- (35).Chandra B, Mallik S, Srivastava DK. Chem. Commun. 2005:3021–3023. doi: 10.1039/b503423j. [DOI] [PubMed] [Google Scholar]
- (36).Eastoe J, Vesperinas A, Donnewirth AC, Wyatt P, Grillo I, Heenan RK, Davis S. Langmuir. 2006;22:851–853. doi: 10.1021/la052882r. [DOI] [PubMed] [Google Scholar]
- (37).Shum P, Kim JM, Thompson DH. Adv. Drug Delivery Rev. 2001;53:273–284. doi: 10.1016/s0169-409x(01)00232-0. [DOI] [PubMed] [Google Scholar]
- (38).Zhang ZY, Smith BD. Bioconjugate Chem. 1999;10:1150–1152. doi: 10.1021/bc990087h. [DOI] [PubMed] [Google Scholar]
- (39).Kono K, Murakami T, Yoshida T, Haba Y, Kanaoka S, Takagishi T, Aoshima S. Bioconjugate Chem. 2005;16:1367–1374. doi: 10.1021/bc050004z. [DOI] [PubMed] [Google Scholar]
- (40).Needham D, Dewhirst MW. Adv. Drug Delivery Rev. 2001;53:285–305. doi: 10.1016/s0169-409x(01)00233-2. [DOI] [PubMed] [Google Scholar]
- (41).Boomer JA, Inerowicz HD, Zhang ZY, Bergstrand N, Edwards K, Kim JM, Thompson DH. Langmuir. 2003;19:6408–6415. [Google Scholar]
- (42).Maeda H, Wu J, Sawa T, Matsumura Y, Hori K. J. Controlled Release. 2000;65:271–284. doi: 10.1016/s0168-3659(99)00248-5. [DOI] [PubMed] [Google Scholar]
- (43).Fitzsimmons SA, Workman P, Grever M, Paull K, Camalier R, Lewis AD. J. Natl. Cancer Inst. 1996;88:259–269. doi: 10.1093/jnci/88.5.259. [DOI] [PubMed] [Google Scholar]
- (44).Jaffar M, Abou-Zeid N, Bai L, Mrema I, Robinson I, Tanner R, Stafford IJ. Curr. Drug Delivery. 2004;1:345–350. doi: 10.2174/1567201043334560. [DOI] [PubMed] [Google Scholar]
- (45).Weerapreeyakul N, Visser P, Brummelhuis M, Gharat L, Chikhale PJ. Med. Chem. Res. 2000;10:149–163. [Google Scholar]
- (46).Lim HJ, Masin D, Madden TD, Bally MB. J. Pharmacol. Exp. Ther. 1997;281:566–573. [PubMed] [Google Scholar]
- (47).Ponce AM, Wright A, Dewhirst MW, Needham D. Future Lipidol. 2006;1:25–34. [Google Scholar]
- (48).The following nomenclature will be adapted throughout the article: “Q” and “HQ” refer to the oxidized and reduced forms of the quinone, respectively, regardless of whether “HQ” is generated in situ (e.g., 1-HQ3) or synthesized (e.g., 3-HQ1). For instance, 1-HQ1 is the reduced form of 1-Q1.
- (49).Carpino LA, Triolo SA, Berglund RA. J. Org. Chem. 1989;54:3303–3310. [Google Scholar]
- (50).Szoka F, Papahadjopoulos D. Annu. Rev. Biophys. Bioeng. 1980;9:467–508. doi: 10.1146/annurev.bb.09.060180.002343. [DOI] [PubMed] [Google Scholar]
- (51).Ong W, McCarley RL. Chem. Commun. 2005:4699–4701. doi: 10.1039/b506724c. [DOI] [PubMed] [Google Scholar]
- (52).Ong W, McCarley RL. Macromolecules. 2006;39:7295–7301. [Google Scholar]
- (53).Yan C, Matsuda W, Pepperberg DR, Zimmerman SC, Leckband DE. J. Colloid Interface Sci. 2006;296:165–177. doi: 10.1016/j.jcis.2005.08.029. [DOI] [PubMed] [Google Scholar]
- (54).Zheng A, Shan D, Wang B. J. Org. Chem. 1999;64:156–161. doi: 10.1021/jo981528d. [DOI] [PubMed] [Google Scholar]
- (55).Siegel DP, Epand RM. Biophys. J. 1997;73:3089–3111. doi: 10.1016/S0006-3495(97)78336-X. [DOI] [PMC free article] [PubMed] [Google Scholar]
- (56).Milstien S, Cohen LA. J. Am. Chem. Soc. 1972;94:9158–9165. doi: 10.1021/ja00781a029. [DOI] [PubMed] [Google Scholar]
- (57).Abbott NL, Jewell CM, Hays ME, Kondo Y, Lynn DM. J. Am. Chem. Soc. 2005;127:11576–11577. doi: 10.1021/ja054038t. [DOI] [PubMed] [Google Scholar]
- (58).Kakizawa Y, Sakai H, Yamaguchi A, Kondo Y, Yoshino N, Abe M. Langmuir. 2001;17:8044–8048. [Google Scholar]
- (59).Munoz S, Gokel GW. J. Am. Chem. Soc. 1993;115:4899–4900. [Google Scholar]
- (60).Saji T, Hoshino K, Aoyagui S. J. Am. Chem. Soc. 1985;107:6865–6868. [Google Scholar]
- (61).Calcein is known to be quenched by Triton, and this quenching is Triton concentration dependent. See: Memoli A, Palermiti LG, Travagli V, Alhaique F. J. Pharm. Biomed. Anal. 1999;19:627–632. doi: 10.1016/s0731-7085(98)00229-5. and references therein for more information on this topic.
- (62).Percent release of calcein was estimated using the well-known equation: % release = [(I- I0)/(Imax- I0)] × 100, where I and Imax are the emission intensities after the addition of Na2S2O4 and Triton X-100, respectively, and I0 is the initial emission intensity.
- (63).It is assumed here that the quinone units located in the outer layer of the liposomes are kinetically and equally accessible, such that probability of reduction of the liposomal lipids (1-Q1 and 1-Q3) can be approximated by the thermodynamic reduction potentials of the model quinones (2-Q1 and 2-Q3).
- (64).Consistent with previous reports, it is assumed here that Na2S2O4 is non-membrane-permeable and is therefore incapable of reducing the lipids located in the interior layer of the liposome. For instance, see: Angeletti C, Nichols JW. Biochemistry. 1998;37:15114–15119. doi: 10.1021/bi9810104.
- (65).Bentz J, Ellens H, Szoka FC. Biochemistry. 1987;26:2105–2116. doi: 10.1021/bi00382a008. [DOI] [PubMed] [Google Scholar]
- (66).Intraliposomal bilayer-bilayer contact in oligolamellar Q-DOPE liposomes may also contribute to liposome collapse and contents release. The mechanism of Q-DOPE liposome collapse is currently being investigated in detail.
- (67).Ellens H, Bentz J, Szoka FC. Biochemistry. 1984;23:1532–1538. doi: 10.1021/bi00302a029. [DOI] [PubMed] [Google Scholar]
- (68).Ross D. Drug Metab. Rev. 2004;36:639–654. doi: 10.1081/dmr-200033465. [DOI] [PubMed] [Google Scholar]
- (69).Bahr JL, Yang JP, Kosynkin DV, Bronikowski MJ, Smalley RE, Tour JM. J. Am. Chem. Soc. 2001;123:6536–6542. doi: 10.1021/ja010462s. [DOI] [PubMed] [Google Scholar]
Associated Data
This section collects any data citations, data availability statements, or supplementary materials included in this article.


