

Abstract
Crotonaldehyde, a mutagen and carcinogen, reacts with deoxyguanosine (dGuo) in DNA to generate a pair of diastereomeric 1,N2-propanodeoxyguanosine adducts (Cro-dGuo, 2), which occur in (6S, 8S) and (6R, 8R) configurations. They can also be formed through the consecutive reaction of two acetaldehyde molecules with dGuo. Cro-dGuo adducts inhibit DNA synthesis and induce miscoding in human cells. Considering their potential role in carcinogenesis, we have developed a sensitive and specific liquid chromatography-electrospray ionization-tandem mass spectrometry (LC-ESI-MS/MS) method to explore the presence of Cro-dGuo adducts in DNA from various human tissues, such as liver, lung, and blood. DNA was isolated from human tissues and enzymatically hydrolyzed to deoxyribonucleosides. [15N5]Cro-dGuo was synthesized and used as an internal standard. The Cro-dGuo adducts were enriched from the hydrolysate by solid phase extraction and analyzed by LC-ESI-MS/MS, using selected reaction monitoring (SRM). This method allows the quantitation of the Cro-dGuo adducts at a concentration of 4 fmol/μmol dGuo, corresponding to about 1 adduct per 109 normal nucleosides starting with 1 mg of DNA, with high accuracy and precision. DNA from human liver, lung and blood were analyzed. The Cro-dGuo adducts were detected more frequently in human lung DNA than in liver DNA, but were not detected in DNA from blood. The results of this study provide quantified data on Cro-dGuo adducts in human tissues. The higher frequency of Cro-dGuo in lung DNA than in the other tissues investigated is potentially important and deserves further study.
Introduction
Crotonaldehyde (1), or 2-butenal, is found ubiquitously in the human environment (1). It is present in mobile source emissions, the atmosphere, tobacco smoke, and other thermal degradation mixtures. It is also produced endogenously from lipid peroxidation (2) and is a metabolite of N-nitrosopyrrolidine (3). Crotonaldehyde is mutagenic (4) and carcinogenic (5). Like other α,β-unsaturated aldehydes, crotonaldehyde reacts with dGuo in DNA to form exocyclic 1,N2-propanodeoxyguanosine (PdG1) adducts (6). This reaction occurs through an initial Michael addition to the exocyclic nitrogen of dGuo, followed by ring closure, to generate a pair of diastereomeric adducts: (6S, 8S)- and (6R, 8R)-3-(2′-deoxyribos-1′-yl)-5,6,7,8-tetrahydro-8-hydroxy-6-methylpyrimido[1,2-a]purine-10(3H)one (Cro-dGuo, 2, Scheme 1). Both diastereomers are also formed by the consecutive reaction of two acetaldehyde molecules with dGuo (7). Acetaldehyde is also a common environmental pollutant, and occurs widely in fruit and vegetables, as well as in cooked meat (8). It is prevalent in cigarette smoke, with levels of 770 – 860 μg/cigarette, and may be involved in alcohol-related cancers in humans (9). While the reaction of crotonaldehyde with DNA produces more (6S, 8S)-2 (10), the reaction of acetaldehyde with DNA is more favorable to the formation of (6R, 8R)-2 (7). This indicates that the formation of adduct 2 from acetaldehyde does not proceed through crotonaldehyde, but through N2-ethylidene-dGuo (3) (7). In duplex DNA, adduct 2 exits in equilibrium with its ring-opened aldehyde form (11) and can lead to the formation of interstrand cross-links and DNA-protein cross-links (7, 12, 13).
Scheme 1.

Formation of 1,N2-propanodeoxyguanosine adducts in the reactions of crotonaldehyde or acetaldehyde with dGuo.
Cro-dGuo adducts inhibit DNA synthesis and induce miscoding in human cells (14, 15). Miscoding is observed more frequently with (6S, 8S)-2 than (6R, 8R)-2. Major miscoding events were G→T transversions. Considering their mutagenic properties, detection and quantitation of Cro-dGuo in vivo, especially in human tissues, will help assess their potential role in carcinogenesis. Various methods have been used for this purpose. Chung, Nath, and co-workers developed a 32P-postlabeling/HPLC method, and detected both diastereomers of Cro-dGuo in various tissues of humans and untreated animals, indicating the existence of endogenous sources of crotonaldehyde or acetaldehyde (reviewed in (16)). Another 32P-postlabeling method was developed by Eder et al. (17, 18) with a detection limit of three adducts per 109 nucleotides. Cro-dGuo adducts were detected in different organs of Fischer 344 rats after single gavages of high doses of crotonaldehyde or after repeated gavages of low doses, but not in untreated animals. An LC-MS method was developed to analyze Cro-dGuo in the base form in cells treated with acetaldehyde (19). However, none of these studies used internal standards for quantitation, nor were the latter two studies applied to human tissues. In the present study, we have established a liquid chromatography-electrospray ionization-tandem mass spectrometry (LC-ESI-MS/MS) method to quantify Cro-dGuo adducts in human tissues. With the use of a stable isotope labeled internal standard, our method is accurate, precise and sensitive. Our results indicate the presence of Cro-dGuo in some DNA samples from human liver and lung.
Experimental Section
HPLC-UV analysis
This was carried out using Waters Associates (Milford, MA) instruments equipped with a UV detector (Shimadzu Scientific Instruments, Columbia, MD) operated at 254 nm or a model 996 photodiode array detector. System 1 used a 4.6 mm × 25 cm 5 μm Supelcosil LC 18-BD column (Supelco, Bellefonte, PA) with isocratic elution by 5% CH3OH in 40 mM ammonium acetate buffer (pH 6.6) for 10 min and then a gradient from 5 to 35% CH3OH over the course of 60 min at a flow rate of 0.5 mL/min. This system was used for the purification of adduct 2 and [15N5]2. System 2 used a 4.6 mm × 25 cm Luna 5 μm C18 column (Phenomenex, Torrance, CA) with a gradient from 5 to 40% CH3OH in H2O over the course of 35 min at a flow rate of 0.7 mL/min. This system was used for the analysis of dGuo.
Chemicals and Enzymes
[15N5]dGuo was obtained from Spectra Stable Isotopes (Columbia, MD). Ethanol was obtained from AAPER Alcohol and Chemical Co. (Shelbyville, KY). 2-Propanol was purchased from Acros Organics (Morris Plains, NJ). Puregene DNA purification solutions were procured from Gentra Systems (Minneapolis, MN). Calf thymus DNA, DNase I and phosphodiesterase I were obtained from Sigma-Aldrich (St. Louis, MO). Alkaline phosphatase was obtained from Roche Diagnostics Corporation (Indianapolis, IN). All other chemicals were purchased from Sigma-Aldrich.
Cro-dGuo (2) and [15N5]2
Adduct 2 was prepared as described (10) from the reaction of dGuo and crotonaldehyde. In brief, crotonaldehyde (0.18 mmol) was allowed to react with dGuo (20 mg) in 10 mL of 0.1 M phosphate buffer (pH 7) at 37 ºC overnight. The two diastereomeric products were purified by HPLC system 1 with the early eluting peak being (6S, 8S)-2 (20). Concentrations of (6S, 8S)-2 and (6R, 8R)-2 in standard solutions were determined by 1H NMR, using toluene as an internal standard. (6S, 8S)-2: UV λmax (ε) 260 nm (15600); (6R, 8R)-2: UV λmax (ε) 260 nm (15700). [15N5]2 was prepared the same way from [15N5]dGuo and quantified by UV at 254 nm: MS (Supporting Information Figure 1S) m/z (relative intensity) 343 [M+H]+ (100), 227 [BH]+ (8), 183 [BH-CH3CHO]+ (1). Yields were about 4.5% for (6S, 8S)-2, 5.9% for (6R, 8R)-2, 1.4% for (6S, 8S)-[15N5]2, and 2.2% for (6R, 8R)-[15N5]2. The amount of adduct 2 in [15N5]2, as determined by LC-MS, was less than 0.5%.
Human tissue samples
This study was approved by the University of Minnesota Research Subjects’ Protection Programs Institutional Review Board Human Subjects Committee. Twenty-three liver samples and 45 lung samples were obtained from The Cancer Center Tissue Procurement Facility. The samples were histologically confirmed as normal tissue, except one liver sample, which was identified as necrotic tissue. They were obtained at surgery, immediately frozen in liquid N2, and stored at −80 ºC until DNA isolation. Nine human buffy coat samples were obtained from ongoing studies in the University of Minnesota Transdisciplinary Tobacco Use Research Center, and 2 were obtained from Mid-South Regional Blood Center (Memphis, TN).
DNA Isolation
This was performed as previously described (21), following the “DNA Purification from 1 g Animal Tissue” protocol (Gentra Systems) with several modifications. Human liver or lung tissue samples (0.5 g) were homogenized with 10 mL Puregene cell lysis solution. After treating with RNase A and precipitating proteins, DNA was precipitated with 2-propanol. Then it was dissolved in 4 mL of 10 mM Tris-HCl/5 mM EDTA buffer (pH 7) and the mixture was extracted twice with 4 mL of CHCl3 containing 4% isoamyl alcohol. The DNA was precipitated from the aqueous phase by addition of 0.4 mL 5 M NaCl and 8 mL of ice-cold ethanol, washed three times with 3 mL of 70% ethanol and three times with 3 mL of 100% ethanol, and dried with a stream N2. DNA isolation from human buffy coat was performed similarly. The purity of the DNA was determined by measuring its UV absorption at 230, 260, and 280 nm. The ratios of A260:230 and A260:280 were greater than 2.0 and 1.7, respectively.
Analysis of DNA for Cro-dGuo (2)
For enzymatic hydrolysis, DNA (0.1 – 1.5 mg) was dissolved in 900 μL of 10 mM Tris-HCl/5 mM MgCl2 buffer to which 25 fmol of [15N5]2 was added as internal standard. It then was enzymatically hydrolyzed by adding 1326 units of DNase I (type II, from bovine pancreas), 0.06 unit of phosphodiesterase I (type II, from Crotalus adamanteus venom) and 375 units of alkaline phosphatase (from calf intestine). Enzymes were removed by centrifugation using a centrifree Amicon filter (MW cutoff of 30,000; Amicon, Beverly, MA). A 10 μL aliquot was removed for dGuo quantitation, and the remaining hydrolysate was purified using a solid phase extraction (SPE) cartridge [Strata-X, 33 μm, 30 mg/1 mL (Phenomenex)]. After loading the sample, the cartridge was washed with 1 mL H2O and 1 mL 15% CH3OH/H2O, and the analyte was eluted with 1 mL 70% CH3OH/H2O. The eluants were evaporated to dryness, and dissolved in 20 μL of H2O for LC-ESI-MS/MS analysis. A buffer control which lacked DNA was prepared each time and processed in the same way.
LC-ESI-MS/MS analysis was carried out with an Agilent 1100 capillary flow HPLC (Agilent Technologies, Palo Alto, CA) equipped with a 250 mm × 0.5 mm 5 μm particle size C18 column (Agilent Zorbax SB-C18) and coupled to either a Finnigan Quantum Ultra AM or Discovery Max (ThermoElectron, San Jose, CA) triple quadrupole mass spectrometer. The solvent elution program was a gradient from 5 to 40% CH3OH in 15 mM ammonium acetate buffer in 35 min at a flow rate of 10 μL/min at 30 ºC. The ESI source was set in the positive ion mode as follows: voltage, 3.7 kV; current, 3 μA; and heated ion transfer tube, 275 ºC. The adducts were analyzed by MS/MS using selected reaction monitoring (SRM). Ion transitions of m/z 338 → m/z 222 (adduct 2) and m/z 343 → m/z 227 ([15N5]2) with collision energy of 12 eV were used for quantitation and those of m/z 338 → m/z 178 (adduct 2) and m/z 343 → m/z 183 ([15N5]2) with collision energy of 32 eV were used for structural confirmation. Other MS parameters were optimized to achieve maximum signal intensity.
Calibration curves were constructed before each analysis using standard solutions of 2 and [15N5]2. A constant amount of [15N5]2 (10 fmol) was mixed with differing amounts of 2 (0.5 – 50 fmol) and analyzed by LC-ESI-MS/MS-SRM. The adduct levels were expressed as fmol per μmol dGuo.
Reaction of Cro-dGuo with NaOH and NaBH4
The eluant from SPE containing adduct 2 was dissolved in 1 mL of 0.5 N NaOH and an excess of NaBH4 was added. The resulting mixture was heated at 100 °C for 30 min, cooled, and neutralized with 1 N HCl. The mixture was loaded on another Strata-X SPE cartridge and washed with H2O to remove salts. The corresponding ring-opened products were eluted by 1 mL 70% CH3OH/H2O and analyzed by LC-ESI-MS/MS, with ion transitions of m/z 340 → m/z 224 (N2-(4-hydroxybut-2-yl)-dGuo) and m/z 345 → m/z 229 ([15N5]N2-(4-hydroxybut-2-yl)-dGuo).
Results
The internal standard for our analysis was [15N5]Cro-dGuo ([15N5]2), prepared by reacting crotonaldehyde with [15N5]dGuo. Both diastereomers were collected from HPLC and characterized by UV and LC-ESI-MS, and comparison to 2. LC-ESI-MS/MS-SRM chromatograms of adduct 2 (0.5 fmol) and [15N5]2 (10 fmol) are illustrated in Figure 1. The transitions monitored were m/z 338 → m/z 222 for adduct 2 and m/z 343 → m/z 227 for [15N5]2. A calibration curve was plotted for the concentration ratio vs the integrated peak area ratio of 2 to [15N5]2. The two diastereomeric products were integrated separately and linear responses were observed for each, as shown in Figure 2. They were also quantified separately for all the following samples analyzed.
Figure 1.
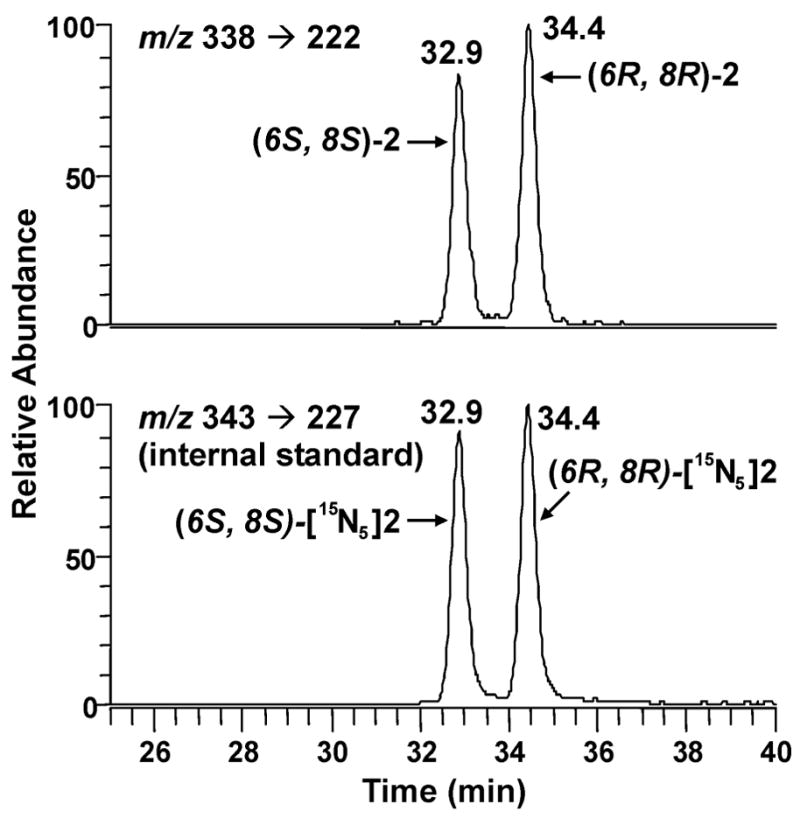
Chromatograms obtained upon LC-ESI-MS/MS analysis of 0.5 fmol standard Cro-dGuo (2) (top) and 10 fmol [15N5]Cro-dGuo ([15N5]2) (bottom). Peak areas were 4.9*104 for (6S, 8S)-2, 5.5*104 for (6R, 8R)-2, 1.1*106 for (6S, 8S)-[15N5]2, and 1.2*106 for (6R, 8R)-[15N5]2.
Figure 2.
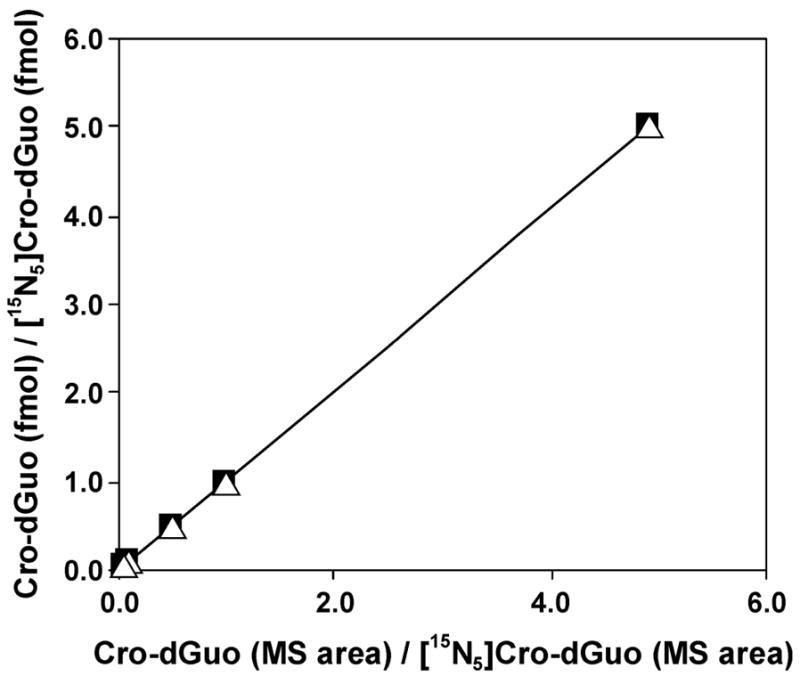
Calibration curves for Cro-dGuo (2, 0.5–50 fmol) and [15N5]Cro-dGuo ([15N5]2, 10 fmol): ■, (6S, 8S)-2, R2 = 1.0000;, ρ, (6R, 8R)-2, R2 = 1.0000.
DNA was enzymatically hydrolyzed in the presence of [15N5]2, and Cro-dGuo was enriched from the hydrolysate by SPE. The eluant containing adduct 2 was analyzed by LC-ESI-MS/MS-SRM. Chromatograms obtained upon analysis of untreated calf thymus DNA are shown in Figure 3 (Panel A). Peaks corresponding to the diastereomeric products were observed in both transitions of m/z 338 → m/z 222 and m/z 338 → m/z 178, and they coeluted with the internal standard peaks. The chromatogram clearly demonstrates the presence of adduct 2 in calf thymus DNA. No peaks were observed at this retention time in a buffer control which lacked the DNA (data not shown). Only the transition m/z 338 → m/z 222 was used for the quantitation, due to its higher signal intensity. To further investigate peak identity, eluants from SPE were treated with NaOH and NaBH4. Under these conditions, the cyclic Cro-dGuo adduct is known to undergo base-catalyzed ring-opening followed by reduction of the intermediate aldehyde, producing N2-(4-hydroxybut-2-yl)-dGuo (6), which has an [M+H]+ peak 2 units higher than adduct 2. The results of analysis of calf thymus DNA after the ring-opening reaction are shown in Figure 3 (Panel B). The disappearance of peaks corresponding to m/z 338 → m/z 222 and appearance of peaks at m/z 340 → m/z 224 indicate the formation of N2-(4-hydroxybut-2-yl)-dGuo from adduct 2. Taken together, these data establish the structure of the peaks observed in Figure 3A as Cro-dGuo.
Figure 3.

Chromatograms obtained upon LC-ESI-MS/MS analysis of calf thymus DNA. Calf thymus DNA was enzymatically hydrolyzed, purified by SPE, and analyzed (panel A); or the eluants from SPE were treated with NaOH and NaBH4 and analyzed (panel B). Transitions of m/z 340 → m/z 224 and m/z 345 → m/z 229 correspond to the ring-opened products of the analyte and internal standard, N2-(4-hydroxybut-2-yl)dGuo and [15N5]N2-(4-hydroxybut-2-yl)dGuo, respectively. The early eluting peak was produced from (6R, 8R)-2 and the late eluting peak from (6S, 8S)-2.
Accuracy and precision were determined by adding 2 to calf thymus DNA and analyzing multiple samples. The results are summarized in Figure 4, which shows a good agreement between expected and measured values, and coefficients of variation (CV) ranged from 3% to 24%. In other experiments, two different calf thymus DNA samples with low or medium adduct levels were each analyzed in six replicates per day for two separate days. The interday and intraday CVs were summarized in Table 1. The limit of quantitation (LOQ) for pure standard 2 was 0.2 fmol injected on column, determined by signal-to-noise ratio (S/N) over 10 as well as a linear response of MS area vs the amount injected, while the LOD was 0.05 fmol with S/N of 3. In DNA samples, the LOQ was achieved with 2.5 fmol in 1 mg of DNA with S/N over 10. This equals a concentration of 4 fmol/μmol dGuo, corresponding to about 1 adduct per 109 normal nucleotides. The LOD in DNA was estimated as 1.5 fmol/μmol dGuo under the same conditions, with S/N of 3. A matrix effect was observed, which suppresses the signal in MS analysis by 2–3 fold when using DNA in the analysis compared with pure standards. However, the suppression was not significantly higher when using more DNA. The recovery of 25 fmol of internal standard during sample processing was 73% for (6S, 8S)-[15N5]2 and 71% for (6R, 8R)-[15N5]2.
Figure 4.

Relationship of added to detected Cro-dGuo (2). Various amounts of standard adduct 2 were added to calf thymus DNA (0.91 mg) containing [15N5]2 and analyzed by the method described in the text. Adduct 2 in calf thymus DNA [9.80 fmol/mg DNA for (6S, 8S)-2 and 8.49 fmol/mg DNA for (6R, 8R)-2] was subtracted from each amount detected. Each point represents a triplicate measurement. A, (6S, 8S)-2, R2 = 0.9986; B, (6R, 8R)-2, R2 = 1.0000.
Table 1.
Precision of the LC-ESI-MS/MS method for Cro-dGuo in DNA
| Cro-dGuo levels (fmol/μmol dGuo)a (CV, %) (n=6) |
Interday variation
CV, % |
|||||
|---|---|---|---|---|---|---|
| Day 1 | Day 2 | |||||
| Samples | (6S, 8S) | (6R, 8R) | (6S, 8S) | (6R, 8R) | (6S, 8S) | (6R, 8R) |
| Calf thymus DNA 1 | 18.8 ± 2.2 (12%) | 16.6 ± 1.9 (11%) | 19.7 ± 3.6 (18%) | 17.7 ± 3.2 (18%) | 3.3 | 4.5 |
| Calf thymus DNA 2 | 4.58 ± 0.67 (15%) | 5.22 ± 0.22 (4.2%) | 4.91 ± 0.32 (6.5%) | 5.45 ± 0.33 (6.1%) | 5.4 | 3.0 |
0.8 – 1.2 mg of DNA was used for each analysis.
Twenty-three DNA samples from human liver, 45 from human lung and 11 from human white blood cells were analyzed. The results are summarized in Table 2 (more detailed data can be found in Supporting Information Table 1S). Adduct 2 was found in 4 human liver DNA samples and 16 lung DNA samples, but was not detected in blood DNA. Figure 5 shows selected chromatograms from these analyses. Panel A shows the chromatogram of a liver DNA sample in which 2 was not detected. When 2 fmol of each diastereomer of adduct 2 standard was added to this liver DNA sample, the chromatogram shown in Panel B was obtained, demonstrating detection of two diastereomers of adducts 2. The adduct levels calculated in this sample were 1.93 fmol and 2.03 fmol for (6S, 8S)-2 and (6R, 8R)-2, respectively, consistent with the amount added. Panels C and D illustrate the chromatograms of liver and lung DNA samples which were positive for adduct 2. The levels of Cro-dGuo in human liver DNA range from 3.52 – 10.6 fmol/μmol dGuo for (6S, 8S)-2, and 3.83 – 14.1 fmol/μmol dGuo for (6R, 8R)-2, with mean values at 6.70 and 7.87 fmol/μmol dGuo respectively. The levels of Cro-dGuo in human lung DNA range from 1.65 – 17.1 fmol/μmol dGuo for (6S, 8S)-2, and 2.93 – 30.4 fmol/μmol dGuo for (6R, 8R)-2, with mean values at 7.19 and 12.8 fmol/μmol dGuo respectively. Some of the lung DNA samples positive for adduct 2 were also analyzed using the transition of m/z 338 → m/z 178. This gave chromatograms similar to that shown in Figure 3 (panel A), supporting the identity of adduct 2. One of the blood DNA samples was spiked with 2 fmol or 5 fmol of adduct 2 and analyzed using our method. The levels detected were also consistent with the amount added (data not shown).
Table 2.
Levels of Cro-dGuo in DNA from human liver, lung, and blood.
| Tissue | No. of samples analyzed | No. of samples in which Cro-dGuo were detected | Cro-dGuo levels (fmol/μmol dGuo)a |
Amount of DNA analyzedb (mg) | |
|---|---|---|---|---|---|
| (6S, 8S)-2 | (6R, 8R)-2 | ||||
| Liver | 23 | 4 | 6.50 | 14.1 | 0.48 |
| 3.52 | 3.83 | 0.32 | |||
| 6.19 | 5.69 | 0.58 | |||
| 10.6 | 7.84 | 0.89 | |||
|
|
|||||
| Mean ± SD | 6.70 ± 2.92 | 7.87 ± 4.47 | |||
|
| |||||
| Lung | 45 | 16 | 10.1 | 11.0 | 0.73 |
| 3.14 | 5.69 | 0.56 | |||
| 5.24 | 9.41 | 0.46 | |||
| 17.1 | 30.4 | 0.11 | |||
| 10.5 | 17.8 | 0.34 | |||
| 7.18 | 10.6 | 0.69 | |||
| 7.79 | 15.3 | 0.39 | |||
| 5.73 | 9.57 | 1.61 | |||
| 3.61 | 6.51 | 1.37 | |||
| 7.87 | 16.9 | 0.18 | |||
| 13.0 | 21.3 | 0.32 | |||
| 9.27 | 23.0 | 0.26 | |||
| 4.47 | 13.3 | 0.64 | |||
| 6.40 | 7.79 | 1.45 | |||
| 1.65 | 2.93 | 0.60 | |||
| 1.99 | 3.30 | 0.92 | |||
|
|
|||||
| Mean ± SD | 7.19 ± 4.14 | 12.8 ± 7.6 | |||
|
| |||||
| Blood | 11 | 0 | NAc | NA | |
Not including those samples in which Cro-dGuo was not detected. Each value was from a single measurement.
Determined by amount of dGuo released upon enzymatic hydrolysis.
NA, not applicable.
Figure 5.

Chromatograms obtained upon LC-ESI-MS/MS-SRM analysis of DNA from human liver and lung. A and C, DNA from human liver; B, DNA from the same human liver as in A, to which 2 fmol of each diastereomer of Cro-dGuo was added; D, DNA from human lung.
Discussion
We have developed a sensitive and specific method to detect and quantify Cro-dGuo adducts in DNA from human tissues. This method is based on enzymatic hydrolysis of isolated DNA to deoxyribonucleosides, followed by SPE and LC-ESI-MS/MS. The identity of the CrodGuo adducts is supported by clear peaks which were observed for both the [BH]+ and [BHCH3CHO]+ transitions of the analyte and the internal standard. These peaks did not exist in control samples without DNA. These fragments, corresponding to the loss of 2′-deoxyribose and an additional loss of one acetaldehyde moiety, are characteristic of Cro-dGuo adducts. In the case of calf thymus DNA, treatment of the hydrolysates with NaOH and NaBH4 caused these peaks to disappear and two peaks with the transitions of m/z 340 → m/z 224 and m/z 345 → m/z 229 were observed. These peaks correspond to the base-catalyzed ring-opening and reduction products of 2 and [15N5]2. These results are consistent with the known properties of adduct 2 (6).
The specificity and sensitivity of the methods are attributable to the use of MS/MS in the SRM mode (22). Specificity of SRM results from monitoring of a characteristic fragmentation of the molecule, while the sensitivity is enhanced because of decreased background signal. Several studies indicate that SRM can lower the LOD by more than 200 fold compared with selected ion monitoring (23, 24). In our method, the LOQ was as low as 0.2 fmol for pure standard loaded on column and a concentration of 4 fmol/μmol dGuo for adduct 2 in DNA starting with 1 mg of DNA, while the LOD is even lower. This sensitivity is comparable to 32P-postlabeling method (reported as 0.1 fmol in 50 μg of DNA by Chung, et al. (25), which equals a concentration at about 3 fmol/μmol dGuo), and is suitable for in vivo studies and analysis of human tissue DNA. The accuracy and precision of the method were confirmed by analyzing calf thymus DNA spiked with varying amounts of adduct 2.
Previous studies by Chung, Nath and co-workers using 32P-postlabeling coupled with HPLC reported the detection of Cro-dGuo in various human tissues (25–27). Cro-dGuo was found in all DNA samples analyzed by this method, including 5 from liver, 3 from blood, and 23 from oral tissue (12 non-smokers and 11 smokers). However, in our study, the Cro-dGuo adducts were detected in only 4 of 23 liver DNA samples, and 16 of 45 lung samples, and were not detected in any of the 11 blood samples. The discrepancy may in part result from differences in background exposures and repair efficiency of those individuals. Also, because the 32P-postlabeling analysis does not have an internal standard, it may not be able to give quantitative results. However, such differences still need further study. Another study by Schuler and Eder (17, 18) used a 32P-postlabeling method coupled with TLC and did not detect Cro-dGuo adducts in liver DNA of untreated Fischer 344 rats. In contrast, Nath and Chung (27) found the adducts in liver DNA of untreated Fischer 344 rats in relatively high levels in the range of 2.2–22 adducts per 108 nucleotides. More recently, Chung et al. (28) developed a modified 32P-postlabeling method for the analysis of various PdG adducts including Cro-dGuo. This method featured conversion of the adducts to the ring-opened derivatives for confirmation of identity, followed by radioflow HPLC for separation and quantitation. This method was more specific than conventional 32P-postlabeling methods, and they detected Cro-dGuo adducts in Long Evans rat liver DNA. However, no human studies were reported.
In our study, Cro-dGuo adducts were detected more frequently in human lung DNA than in liver DNA, and no adducts were detected in blood. All of the lung DNA samples came from self-reported smokers, categorized as either “current or past”. For the ‘current smokers’, we do not know if they may have stopped smoking days or weeks prior to surgery. We have no information on the smoking status of the subjects who donated the liver samples. And those individuals providing blood samples included 5 smokers and 6 non-smokers. It is likely that tobacco use is responsible at least in part for the higher frequency of Cro-dGuo adducts in lung, but this requires further study. Endogenous sources, such as lipid peroxidation, may also contribute to the presence of these adducts in human tissues (2, 29). Recent studies by Gupta and co-workers (30) used a 32P-postlabeling/TLC system to investigate DNA adducts in lung tissue of smokers. They found that cigarette smoke-associated lung DNA adducts, which are present on the chromatograms as diagonal radioactive zones, were not due to polycyclic aromatic hydrocarbons or aromatic amines. Rather, they were likely associated with aldehydederived DNA adducts, such as those from formaldehyde, acetaldehyde, and crotonaldehyde. Our results indicate that Cro-dGuo adducts, as detected in some of our human lung samples, may contribute to those aldehyde-derived adducts present in smokers’ lung DNA.
One limitation of our method is that it requires a relatively large amount of DNA, typically 0.5 – 1 mg, to achieve the desired sensitivity. Although the typical yield of DNA from 0.5 g of solid tissue or 3 mL of buffy coat is around 0.5 mg, the yield varies significantly depending on each sample. Also, in most cases, the amount of tissue available is limited. In some of our liver and lung samples, the amount of DNA analyzed was small. It is possible that if we had more DNA available, we might have detected more positive samples. An alternative solution would be to increase the instrument’s sensitivity. Recently, nanoelectrospray MS was introduced for the analysis of DNA adducts (31, 32). When coupled with a nanoflow HPLC, the flow rate is decreased to <500 nL per min. This increases the peak concentration and also results in better ionization and transfer efficiency (33), thereby increasing sensitivity (31, 32). As a result, lower levels of adducts might be detected, or with the same concentrations of the adducts, less DNA will be needed. These improvements will be important for the analysis of DNA adducts in humans. Using nanoelectrospray MS, Lynn and co-workers detected exocyclic PdG adducts derived from acrolein (31) and trans-4-hydroxy-2-nonenal (32) in human brain tissue, using only 1–2 μg of DNA. The LOQ of these adducts was 40–50 adducts/109 normal nucleosides, starting with 10 μg of DNA (31, 32). In addition, derivatizing agents have been used for those adducts that undergo ring-opening in DNA. Swenberg’s group (34) developed a novel method for the measurement of pyrimido[1,2-α]purin-10(3H)one (M1G). By using aldehyde reactive probe labeling and liquid chromatography tandem mass spectrometry, this method overcame the loss of adducts because of the reaction of the ring-opened form with amines or proteins, and enhanced the separation of the adduct conjugates from normal nucleotides. Considering the similar properties of Cro-dGuo adducts in DNA, this approach might be useful to further increase sensitivity.
Our current method has only detected Cro-dGuo adducts in human liver and lung. For diagnostic purposes, liver and lung are not good sources of DNA. Although Cro-dGuo adducts were not detected in any of the blood samples we analyzed, these adducts are not precluded from being used as a tool for risk assessment. Bronchial brushings and exfoliated oral cells are also potential sources of DNA. With appropriate improvement of the method, it could be feasible to use these sources of DNA, as well as blood DNA, to investigate the potential role of these adducts in human carcinogenesis.
In summary, we have developed a sensitive and specific MS method to quantify the cyclic Cro-dGuo adducts in human tissues. Our results demonstrate the presence of Cro-dGuo adducts in some of the human liver and lung DNA samples analyzed, with a higher frequency in human lung DNA, while no adducts were detected in blood. These adducts may result from both endogenous and exogenous exposures. The more frequent detection of the Cro-dGuo adducts in lung than the other tissues analyzed is potentially important and requires further study.
Supplementary Material
Acknowledgments
This study was supported by Grant ES-11297 from the National Institute of Environmental Health Sciences. S.S.H. is an American Cancer Society Research Professor, supported by Grant RP-00-138. Mass spectrometry was carried out in the Analytical Biochemistry Core Facility of The Cancer Center, supported in part by Cancer Center Support Grant CA-77598. We thank Yanbin Lao for assistance in NMR experiments, and Bob Carlson for assistance in manuscript preparation.
Footnotes
Abbreviations Cro-dGuo, (6S, 8S)- and (6R, 8R)-3-(2′-deoxyribos-1′-yl)-5,6,7,8-tetrahydro-8-hydroxy-6-methylpyrimido[1,2-a]purine-10(3H)one; LC-ESI-MS/MS, liquid chromatography-electrospray ionization-tandem mass spectrometry; LOD, limit of detection; LOQ, limit of quantitation; PdG, 1,N2-propanodeoxyguanosine; SPE, solid phase extraction; SRM, selected reaction monitoring.
References
- 1.International Agency for Research on Cancer. IARC Monographs on the Evaluation of Carcinogenic Risks to Humans. Vol. 63. IARC; Lyon, France: 1995. Dry cleaning, some chlorinated solvents and other industrial chemicals; pp. 373–391. [PMC free article] [PubMed] [Google Scholar]
- 2.Chung FL, Chen HJ, Nath RG. Lipid peroxidation as a potential endogenous source for the formation of exocyclic DNA adducts. Carcinogenesis. 1996;17:2105–2111. doi: 10.1093/carcin/17.10.2105. [DOI] [PubMed] [Google Scholar]
- 3.Wang MY, Chung FL, Hecht SS. Identification of crotonaldehyde as a hepatic microsomal metabolite formed by α-hydroxylation of the carcinogen N-nitrosopyrrolidine. Chem Res Toxicol. 1988;1:28–31. doi: 10.1021/tx00001a005. [DOI] [PubMed] [Google Scholar]
- 4.Neudecker T, Eder E, Deininger C, Henschler D. Crotonaldehyde is mutagenic in Salmonella typhimurium TA100. Environ Mol Mutagen. 1989;14:146–148. doi: 10.1002/em.2850140303. [DOI] [PubMed] [Google Scholar]
- 5.Chung FL, Tanaka T, Hecht SS. Induction of liver tumors in F344 rats by crotonaldehyde. Cancer Res. 1986;46:1285–1289. [PubMed] [Google Scholar]
- 6.Chung FL, Young R, Hecht SS. Formation of cyclic 1,N2-propanodeoxyguanosine adducts in DNA upon reaction with acrolein or crotonaldehyde. Cancer Res. 1984;44:990–995. [PubMed] [Google Scholar]
- 7.Wang M, McIntee EJ, Cheng G, Shi Y, Villalta PW, Hecht SS. Identification of DNA adducts of acetaldehyde. Chem Res Toxicol. 2000;13:1149–1157. doi: 10.1021/tx000118t. [DOI] [PubMed] [Google Scholar]
- 8.International Agency for Research on Cancer. IARC Monographs on the Evaluation of the Carcinogenic Risk of Chemicals to Humans. Vol. 71. IARC; Lyon, France: 1999. Reevaluation of some organic chemicals, hydrazine and hydrogen peroxide (part two) pp. 319–335. [PMC free article] [PubMed] [Google Scholar]
- 9.U. S. Department of Health and Human Services. Report on Carcinogens. Vol. 11. U.S. Department of Health and Human Services; Research Triangle Park, NC: 2004. pp. III-1–III-3. [Google Scholar]
- 10.Wang M, McIntee EJ, Cheng G, Shi Y, Villalta PW, Hecht SS. Identification of paraldol-deoxyguanosine adducts in DNA reacted with crotonaldehyde. Chem Res Toxicol. 2000;13:1065–1074. doi: 10.1021/tx000095i. [DOI] [PubMed] [Google Scholar]
- 11.Cho YJ, Wang H, Kozekov ID, Kurtz AJ, Jacob J, Voehler M, Smith J, Harris TM, Lloyd RS, Rizzo CJ, Stone MP. Stereospecific formation of interstrand carbinolamine DNA cross-links by crotonaldehyde- and acetaldehyde-derived α-CH3-γ-OH-1,N2-propano-2′-deoxyguanosine adducts in the 5′-CpG-3′ sequence. Chem Res Toxicol. 2006;19:195–208. doi: 10.1021/tx050239z. [DOI] [PMC free article] [PubMed] [Google Scholar]
- 12.Kozekov ID, Nechev LV, Moseley MS, Harris CM, Rizzo CJ, Stone MP, Harris TM. DNA interchain cross-links formed by acrolein and crotonaldehyde. J Am Chem Soc. 2003;125:50–61. doi: 10.1021/ja020778f. [DOI] [PubMed] [Google Scholar]
- 13.Kurtz AJ, Lloyd RS. 1,N2-deoxyguanosine adducts of acrolein, crotonaldehyde, and trans-4-hydroxynonenal cross-link to peptides via Schiff base linkage. J Biol Chem. 2003;278:5970–5976. doi: 10.1074/jbc.M212012200. [DOI] [PubMed] [Google Scholar]
- 14.Stein S, Lao Y, Yang I, Hecht SS, Moriya M. Genotoxicity of acetaldehyde- and crotonaldehyde-induced 1,N2-propanodeoxyguanosine DNA adducts in human cells. Mutat Res. 2006 doi: 10.1016/j.mrgentox.2006.01.009. in press. [DOI] [PubMed] [Google Scholar]
- 15.Fernandes PH, Kanuri M, Nechev LV, Harris TM, Lloyd RS. Mammalian cell mutagenesis of the DNA adducts of vinyl chloride and chrotonaldehyde. Environ Mol Mutagen. 2005;45:455–459. doi: 10.1002/em.20117. [DOI] [PubMed] [Google Scholar]
- 16.Chung FL, Nath RG, Nagao M, Nishikawa A, Zhou GD, Randerath K. Endogenous formation and significance of 1,N2-propanodeoxyguanosine adducts. Mutat Res. 1999;424:71–81. doi: 10.1016/s0027-5107(99)00009-3. [DOI] [PubMed] [Google Scholar]
- 17.Budiawan Schuler D, Eder E. Development of a 32P-postlabelling method for the detection of 1,N2-propanodeoxyguanosine adducts of crotonaldehyde in vivo. Arch Toxicol. 2000;74:404–414. doi: 10.1007/s002040000142. [DOI] [PubMed] [Google Scholar]
- 18.Budiawan, Eder E. Detection of 1,N2-propanodeoxyguanosine adducts in DNA of Fischer 344 rats by an adapted 32P-post-labeling technique after per os application of crotonaldehyde. Carcinogenesis. 2000;21:1191–1196. [PubMed] [Google Scholar]
- 19.Inagaki S, Esaka Y, Deyashiki Y, Sako M, Goto M. Analysis of DNA adducts of acetaldehyde by liquid chromatography-mass spectrometry. J Chromatogr A. 2003;987:341–347. doi: 10.1016/s0021-9673(02)01948-9. [DOI] [PubMed] [Google Scholar]
- 20.Nechev LV, Kozekov I, Harris CM, Harris TM. Stereospecific synthesis of oligonucleotides containing crotonaldehyde adducts of deoxyguanosine. Chem Res Toxicol. 2001;14:1506–1512. doi: 10.1021/tx0100690. [DOI] [PubMed] [Google Scholar]
- 21.Wang M, Yu N, Chen L, Villalta PW, Hochalter JB, Hecht SS. Identification of an acetaldehyde adduct in human liver DNA and quantitation as N2-ethyldeoxyguanosine. Chem Res Toxicol. 2006;19:319–324. doi: 10.1021/tx0502948. [DOI] [PMC free article] [PubMed] [Google Scholar]
- 22.Cadet J, Douki T, Frelon S, Sauvaigo S, Pouget JP, Ravanat JL. Assessment of oxidative base damage to isolated and cellular DNA by HPLC-MS/MS measurement. Free Radic Biol Med. 2002;33:441–449. doi: 10.1016/s0891-5849(02)00820-1. [DOI] [PubMed] [Google Scholar]
- 23.Ravanat JL, Duretz B, Guiller A, Douki T, Cadet J. Isotope dilution high-performance liquid chromatography-electrospray tandem mass spectrometry assay for the measurement of 8-oxo-7,8-dihydro-2′-deoxyguanosine in biological samples. J Chromatogr B Biomed Sci Appl. 1998;715:349–356. doi: 10.1016/s0378-4347(98)00259-x. [DOI] [PubMed] [Google Scholar]
- 24.Liao PC, Li CM, Hung CW, Chen SH. Quantitative detection of N7-(2-hydroxyethyl)guanine adducts in DNA using high-performance liquid chromatography/electrospray ionization tandem mass spectrometry. J Mass Spectrom. 2001;36:336–343. doi: 10.1002/jms.132. [DOI] [PubMed] [Google Scholar]
- 25.Nath RG, Ocando JE, Chung FL. Detection of 1, N2-propanodeoxyguanosine adducts as potential endogenous DNA lesions in rodent and human tissues. Cancer Res. 1996;56:452–456. [PubMed] [Google Scholar]
- 26.Nath RG, Ocando JE, Guttenplan JB, Chung FL. 1,N2-propanodeoxyguanosine adducts: potential new biomarkers of smoking-induced DNA damage in human oral tissue. Cancer Res. 1998;58:581–584. [PubMed] [Google Scholar]
- 27.Nath RG, Chung FL. Detection of exocyclic 1,N2-propanodeoxyguanosine adducts as common DNA lesions in rodents and humans. Proc Natl Acad Sci U S A. 1994;91:7491–7495. doi: 10.1073/pnas.91.16.7491. [DOI] [PMC free article] [PubMed] [Google Scholar]
- 28.Pan J, Davis W, Trushin N, Amin S, Nath RG, Salem N, Jr, Chung FL. A solid-phase extraction/high-performance liquid chromatography-based 32P-postlabeling method for detection of cyclic 1,N2-propanodeoxyguanosine adducts derived from enals. Anal Biochem. 2006;348:15–23. doi: 10.1016/j.ab.2005.10.011. [DOI] [PubMed] [Google Scholar]
- 29.Pan J, Chung FL. Formation of cyclic deoxyguanosine adducts from omega-3 and omega-6 polyunsaturated fatty acids under oxidative conditions. Chem Res Toxicol. 2002;15:367–372. doi: 10.1021/tx010136q. [DOI] [PubMed] [Google Scholar]
- 30.Arif JM, Dresler C, Clapper ML, Gairola CG, Srinivasan C, Lubet RA, Gupta RC. Lung DNA adducts detected in human smokers are unrelated to typical polyaromatic carcinogens. Chem Res Toxicol. 2006;19:295–299. doi: 10.1021/tx0502443. [DOI] [PubMed] [Google Scholar]
- 31.Liu X, Lovell MA, Lynn BC. Development of a method for quantification of acrolein-deoxyguanosine adducts in DNA using isotope dilution-capillary LC/MS/MS and its application to human brain tissue. Anal Chem. 2005;77:5982–5989. doi: 10.1021/ac050624t. [DOI] [PubMed] [Google Scholar]
- 32.Liu X, Lovell MA, Lynn BC. Detection and quantification of endogenous cyclic DNA adducts derived from trans-4-hydroxy-2-nonenal in human brain tissue by isotope dilution capillary liquid chromatography nanoelectrospray tandem mass spectrometry. Chem Res Toxicol. 2006;19:710–718. doi: 10.1021/tx0502903. [DOI] [PubMed] [Google Scholar]
- 33.Wilm M, Mann M. Analytical properties of the nanoelectrospray ion source. Anal Chem. 1996;68:1–8. doi: 10.1021/ac9509519. [DOI] [PubMed] [Google Scholar]
- 34.Jeong YC, Sangaiah R, Nakamura J, Pachkowski BF, Ranasinghe A, Gold A, Ball LM, Swenberg JA. Analysis of M1G-dR in DNA by aldehyde reactive probe labeling and liquid chromatography tandem mass spectrometry. Chem Res Toxicol. 2005;18:51–60. doi: 10.1021/tx049853l. [DOI] [PubMed] [Google Scholar]
Associated Data
This section collects any data citations, data availability statements, or supplementary materials included in this article.