Abstract
Solution NMR spectroscopy represents a powerful tool for examining the structure and function of biological macromolecules. The advent of multidimensional (2D–4D) NMR, together with the widespread use of uniform isotopic labeling of proteins and RNA with the NMR-active isotopes, 15N and 13C, opened the door to detailed analyses of macromolecular structure, dynamics and interactions of smaller macromolecules (< ~25 kDa). Over the past 10 years, advances in NMR and isotope labeling methods have expanded the range of NMR-tractable targets by at least an order of magnitude. Here we briefly describe the methodological advances that allow NMR spectroscopy of large macromolecules and their complexes, and provide a perspective on the wide range of applications of NMR to biochemical problems.
Solution NMR spectroscopy represents a powerful tool for examining the structure and function of biological macromolecules. The advent of multidimensional (2D–4D) NMR, together with the widespread use of uniform isotopic labeling of proteins and RNA with the NMR-active isotopes, 15N and 13C, opened the door to detailed analyses of macromolecular structure, dynamics and interactions of smaller macromolecules (< ~25 kDa). Work on these proteins and nucleic acids has been very fruitful and allowed us to learn much about structure–function relationships, but is inherently limitied, as the majority of macromolecular complexes of biochemical interest are significantly larger than 25 kDa. Indeed, although much can be learned by examining macromolecules in isolation, mechanistic insights are often only gained upon studying functional higher-order assemblies with partner molecules.
NMR studies of large molecules and complexes are complicated by the increased linewidths associated with slower tumbling, and the spectral overlap from the large number of unique signals. Over the past 10 years, advances in NMR and isotope labeling methods have expanded the range of NMR-tractable targets by at least an order of magnitude (for recent reviews, see (1, 2)). Here we briefly describe the methodological advances that allow NMR spectroscopy of large macromolecules and their complexes, and provide a perspective on the wide range of applications of NMR to biochemical problems.
Overcoming Size Limitations: Narrow Lines and Simple Spectra
The slow tumbling of larger macromolecules in solution leads to faster relaxation of transverse magnetization (short T2) due to enhanced spin-spin interactions. One simple, albeit limited, solution to this problem is to increase the overall molecular tumbling rate by recording NMR spectra at elevated temperatures. This can be highly effective for thermostable macromolecules, with the caveat that behavior at physiological temperatures should be obtained by extrapolation (3–6). Another ingenious approach to reduce tumbling rates involves encapsulating hydrated proteins in low-viscosity solvents (7); while promising, this approach has not yet met with widespread use, as the encapsulation process is technically challenging and system dependent.
A generally applicable approach to minimizing spin-spin interactions that lead to fast T2 relaxation is to dilute the 1H spins through uniform deuteration (8, 9). The approach is straightforward, requiring only that the protein be produced in cultures grown on deuterated media (typically, 2H2O and 2H-glucose, and 15N-ammonium as the nitrogen source). Then, upon transferring the protein into protonated solvents (i.e., 1H2O), the exchangeable protons on the amides will be observed in a 1H-15N heteronuclear correlation spectrum, without being broadened by spin-spin interactions with carbon-bound protons. The benefits of uniform deuteration are offset for some purposes by the fact that much of the macromolecule becomes “signal silent,” thereby prohibiting detailed structural analysis. However, alternative labeling protocols involving the use of metabolic precursors allows for selective protonation of specific groups (e.g., methyls), allowing these to be monitored in concert with the backbone amides (9–11). Because methyl groups are usually localized in the hydrophobic cores of proteins, connecting secondary structures elements, such perdeuterated/selectively methyl-protonated samples make it possible to obtain highly informative distance restrains while still benefiting from the advantages of reduced spin-spin relaxation (12, 13).
An important methodological advance has been the development of TROSY-based NMR techniques (TROSY: Transverse Relaxation Optimized SpectroscopY) (14), which directly address the linewidth problem through spin manipulation. Briefly, in conventional heteronuclear correlation spectra (e.g., a heteronuclear COSY, or HSQC (15)), correlations between spins (e.g., an 15N nucleus and its attached 1H) are obtained by making using of the scalar (J) coupling between them. These scalar couplings cause splitting of the signals from each nucleus into a series of “multiplet components” with different relaxation properties. To increase sensitivity and avoid the complexity resulting from having multiple peaks from each correlation of interest, the splittings are usually refocused (“decoupled”) in HSQC spectra so that only a single signal is obtained for each 1H-15N pair; as a consequence, relaxation properties are averaged among the multiplet components. The TROSY breakthrough came from the realization that for slower tumbling molecules, narrow lines and higher sensitivity could be obtained by retaining only the slower relaxing component of the multiplet, while discarding the other, faster-relaxing components. The resulting TROSY spectra exhibit higher sensitivity, narrow lines and the simplicity of a decoupled spectrum, but the signals are offset from the “isotropic” chemical shift by one-half the one-bond coupling constant (~90 Hz for the amide H-N). This TROSY principle has been incorporated into the broad range of NMR pulse sequences commonly used for macromolecules (reviewed in (2)).
As mentioned above, the second obstacle to NMR of large macromolecules and assemblies is that the number of signals increases with molecular weight; this complexity increases the likelihood of resonance overlap, making it difficult to obtain site-specific information. For many proteins, the overlap problem is not as onerous as one might expect, as analysis of genomic data suggest that the majority of proteins assemble into symmetrical oligomeric structures (15). Because of the molecular symmetry, corresponding nuclei from each monomer (“protomer”) have equivalent environments and contribute to a mutual signal. Thus, spectra from such large oligomeric complexes have only the complexity of the protomer. Nevertheless, if the spectra are too complex, an emerging approach to simplifying the NMR spectra is to make use of protein (16) and RNA (17) splicing methods that allow for “segmental labeling” of specific regions of a protein or RNA with NMR active isotopes. Because signals are not observed for the unlabeled segments of the molecules, this approach simplifies the NMR spectra without the loss of context that comes from studying an isolated domain.
Mapping Binding Interfaces
One of the most common applications of biomolecular NMR spectroscopy involves identifying the recognition determinants between macromolecules and their ligands (for some recent reviews, see (18–20)). Revelation of these specificity determinants is critical for understanding and manipulating signal transduction networks, disease-related enzymes, patterns of gene expression, and the whole host of macromolecule-mediated biological process. Unfortunately, deciphering the structural details of these interactions de novo is generally time consuming, expensive, and tractable only for a few tightly interacting partners, while many biologically relevant interactions are necessarily weak to ensure reversibility. NMR spectroscopy can often be applied to such systems to quickly determine the binding interface of interacting partners without the need for de novo structure determination. Importantly, these methods are often applicable for both strong and weak interacting systems and can be applied to large macromolecular complexes (≥300 kDa).
Spectral perturbation mapping
The resonance frequency (chemical shift) of an NMR-active nucleus is determined by its local electronic environment. Importantly, when the electronic environment of a nucleus is changed by some intra- or intermolecular event, the chemical shift of the nucleus will change. Because of this, the chemical shifts of protons (and other nuclei) in ligand binding interfaces of macromolecules are exquisitely sensitive to the binding event and can be used to monitor binding and identify the interacting structural motifs. Spectral perturbations are manifested in one of two ways: a “shift” in the resonance frequency, or site-specific signal broadening due to intermediate exchange. Analysis of these spectral perturbations in a site-specific manner is commonly referred to as “chemical shift mapping” (18–20).
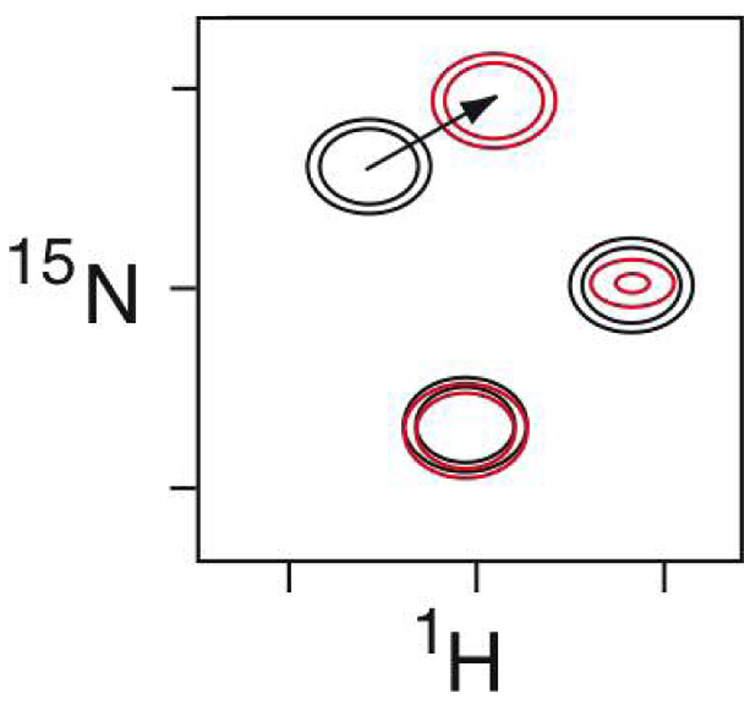
Spectral perturbations are usually identified by recording two-dimensional heteronuclear correlation spectra (e.g., HSQC (21) or TROSY (14)) of free and ligand-bound macromolecules (Figure 1). To obtain the binding interfaces of two interacting proteins for which resonance assignments are available, the experiment must be repeated with the labeling scheme reversed. For tightly binding molecules (KD ≤ 10 µM), their complexes must yield interpretable NMR spectra. On the other hand, for weakly associating ligands, spectral perturbations caused by binding are observed on the spectrum of the free molecule, removing size as a consideration for one of the binding partners (18–20).
Figure 1.
Schematic of a spectral perturbation mapping experiment. Shown is the overlay of two 2D heteronuclear 1H-15N correlated NMR spectra of an 15N-labeled protein, in absence (black) and presence (red) of its ligand. The signals in these spectra are dominated by the backbone amides of the protein, and thus each peak corresponds to an individual amino acid. Note that one of the signals is unaffected by the presence of the ligand. The other two peaks are implicated as being in the intermolecular interface by the perturbations produced by the ligand: either a shift in the position (chemical shift) of the signal, or broadening and reduced intensity through enhanced relaxation.
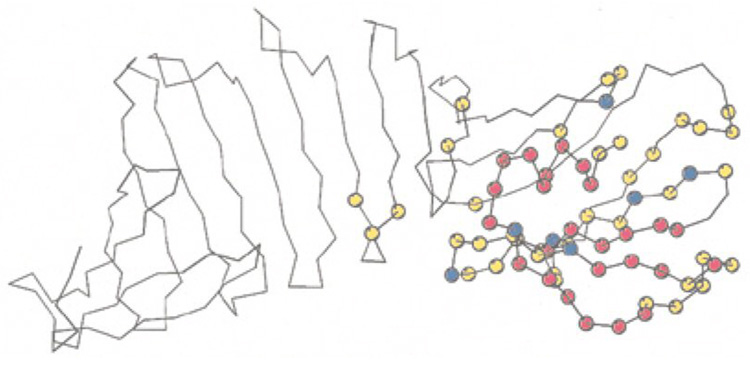
Analysis of binding-induced spectral perturbations has proven useful for mapping macromolecular interactions in many large macromolecular complexes. For instance, NMR studies of the outer surface protein A (OspA) of the Lyme disease-causing spirochete, Borrelia burgdorferi, in a 78 kDa complex with the Fab domain of a monoclonal antibody of clinical interest identified the residues in OspA that form the epitope recognized by the antibody (22). These data provided the basis for rational design of vaccines against Lyme disease (Figure 2). Although standard correlation spectroscopy was used (HSQC), interpretable NMR spectra were obtained by deuteration of the OspA protein and by recording spectra at elevated temperatures to increase the molecular tumbling rate.
Figure 2.
OspA antigen identified from spectral perturbations. Amino acid residues of the Borrelia burgdorferi OspA protein whose backbone amide resonances are affected by binding to a clinically important antibody are highlighted as spheres. Red indicates residues strongly affected, yellow indicates small effect; blue indicates residues excluded from analysis due to overlap. Figure reproduced from (22) with permission from Elsevier.
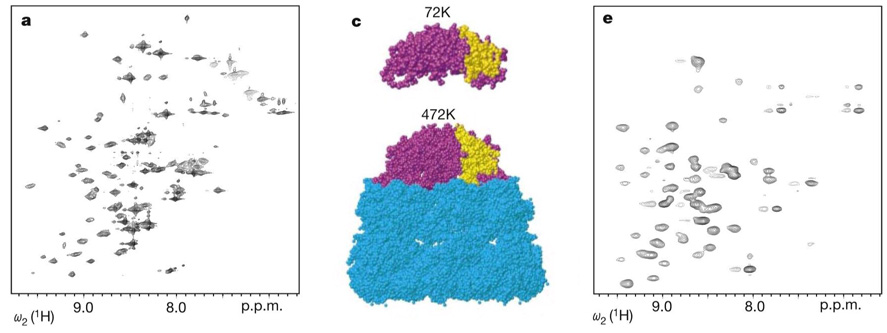
In another spectacular example that demonstrated the absence of an “intrinsic” size limitation for NMR, TROSY-based NMR methods succeeded in capturing the interaction between the oligomeric subunits of the 900 kDa di-heptameric chaperone complex, GroEL/GroES, by observing the effect of GroEL on the NMR spectra of the smaller 72 kDa subunit, GroES (23)(Figure 3). In this study GroES was uniformly labeled with 15N and 2H while the GroEL was not labeled. The homo-heptameric nature of the GroES/L complex contributed to the success of the study by simplifying the spectra to that of the 10 kDa GroES protomer. NMR studies of this large macromolecular assembly were then taken a step further, by studying the chaperone-assisted folding of an 15N-labeled protein (DHFR) bound to the unlabeled GroES/L complex (24).
Figure 3.
NMR studies of the 900 kDa GroES/GroEL complex (23). TROSY-based NMR spectra of the GroES 72 kDa heptamer alone (left) and in complex with the (unlabeled) GroEL variant, SR1 (right). Middle, models of free GroES and GroES/GroEL complex based on the crystal structure. Figure adapted from (23), with permission from Nature Publishing.
Because of its versatility and simplicity, spectral perturbation mapping is perhaps the most widely used NMR technique for determining binding interfaces (18–20); however, it is important to bear in mind the nature of the information obtained. Most commonly, a limited set of signals is monitored (e.g., backbone amides or sidechain methyl groups), thus, although shift perturbations may identify interfacial residues, the structural basis for the interaction must generally be indirectly inferred. In addition, conformational changes that accompany ligand binding can result in spectral perturbations for residues far from the binding interface, complicating identification of the intermolecular interface (e.g., (25)). Another common complication is that the macromolecular interactions can often lead to severe line-broadening through enhanced relaxation, leading to loss of some of the signals of interest (4). Although the focus of this section is in the use of the approach to map interfaces, chemical shift perturbations can also be helpful in generating structural models of macromolecular complexes when combined with other structural information.
Cross-relaxation
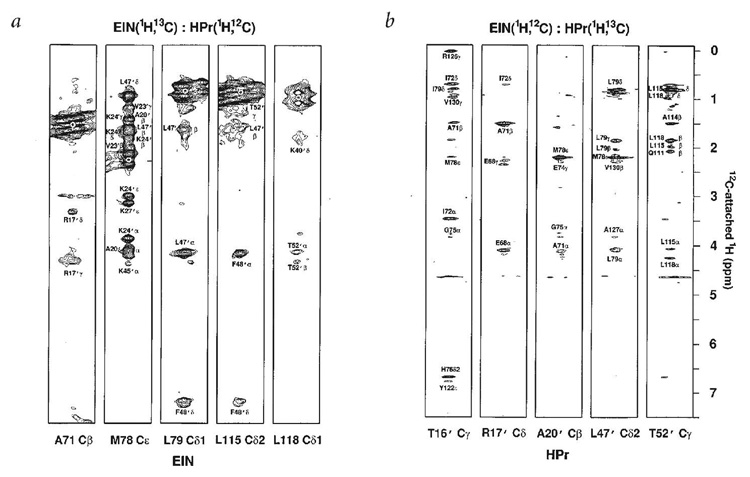
While spectral perturbations allow binding interfaces to be rapidly inferred, NMR spectra can also be used to directly map molecular interfaces. Through-space cross-relaxation between protons on interacting molecules provides direct evidence for their proximity in a complex. The NOE, or nuclear Overhauser effect, results in a change in the intensity of the signal from one proton due to the excitation and through-space transfer of magnetization from a nearby proton (d ≤ ~ 5–7 Å); the magnitude of the NOE is inversely proportional to the sixth power of the distance between the cross-relaxing protons (NOE ∝ 1/r6). The most unambiguous way of deciphering intermolecular contacts in tightly bound macromolecular complexes is by recording (and assigning) NOEs. However, even for smaller complexes, NOE spectra are generally too complicated to allow differentiation of intra-molecular and inter-molecular NOEs from chemical shift information alone. Unambiguous determination of intermolecular NOEs is therefore typically accomplished in differentially labeled complexes using “isotope-filtered” NOE methods (26, 27), which involve alternatively selecting or suppressing signals from protons attached to an NMR-active heteronucleus (i.e., 15N and/or 13C). The power of the approach is well illustrated by the study of the 40 kDa phosphoryl transfer complex between E. coli enzyme I and HPR (28)(Figure 4). Although extremely powerful, identification of direct intermolecular contacts from NOEs can be time consuming and technically challenging, especially since suitable NMR spectra and assignments must be obtained for the entire complex.
Figure 4.
Intermolecular NOEs observed in the 40 kDa complex between EIN and HPR (28). The strips are from 3D heteronuclear edited/filtered NOESY spectra of two differently labeled complex samples in 2H2O solutions. (A) 13C/15N-labeled EIN bound to unlabeled HPR. (B) 13C/15N-labeled HPR bound to unlabeled EIN. Thus, in (A) the interproton NOEs are observed between the 12C-bound protons of HPR and the 13C-bound protons in EIN, whereas in (B), NOEs are observed between 12C-bound protons of EIN and 13C bound protons of HPR. Reproduced from (28) with permission from Nature Publishing.
Cross relaxation can also be used in a less laborious way to detect interfacial resonances, without the need to identify interacting pairs of protons. In this approach, termed “cross saturation” (29) or “saturation transfer” (30), the binding interface is determined from changes in the peak intensities in 2D heteronuclear correlation spectra (HSQC or TROSY) from one of the binding partners when signals on the other partner are excited (saturated) with radiofrequency pulses. This alternate saturation/detection of binding partners can be readily achieved if the molecule whose spectrum is to be recorded is uniformly labeled with 15N and 2H and the other partner is unlabeled (and therefore contains 12C-bound aliphatic protons). Then, saturating radiofrequency pulses applied to aliphatic proton resonances will only affect the unlabeled partner directly, and cross relaxation will alter the intensity of amide 1H-15N signals on the labeled partner that are within ~ 5–7 Å. An advantage of the method over spectral perturbation mapping is that conformational changes away from the intermolecular interface do not provide potentially misleading effects. Importantly, saturation transfer can be applied to larger, more weakly-interacting systems than can NOE spectroscopy since in such cases the detected macromolecule is only transiently bound and therefore yields a spectral quality corresponding to the free protein (30–32). A nice example of mapping a binding interface using saturation transfer is the 300 kDa complex of the A3 domain of von Willebrand factor with fibrillar collagen (32).
Macromolecule dynamics
One of the greatest strengths of NMR spectroscopy is that it allows measurement of molecular motion at near-atomic resolution; indeed, studies of the dynamics of smaller macromolecules and domains has become common practice (33). Although the functional importance of macromolecular motions is now widely recognized (34), how motions on various timescales and amplitudes contribute to function remains poorly understood. While most early studies of macromolecule dynamics were focused on smaller proteins, thanks to TROSY and advances in labeling technologies, molecular motions are now being studied in larger macromolecules and their complexes, where motions can be directly studied in a functional context (35–37).
Experimentally, the procedure for measuring macromolecular dynamics is dependent on the timescale of the molecular motions. Although most early studies of dynamics focused on fast timescale motions, many conformational changes involving catalysis, protein folding, and allosteric transitions, occur on somewhat slower timescales from 10−6 to 10−3 s (µs-ms). NMR experiments used to characterize motions on these timescales take advantage of the effect of such motions on the transverse relaxation rates (and therefore linewidths) of the affected resonances (38, 39). The excess transverse relaxation, Rex, results from conformational exchange processes that transiently alter the chemical shifts of affected nuclei, resulting in dephasing of the magnetization. This dephasing effect can be suppressed by properly tuned multiple pulse trains, either through variable strength spin-lock fields (40), or by applying a series of refocusing pulses at a rate faster than the exchange process itself (41). Measuring signal intensities in a series of NMR spectra in which the strength of the refocusing field is systematically varied yields a “relaxation dispersion” profile for each nucleus. For exchange between two or three distinct conformations (states), fitting of the dispersion profile yields the exchange rates, populations and chemical shift differences between the states.
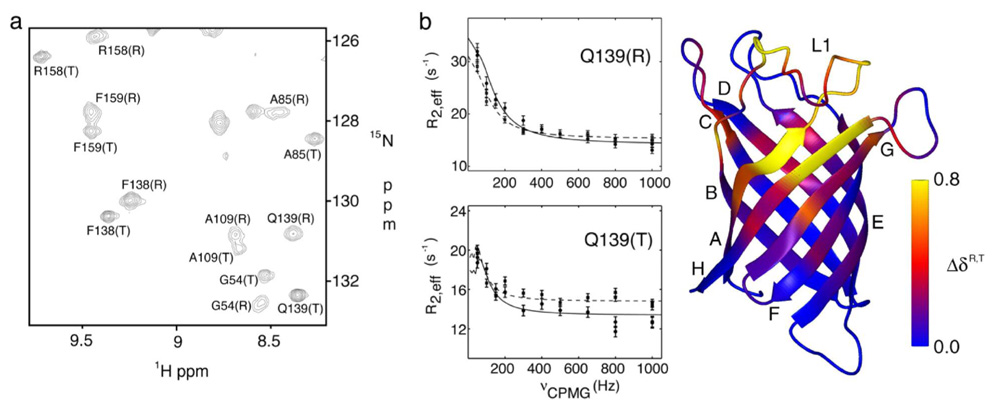
A nice example of functional insights from relaxation studies of larger macromolecules involves the E. coli outer membrane phospholipid transferase enzyme, PagP, in detergent micelles. Perdeuteration and TROSY-based backbone amide relaxation measurements revealed flexible loops (42) and dynamic interconversion between two states with different dynamic behavior on the µs-ms timescale (Figure 5)(43). The dynamics measurements were able to link the structural features required for substrate recognition with the conformational changes required for enzymatic catalysis (translocation, in this case). Although the E. coli PagP polypeptide is not exceptionally large by NMR standards, in detergent micelles it has a rotational correlation time corresponding to a 50–60 kDa macromolecule.
Figure 5.
Two dynamically distinct states of E. coli PagP in a 50 kDa enzymatically competent assembly with detergent micelles (43). (A) The TROSY spectrum of PagP in CYFOS-7 micelles revealed the presence to two different states of the protein (termed R and T), as many of backbone resonances exhibited two chemical shifts. (B) Differences in the relaxation dispersion profiles for Q139 in the R and T states reveal that the two states of the enzyme are dynamically distinct. (C) Cartoon diagram of PagP color-coded according to the chemical shift difference between the R and T states of the enzyme. Figure adapted from (43).
Another impressive example of the functional insights accessible from NMR studies of the dynamics of macromolecular assemblies involves the 300 kDa cylindrical protease ClpP, a 14-subunit oligomer consisting of two (symmetrical) heptameric rings (44). Although backbone-amide 15N spectra of the oligomeric complex were of low quality, high quality 13C methyl TROSY spectra could be recorded and used to study dynamics (assignments were obtained via mutagenesis). TROSY-based 2H and 13C side-chain methyl relaxation dispersion studies of ClpP showed that the interface between the heptameric rings exchanges between two structurally distinct conformations. By measuring the protein’s dynamics over a temperature range from 0.5 °C (where the correlation time is > 400 ns!) to 40 °C the thermodynamic activation energy for the interconversion could be established. These data supported a model for the exit of proteolyzed peptide fragments from the center of the protease rings through transient opening of the interfacial helices, instead of through the top or bottom of the ring (44).
Structure determination
NOEs
A principal concept in structural biology is that of the structure – function relationship, and NMR is one of two methods capable of determining macromolecular structure at atomic resolution. The main source of NMR-derived structural information remains interproton distances measured from the nuclear Overhauser effect (NOE); NOEs between protons on different molecules in a macromolecular complex provide extremely valuable information for defining the overall structure of the complex (e.g., Figure 4, (28)). As mentioned above, enhanced spin-spin interactions in larger, slowly tumbling molecules complicates recording high-resolution NMR spectra. Although linewidths can be narrowed through uniform perdeuteration, this also results in a reduction of the number of proton distance restraints available for structure determination. However, for medium sized proteins, deuteration at a level of 50% to 75% appears to be a good compromise, sufficiently improving linewidths while retaining enough protons for NOE measurements (8, 9).
For larger macromolecules, overlap and fast relaxation make complete assignments of side chain resonances difficult to obtain. For larger proteins, an effective approach is to focus only on assigning and measuring distances involving the protein methyl groups and backbone amides, thereby removing the difficulty of assigning resonances and NOEs for all carbon bound protons (esp. methylenes) (12, 13). The approach is successful because such labeling schemes provide optimal relaxation properties while retaining vital structural information connecting methyl groups, which typically occupy hydrophobic cores and connect structural elements. The approach requires production of proteins in which the only protons are those on methyl groups and backbone amides, with deuterium in place of all other carbon-bound protons. The introduction of methods for efficiently recording methyl-methyl NOEs and implementation of the methyl-TROSY effect in NOESY experiments have been important developments for solution structure determination of large macromolecules (45–48).
Molecular orientation: RDCs
The relative orientations of interacting macromolecules, or of separate domains of a large macromolecule, involve spatial relationships that often cannot be defined with traditional short-range structural information obtained from NOEs and dihedral angles. Over the past decade, development of methods for measuring residual dipolar couplings (RDCs) between NMR-active nuclei in partially aligned molecules have allowed NMR spectroscopists to obtain information relating the relative orientations of individual bond vectors, and by extension, domains in a macromolecular assembly. A tremendous advantage of this approach is that for domains of known structure, orientations can be determined from easily-obtained backbone resonance assignments alone. However, it should be noted that in its most commonly used form, the RDC provides orientation restraints, but no translational (distance) restraints, which must come from other sources.
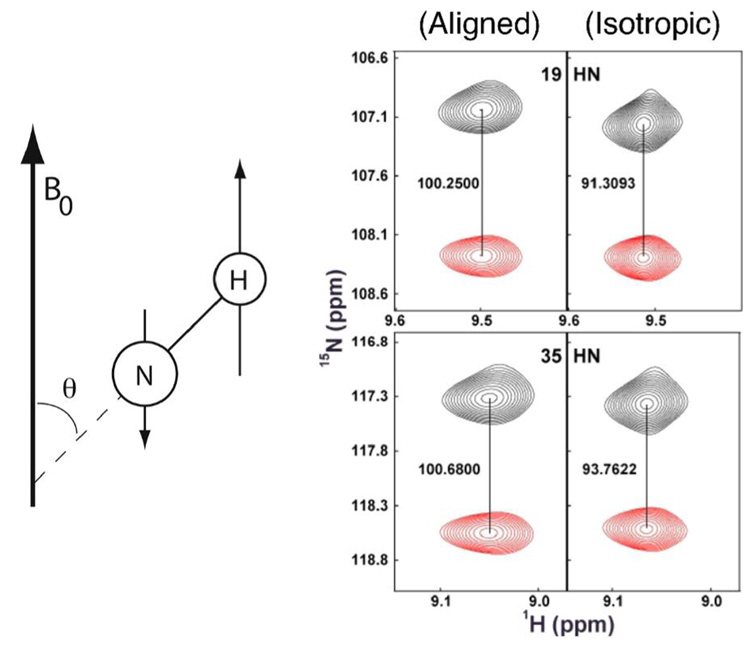
Dipolar couplings arise from interactions between two NMR-active nuclei in the molecule (Figure 6). Although dominant in solid-state NMR spectra, in solution these couplings average to zero due to fast isotropic tumbling. However, if the molecule is weakly constrained to have a preferred orientation relative to the external magnetic field, the couplings no longer average to zero (49, 50). The residual dipole-dipole coupling between two spin-½ nuclei can be expressed as (51)
| (1) |
where the maximal dipolar coupling, Dmax, depends on the internuclear distance and magnetic susceptibitiles of the nuclei, θis the angle between the magnetic field and the internuclear vector, and the brakets denote averaging of the orientation of the bond relative to the external field (Figure 6A). This equation is usually expressed in a form that relates how the orientation of each internuclear vector is averaged by the (anisotropic) tumbling of the macromolecule:
| (2) |
.
Figure 6.
Residual dipolar couplings (RDCs). (A) One-bond RDCs arise due to incomplete averaging of the orientation-dependent interaction of nuclei in partially aligned samples and is dependent on the angle θ between the external field, B0, and the bond vector. (B) Measurement of the one-bond RDCs from differences in the splittings observed between spectra from aligned samples (left) and isotropic (right) (unpublished); the magnitudes of the splittings are indicated in Hz. Data are for the trimeric form of the Anti-TRAP protein (76) (unpublished).
Here, Da is the principal component of the dipolar coupling tensor and is determined by the degree to which the molecule is aligned with respect to the magnetic field, θand ϕ describe the orientation of the internuclear vector within this molecular alignment frame, and R is the rhombicity (anisotropy) of the alignment. Although RDCs could be measured between any NMR-active nuclei, because internuclear distances between directly bonded atoms are relatively fixed, the one-bond RDCs are most commonly used (e.g., the backbone H-N of proteins, or the H1’-C1’ in DNA and RNA). Thus, the RDCs allow one to determine the relative orientations of individual bonds in the molecule and can serve to orient domains relative to each other in the absence of other information.
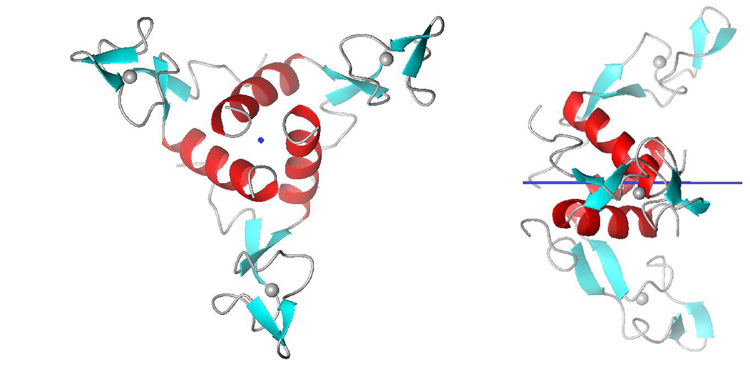
Because the RDC does not describe a unique orientation (multiple values of θ and ϕ can yield equivalent RDCs), the alignment tensor cannot usually be determined unambiguously from a single series of experiments. Instead, RDCs should be measured under conditions that cause the macromolecule to align differently with respect to the magnetic field (49, 50). For axially symmetric oligomeric macromolecules on the other hand, the alignment tensor is independent of the alignment medium, is axially symmetric (R in eq. 2 is zero) and is collinear with the symmetry axis (Figure 7). In these cases the measured RDC depends only on the angle θ of each bond with the molecular symmetry axis (52–55).
Figure 7.
For axially symmetric molecules, the symmetry axis defines the molecular alignment tensor, and the one-bond RDC is sensitive only to the two-fold redundant angle θ between the bond vector and the symmetry axis. Shown is the three-fold symmetric solution structure (unpublished) of the Anti-TRAP protein (76) with the symmetry axis indicated in blue.
A variety of methods for generating the desired weak alignments have been implemented, including the use of strained polyacrylmide gels, phospholipid bilayers, PEG/alcohol mixtures and filamentous phage (49, 50). The most common means of obtaining residual dipolar couplings is by recording spectra in which the alignment-dependent RDCs are observed by their effect on splittings due to the alignment-independent one bond scalar couplings, 1JXY. That is, spectra are recorded on isotropic (control) and aligned samples in which the observed signals are allowed to be split by the one-bond scalar coupling, then the magnitude of the splittings are compared; the difference in measured splitting between the isotropic and aligned samples is the RDC (Figure 6B). A number of multidimensional approaches have been proposed to measure RDCs; for obtaining the N-H RDC in large macromolecules, measuring the difference in peak positions between HSQC (decoupled) and TROSY (coupled) (56), or TROSY-HNCO based experiments have been shown to be reasonably effective (57).
Large Monomeric Proteins
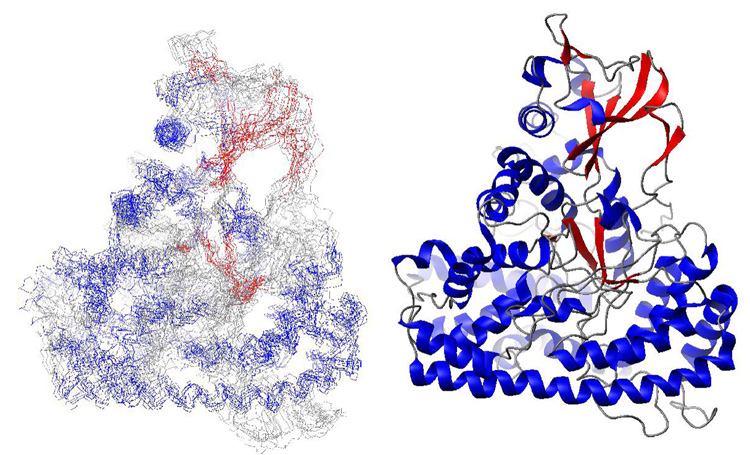
The largest monomeric protein structure solved by NMR to date is that of malate synthase G (MSG), an 81.4 kDa enzyme (58)(Figure 8). The structure was obtained by first assigning the backbone and methyl sidechain resonances of the 732 residue protein using highly perdeuterated, specifically protonated samples and a set of 4D TROSY-based NMR experiments (59, 60). In order to determine the global fold, NOEs were recorded on a sample with 1H/13C labels in the methyl groups of Ile (δ1), Leu and Val (2H and 12C elsewhere), obtained through feeding appropriate amino acid precursors. Using a series of 3D and 4D TROSY-NOESY experiments, a set of distance restraints consisting of 746 HN-HN, 428 CH3-CH3 and 415 CH3-HN distances were obtained, amounting to an average of 2 distance restraints per residue. To obtain convergence of the global fold, distance restraints were supplemented with restraints from rDCs, torsion angles, chemical shifts and secondary structure prediction (58).
Figure 8.
Solution structure of the 724 residue (81.4 kDa) malate synthase enzyme determined using NOEs involving only backbone amide protons and methyl groups, residual dipolar couplings and chemical shift information (58). Left, ensemble of 10 low energy structures (1Y8B.pdb). Right, cartoon representation of the lowest energy structure.
Membrane proteins
The study of membrane proteins by NMR is challenging primarily because it is usually necessary to incorporate the protein into membrane-mimicking detergent micelles (61). Consequently, even for smaller proteins, the resulting protein-micelle complexes have an effective molecular weight beyond 50 kDa. Despite the caveats mentioned above concerning data sparcity for NOEs measurable upon perdeuteration, tremendous progress has been made in the past few years, enabling NMR-based structure determination of several β-barrel membrane proteins as well as α-helical membrane proteins (reviewed in (62, 63)). It should be noted that the use of paramagnetic spin labels to provide additional distance restraints (via distance-dependent relaxation enhancement, PRE) has emerged as a particularly important development (64–66).
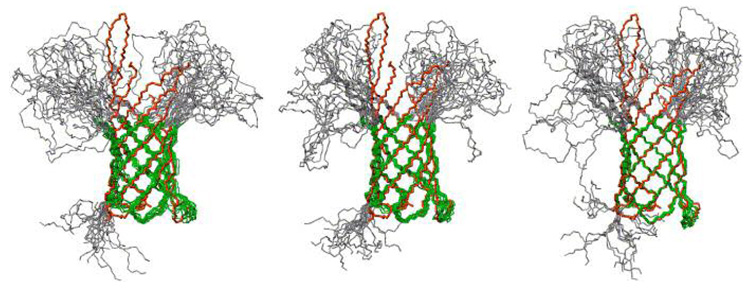
For instance, the global fold of the outer membrane protein, OmpA, in DPC micelles could determined from only 90 distance restrains (46 HN-HN and 42 HN-Hα obtained from 3D HN-NOESY- TROSY data) and dihedral angles restraints obtained from secondary structure prediction (Figure 9)(67). Notably, the structural characteristics of the β-barrel fold made it possible to define the global fold from readily detected HN-HN NOEs between neighboring strands; it is unlikely that for other types of structures such sparse information would result in a well-defined global fold. Significant improvements in the resolution of the structure could be achieved by addition of 320 long-range restrains obtained from PRE experiments with spin labels attached at 11 different positions in the protein (65), and through measuring RDCs in micelle samples aligned in strained polyacrylamide gels (62).
Figure 9.
NMR-derived membrane protein structures. (A) Solution structure of the β-barrel OmpA membrane protein in phosholipid micelles (62, 65, 67) determined using chemical shift information and HN - HN and HN- Hα NOEs (left), and after including paramagnetic relaxation (PRE) restraints (middle), or RDC restraints (right). Reproduced from (62) with permission from Elsevier.
RNA
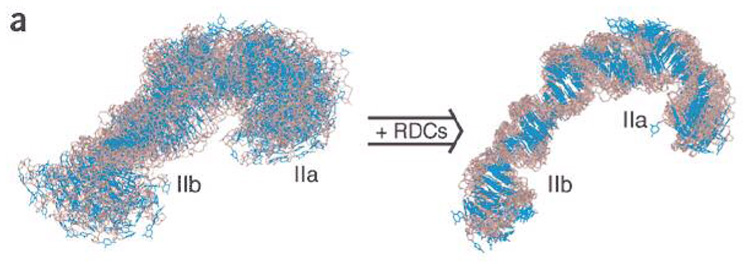
Greater disorder and degeneracy in comparison to proteins complicates NMR studies of larger nucleic acids and their complexes. However, paralleling the advances in NMR of larger proteins, isotope labeling strategies have allowed investigation of RNAs whose spectral complexity would have previously been prohibitive. For example, by implementing segmental and residue-specific isotope labeling strategies, the solution structure of domain II of the hepatitis C virus IRES (internal ribosome entry site) RNA was determined using both conventional and RDC restraints (Figure 10)(17, 68). Although the domain adopts an extended structure, inclusion of the orientation information from RDC restraints enabled precise definition of the orientation of the top and bottom of the domain. Comparison of the NMR spectra from the isolated 64 nt domain with the spectrum of the segmentally-labeled intact (100 kDa) IRES showed that the isolated domain adopts the same structure as in the larger context.
Figure 10.
Solution structure of the HCV IRES domain II RNA determined by NMR without (left) and with (right) inclusion of RDC restraints (68). Reprinted with permission from Nature Publishing.
Going even farther up the molecular weight ladder for RNA, the solution structure of a 101 nucleotide RNA from the core encapsidation signal of the Moloney murine leukemia virus (~35 kDa) was determined, both free (69) and in complex with the nucleocapsid domain of the Gag polyprotein (70). To achieve this daunting feat, eight differently labeled RNA samples were prepared, using nucleotide-specific labeling (i.e., A, C, G, U) of both the intact RNA and of smaller domains. Although 1H-13C RDCs were used for refinement of individual RNA fragments, due to experimental complications, their relative orientations could not be defined in the absence of the protein (69).
Domain orientation
Conformational changes that lead to differences in the relative orientations of domains or subunits in multidomain complexes are often mechanistically important. In many such cases, crystallographically-determined structures are plagued by the uncertainty that the observed orientations could be the consequence of crystal packing forces (71). For this reason, and because the lattice tends to freeze out large-scale conformational changes, it is essential to be able to determine relative orientations of domains in solution.
In one of the first applications of RDCs to RNA structure analysis, partial resonance assignments and RDC data enabled differences in the global arrangements of the acceptor and anticodon stems of E. coli tRNAVal in solution and in crystals to be detected (72). The implied adaptability of the RNA has important implications for charging by tRNA synthetases, recognition by EFG/EF-Tu and ribosome binding.
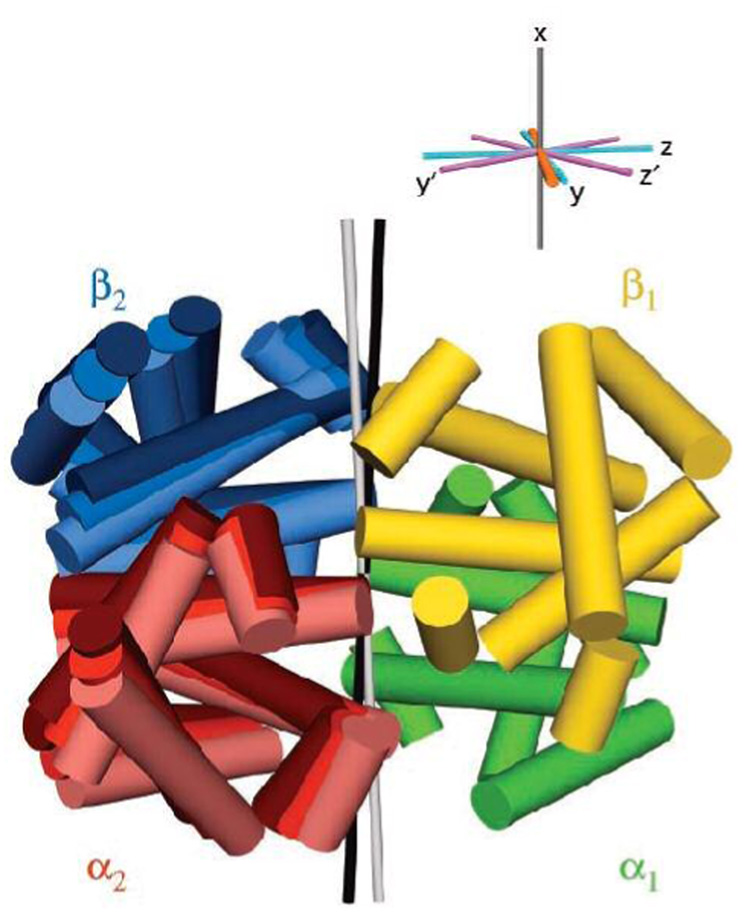
A particularly relevant example of the use of RDCs for domain orientation involves studies of the structural basis for allostery in the classic model, hemoglobin, a heterotetrameric protein. Decades of biophysical data led to the classical model of allostery by interconversion between “relaxed” (R, high affinity) and “tense” (T, low affinity) states. Because of its α2β2 subunit composition, the molecule exhibits C2 symmetry between the α1β1 and α2β2 dimers. Experimentally measured RDCs were found not to fit either of two crystallographically-determined R-state structures, but indicate that in solution the average orientation lies roughly halfway between them (56) (Figure 11). Indeed, the same approach allowed the conformational change involved in the T → R transition to be monitored directly (73).
Figure 11.
Quaternary structure of the R state (liganded) of hemoglobin in solution (56). RDC measurements indicate that the relative orientation of the α1β1 and α2 β2 domains in solution differs from either of two crystallographically observed conformations. The symmetry axes for the crystallographically-observed structures are shown in green and black; the NMR-determined alignment axis lies between these two. Figure reproduced from (56).
Complexes
RDCs have proven useful in structural characterization of several protein-protein and protein-ligand complexes. One example is the 95 kDa complex between acyl carrier protein, ACP, and the trimeric acyltransferase protein, LpxA (74). Although ACP is monomeric, upon binding to trimeric LpxA, the entire oligomer is three-fold axially symmetric. Because the alignment tensor is coincident with the symmetry axis, the orientation of ACP relative to LpxA could be determined from RDC measurements of 15N ACP bound to LpxA, without the need to obtain assignments for the larger molecule. With the known structures of ACP and LpxA, a three-dimensional model of the ACP-LpxA complex could be quickly obtained from the RDC restraints together with chemical shift perturbations on ACP, and biochemical data identifying critical residues on LpxA.
Conclusion
Over the past decade, advances in spectroscopic and isotope labeling methods have expanded the range of NMR-tractable biochemical problems by at least an order of magnitude. While it is often mistakenly considered only as an alternative to X-ray crystallography for de novo structure determination, the power and utility of NMR for studying macromolecules and their interactions extends significantly beyond that use. Although structure determination remains an important capability (75), NMR spectroscopy is unique in its ability to illuminate, at atomic resolution, macromolecule/ligand binding sites, conformational changes, and macromolecular motions (dynamics). While the applicability of the range of NMR tools to individual large molecules will continue to be system-dependent, ongoing developments can be expected to continue to expand the biochemical reach of macromolecular NMR spectroscopy.
Acknowledgements
The authors thank J. Ottesen, J. Wu and R. Wilson (OSU) for critical reading of the manuscript.
Abbreviations
- NMR
nuclear magnetic resonance
- TROSY
transverse relaxation optimized spectroscopy
- COSY
correlation spectroscopy
- HSQC
heteronuclear single quantum correlation spectroscopy
- NOE
nuclear Overhauser effect/enhancement
- RDC
residual dipolar coupling
Footnotes
Authors supported by grants from the National Science Foundation (MCB-0092962) and National Institutes of Health (GM067807)
References
- 1.Tugarinov V, Hwang PM, Kay LE. Nuclear magnetic resonance spectroscopy of high-molecular-weight proteins. Annu Rev Biochem. 2004;73:107–146. doi: 10.1146/annurev.biochem.73.011303.074004. [DOI] [PubMed] [Google Scholar]
- 2.Tzakos AG, Grace CR, Lukavsky PJ, Riek R. NMR techniques for very large proteins and rnas in solution. Annu Rev Biophys Biomol Struct. 2006;35:319–342. doi: 10.1146/annurev.biophys.35.040405.102034. [DOI] [PubMed] [Google Scholar]
- 3.Hua Q, Dementieva IS, Walsh MA, Hallenga K, Weiss MA, Joachimiak A. A thermophilic mini-chaperonin contains a conserved polypeptide-binding surface: combined crystallographic and NMR studies of the GroEL apical domain with implications for substrate interactions. J Mol Biol. 2001;306:513–525. doi: 10.1006/jmbi.2000.4405. [DOI] [PubMed] [Google Scholar]
- 4.McElroy C, Manfredo A, Wendt A, Gollnick P, Foster M. TROSYNMR studies of the 91kDa TRAP protein reveal allosteric control of a gene regulatory protein by ligand-altered flexibility. J Mol Biol. 2002;323:463–473. doi: 10.1016/s0022-2836(02)00940-3. [DOI] [PubMed] [Google Scholar]
- 5.Boomershine WP, McElroy CA, Tsai HY, Wilson RC, Gopalan V, Foster MP. Structure of Mth11/Mth Rpp29, an essential protein subunit of archaeal and eukaryotic RNase P. Proc Natl Acad Sci U S A. 2003;100:15398–15403. doi: 10.1073/pnas.2535887100. [DOI] [PMC free article] [PubMed] [Google Scholar]
- 6.Mandel AM, Akke M, Palmer AG., 3rd Dynamics of ribonuclease H: temperature dependence of motions on multiple time scales. Biochemistry. 1996;35:16009–16023. doi: 10.1021/bi962089k. [DOI] [PubMed] [Google Scholar]
- 7.Wand AJ, Ehrhardt MR, Flynn PF. High-resolution NMR of encapsulated proteins dissolved in low-viscosity fluids. Proc Natl Acad Sci U S A. 1998;95:15299–15302. doi: 10.1073/pnas.95.26.15299. [DOI] [PMC free article] [PubMed] [Google Scholar]
- 8.Sattler M, Fesik SW. Use of deuterium labeling in NMR: overcoming a sizeable problem. Structure. 1996;4:1245–1249. doi: 10.1016/s0969-2126(96)00133-5. [DOI] [PubMed] [Google Scholar]
- 9.Gardner KH, Kay LE. The use of 2H, 13C, 15N multidimensional NMR to study the structure and dynamics of proteins. Annu Rev Biophys Biomol Struct. 1998;27:357–406. doi: 10.1146/annurev.biophys.27.1.357. [DOI] [PubMed] [Google Scholar]
- 10.Goto NK, Kay LE. New developments in isotope labeling strategies for protein solution NMR spectroscopy. Curr Opin Struct Biol. 2000;10:585–592. doi: 10.1016/s0959-440x(00)00135-4. [DOI] [PubMed] [Google Scholar]
- 11.A Lian L-Y, A Middleton David A. Labelling approaches for protein structural studies by solution-state and solid-state NMR. Progress in Nuclear Magnetic Resonance Spectroscopy. 2001;39:171–190. [Google Scholar]
- 12.Gardner KH, Rosen MK, Kay LE. Global folds of highly deuterated, methyl-protonated proteins by multidimensional NMR. Biochemistry. 1997;36:1389–1401. doi: 10.1021/bi9624806. [DOI] [PubMed] [Google Scholar]
- 13.Rosen MK, Gardner KH, Willis RC, Parris WE, Pawson T, Kay LE. Selective methyl group protonation of perdeuterated proteins. J Mol Biol. 1996;263:627–636. doi: 10.1006/jmbi.1996.0603. [DOI] [PubMed] [Google Scholar]
- 14.Pervushin K, Riek R, Wider G, Wuthrich K. Attenuated T2 relaxation by mutual cancellation of dipole-dipole coupling and chemical shift anisotropy indicates an avenue to NMR structures of very large biological macromolecules in solution. Proc Natl Acad Sci U S A. 1997;94:12366–12371. doi: 10.1073/pnas.94.23.12366. [DOI] [PMC free article] [PubMed] [Google Scholar]
- 15.Goodsell DS, Olson AJ. Structural symmetry and protein function. Annu Rev Biophys Biomol Struct. 2000;29:105–153. doi: 10.1146/annurev.biophys.29.1.105. [DOI] [PubMed] [Google Scholar]
- 16.Cowburn D, Shekhtman A, Xu R, Ottesen JJ, Muir TW. Segmental isotopic labeling for structural biological applications of NMR. Methods Mol Biol. 2004;278:47–56. doi: 10.1385/1-59259-809-9:047. [DOI] [PubMed] [Google Scholar]
- 17.Kim I, Lukavsky PJ, Puglisi JD. NMR study of 100 kDa HCV IRES RNA using segmental isotope labeling. J Am Chem Soc. 2002;124:9338–9339. doi: 10.1021/ja026647w. [DOI] [PubMed] [Google Scholar]
- 18.Zuiderweg ER. Mapping protein-protein interactions in solution by NMR spectroscopy. Biochemistry. 2002;41:1–7. doi: 10.1021/bi011870b. [DOI] [PubMed] [Google Scholar]
- 19.Pellecchia M. Solution nuclear magnetic resonance spectroscopy techniques for probing intermolecular interactions. Chem Biol. 2005;12:961–971. doi: 10.1016/j.chembiol.2005.08.013. [DOI] [PubMed] [Google Scholar]
- 20.Carlomagno T. Ligand-target interactions: what can we learn from NMR? Annu Rev Biophys Biomol Struct. 2005;34:245–266. doi: 10.1146/annurev.biophys.34.040204.144419. [DOI] [PubMed] [Google Scholar]
- 21.Bodenhausen G, Ruben DJ. Natural abundance nitrogen-15 NMR by enhanced heteronuclear spectroscopy. Chemical Physics Letters. 1980;69:185–189. [Google Scholar]
- 22.Huang X, Yang X, Luft BJ, Koide S. NMR identification of epitopes of Lyme disease antigen OspA to monoclonal antibodies. J Mol Biol. 1998;281:61–67. doi: 10.1006/jmbi.1998.1930. [DOI] [PubMed] [Google Scholar]
- 23.Fiaux J, Bertelsen EB, Horwich AL, Wuthrich K. NMR analysis of a 900K GroEL GroES complex. Nature. 2002;418:207–211. doi: 10.1038/nature00860. [DOI] [PubMed] [Google Scholar]
- 24.Horst R, Bertelsen EB, Fiaux J, Wider G, Horwich AL, Wuthrich K. Direct NMR observation of a substrate protein bound to the chaperonin GroEL. Proc Natl Acad Sci U S A. 2005;102:12748–12753. doi: 10.1073/pnas.0505642102. [DOI] [PMC free article] [PubMed] [Google Scholar]
- 25.Foster MP, Wuttke DS, Clemens KR, Jahnke W, Radhakrishnan I, Tennant L, Reymond M, Chung J, Wright PE. Chemical shift as a probe of molecular interfaces: NMR studies of DNA binding by the three amino-terminal zinc finger domains from transcription factor IIIA. J Biomol NMR. 1998;12:51–71. doi: 10.1023/a:1008290631575. [DOI] [PubMed] [Google Scholar]
- 26.Otting G, Wuthrich K. Heteronuclear filters in two-dimensional [1H,1H]-NMR spectroscopy: combined use with isotope labelling for studies of macromolecular conformation and intermolecular interactions. Q Rev Biophys. 1990;23:39–96. doi: 10.1017/s0033583500005412. [DOI] [PubMed] [Google Scholar]
- 27.Breeze AL. Isotope-filtered NMR methods for the study of biomolecular structure and interactions. Progress in Nuclear Magnetic Resonance Spectroscopy. 2000;36:323–372. [Google Scholar]
- 28.Garrett DS, Seok YJ, Peterkofsky A, Gronenborn AM, Clore GM. Solution structure of the 40,000 Mr phosphoryl transfer complex between the N-terminal domain of enzyme I and HPr. Nat Struct Biol. 1999;6:166–173. doi: 10.1038/5854. [DOI] [PubMed] [Google Scholar]
- 29.Takahashi H, Nakanishi T, Kami K, Arata Y, Shimada I. A novel NMR method for determining the interfaces of large protein-protein complexes. Nat Struct Biol. 2000;7:220–223. doi: 10.1038/73331. [DOI] [PubMed] [Google Scholar]
- 30.Nakanishi T, Miyazawa M, Sakakura M, Terasawa H, Takahashi H, Shimada I. Determination of the interface of a large protein complex by transferred cross-saturation measurements. J Mol Biol. 2002;318:245–249. doi: 10.1016/S0022-2836(02)00018-9. [DOI] [PubMed] [Google Scholar]
- 31.Hall DA, Vander Kooi CW, Stasik CN, Stevens SY, Zuiderweg ER, Matthews RG. Mapping the interactions between flavodoxin and its physiological partners flavodoxin reductase and cobalamin-dependent methionine synthase. Proc Natl Acad Sci U S A. 2001;98:9521–9526. doi: 10.1073/pnas.171168898. [DOI] [PMC free article] [PubMed] [Google Scholar]
- 32.Nishida N, Sumikawa H, Sakakura M, Shimba N, Takahashi H, Terasawa H, Suzuki E, Shimada I. Collagen-binding mode of vWF-A3 domain determined by a transferred cross-saturation experiment. Nat Struct Biol. 2002;10:53–57. doi: 10.1038/nsb876. [DOI] [PubMed] [Google Scholar]
- 33.Palmer AG., 3rd Nmr probes of molecular dynamics: overview and comparison with other techniques. Annu Rev Biophys Biomol Struct. 2001;30:129–155. doi: 10.1146/annurev.biophys.30.1.129. [DOI] [PubMed] [Google Scholar]
- 34.Mittermaier A, Kay LE. New tools provide new insights in NMR studies of protein dynamics. Science. 2006;312:224–228. doi: 10.1126/science.1124964. [DOI] [PubMed] [Google Scholar]
- 35.Zhu G, Xia Y, Nicholson LK, Sze KH. Protein dynamics measurements by TROSY-based NMR experiments. J Magn Reson. 2000;143:423–426. doi: 10.1006/jmre.2000.2022. [DOI] [PubMed] [Google Scholar]
- 36.Tugarinov V, Hwang PM, Ollerenshaw JE, Kay LE. Cross-correlated relaxation enhanced 1H[bond]13C NMR spectroscopy of methyl groups in very high molecular weight proteins and protein complexes. J Am Chem Soc. 2003;125:10420–10428. doi: 10.1021/ja030153x. [DOI] [PubMed] [Google Scholar]
- 37.Tugarinov V, Ollerenshaw JE, Kay LE. Probing side-chain dynamics in high molecular weight proteins by deuterium NMR spin relaxation: an application to an 82-kDa enzyme. J Am Chem Soc. 2005;127:8214–8225. doi: 10.1021/ja0508830. [DOI] [PubMed] [Google Scholar]
- 38.Palmer AG, 3rd, Kroenke CD, Loria JP. Nuclear magnetic resonance methods for quantifying microsecond-to-millisecond motions in biological macromolecules. Methods Enzymol. 2001;339:204–238. doi: 10.1016/s0076-6879(01)39315-1. [DOI] [PubMed] [Google Scholar]
- 39.Palmer AG, 3rd, Grey MJ, Wang C. Solution NMR spin relaxation methods for characterizing chemical exchange in high-molecular-weight systems. Methods Enzymol. 2005;394:430–465. doi: 10.1016/S0076-6879(05)94018-4. [DOI] [PubMed] [Google Scholar]
- 40.Akke M, Palmer AG. Monitoring Macromolecular Motions on Microsecond to Millisecond Time Scales by R1r-R1 Constant Relaxation Time NMR Spectroscopy. J. Am. Chem. Soc. 1996;118:911–912. [Google Scholar]
- 41.Loria JP, Rance M, Palmer AG. A Relaxation-Compensated Carr-Purcell-Meiboom-Gill Sequence for Characterizing Chemical Exchange by NMR Spectroscopy. J. Am. Chem. Soc. 1999;121:2331–2332. [Google Scholar]
- 42.Hwang PM, Choy WY, Lo EI, Chen L, Forman-Kay JD, Raetz CR, Prive GG, Bishop RE, Kay LE. Solution structure and dynamics of the outer membrane enzyme PagP by NMR. Proc Natl Acad Sci U S A. 2002;99:13560–13565. doi: 10.1073/pnas.212344499. [DOI] [PMC free article] [PubMed] [Google Scholar]
- 43.Hwang PM, Bishop RE, Kay LE. The integral membrane enzyme PagP alternates between two dynamically distinct states. Proc Natl Acad Sci U S A. 2004;101:9618–9623. doi: 10.1073/pnas.0402324101. [DOI] [PMC free article] [PubMed] [Google Scholar]
- 44.Sprangers R, Gribun A, Hwang PM, Houry WA, Kay LE. Quantitative NMR spectroscopy of supramolecular complexes: dynamic side pores in ClpP are important for product release. Proc Natl Acad Sci U S A. 2005;102:16678–16683. doi: 10.1073/pnas.0507370102. [DOI] [PMC free article] [PubMed] [Google Scholar]
- 45.Zwahlen C, Gardner KH, Sarma S, Horita D, Byrd A, Kay LE. An NMR Experiment for Measuring Methyl-Methyl NOEs in 13C-Labeled Proteins with High Resolution. J. Am. Chem. Soc. 1998;120:7617–7625. [Google Scholar]
- 46.Zwahlen C, Gardner KH, Sarma S, Horita D, Byrd A, Kay LE. Significantly Improved Resolution for NOE Correlations from Valine and Isoleucine Methyl Groups in 15N,13C- and 15N,13C,2H-Labeled Proteins. J. Am. Chem. Soc. 1998;120:4825–4831. [Google Scholar]
- 47.Tugarinov V, Kay LE. An isotope labeling strategy for methyl TROSY spectroscopy. J Biomol NMR. 2004;28:165–172. doi: 10.1023/B:JNMR.0000013824.93994.1f. [DOI] [PubMed] [Google Scholar]
- 48.Tugarinov V, Kay LE, Ibraghimov I, Orekhov VY. High-resolution four-dimensional 1H-13C NOE spectroscopy using methyl-TROSY, sparse data acquisition, and multidimensional decomposition. J Am Chem Soc. 2005;127:2767–2775. doi: 10.1021/ja044032o. [DOI] [PubMed] [Google Scholar]
- 49.Prestegard JH, al-Hashimi HM, Tolman JR. NMR structures of biomolecules using field oriented media and residual dipolar couplings. Q Rev Biophys. 2000;33:371–424. doi: 10.1017/s0033583500003656. [DOI] [PubMed] [Google Scholar]
- 50.Bax A. Weak alignment offers new NMR opportunities to study protein structure and dynamics. Protein Sci. 2003;12:1–16. doi: 10.1110/ps.0233303. [DOI] [PMC free article] [PubMed] [Google Scholar]
- 51.Fischer MW, Losonczi JA, Weaver JL, Prestegard JH. Domain orientation and dynamics in multidomain proteins from residual dipolar couplings. Biochemistry. 1999;38:9013–9022. doi: 10.1021/bi9905213. [DOI] [PubMed] [Google Scholar]
- 52.Bax A, Kontaxis G, Tjandra N. Dipolar couplings in macromolecular structure determination. Methods Enzymol. 2001;339:127–174. doi: 10.1016/s0076-6879(01)39313-8. [DOI] [PubMed] [Google Scholar]
- 53.Al-Hashimi HM, Bolon PJ, Prestegard JH. Molecular symmetry as an aid to geometry determination in ligand protein complexes. J Magn Reson. 2000;142:153–158. doi: 10.1006/jmre.1999.1937. [DOI] [PubMed] [Google Scholar]
- 54.Bolon PJ, Al-Hashimi HM, Prestegard JH. Residual dipolar coupling derived orientational constraints on ligand geometry in a 53 kDa protein-ligand complex. J Mol Biol. 1999;293:107–115. doi: 10.1006/jmbi.1999.3133. [DOI] [PubMed] [Google Scholar]
- 55.Zweckstetter M, Bax A. Prediction of Sterically Induced Alignment in a Dilute Liquid Crystalline Phase: Aid to Protein Structure Determination by NMR. J Am Chem Soc. 2000;122:3791–3792. [Google Scholar]
- 56.Lukin JA, Kontaxis G, Simplaceanu V, Yuan Y, Bax A, Ho C. Quaternary structure of hemoglobin in solution. Proc Natl Acad Sci U S A. 2003;100:517–520. doi: 10.1073/pnas.232715799. [DOI] [PMC free article] [PubMed] [Google Scholar]
- 57.Yang D, R V, G M, Choy WY, Kay LE. TROSY-based HNCO pulse sequences for the measurement of 1HN-15N, 15N-13CO, 1HN-13CO, 13CO-13Cα and 1HN-13Cα dipolar couplings in 15N, 13C, 2H-labeled proteins. J Biomol NMR. 1999;14:333–343. [Google Scholar]
- 58.Tugarinov V, Choy WY, Orekhov VY, Kay LE. Solution NMR-derived global fold of a monomeric 82-kDa enzyme. Proc Natl Acad Sci U S A. 2005;102:622–627. doi: 10.1073/pnas.0407792102. [DOI] [PMC free article] [PubMed] [Google Scholar]
- 59.Tugarinov V, Muhandiram R, Ayed A, Kay LE. Four-dimensional NMR spectroscopy of a 723-residue protein: chemical shift assignments and secondary structure of malate synthase g. J Am Chem Soc. 2002;124:10025–10035. doi: 10.1021/ja0205636. [DOI] [PubMed] [Google Scholar]
- 60.Tugarinov V, Kay LE. Ile, Leu, and Val methyl assignments of the 723-residue malate synthase G using a new labeling strategy and novel NMR methods. J Am Chem Soc. 2003;125:13868–13878. doi: 10.1021/ja030345s. [DOI] [PubMed] [Google Scholar]
- 61.Fernandez C, Wuthrich K. NMR solution structure determination of membrane proteins reconstituted in detergent micelles. FEBS Lett. 2003;555:144–150. doi: 10.1016/s0014-5793(03)01155-4. [DOI] [PubMed] [Google Scholar]
- 62.Tamm LK, Liang B. NMR of membrane proteins in solution. Progress in Nuclear Magnetic Resonance Spectroscopy. 2006;48:201–210. doi: 10.1016/j.pnmrs.2018.02.001. [DOI] [PMC free article] [PubMed] [Google Scholar]
- 63.Sanders CR, Sonnichsen F. Solution NMR of membrane proteins: practice and challenges. Magn Reson Chem. 2006;44(Spec No):S24–S40. doi: 10.1002/mrc.1816. [DOI] [PubMed] [Google Scholar]
- 64.Cierpicki T, Liang B, Tamm LK, Bushweller JH. Increasing the accuracy of solution NMR structures of membrane proteins by application of residual dipolar couplings. High-resolution structure of outer membrane protein A. J Am Chem Soc. 2006;128:6947–6951. doi: 10.1021/ja0608343. [DOI] [PMC free article] [PubMed] [Google Scholar]
- 65.Liang B, Bushweller JH, Tamm LK. Site-directed parallel spin-labeling and paramagnetic relaxation enhancement in structure determination of membrane proteins by solution NMR spectroscopy. J Am Chem Soc. 2006;128:4389–4397. doi: 10.1021/ja0574825. [DOI] [PMC free article] [PubMed] [Google Scholar]
- 66.Roosild TP, Greenwald J, Vega M, Castronovo S, Riek R, Choe S. NMR structure of Mistic, a membrane-integrating protein for membrane protein expression. Science. 2005;307:1317–1321. doi: 10.1126/science.1106392. [DOI] [PubMed] [Google Scholar]
- 67.Arora A, Abildgaard F, Bushweller JH, Tamm L. Structure of outer membrane protein A transmembrane domain by NMR spectroscopy. Nature Struct Biol. 2001;8:334–338. doi: 10.1038/86214. [DOI] [PubMed] [Google Scholar]
- 68.Lukavsky PJ, Kim I, Otto GA, Puglisi JD. Structure of HCV IRES domain II determined by NMR. Nat Struct Biol. 2003;10:1033–1038. doi: 10.1038/nsb1004. [DOI] [PubMed] [Google Scholar]
- 69.D'Souza V, Dey A, Habib D, Summers MF. NMR structure of the 101-nucleotide core encapsidation signal of the Moloney murine leukemia virus. J Mol Biol. 2004;337:427–442. doi: 10.1016/j.jmb.2004.01.037. [DOI] [PubMed] [Google Scholar]
- 70.D'Souza V, Summers MF. Structural basis for packaging the dimeric genome of Moloney murine leukaemia virus. Nature. 2004;431:586–590. doi: 10.1038/nature02944. [DOI] [PubMed] [Google Scholar]
- 71.Maiorov V, Abagyan R. A new method for modeling large-scale rearrangements of protein domains. Proteins. 1997;27:410–424. doi: 10.1002/(sici)1097-0134(199703)27:3<410::aid-prot9>3.0.co;2-g. [DOI] [PubMed] [Google Scholar]
- 72.Mollova ET, Hansen MR, Pardi A. Global Structure of RNA Determined with Residual Dipolar Couplings. J. Am. Chem. Soc. 2000;122:11561–11562. [Google Scholar]
- 73.Gong Q, Simplaceanu V, Lukin JA, Giovannelli JL, Ho NT, Ho C. Quaternary structure of carbonmonoxyhemoglobins in solution: structural changes induced by the allosteric effector inositol hexaphosphate. Biochemistry. 2006;45:5140–5148. doi: 10.1021/bi052424h. [DOI] [PubMed] [Google Scholar]
- 74.Jain NU, Wyckoff TJ, Raetz CR, Prestegard JH. Rapid analysis of large protein-protein complexes using NMR-derived orientational constraints: the 95 kDa complex of LpxA with acyl carrier protein. J Mol Biol. 2004;343:1379–1389. doi: 10.1016/j.jmb.2004.08.103. [DOI] [PubMed] [Google Scholar]
- 75.Ferentz AE, Wagner G. NMR spectroscopy: a multifaceted approach to macromolecular structure. Q Rev Biophys. 2000;33:29–65. doi: 10.1017/s0033583500003589. [DOI] [PubMed] [Google Scholar]
- 76.Valbuzzi A, Yanofsky C. Inhibition of the B. subtilis regulatory protein TRAP by the TRAP-inhibitory protein, AT. Science. 2001;293:2057–2059. doi: 10.1126/science.1062187. [DOI] [PubMed] [Google Scholar]


