

Abstract
According to the World Health Organization, cataracts account for half of the blindness in the world, with the majority occurring in developing countries. A cataract is a clouding of the lens of the eye due to light scattering of precipitated lens proteins or aberrant cellular debris. The major proteins in the lens are crystallins and they are extensively deamidated during aging and cataracts. Deamidation has been detected at the domain and monomer interfaces of several crystallins during aging.
The purpose of this study was to determine the effects of two potential deamidation sites at the predicted interface of the βA3-crystallin dimer on its structure and stability. The glutamine residues at the reported in vivo deamidation sites of Q180 in the C-terminal domain and at the homologous site Q85 in the N-terminal domain were substituted with glutamic acid residues by site-directed mutagenesis. Far UV and near UV circular dichroism spectroscopy indicated that there were subtle differences in the secondary structure and more notable differences in the tertiary structure of the mutant proteins compared to wild type βA3-crystallin. The Q85E/Q180E mutant also was more susceptible to enzymatic digestion, suggesting increased solvent accessibility. These structural changes in the deamidated mutants led to decreased stability during unfolding in urea and increased precipitation during heat-denaturation. When simulating deamidation at both residues, there was a further decrease in stability and loss of cooperativity. However, multiangle-light scattering and quasi-elastic light scattering experiments showed that dimer formation was not disrupted, nor did higher-order oligomers form. These results suggest that introducing charges at the predicted domain interface in the βA3 homodimer may contribute to the insolubilization of lens crystallins or favor other, more stable, crystallin subunit interactions.
Cataracts account for half of all blindness according to the World Health Organization (1). The greatest incidence is in developing countries. A cataract is opacity within the lens of the eye due to scattering of light by precipitated proteins or by aberrant cellular debris. The major proteins within the lens belong to the α and β/γ-crystallin families. Protein concentrations can reach 400 mg/mL and above in the center of the lens, and it is their ordered packing that is necessary for transparency (2). There is an extremely low rate of turnover of crystallins in differentiated lens cells. Thus, crystallins accumulate modifications due to environmental and metabolic damage during an individual’s entire lifetime. This makes the lens an easily accessible tissue to study the effects of post-translational modifications on protein unfolding and aggregation.
The major post-translational modifications in lenses are truncation, methylation, oxidation, disulfide bond formation, advanced glycation end-products and deamidation (3–12). Of these modifications, deamidation has been difficult to quantitate because it results in only a single dalton change. Recently, Wilmarth et al have identified deamidation to be the most prevalent of these post-translational modifications in lens protein fractions from adult and cataractous lenses (11, 13). This report counted the number of times tryptic peptides triggered spectra during chromatography and mass spectrometry and is biased towards peptides that have the least losses during these procedures. Nonetheless, the majority, 66%, of the tryptic peptides identified by mass spectrometry to be modified was deamidated. For βA3-crystallin nearly half the potential sites of deamidation have been confirmed to date with several sites deamidated between 35–43% (3, 77).
Given the long life span of the proteins in the adult lens, the large number of reported deamidation sites is not surprising. Robinson and Robinson have reviewed the mechanism of deamidation (14). Gln and Asn residues tend to form rings with the backbone nitrogen of the carboxyl side residue in a general base catalyzed reaction. This is followed by rapid hydrolysis on either side of the α carbon hydrogen to generate isomers. Alternatively, an imide can form between the amide nitrogen and the backbone carboxylic carbon of Asn, followed by cleavage. All amides have an intrinsic, genetically determined rate of deamidation and cleavage. Robinson and Robinson have propose that deamidation sites are programmed into proteins to act as clocks to time molecular events (14). Deamidation has been demonstrated in other proteins to trigger turnover (15). Furthermore, specific Gln residues may be deamidated by transglutaminase that catalyzes crosslinking between Lys and Gln, but can also catalyze deamidation of the Gln (16). At a few sites, an Asn or Gln in one β-crystallin subunit is the corresponding acid at the homologous site in another subunit dictated by the gene sequence.
The accumulation of modified crystallins is associated with changes in their aggregation properties (7, 17–20). The seven β-crystallin subunits form dimers and complex hetero-oligomers that change in size and relative amounts during aging (7, 18, 21–23). Modified β-crystallins were found to form complex mixtures that were difficult to separate (3). Altered crystallin interactions may lead to insolubilization. More significantly, then was the greater number of deamidated peptides identified in the insoluble proteins by Wilmarth and co-workers (11).
How deamidation may alter crystallin interactions and cause protein insolubilization is not known. Deamidation introduces a negative charge at physiological pH by replacing an amide with a carboxyl group. A potential mechanism may be in disruption of a critical structural region in the protein.
The crystallins in the β/γ-crystallin superfamily are highly homologous, containing a common polypeptide chain fold characterized by the “Greek key motif”. Individual monomers have two domain regions linked by a connecting peptide that is either bent as in βB1-crystallin (24) or extended as it is for βB2-crystallin (25). The β-crystallins also have N-terminal or N- and C-terminal extensions. The role of the extensions and connecting peptide in oligomer formation remains speculative and may differ depending on the crystallin subunit (26–30). From the X-ray crystal structures, there are hydrophobic interactions and H-bonds across the domain interfaces that most likely influence formation of the complex β-crystallin oligomers (31, 32). Surface charges at the interface may also be important (33).
Numerous deamidations have been reported in the crystallins, with differences in both the sites and levels of detection (3,11,13). Deamidation in βB1 can have differing effects depending on the deamidation site (21, 34). Our research and that of others has focused on deamidations that occur at the domain interfaces (34–37). Since, deamidation at Q180 which lies at the predicted interface in βA3-crystallin has been reported to increase during aging (3), studies were conducted to determine the effect of deamidation at this key structural region. The level of deamidation at Q180 were estimated to be as high as 14% in the lens of a 28-year-old donor, but has not been reported at the homologous residue in the N-terminal domain (3). This site, Q85, is in a long tryptic peptide and may not have been detected by current methods. We have previously reported that deamidation at the domain interface in the βB1-crystallin dimer and the subunit interface in the βB2-crystallin dimer decreased stability of the dimer (35, 38). Similar results have been reported at the intradomain interface of the γD-crystallin monomer (36, 37). While, the crystal structures for the above proteins are known, the crystal structure for βA3-crystallin is not. Therefore, the purpose of this study was to probe interactions across the predicted interface of the βA3-crystallin dimer by determining the effects of two potential deamidation sites and to compare these results with changes in stabilities reported for the other crystallins.
EXPERIMENTAL PROCEDURES
Expression and Purification of Recombinant Proteins
Wild type human βA3-crystallin (WT) was recombinantly expressed as previously described (34). Briefly, total RNA was extracted from lens tissue from an anonymous human donor less than a year old (Lions Eye Bank of Oregon). RNA was transcribed into cDNA. The forward, C CAT ATG GAG ACC CAG GCT GAG and reverse, AGG ATC CAT CAG CTACTG TTG GAT TC of WT gene specific primers (GenBank accession No. NM 005208) with added restriction enzyme sites were used to generate a PCR fragment. This was inserted into the pCR-Blunt II-TOPO vector by blunt-end ligation (Invitrogen, Carlsbad, CA) and then transformed into TOP 10 Escherichia coli (E. coli) cells. The sequence containing the full-length WT was then subcloned into pET-3a vector (Novagen, San Diego, CA) using the restriction enzyme sites.
In vivo deamidations were mimicked at glutamines 85 and 180 in βA3-crystallin by replacing the glutamine with glutamic acid residues by site directed mutagenesis using internal primers containing the desired mutation (QuikChange Mutagenesis, Stratagene, Cedar Creek, TX) as previously described for βB1- and βB2-crystallins. The forward primers contained the sequence TCT GTG GGC AAG AGT TTA TCC and TCG TGG GTA TGA GTA TAT CTT GG to generate βA3-crystallin mutants Q85E and Q180E, respectively. The mutation was introduced into the WT βA3 sequence in the same pCR-Blunt II-TOPO vector described above and then subcloned into the pET-3a vector (Novagen). The double mutant (Q85E/Q185E) was made with the primer introducing the Q180E mutation into the vector containing the Q85E mutation. Clones containing the correct insert were confirmed by sequencing (Nevada Genomics Center, Reno, NV).
Recombinant βA3-crystallins were expressed using the E. coli strain BL21 (DE3) pLysS (Invitrogen). Cells were grown in LB culture medium containing 1% D-glucose. To express these recombinant proteins, cells were induced with 0.4 mM IPTG when cultures reached an OD of 0.4 at 600 nm. After four hours of culturing, cells were harvested and freeze-thawed three times, followed by vortexing in first-step chromatography buffer containing protease inhibitor cocktail (Roche, Mannheim, Germany).
All proteins were purified from E. coliby successive ion -exchange chromatography. All cell lysates were applied to a DEAE Sepharose Fast Flow anion exchange column (Amersham Biosciences, Piscataway, NJ) equilibrated in a Tris buffer (pH 7.8) for the first step of purification and a SP Sepharose cation exchange column (Amersham Biosciences, Uppsala, Sweden) equilibrated in a MES buffer (pH 5.6) for the second step. A 50 mM Tris buffer with 2 mM EDTA, and 1 mM DTT was used for an anion exchange column, and a 20 mM MES buffer containing 2 mM EDTA and 1 mM DTT was used for cation exchange chromatography. Each protein was eluted with a 0–500 mM NaCl gradient for first and second steps. After purities of the proteins were checked by electrophoresis, mass spectrometry (LTQ, ThermoFinnigan, San Jose, CA) was performed to confirm the deamidation sites, as previously described (21, 34).
Circular Dichroism Measurements
Circular Dichroism Measurements in the near-UV, and far-UV range were obtained using a JASCO J-810 spectropolarimeter (JASCO, Easton, MD). Samples were exhaustively dialyzed into 5 mM NaH2PO4, 5 mM Na2HPO4 (pH 6.8), containing 100 mM NaF, and measured in a 1.0 cm cell for near-UV and 0.1 cm for far-UV. Experiments were performed at 4 °C for better signal to noise ratios. This was particularly important below 200 nm. Spectra scans were done in triplicate at 1 nm resolution. Experiments were repeated on three different protein preparations except for the double mutant, which was repeated on two different protein preparations. Protein concentrations were 0.2–0.3 mg/mL for near UV-CD, and 0.1–0.15 mg/mL for far UV-CD. Concentrations were determined by UV absorbance at 280 nm either in buffer or in 6 M GuHCl or by amino acid analysis, with good agreement between the methods. Spectra were processed using CDtool from Birkbeck College, London (39). The percent secondary structure was calculated using DICHROWEB website located at (http://www.cryst.bbk.ac.uk/cdweb/html/home.html) which is part of the BBSRC Centre for Protein and Membrane Structure and Dynamics (40–42). A modification of the Variable Selection method, CDSSTR, was used to analyze data from 270 to 185 nm(41, 43). The mean square error of the algorithm is 4 % (41).
Associative Behavior Analysis of Expressed Proteins
Samples were concentrated to between 0.4 and 15 mg/mL using 10,000 MWCO cellulose centrifuge spin filters (Amicon, Millipore, Billerica, MA) and filtered to remove paniculate matter. Samples were analyzed at each concentration step before concentrating higher to avoid dilution effects later. Size-exclusion chromatography (SEC) was performed in-line with multi-angle laser (MALS) and quasi-elastic (QELS) light scattering (miniDAWN, Wyatt Technology, Santa Barbara, CA), to determine the association state of βA3-crystallins by measuring molar masses and sizes (27). A 50 μl sample was injected onto a Superose 12 10/300 GL column (Amersham Biosciences) equilibrated in buffer containing 29 mM Na2HPO4, 29 mM KH2PO4, 100 mM KCl,1 mM EDTA, 1 mM DTT (pH 6.8) with a flow rate of 0.4 mL/min.
The weight-averaged molar masses were calculated with software provided by the manufacturer (ASTRA IV, Wyatt Technology) as previously described (21). The software reported the radius of hydration, RH, assuming a spherical conformation. The frictional coefficient, f, was determined from this value using Stokes’s Law, f=6πη RH, where η is the viscosity of the solvent. The frictional coefficient for βA3-crystallins, f0, was compared to the theoretical frictional coefficient of βA3-crystallins, f0, in a spherical conformation, and the predicted axial ratio was estimated (21). Assuming a sphere, the volume of βA3 can be estimated and used to extrapolate its radius, RS, using RS = (3MW υ/4 π NA)1/3 , where υ is specific volume, 0.72 cm3/g plus the specific volume of water, 0.3 cm3/g (44).
Stability of Expressed Proteins
Stability of deamidated mutants relative to WT βA3 was measured by fluorescence spectrometry during protein unfolding/refolding in urea. A stock solution of 9.07 M urea in phosphate buffer was prepared according to the method of Pace (45). An Abbe refractometer was used to measure the urea concentration (VEE GEE Scientific, Inc., Kirkland, WA). The fluorescence buffer (pH 7.0) contained 50 mM Na2HPO4, 50 mM NaH2PO4, 5 mM DTT, and 2 mM EDTA. Proteins at 1 μM were incubated in urea for 24 h at 22 °C. Initial timed fluorescence experiments determined that the proteins completely unfolded in 8 M urea after 5 h. For refolding experiments, proteins were thus incubated in 8 M urea for 5 h, then diluted to the desired urea concentration and incubated for a total 24 h.
Fluorescence intensities were measured on a Photon Technology International QM-2000-7 spectrometer using the manufacture’s supplied software, FeliX (Photon Technology International, Lawrenceville, NJ). Emission spectra were recorded between 300 and 400 nm with an excitation wavelength at 285 nm or 295 nm. Slit widths were set to 2 nm. Emission spectra were corrected for the buffer signal.
The extent of unfolded protein was calculated from the normalized intensities (FI 360/320). In order to determine the free energy of unfolding, the system must achieve reversible equilibrium at each stage of unfolding. Relative stabilities were determined in this study by fitting the data to a two-state model and measuring the denaturant concentration at the transition midpoint, Cm, and approximating the apparent free energy, apparent ΔGD. The following two-state model was employed:
Where fN is the fraction on native protein, fD is the fraction of denatured protein. The apparent ΔGD, at any denaturant concentration is Apparent
T is the absolute temperature, and R is the universal gas constant in kcal mol−1K−1. In the case of urea denaturation, apparent ΔGD is linearly related to the urea concentration in the transition points such that Apparent
where the apparent ΔGD0 is the reference-state apparent Gibbs free energy of unfolding without urea. The apparent m value is the slope of the line relating unfolding to denaturant concentration. The midpoint of the transition, CM is calculated from apparent ΔGD0 = mCM and provides the urea concentrations at the midpoint of denaturation.
Heat Solubility Analysis
Heat induced precipitation of βA3-crystallins were measured in a microtiter plate reader at various times. Following chromatography, samples were buffer exchanged into 10 mM Tris buffer (pH 7.1) containing 1 mM DTT and concentrated to 0.5 mg/ml. Aliquots of 100 μL were placed into wells and the plate heated at 55 °C with continuous shaking at 110 rpm. Absorbances were read at 405 nm. Experiments were performed in triplicate. In a separate experiment proteins were heated at 55°C in a thermocycler for 180 min and then centrifuged at 15,000 × g to fractionate the precipitated proteins. Equal proportions of supernatant and pellet were analyzed.
Enzyme Accessibility Analysis of Expressed Proteins
Protein accessibility to solvent was determined by digesting proteins with trypsin (Promega, Madison, WI). The buffer conditions used for tryptic digestion were the same as those described for CD analysis, except 0.1 M NaHCO3 was added to maintain trypsin activity. Reactions were stopped by adding 5% formic acid. Mass spectrometry was used to determine the extent of trypsin digestion (LCQ, ThermoFinnigan).
Molecular Modeling
Since βA3-crystallin has previously been modeled as “opened” and “closed” monomers or as a dimer (pdb: 1BLB, (29)), homology modeling was used here to predict the effects of introducing a negative charge across the interface of both conformations. The human βA3-crystallin sequence was modeled using either the bovine βB2-crystallin dimer structure (pdb: 1BLB) as an open dimer model (29) or the human βB1-crystallin (pdb: 1OKI) as a close dimer model. The models were refined by energy minimization with MOE software (Chemical Computing Group Inc., Montreal, Canada). Both the highly variable N- and C-terminal extensions were omitted from the modeling. Another non-homologous region, S100-A104, resulted in a loop not seen in either βB2- or βB1-crystallin, and was deleted from the model. The models are represented in ribbon representation using DS ViewerPro software (Figure 1, Accelrys Inc, San Diego, CA). Solvent accessible surface area (SASA) of equivalent positions of Q85 and Q180 in the βA3 model was calculated by the software GETAREA1.1 (46).
Figure 1.
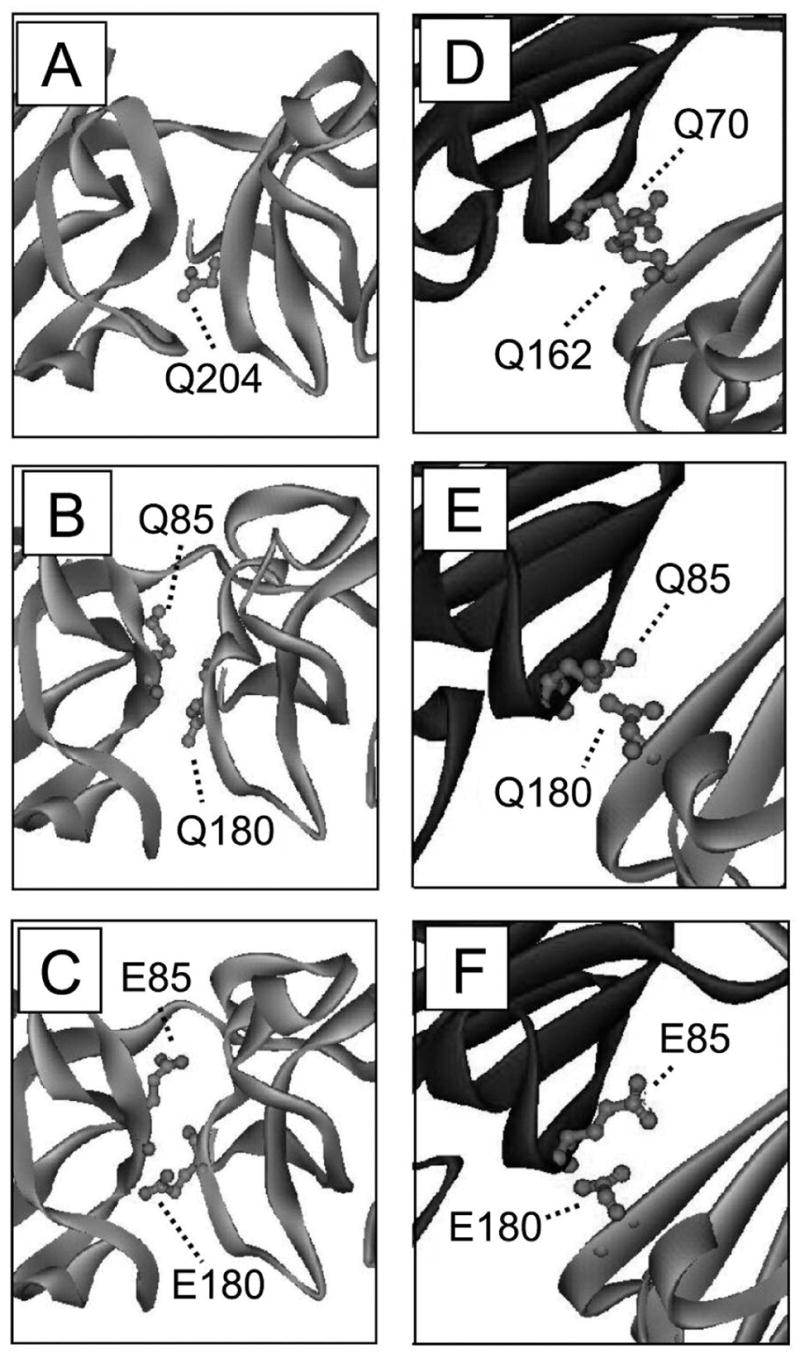
Three-dimensional model structure of deamidated βA3-crystallin. (A) The βB1-crystallin crystal structure used as the template (PDB: 1OKI). (B) The WT βA3 “closed” monomer model from the βB1-crystallin. (C) The Q85E/Q180E of βA3 “closed” monomer model. (D) The βB2-crystallin crystal structure used as the template (PDB: 1BLB). (E) The WT βA3 “open” dimer model from the βB2-crystallin dimer. (F) The Q85E/Q180E of βA3 “open” dimer model. The Q85E and Q180E at the interface are shown in ball and stick.
Electrophoresis
Electrophoresis was performed using precast, 1.0 mm thick 8 × 8 cm, polyacrylamide NuPAGE 10 % Bi-Tris gels (Invitrogen, Carlsbad, CA). Proteins were visualized by staining with SimplyBlue SafeStain (Invitrogen).
Protein Concentration
Concentrations were calculated from the UV absorbance at 280 nm and an extinction coefficient for βA3-crystallin of 2.62 (mg/mL)−1cm−1 or a molar extinction coefficient of 65,290 (M−1cm−1) (www.scripps.edu/cgi-bin/cdputnam/protcalc3). Where noted, amino acid analysis was performed (Molecular Structure Facility, UC Davis).
RESULTS
The Effect of Deamidation on the Structure of βA3-Crystallin
Homology modeling was done to predict the effects of deamidation on the βA3-crystallin structure (Figure 1). A crystal structure for βA3 is not known. Therefore, βA3 was first modeled using either a βB1-crystallin-like closed (Figure 1A–C) or a βB2-crystallin-like open dimer (Figure 1D–F) for a template, as was previously demonstrated by Sergeev at al (29). The sequence homology of the globular domain regions between βA3 and βB1 is 46% and between βA3 and βB2 is 42%. Despite these high homologies, the WT βA3 model had less defined structure than either βB1 (Figure 1A and B) or βB2 (Figure 1D and E), including an extra loop between S100 and A104. This region did not lie near the region of interest for this study and is not shown in Figure 1. Solvent accessibility measurements were made to approximate the accessibility of Q85 and Q180 using GETAREA 1.1. Both side chains were buried between 81 and 97%, with the more buried Gin side chains in the closed model. This was in good agreement with the values calculated for the homologous residues in βB1 (Q204, 99%) and βB2 (Q70, 86% and Q162, 87%). When Glu were introduced at these residues, there was a shift in the orientation of the side chains and a small increase in the distance between the domains (Figure 1C and F). In βB1, there was H-bonding across the domain interface between Q204 and 1117 that was maintained in the closed βA3 model, but not when Glu residues were introduced. The H-bonding across the interface in βB2 was not maintained in the open βA3 model.
WT βAS and deamidated mutants were expressed in E. coli in the soluble proteins. All recombinant proteins were isolated by the same methods with similar yields. After purification, only a single protein band was observed by SDS-PAGE electrophoresis indicating high purity (Figure 2). The presence of Glu at residues 85, 180, and at both residues in the double mutant was confirmed by mass spectrometry (Figure 3). Mass spectrometry also did not detect any other proteins present in significant amounts.
Figure 2.

Gel electrophoresis of purified recombinant βA3-crystallins. Molecular weight markers (MW); WT (Lane 1); Q85E (Lane 2); Q180E (Lane 3); Q85E/Q180E (Lane 4). One microgram of each protein was visualized with Coomassie stain on a 1.0 mm thick, 10% Bis/Tris gel.
Figure 3.

Mass spectrum of peptide 178–193 from recombinant βA3-crystallin containing the Q180E mutation. The parent ion of peptide 178–193 was doubly charged with a measured monoisotopic m/z of 978.4 (unmodified peptide monoisotopic m/z is calculated to be 977.9).
Circular dichroism measurements of WT βA3 and the deamidated βA3 mutants showed typical β-strand rich structures characteristic of β-crystallins with strong maxima at 198 nm and minima at 214 nm in the far-UV range (Figure 4A). The slight minimum at 230 nm, unique to βA3 among the β-crystallins (47), was also observed. Wild type βA3 folded with 41% total β-strand content (Table 1). Differences in the spectra of the singly and doubly deamidated mutants below 195 nm, resulted in decreases in the estimated helical contents of the mutants, which corresponded to increases in β-turns and other structure as reported in Table 1. These changes were consistent for all three mutants. The near-UV CD spectra of the four mutants differed with the double mutant having the greatest difference (Figure 4B).
Figure 4.

(A) Far-UV CD spectra and (B) Near-UV CD spectra of WT, Q85E, Q180E, and Q85E/Q180E of βA3-crystallin. Samples contained 10 mM sodium phosphate and 100 mM NaF (pH 6.8) and were measured in a 0.1 cm cell for far-UV, and 1.0 cm for near-UV at 4 °C.
Table 1.
Secondary Structure Prediction of WT βA3-crystallin, Q85E, Q180E, and Q85E/Q180E as Determined by DIHCROWEB (42, 43).
| percent of structure (%)
|
||||
|---|---|---|---|---|
| mutant | helix | sheet | turn | other |
| WT βA3 | 15 | 41 | 19 | 25 |
| Q85E | 6 | 40 | 23 | 30 |
| Q180E | 7 | 40 | 23 | 29 |
| Q85E/Q180E | 7 | 41 | 21 | 30 |
The Effect of Deamidation on the Association of βA3-Crystallin
Introducing a negative charge across the domain interface of the βA3 did not alter the dimer formation (Figure 5). At all concentrations tested between 0.5 and 12 mg/ml, WT and the deamidated βA3 mutants formed oligomers, with masses suggesting dimer formation (Figure 5A) and with a radius of hydration, R , between 3.0 and 3.4 nm (Figure 5B).
Figure 5.

(A) Molar mass and (B) radius of hydration of the WT (○), Q85E (△A), Q180E (5), and Q85E/Q180E (□) of βA3-crystallins determined by SEC in line with MALS or QELS. Column was equilibrated in 58 mM Na/K phosphate (pH 6.8), 100 mM KCl, 1 mM EDTA, 1 mM DTT with a flow rate of 0.4 mL/min. Predicted molar mass for the WT βA3 dimer is 50,250 Da. Molar masses were determined on three different sample preparations and on two different sample preparations for R on WT at 4 mg/mL. Error bars are shown.
To determine the effect of deamidation on the overall shape of βA3, the frictional coefficients, f, were determined from the RH (Table 2). Taking an RH for βA3 as 3.2 nm (Figure 5B) with a weight-averaged molar mass of 49 kDa (Figure 5A) gave a calculated f by the equation of Stokes’s Law of 5.4 × 10⁻¹¹ kg/sec. The ratio of this f value to that predicted for a sphere of the same Mw, f0, would give f/f0 of 1.17. The results matched those of the previously published value of 1.13 for β-Low crystallin (22). This frictional ratio of β A3 would predict an axial ratio of 3.0–4.0 for a prolate structure (Table 2).
Table 2.
Molar Mass, Size, and Predicted Axial Ratios of Recombinant β-crystallins.
| Protein | MW (kDa) | R (nm) | f(×10−11 kg/sec) | f/f0 | Predicted Axial Ratio |
|---|---|---|---|---|---|
| WTβA3 | 49 ±2 | 3.2 ± 0.2 | 5.4 ± 0.3 | 1.17 ± < 0.1 | 3.0–4.0 |
| Q85E | 49 ±2 | 3.2 ± 0.2 | 5.4 ± 0.3 | 1.17 ± < 0.1 | 3.0–4.0 |
| Q180E | 50 ±2 | 3.1 ± 0.2 | 5.2 ±0.3 | 1.13 ± < 0.1 | 3.0–4.0 |
| Q85E/Q180E | 50 ±2 | 3.1 ±< 0.1 | 5.2 ± 0.2 | 1.13 ± < 0.1 | 3.0–4.0 |
| WT βB1a | 52 ±4 | 3.4 ± < 0.1 | 5.7 ± < 0.1 | 1.22 ± < 0.1 | 4.0–5.0 |
| WT βB2 b | 45 ±3 | 2.8 ± < 0.1 | 4.7 ± < 0.1 | 1.06 ± < 0.1 | 2.0–3.0 |
These experiments were repeated without salt to avoid the potential for the salt to mask the effects of the deamidations (Figure 6). While, there was a greater polydispersity reflected by the lower molar masses at the tailing edge of the peak, the molar masses were between 45–50 kD, suggesting predominantly dimer formation.
Figure 6.
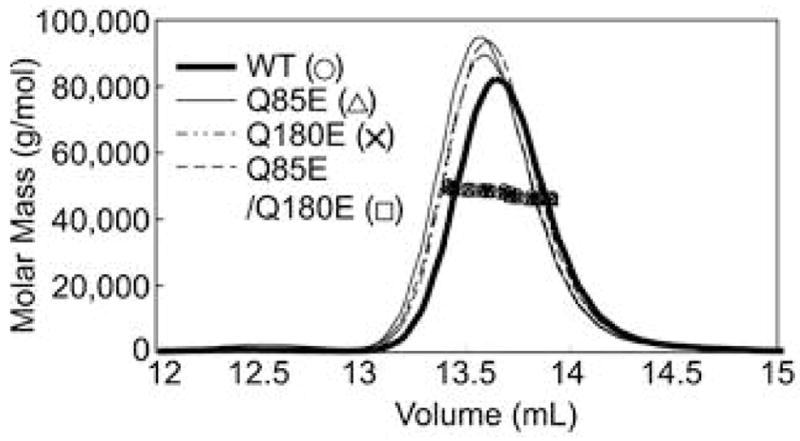
Chromatogram of molar masses of WT (○), Q85E (△), Q180E (5), and Q85E/Q180E (□) of βA3-crystallin determined by SEC-MALS in 100 mM sodium phosphate, 5 mM DTT, and 2 mM EDTA (pH 7.0). The line tracing represents the signal from the UV detector. The individual data points represent the molar masses in a narrowly eluting volume. A 50 μL sample of 3.6–4.0 mg/mL was analyzed for each protein.
The Effect of Deamidation on the Susceptibility of β A3-Crystallin to Enzymatic Digestion
Tryptic digestion was performed to investigate the solvent accessibility of WT β A3 and Q85E/Q180E. Trypsin cleaved the first 17 amino acids from the N-termini of both proteins (Figure 7A, B). This was confirmed by mass spectrometry. Further digestion of WT occurred slowly with a visible loss of protein at 8 hr. In contrast, Q85E/Q180E was degraded after 2 hr. Deamidation increased the susceptibility of β A3 to further trypsin digestion, suggesting an increased solvent accessibility.
Figure 7.

(A) Trypsin digestion of WT and Q85E/Q180E βA3-crystallins. WT digested for 2, 4, 6, and 8 h (Lanes 1–4); Q85E/Q180E digested for 2, 4, 6, and 8 h (Lanes 5–8). (B) WT and Q85E/Q180E of βA3 incubated for 8 h without trypsin. WT (Lane 1); Q85E/Q180E (Lane 2), molecular weight markers (MW).
The Effect of Deamidation on the Stability of βA3-Crystallin
The relative stabilities of the deamidated mutants were compared with WT βA3 during unfolding in urea. Protein unfolding and refolding were detected by measuring fluorescence emission due to aromatic residues dominated by nine tryptophan residues in β A3 of which only four are buried (47). As denaturation of β A3 progressed in increasing urea concentrations, the fluorescence peak increased and shifted from 338 to 353 nm (data shown for WT β A3 Figure 8A). The proteins completely unfolded at urea concentrations ≧5.0 M. The emission spectra for all of the proteins were indistinguishable in the absence of urea with excitation at either 285 nm (Figure 8B) or 295 nm (Figure 8C). In order to compare to previously published results with βB2, 285 nm was used to monitor unfolding.
Figure 8.
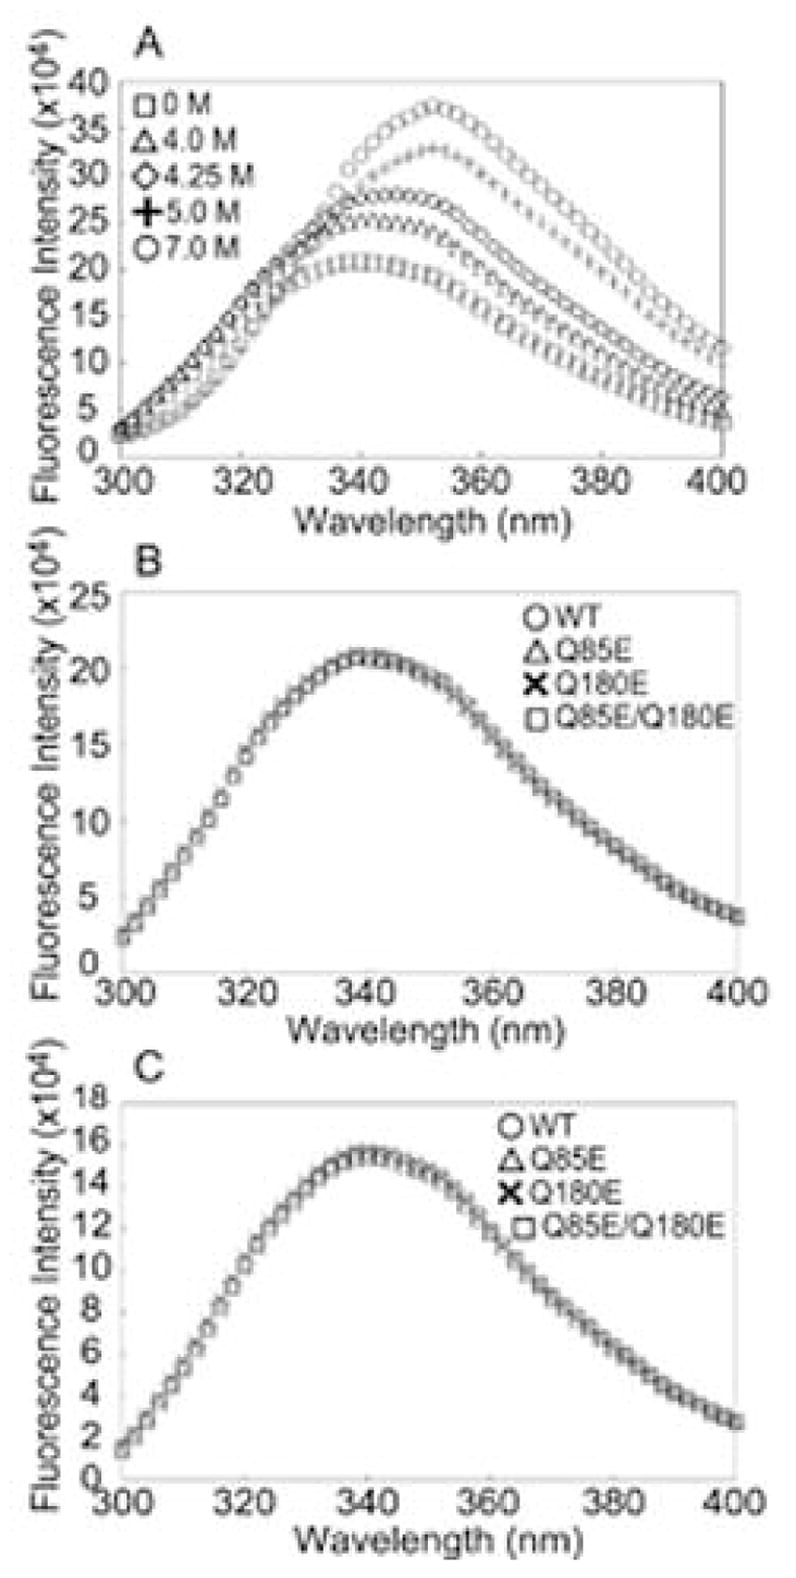
(A) Urea-induced denaturation of WT βA3 as measured by fluorescence spectrometry at 285 nm. A1 μM sample of WT was incubated in 0 M, 4 M, 4.25 M, 5 M, and 7 M urea for 24 h at 22 °C. (B) Fluorescence emission at 285 nm and (C) 295 nm of the 1 nM sample of WT (○), Q85E (△), Q180E (5), and Q85E/Q180E (□) of βA3-crystallins were incubated in 0 M urea for 24 h at 22 °C.
Unfolding of WT βA3 showed high cooperativity, without an observable transition in the unfolding curve. From the concentrations under the eluting peaks in the above MALS experiments, βA3 was predicted to be predominantly a dimer at the concentrations used for unfolding. Data were first fit to a three state model depicting the dimer dissociating to two monomers before unfolding. However, these calculations showed large uncertainties. For comparison, midpoints of transition curves were determined in order to rank stability. Apparent free energies were approximated from the unfolding and refolding curves and by assuming two states, native and denatured (Figure 9 and Table 3). A midpoint of transition of 4.5 M urea was observed for WT βA3 (Figure 9A). Deamidated βA3-crystallins unfolded at lower urea concentrations (Table 3). The relative apparent ΔGD0’s and the unfolding curves of Q85E and Q180E were indistinguishable, but lower than for WT PA3 (Figure 9A). There was a further decrease in stability for Q85E/Q180E, which had a midpoint of unfolding of 3.7 M urea and a loss of cooperativity (Figure 9B and Table 3).
Figure 9.
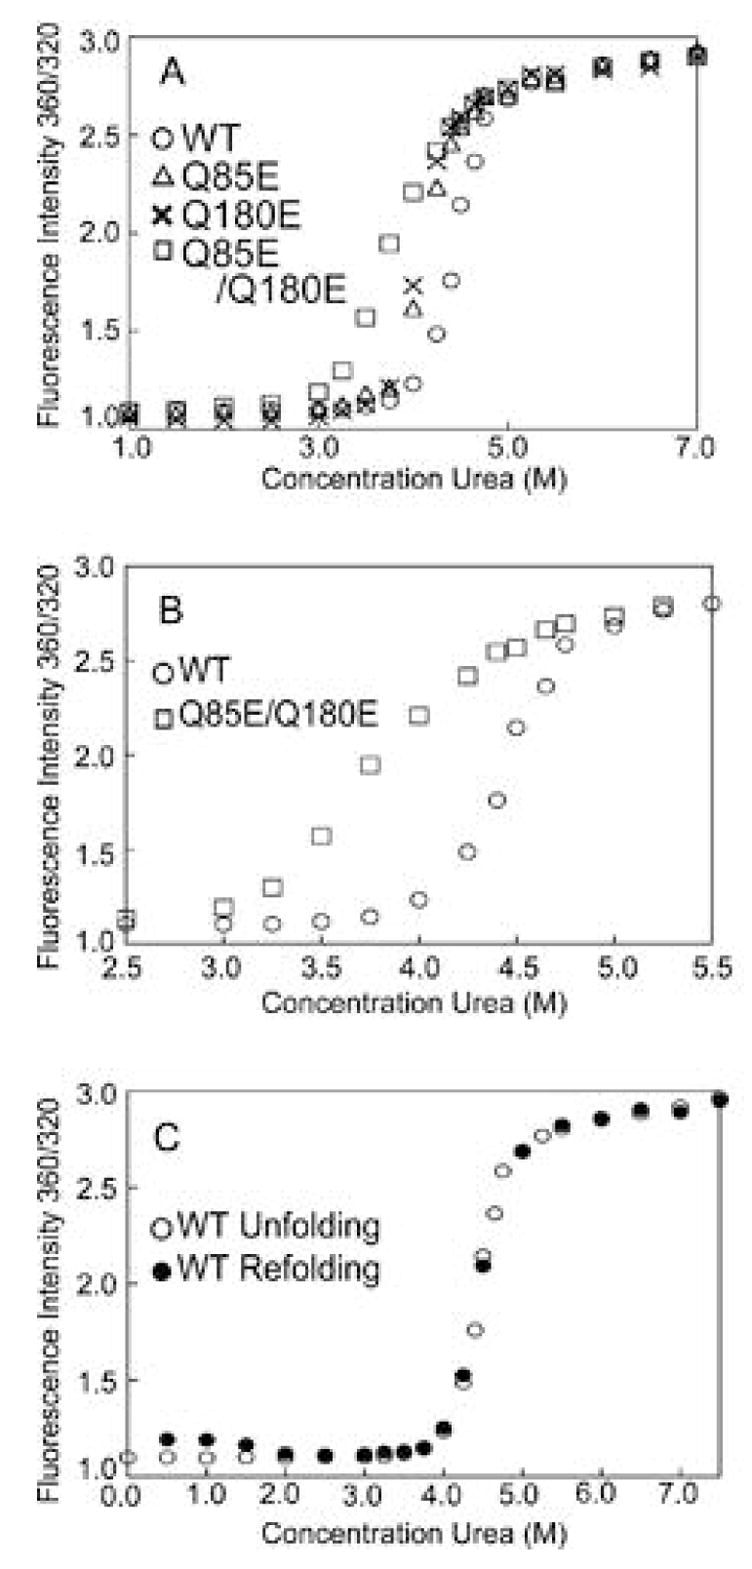
(A) Equilibrium unfolding of WT (○), Q85E (△), Q180E (5), and Q85E/Q180E (□) of βA3-crystallins in 0–8 M urea at 285 nm excitation. Proteins were analyzed at 1 μM concentration. Samples were excited at 285 nm and emission intensities recorded as described in the text. Data were analyzed as the ratio of fluorescence intensities at 360/320 nm (FI 360/320 nm). (B) Equilibrium unfolding of WT (○), and Q85E/Q180E (□) of βA3 in 2.5–5.5 M urea at 285 nm excitation. (C) Equilibrium unfolding of WT (○), and refolding of WT (●) of βA3 in 0–8.0 M urea at 285 nm excitation. Samples were incubated in urea buffer at 22 °C, of 5 h, then diluted to refold as described in the text.
Table 3.
Apparent Free Energy of unfolding for WT, Q85E, Q180E, and Q85E/Q180E βA3-crystallin.
| Protein | a CM | bΔCM | c Apparent ΔGD0 | d Apparent ΔΔGD0 |
|---|---|---|---|---|
| WTβA3 | 4.5 ±< 0.1 | − | 14 ± 2.0 | − |
| Q85E | 4.2 ±< 0.1 | −0.3 ±< 0.1 | 10 ±0.1 | −4.0 ±2.1 |
| Q180E | 4.1 ±< 0.1 | −0.4 ±< 0.1 | 9.6 ± 0.8 | −4.4 ± 1.9 |
| Q85E/Q180E | 3.7 ±< 0.1 | −0.8 ±< 0.1 | 4.4 ± 0.4 | −9.6 ± 2.4 |
The midpoints of unfolding transitions for mutants from extrapolation method.
ΔCM=CMmutant-CMwildtype in units of M.
The Apparent ΔG 0 (kcal/mol), of unfolding based on urea curves. RT1nK values were calculated for K =fD/fN from the transition region of the urea denaturation curves.
Apparent ΔΔGD0=ΔGD0mutant-ΔGD0wild type in units of kcal/mol.
Unfolding was reversible down to 2 M urea for WT and the mutants and refolding proceeded along similar paths to that observed during unfolding for all (Figure 9C). At urea concentrations < 2 M urea, there was a small increase in intensity due to light-scattering aggregates, indicating incomplete refolding.
The Effects of Deamidation on the Solubility of βA3-Crystallin during Heating
Wild type βA3 and Q85E/Q180E were heated at 55°C and the change in turbidities measured at 405 nm (Figure 10A). Experiments were performed at 55°C, because it had previously been reported that the majority of β A3 precipitated by 60°C (47). A lower temperature was chosen to distinguish differences between proteins and for comparison with our previously published data of WT βB1, which loses secondary structure at 60-65°C (27). Upon prolonged heating, WT βA3 had a greater turbidity than WT βB1 (Figure 10A). Deamidation significantly increased the turbidity of βA3 with the greatest increase occurring rapidly between 30 and 90 min. In a separate experiment, proteins were heated for 180 min and the precipitated protein visualized by SDS-PAGE. The same proportion of pellet was analyzed. A strong protein band was detected from the pellet of the Q85E/Q180E (Figure 10B, compare lanes 8 to 9).
Figure 10.
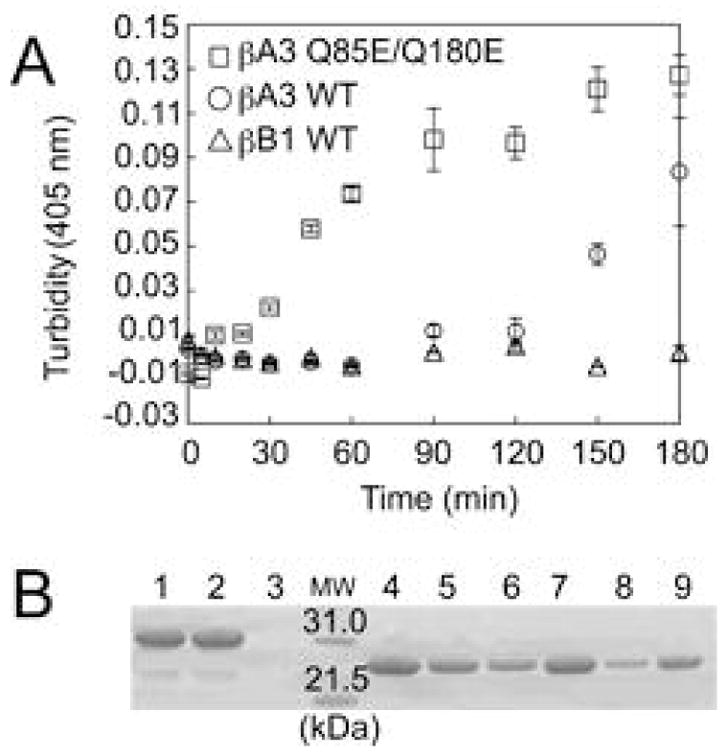
(A) Thermal aggregation/precipitation curves. Turbidity of WT βB1-crystallin (△), WT βA3-crystallin (○), and Q85E/Q180E βA3-crystallin (□) at 55 °C and a concentration of 0.5 mg/ml. The change in turbidity was measured at 405 nm on a microtiter plate reader. Error bars are standard derivations, N=3. (B) Samples heated for 180 min were also separated into supernatant and pellet and visualized by SDS-PAGE. Molecular weight marker (MW), WT βB1 before heating, supernatant, and pellet after heating (Lanes 1, 2, and 3); WT βA3 before heating, supernatant, and pellet after heating (Lanes 4, 5, and 6); and Q85E/Q180E of PA3 before heating, supernatant, and pellet after heating (Lanes 7, 8, and 9).
DISCUSSION
The amount of deamidation in the normal human adult and cataractous lens is striking (7, 11, 13). Yet, the significance of this modification in the lens is unknown. Deamidation may contribute to compromised function of the lens or simply accumulate due to the long life span of the lens proteins. The major results from this study found that deamidation in a highly conserved sequence and a predicted interface in β A3 decreased the stability without disrupting the dimer, suggesting an altered function of βA3.
Effect of Deamidation on βA3-Crystallin Structure
Wild type βA3 folded with the expected secondary structure similar to previous reports for βA3 and with a similar β-strand content to the β-Low fraction from bovine lenses (27, 41, 47–49). The maximum fluorescence intensity at 338 nm of WT was similar to previously reported values of 332–340 nm (47, 50), reflecting two exposed and three partially exposed Trp. The intensity from excitation at 295 nm was 80% of the intensity from excitation at 285 nm. Thus, Trp emission strongly contributed to the emission at 285 m (Figure 8). The maximum intensity for β B1 was at 336 nm and for β B2 at 227 nm, reflecting the fewer exposed Trp (35, 38, 47), with PB2 having only one exposed and one partially buried Trp (47).
Simulating deamidation in vitro at the predicted domain interface of βA3 did not dramatically alter secondary structure as indicated by only slight differences in the far-UV CD. There were no differences in the predicted β-strand content, but there was an 8–9% decrease in helical content and a 4–5% increase in other structure of the mutants. This could be explained by a possible loss of order or denaturation of the N-terminal extension without complete unfolding due to a loss of order of the β-strands comprising the Greek key motifs. Due to the uncertainty in predicting secondary structure of beta sheet proteins, the significance of these differences is unclear.
A lack of differences in the fluorescence emission, likewise suggested that the globular domains of all the proteins had folded with similar structure. Since, a strong Tyr emission at 285 nm can mask changes in the Trp emission, experiments were also performed at 295 nm and gave similar results. This suggested that the buried Trp were not different between WT and the mutants or that the emission of the exposed Trp dominated the emission. Near-UV CD spectroscopy was more sensitive to the tertiary structural changes than fluorescence emission was, particularly between WT and Q85E/Q180E. Taken together the CD and fluorescence results suggest that deamidation at the interface slightly altered the structure of βA3.
Wild type βA3 formed a dimer with weight averaged molar masses between 47–52 kDa at all concentrations tested. Sergeev et al have reported a monomer-dimer equilibrium that was dependent on concentration and temperature (29). Since, a monomer was not detected in our studies, even at the lowest concentrations, it is more likely that the differences were due to differences in salt and ionic strengths of the buffers used. Indeed when experiments were repeated without salt, masses were lower than the predicted dimer mass under the tailing edge of the peak where the concentrations would also be less. The methods used in both studies, MALS and sedimentation equilibrium are sensitive to buffer conditions (51). The difference may also reflect the three additional Cys residues in the murine βA3 that replace Ser residues in the human.
Deamidation did not disrupt homodimer formation. Even mimicking 100% deamidation did not dissociate the homodimer or cause higher-order oligomerization. Maintaining the neutral charge of these Gln residues at the interface appeared not to be critical for the folding of the domains or for dimer formation. Similar results were obtained for βB2 (35, 38). For βB1, deamidation in the N-terminal domain resulted in a slightly higher molar mass and an earlier elution on SEC, suggesting a much larger oligomer size than what was determined by MALS (35, 38). These differences in elution and behavior between the β-subunits, may partially be explained by a greater difference in secondary structure between WT βB1 and βB1 Q204E that was not detected in the other β-subunits. Recently, it has been reported that disruption of an ion pair across the dimer interface in the βB2 E74R mutant resulted in a more monomer-like protein with a drastically reduced solubility (52). This supports that ion pairs stabilize the hydrophobic interactions across the interface, while the conserved Gln residues fine-tune these interactions.
Comparison of the measured frictional coefficients to those calculated for spheres of the same molecular weights resulted in similar axial ratios using either a predicted oblate or prolate ellipsoid. A prolate would be more descriptive of the open βB2 model and an oblate more descriptive of a closed βB1 model. Other methods will be needed to distinguish possible shape differences between the two different models.
The Q85E/Q180E mutant was more susceptible to enzymatic digestion than WT, suggesting an increase in solvent accessibility. Further supporting structural differences particularly of Q85E/Q180E was the observation that the Q85E/Q180E eluted later on a cation exchange column suggesting a more exposed charge. This may be similar to reports that introducing a charge at the interface did not change the overall fold of γB-crystallin similar to what was seen here for βA3, but created a cavity filled with water molecules (32).
The above results are consistent with the modeled structure of deamidated βA3 and with what is known about βB1 and βB2 from their crystal structures (24, 25, 53). The side chains of Q85 and Q180 in βA3 and the homologous residues in βB1 and βB2 are at least partially buried and matched with what was reported for the homologous residues in γD-crystallin (54). These residues are involved in H-bonding across the domain or monomer interface. Hydrophobic residues also surround them. Introducing charged groups from Glu residues did not alter the secondary structure, in agreement with our experimental data. In the Q85E/Q180E model, there was a slightly greater distance across the interface, with the charges oriented away from each other. In the closed monomer model of WT βA3, the side chain of Q180 H-bonded with I87 across the domain interface. This was lost in the Q85E/Q180E model. The loss of H-bonds and the potential charge repulsions at the interface of the Q85E/Q180E, appear not to be great enough to dissociate the dimer, suggesting that the hydrophobic interactions may be able to counter these effects. The subtle structural changes due to deamidation are consistent with our experimental data and can explain the effect on stability described below.
Deamidation of βA3-Crystallin Decreases Stability
The urea stability of βA3 was intermediate between what we have reported before for βB1 and βB2 (35, 38). The urea concentrations for half unfolding of βB2, βA3, and βB1 were 2.9 M, 4.5 M, and 5.9 M, respectively.
The unfolding mechanisms for several members of the β/γ crystallin family have been hypothesized to contain several intermediates. Sergeev et al have described the dissociation of the βA3 dimer as a fast reversible monomer-dimer equilibrium with the intermediate containing both stable closed monomers and unstable open monomers (29). Even the unfolding of the monomer, γD, was best fit by three transitions with the first and second transition unfolding of the N-terminal domain and the third transition unfolding of the C-terminal domain (54). However, fitting the data to a three state model resulted in large errors of at least one of the transitions for βB2 (35), γD (37), and for βA3 in this study. Silent intermediates have been hypothesized for small globular proteins, where the intermediates are less stable than the unfolded state (55). Only when mutations were made in the wild type proteins were inflections in the unfolding curves present (35, 50, 54), suggesting that the intermediates had been stabilized. With Q85E/Q180E there was a loss of cooperativity, but not a plateau in the unfolding/ refolding curves. Other methods, such as CD, may be needed to detect the intermediates.
Deamidation in βA3 decreased its stability during urea-induced denaturation and heat-induced precipitation. The urea unfolding/refolding curves for Q85E and Q180E were shifted to lower urea concentrations. Similar results were obtained at the homologous residues in βB1 and βB2. Recently, the N- and C-terminal domains of βA3 were expressed independently and the C-terminal domain was determined to be less stable (50). In contrast, the N-terminal domain of βB2 is less stable than the C-terminal domain (56). Yet, with both βB2 and βA3, the single deamidated mutants were similarly destabilized regardless of the domains in which the deamidation was introduced ((35) and Figure 9A). This suggests that the effects of deamidation at these sites are at the interface rather than in the domains directly.
When simulating deamidation at both residues, there was a further decrease in stability and loss of cooperativity. The loss of cooperativity was most notable at lower urea concentrations. However, a distinct plateau in the transition for Q85E/Q180E was not observed as had been for Q70E/Q162E βB2 (35) and for Q204E βB1 (38), suggesting deamidation may have affected the unfolding of βB1 and βB2 differently than for βA3.
The difference in the apparent ΔGD0s between WT βA3 and the deamidated mutants is consistent with a loss of H-bonding observed in the Q85E/Q180E model. Charge repulsion and dissociation of H-bonding are enough to account for decreasing stability without dramatic structural changes.
In summary, simulating deamidation across the domain interface in βA3-crystallin led to subtle changes in secondary and tertiary structure without disrupting dimer formation. However, these structural changes were enough to decrease stability upon denaturation in urea or heat. Deamidation at the interface alone in βA3 or as previously reported in βB1 and βB2 was not enough to trigger spontaneous unfolding or precipitation. However, the accumulation of many deamidations over a long period of time such as occurs in vivo may lead to deamidation-mediated decrease in protein solubility. Of the reported deamidation sites to date in βA3, eight sites were more abundant in the insoluble proteins from aged lenses (11). While deamidation at Q85 or Q180 were not increased in the insoluble proteins, deamidation at these sites may contribute to decreased solubility by increasing the susceptibility of proteins to other modifications.
Alternatively, in other tissues deamidation has been proposed to have specific functions (14). The Gln 85 and 180 in βA3 are conserved among all the human β-crystallins, except for in βB1 where a Met replaces the Gln in the N-terminal domain (7, 57) and are located in highly conserved sequences of 10-15 residues, suggesting biological function. Based on their primary sequences, their deamidation rates would be predicted to be low and are in agreement with the limited data available on their in vivo rates (3, 14). This may imply controlled deamidation at these sites.
The observed changes in structure and stability may facilitate hetero-oligomer interactions by weakening the interface interactions of the homodimer. This “breathing” at the interface has recently been suggested as a potential mechanism by which βB2 forms complex hetero-oligomers and may also be important for βA3 (52, 58). Considering the low level of deamidation at these sites, this may be a fine-tuning mechanism to maintain crystallin order later in life. This would not exclude the possibility that the accumulation of large amounts of deamidation could eventually trigger precipitation. Future studies comparing deamidation sites in different regions should shed light on these different possibilities.
Acknowledgments
The authors would like to acknowledge Ted Brandon, Jennifer Dowd, Jason Lampi, Alaina Phillips, and Lionel Trujillio for their expert technical help. The authors also wish to thank Drs. Larry David and Noah Robinson for mass spectrometry analysis and Dawn Muhlestein for circular dichroism analysis.
Funding provided by the NIH/NEIR01-EY012239 (KJL), Oregon Lions Sight and Hearing Foundation grant (KJL), NIH/NCRR P20RR16454 and MJ. Murdock Foundation to the Biomolecular Research Center at Boise State University (JTO), and core grant EY 10572.
ABREVIATIONS
- BBSRC
Biotechnology and Biological Sciences Research Council
- DTT
dithiothreitol
- EDTA
ehtylendiaminetetraacetic acid
- FI
fluorescence intensity
- GuHCl
guanidine hydrochloride
- IPTG
isopropyl-beta-D-thiogalactopyranoside
- MES
2-(N-morpholino)ethanesulfonic acid
- MWCO
Molecular weight cut off
- PDB
Protein Data Bank
- SDS-PAGE
sodium dodecyl sulfate polyacrylamide gel electrophroresis
References
- 1.Resnikoff S, Pascolini D, Etya’ale D, Kocur I, Pararajasegaram R, Pokharel GP, Mariotti SP. Global data on visual impairment in the year 2002. Bull WHO. 2004;82:844–851. [PMC free article] [PubMed] [Google Scholar]
- 2.Delaye M, Tardieu A. Short-range order of crystallin proteins accounts for eye lens transparency. Nature. 1983;302:415–417. doi: 10.1038/302415a0. [DOI] [PubMed] [Google Scholar]
- 3.Zhang Z, Smith DL, Smith JB. Human beta-crystallins modified by backbone cleavage, deamidation and oxidation are prone to associate. Exp Eye Res. 2003;77:259–272. doi: 10.1016/s0014-4835(03)00159-3. [DOI] [PubMed] [Google Scholar]
- 4.Lapko VN, Smith DL, Smith JB. S-methylated cysteines in human lens gamma S-crystallins. Biochemistry. 2002;41:14645–14651. doi: 10.1021/bi0267700. [DOI] [PubMed] [Google Scholar]
- 5.Hanson SR, Hasan A, Smith DL, Smith JB. The major in vivo modifications of the human water-insoluble lens crystallins are disulfide bonds, deamidation, methionine oxidation and backbone cleavage. Exp Eye Res. 2000;71:195–207. doi: 10.1006/exer.2000.0868. [DOI] [PubMed] [Google Scholar]
- 6.Takemoto L, Boyle D. Deamidation of specific glutamine residues from alpha-A crystallin during aging of the human lens. Biochemistry. 1998;37:13681–13685. doi: 10.1021/bi981542k. [DOI] [PubMed] [Google Scholar]
- 7.Lampi KJ, Ma Z, Hanson SR, Azuma M, Shih M, Shearer TR, Smith DL, Smith JB, David LL. Age-related changes in human lens crystallins identified by two-dimensional electrophoresis and mass spectrometry. Exp Eye Res. 1998;67:31–43. doi: 10.1006/exer.1998.0481. [DOI] [PubMed] [Google Scholar]
- 8.Hanson SR, Smith DL, Smith JB. Deamidation and disulfide bonding in human lens gamma-crystallins. Exp Eye Res. 1998;67:301–312. doi: 10.1006/exer.1998.0530. [DOI] [PubMed] [Google Scholar]
- 9.Lund AL, Smith JB, Smith DL. Modifications of the water-insoluble human lens alpha-crystallins. Exp Eye Res. 1996;63:661–672. doi: 10.1006/exer.1996.0160. [DOI] [PubMed] [Google Scholar]
- 10.Groenen PJ, van Dongen MJ, Voorter CE, Bloemendal H, de Jong WW. Age-dependent deamidation of alpha B-crystallin. FEBS Lett. 1993;322:69–72. doi: 10.1016/0014-5793(93)81113-e. [DOI] [PubMed] [Google Scholar]
- 11.Wilmarth PA, Tanner S, Dasari S, Nagalla SR, Riviere MA, Bafna V, Pevzner PA, David LL. Age-related changes in human crystallins determined from comparative analysis of post translational modifications in young and aged lens: does deamidation contribute to crystallin insolubility? J Proteome Res. 2006;5:2554–2566. doi: 10.1021/pr050473a. [DOI] [PMC free article] [PubMed] [Google Scholar]
- 12.Ahmed MU, Brinkmann Frye E, Degenhardt TP, Thorpe SR, Baynes JW. N-epsilon-(carboxyethyl)lysine, a product of the chemical modification of proteins by methylglyoxal, increases with age in human lens proteins. Biochem J. 1997;324(Pt2):565–570. doi: 10.1042/bj3240565. [DOI] [PMC free article] [PubMed] [Google Scholar]
- 13.Searle BC, Dasari S, Wilmarth PA, Turner M, Reddy AP, David LL, Nagalla SR. Identification of protein modifications using MS/MS de novo sequencing and the OpenSea alignment algorithm. J Proteome Res. 2005;4:546–554. doi: 10.1021/pr049781j. [DOI] [PubMed] [Google Scholar]
- 14.Robinson NE, Robinson AB. Molecular Clocks. Chapter 15. Althouse Press; Cave Junction, OR: 2004. pp. 270–273. [Google Scholar]
- 15.Flatmark T. Multiple molecular forms of bovine heart cytochrome c. J Biol Chem. 1967;242:2454–2459. [PubMed] [Google Scholar]
- 16.Mulders JW, Hoekman WA, Bloemendal H, de Jong WW. Beta B1 crystallin is an amine-donor substrate for tissue transglutaminase. Exp Cell Res. 1987;17:1,296–305. doi: 10.1016/0014-4827(87)90163-7. [DOI] [PubMed] [Google Scholar]
- 17.Ma Z, Hanson SR, Lampi KJ, David LL, Smith DL, Smith JB. Age-related changes in human lens crystallins identified by HPLC and mass spectrometry. Exp Eye Res. 1998;67:21–30. doi: 10.1006/exer.1998.0482. [DOI] [PubMed] [Google Scholar]
- 18.Thomson JA, Augusteyn RC. Ontogeny of human lens crystallins. Exp Eye Res. 1985;40:393–410. doi: 10.1016/0014-4835(85)90152-6. [DOI] [PubMed] [Google Scholar]
- 19.Bindels JG, Bours J, Hoenders HJ. Age-dependent variations in the distribution of rat lens water-soluble crystallins. Size fractionation and molecular weight determination. Mech Ageing Dev. 1983;21:1–13. doi: 10.1016/0047-6374(83)90011-8. [DOI] [PubMed] [Google Scholar]
- 20.Bindels JG, Bessems GJ, de Man BM, Hoenders HJ. Comparative and age-dependent aspects of crystallin size and distribution in human, rabbit, bovine, rat, chicken, duck, frog and dogfish lenses. Comp Biochem Physiol B. 1983;76:47–55. doi: 10.1016/0305-0491(83)90169-4. [DOI] [PubMed] [Google Scholar]
- 21.Harms MJ, Wilmarth PA, Kapfer DM, Steel EA, David LL, Bachinger HP, Lampi KJ. Laser light-scattering evidence for an altered association of beta B1-crystallin deamidated in the connecting peptide. Protein Sci. 2004;13:678–686. doi: 10.1110/ps.03427504. [DOI] [PMC free article] [PubMed] [Google Scholar]
- 22.Chiou SH, Azari P, Himmel ME, Lin HK, Chang WP. Physicochemical characterization of beta-crystallins from bovine lenses: hydrodynamic and aggregation properties. J Protein Chem. 1989;8:19–32. doi: 10.1007/BF01025076. [DOI] [PubMed] [Google Scholar]
- 23.Bindels JG, de Man BM, Hoenders HJ. High-performance gel permeation chromatography of bovine eye lens proteins in combination with low-angle laser light scattering. Superior resolution of the oligomeric beta-crystallins. J Chromatogr. 1982;252:255–267. doi: 10.1016/s0021-9673(01)88416-8. [DOI] [PubMed] [Google Scholar]
- 24.Van Montfort RL, Bateman OA, Lubsen NH, Slingsby C. Crystal structure of truncated human betaB1-crystallin. Protein Sci. 2003;12:2606–2612. doi: 10.1110/ps.03265903. [DOI] [PMC free article] [PubMed] [Google Scholar]
- 25.Bax B, Lapatto R, Nalini V, Driessen H, Lindley PR, Mahadevan D, Blundell TL, Slingsby C. X-ray analysis of beta B2-crystallin and evolution of oligomeric lens proteins. Nature. 1990;347:776–780. doi: 10.1038/347776a0. [DOI] [PubMed] [Google Scholar]
- 26.Sergeev YV, Soustov LV, Chelnokov EV, Bityurin NM, Backlund PS, Jr, Wingfield PT, Ostrovsky MA, Hejtmancik JF. Increased sensitivity of amino-arm truncated betaA3-crystallin to UV-light-induced photoaggregation. Invest Ophthalmol Vis Sci. 2005;46:3263–3273. doi: 10.1167/iovs.05-0112. [DOI] [PubMed] [Google Scholar]
- 27.Hope JN, Chen HC, Hejtmancik JF. Beta A3/A1-crystallin association: role of the N-terminal arm. Protein Eng. 1994;7:445–451. doi: 10.1093/protein/7.3.445. [DOI] [PubMed] [Google Scholar]
- 28.Werten PJ, Carver JA, Jaenicke R, de Jong WW. The elusive role of the N-terminal extension of beta A3- and beta A1 -crystallin. Protein Eng. 1996;9:1021–1028. doi: 10.1093/protein/9.11.1021. [DOI] [PubMed] [Google Scholar]
- 29.Sergeev YV, Wingfield PT, Hejtmancik JF. Monomer-dimer equilibrium of normal and modified beta A3-crystallins: experimental determination and molecular modeling. Biochemistry. 2000;39:15799–15806. doi: 10.1021/bi001882h. [DOI] [PubMed] [Google Scholar]
- 30.Ajaz MS, Ma Z, Smith DL, Smith JB. Size of human lens beta-crystallin aggregates are distinguished by N-terminal truncation of betaB1. J Biol Chem. 1997;272:11250–11255. doi: 10.1074/jbc.272.17.11250. [DOI] [PubMed] [Google Scholar]
- 31.Lapatto R, Nalini V, Bax B, Driessen H, Lindley PF, Blundell TL, Slingsby C. High resolution structure of an oligomeric eye lens beta-crystallin. Loops, arches, linkers and interfaces in beta B2 dimer compared o a monomeric gamma-crystallin. J, Mol, Biol. 1991;222:1067–1083. doi: 10.1016/0022-2836(91)90594-v. [DOI] [PubMed] [Google Scholar]
- 32.Palme S, Jaenicke R, Slingsby C. X-ray structures of three interface mutants of gammaB-crystallin from bovine eye lens. Protein Sci. 1998;7:611–618. doi: 10.1002/pro.5560070310. [DOI] [PMC free article] [PubMed] [Google Scholar]
- 33.Wistow G, Slingsby C, Blundell T, Driessen H, De Jong W, Bloemendal H. Eye-lens proteins: the three-dimensional structure of beta-crystallin predicted from monomeric gamma-crystallin. FEBS Lett. 1981;133:9–16. doi: 10.1016/0014-5793(81)80460-7. [DOI] [PubMed] [Google Scholar]
- 34.Lampi KJ, Oxford JT, Bachinger HP, Shearer TR, David LL, Kapfer DM. Deamidation of human beta B1 alters the elongated structure of the dimer. Exp Eye Res. 2001;72:279–288. doi: 10.1006/exer.2000.0950. [DOI] [PubMed] [Google Scholar]
- 35.Lampi KJ, Amyx KK, Ahmann P, Steel EA. Deamidation in human lens betaB2-crystallin destabilizes the dimer. Biochemistry. 2006;45:3146–3153. doi: 10.1021/bi052051k. [DOI] [PMC free article] [PubMed] [Google Scholar]
- 36.Flaugh SL, Kosinski-Collins MS, King J. Interdomain side-chain interactions in human gammaD crystallin influencing folding and stability. Protein Sci. 2005;14:2030–2043. doi: 10.1110/ps.051460505. [DOI] [PMC free article] [PubMed] [Google Scholar]
- 37.Flaugh SL, Kosinski-Collins MS, King J. Contributions of hydrophobic domain interface interactions to the folding and stability of human gammaD-crystallin. Protein Sci. 2005;14:569–581. doi: 10.1110/ps.041111405. [DOI] [PMC free article] [PubMed] [Google Scholar]
- 38.Kim YH, Kapfer DM, Boekhorst J, Lubsen NH, Bachinger HP, Shearer TR, David LL, Feix JB, Lampi KJ. Deamidation, but not truncation, decreases the urea stability of a lens structural protein, betaB1-crystallin. Biochemistry. 2002;41:14076–14084. doi: 10.1021/bi026288h. [DOI] [PubMed] [Google Scholar]
- 39.Lees JG, Smith BR, Wien F, Miles AJ, Wallace BA. CDtool-an integrated software package for circular dichroism spectroscopic data processing, analysis, and archiving. Anal Biochem. 2004;332:285–289. doi: 10.1016/j.ab.2004.06.002. [DOI] [PubMed] [Google Scholar]
- 40.Whitmore L, Wallace BA. DICHROWEB, an online server for protein secondary structure analyses from circular dichroism spectroscopic data. Nucleic Acids Res. 2004;32:W668–673. doi: 10.1093/nar/gkh371. [DOI] [PMC free article] [PubMed] [Google Scholar]
- 41.Bloemendal M, Toumadje A, Johnson WC., Jr Bovine lens crystallins do contain helical structure: a circular dichroism study. Biochim Biophys Acta. 1999;1432:234–238. doi: 10.1016/s0167-4838(99)00107-7. [DOI] [PubMed] [Google Scholar]
- 42.Lobley A, Whitmore L, Wallace BA. DICHROWEB: an interactive website for the analysis of protein secondary structure from circular dichroism spectra. Bioinformatics. 2002;18:211–212. doi: 10.1093/bioinformatics/18.1.211. [DOI] [PubMed] [Google Scholar]
- 43.Johnson WC. Analyzing protein circular dichroism spectra for accurate secondary structures. Proteins. 1999;35:307–312. [PubMed] [Google Scholar]
- 44.Cantor CR, Schimmel PR. Biophysical chemistry. W. H. Freeman; San Francisco: 1980. [Google Scholar]
- 45.Pace CN. Determination and analysis of urea and guanidine hydrochloride denaturation curves. Methods Enzymol. 1986;131:266–280. doi: 10.1016/0076-6879(86)31045-0. [DOI] [PubMed] [Google Scholar]
- 46.Fraczkiewicz R, Braun W. Exact and efficient analytical calculation of the accessible surface areas and their gradients for macromolecules. J Comput Chem. 1998;19:319–333. [Google Scholar]
- 47.Bateman OA, Sarra R, van Genesen ST, Kappe G, Lubsen NH, Slingsby C. The stability of human acidic beta-crystallin oligomers and hetero-oligomers. Exp Eye Res. 2003;77:409–422. doi: 10.1016/s0014-4835(03)00173-8. [DOI] [PubMed] [Google Scholar]
- 48.Hejtmancik JR, Wingfield PT, Chambers C, Russell P, Chen HC, Sergeev YV, Hope JN. Association properties of betaB2- and betaA3-crystallin: ability to form dimers. Protein Eng. 1997;10:1347–1352. doi: 10.1093/protein/10.11.1347. [DOI] [PubMed] [Google Scholar]
- 49.Hope JN, Chen HC, Hejtmancik JR. Aggregation of beta A3-crystallin is independent of the specific sequence of the domain connecting peptide. J Biol Chem. 1994;269:21141–21145. [PubMed] [Google Scholar]
- 50.Gupta R, Srivastava K, Srivastava OP. Truncation of motifs III and IV in human lens betaA3-crystallin destabilizes the structure. Biochemistry. 2006;45:9964–9978. doi: 10.1021/bi060499v. [DOI] [PubMed] [Google Scholar]
- 51.Woodbury RL, Hardy SJ, Randall LL. Complex behavior in solution of homodimeric SecA. Protein Sci. 2002;11:875–882. doi: 10.1110/ps.4090102. [DOI] [PMC free article] [PubMed] [Google Scholar]
- 52.Smith MA, Bateman OA, Jaenicke R, Slingsby C. Mutation of interfaces in domain-swapped human betaB2-crystallin. Protein Sci. 2007;16:1–11. doi: 10.1110/ps.062659107. [DOI] [PMC free article] [PubMed] [Google Scholar]
- 53.Nalini V, Bax B, Driessen H, Moss DS, Lindley PR, Slingsby C. Close packing of an oligomeric eye lens beta-crystallin induces loss of symmetry and ordering of sequence extensions. J Mol Biol. 1994;236:1250–1258. doi: 10.1016/0022-2836(94)90025-6. [DOI] [PubMed] [Google Scholar]
- 54.Flaugh SL, Mills IA, King J. Glutamine deamidation destabilizes human gammaD-crystallin and lowers the kinetic barrier to unfolding. J Biol Chem. 2006;281:30782–30793. doi: 10.1074/jbc.M603882200. [DOI] [PubMed] [Google Scholar]
- 55.Bai Y. Hidden intermediates and levinthal paradox in the folding of small proteins. Biochem Biophys Res Commun. 2003;305:785–788. doi: 10.1016/s0006-291x(03)00800-3. [DOI] [PubMed] [Google Scholar]
- 56.Wieligmann K, Mayr EM, Jaenicke R. Folding and self-assembly of the domains of betaB2-crystallin from rat eye lens. J Mol Biol. 1999;286:989–994. doi: 10.1006/jmbi.1999.2554. [DOI] [PubMed] [Google Scholar]
- 57.David LL, Lampi KJ, Lund AL, Smith JB. The sequence of human betaB1-crystallin cDNA allows mass spectrometric detection of betaB1 protein missing portions of its N-terminal extension. J Biol Chem. 1996;271:4273–4279. doi: 10.1074/jbc.271.8.4273. [DOI] [PubMed] [Google Scholar]
- 58.MacDonald JT, Purkiss AG, Smith MA, Evans P, Goodfellow JM, Slingsby C. Unfolding crystallins: the destabilizing role of a beta-hairpin cysteine in betaB2-crystallin by simulation and experiment. Protein Sci. 2005;14:1282–1292. doi: 10.1110/ps.041227805. [DOI] [PMC free article] [PubMed] [Google Scholar]