

Abstract
Neurons concentrate mitochondria at sites in the cell that have a high demand for ATP and/or calcium buffering. To accomplish this, mitochondrial transport and docking are thought to respond to intracellular signaling pathways. However, the cell might also concentrate mitochondrial function by locally modulating mitochondrial activity. We tested this hypothesis by measuring the membrane potential of individual mitochondria throughout the axons of chick sensory neurons using the dye tetramethylrhodamine methylester (TMRM). We found no difference in the TMRM mitochondrial-to-cytoplasmic fluorescence ratio (Fm/Fc) among three functionally distinct regions: axonal branch points, distal axons, and the remaining axon shaft. In addition, we found no difference in Fm/Fc among stationary, retrogradely moving, or anterogradely moving mitochondria. However, Fm/Fc was significantly higher in the lamellipodia of growth cones, and among a small fraction of mitochondria throughout the axon. To identify possible signals controlling membrane potential, we used beads covalently coupled to survival and guidance cues to provide a local stimulus along the axon shaft. NGF- or semaphorin 3A-coupled beads caused a significant increase in Fm/Fc in the immediately adjacent region of axon, and this was diminished in the presence of the PI3 (phosphatidylinositol-3) kinase inhibitor LY294002 [2-(4-morpholinyl)-8-phenyl-4H-1-benzopyran-4-one] or the MAP (mitogen-activated protein) kinase inhibitor U0126 (1,4-diamino-2,3-dicyano-1,4-bis[2-amino-phenylthio]butadiene), demonstrating that signaling pathways downstream of both ligands affect the ΔΨm of mitochondria. In addition, general inhibition of receptor tyrosine kinase activity produced a profound global decrease in Fm/Fc. Thus, two guidance molecules that exert different effects on growth cone motility both elicit local, receptor-mediated increases in membrane potential.
Keywords: mitochondria, membrane potential, growth cone, axonal transport, cell signaling, growth factor
Introduction
The size and asymmetry of neurons result in a nonuniform distribution of demand for mitochondrial functions such as ATP synthesis and calcium homeostasis. As a result, neurons redistribute their mitochondria in response to immediate and local physiological conditions, both in vivo and in vitro (Hollenbeck and Saxton, 2005). Mitochondria are concentrated in areas of the neuron expected to have higher ATP consumption; indeed, synapses were first recognized ultrastructurally based in part on their high density of mitochondria (Palay, 1956; Hollenbeck and Saxton, 2005). Other such regions are active growth cones and axon branches (Morris and Hollenbeck, 1993; Ruthel and Hollenbeck, 2003; Miller and Sheetz, 2004), nodes of Ranvier (Berthold et al., 1993), myelination boundaries and demyelinated regions (Mutsaers and Carroll, 1998; Bristow et al., 2002), and sites of axonal protein translation (Martin et al., 1998). In addition, when the activity of synapses or entire tracts changes, the mitochondrial density changes in concert (for review, see Hollenbeck and Saxton, 2005). Furthermore, excluding mitochondria from some of these regions has profound effects on neuronal activity and synaptic plasticity (Li et al., 2004; Verstreken et al., 2005). Mitochondria are distributed within neurons by fast transport and docking interactions, both of which are likely to be regulated via specific cell signaling pathways (Ratner et al., 1998; Morfini et al., 2002, 2004; Chada and Hollenbeck, 2003, 2004; De Vos et al., 2003; Malaiyandi et al., 2005).
In this study, we asked whether neurons can regulate the amount of local mitochondrial function not only by positioning mitochondria in a particular axonal location but also by upregulating or downregulating the activity of those that are already present. If this were the case, we would expect that, under normal conditions, there would be significant intracellular variation in metabolic activity among mitochondria in the same neuron. Several studies using different measures of mitochondrial transmembrane potential (ΔΨm) have shown such variation, for example, between axonal and dendritic mitochondria (Overly et al., 1996), between axonal mitochondria moving in different directions (Miller and Sheetz, 2004), and in individual mitochondria, in an oscillating manner over time (Buckman and Reynolds, 2001). However, it is not known whether ΔΨm, like mitochondrial transport, changes with local demands, nor whether intracellular signaling might regulate ΔΨm within the neuron. Here, we assessed ΔΨm in sensory neurons in culture using a mitochondrial-to-cytoplasmic dye fluorescence ratio (Fm/Fc) under subquenching conditions. We measured variation in Fm/Fc among functionally distinct regions of the neuron and different mitochondrial populations, and also assessed the response of Fm/Fc to local and global signals. We find that Fm/Fc within a single cultured neuron is remarkably uniform with one exception: it is significantly higher in active growth cones. We also find that a similar increase in Fm/Fc can be produced by focal stimulation of the axon with two ligands, nerve growth factor (NGF) and semaphorin 3A (sema3A), that normally elicit growth cone responses (Mueller, 1999), and that inhibition of signaling pathways downstream of these ligands can induce a profound global depression of membrane potential.
Materials and Methods
Materials.
Reagents were obtained from Sigma-Aldrich unless otherwise specified.
Cell culture.
Dorsal root ganglia were dissected from the lumbosacral region of embryonic day 10 (E10) to E11 chick embryos, dissociated, and grown in supplemented L-15 medium as previously described (Bray et al., 1991; Morris and Hollenbeck, 1995; He and Baas, 2003). For cultures to be grown in serum-containing medium, ganglia were manually triturated in HBSS and plated on 25 mm round ethanol-cleaned glass coverslips that had been treated sequentially with 1 mg/ml poly-l-lysine (20 min), H2O, and 10 μg/ml laminin (20 min). When cells were to be grown in defined F12 medium, they were triturated in medium rather than HBSS and were then plated on coverslips that had been treated either overnight at 4°C or 40 min at 37°C with 50 μg/ml fibronectin (Calbiochem) dissolved in PBS. Serum-containing medium was used for mitochondrial inhibitor experiments, comparisons of Fm/Fc in different axonal regions, and comparisons between moving and stationary mitochondria, whereas defined F12 medium was used for experiments involving NGF or sema3A coupled to beads. Two different types of serum-containing medium were used. “C” medium consisting of L-15 (Invitrogen) plus 0.5% methyl cellulose, 10% fetal bovine serum (Atlanta Biologicals), 2 mm glutamine, 0.6% glucose, 100 U/ml penicillin/streptomycin, and 50 ng/ml NGF (Alamone Labs) was used overnight to establish cultures. Cells were then transferred to “F+” medium, identical to C medium except without 0.5% methyl cellulose, during dye loading and imaging. For some experiments, the glucose in the medium was replaced with 4 mm sodium pyruvate. For experiments using beads covalently coupled to guidance molecules, we used a defined medium (Gallo et al., 1997; Chada and Hollenbeck, 2003, 2004) consisting of the following: F12 medium (Invitrogen) supplemented with 0.1 mg/ml apo-transferrin, 2.5 mg/ml BSA, 20 μg/ml insulin, 20 nm progesterone, 17.8 μg/ml phospocreatine, 5 ng/ml sodium selenite, 2 mm glutamine, 4 mm sodium pyruvate, and buffered with 1 mm HEPES to pH 7. For overnight cultures, 90 ng/ml NGF was added to the medium, whereas during bead incubation a concentration of 5 ng/ml NGF was used in the medium.
Dye loading.
For determination of mitochondrial transmembrane potential (Scheffler, 1999; Nicholls and Budd, 2000), a 5 μm stock of tetramethylrhodamine methyl ester (TMRM) (Invitrogen) in DMSO was diluted into F+ medium to a final concentration of 20 nm. Cultures were exposed to 20 nm TMRM for 20 min at 37°C to allow dye equilibration across the plasma and inner mitochondrial membranes (Johnson et al., 1980; Farkas et al., 1989; Scaduto and Grotyohann, 1999). To confirm the rate of equilibration of TMRM across the plasma membrane, cytoplasmic fluorescence was measured in axons and growth cones after incubation in 20 nm dye for times ranging from 2 to 20 min. In both regions, cytoplasmic fluorescence reached its peak level within 2 min and increased no further, indicating that a 20 min incubation is more than adequate for dye equilibration. The matrix TMRM concentration of cells exposed in this way is subquenching, resulting in a direct relationship between fluorescence intensity and ΔΨm (Ward et al., 2000; Nakayama et al., 2002). For imaging, the medium was replaced with F+ containing 5 nm TMRM. Mitotracker Green FM (Invitrogen) was stored as a stock in DMSO and diluted to a final concentration of 50 nm in F+ medium along with 20 nm TMRM. Cells were incubated in this mixture for 15 min before being transferred to F+ medium with 20 nm TMRM but no Mitotracker and incubated for 5 min more to rinse out excess MitoTracker. For microscopy, cells were transferred to F+ with 5 nm TMRM. JC-1 staining was performed as described previously (Overly et al., 1996).
Light microscopy.
After mitochondrial dye loading, coverslips were mounted in a custom-made aluminum and Teflon holder or an aluminum Sykes-Moore chamber with enough F+/5 nm TMRM to fill the chamber (∼1 ml). A Nikon TE300 inverted fluorescence microscope with a Hamamatsu ORCA cooled CCD camera was used to record images. A Texas Red and FITC filter set was used to visualize TMRM and MitoTracker Green respectively. Twelve-bit images were acquired through a 60×, 1.4 numerical aperture oil-immersion objective, and choosing exposure times such that the brightest signals were at ∼75% saturation. JC-1 imaging was performed on a Bio-Rad MRC 600 confocal microscope, using excitation at 488 nm and simultaneous detection at 520 and 590 nm. Mitochondrial movement was tracked and analyzed as described previously (Morris and Hollenbeck, 1993, 1995; Overly et al., 1996).
Mitochondrial inhibitors.
Neuronal cultures were treated with 5 μm carbonyl cyanide p-(trifluoromethoxy)phenylhydrazone (FCCP), 20 μm FCCP, 2 μg/μl oligomycin plus 5 or 20 μm FCCP, 2 μm rotenone, or 200 nm antimycin A during the 20 min incubation with TMRM. Inhibitors were also present during imaging. For the oligomycin-only treatment, the cells were incubated without drugs during a 20 min loading with TMRM and then transferred to medium containing oligomycin before imaging; thus cells were exposed to oligomycin for 10 min or less.
Quantitative imaging.
Images were analyzed using MetaMorph software (Molecular Devices). TMRM images were thresholded to isolate the mitochondrial fluorescence from the rest of the image, and the fluorescence intensity was measured per square micrometer using the integrated morphometry analysis function. Cytoplasmic fluorescence was determined in hand-drawn regions a few micrometers from any mitochondrion. The diameter of a DRG axon from an E10–E11 embryo is ∼750 nm and the diameter of mitochondria is 250 nm, according to electron micrographs (Hollenbeck and Bamburg, 2003). The ΔΨm is proportional to the ratio of the [TMRM] on either side of the inner mitochondrial membrane. Thus, the ratio of the mitochondrial-to-cytoplasmic fluorescence in the same volume is proportional to ΔΨm (Ehrenberg et al., 1988; Diaz et al., 2000) and was determined using the following formula: [(Flmitochondria − (2/3) Flcytoplasm)/(1/3) Flcytoplasm]. This volume-corrected fluorescence ratio is used throughout the text and figures and is referred to as Fm/Fc. Mitochondria located within the growth cone itself were separated into two different populations and Fm/Fc was calculated with one of two formulas depending on their location within the growth cone and consistent with the dimensions of the mitochondria, axons, and growth cone as measured by electron microscopy. To determine the Fm/Fc of mitochondria located in the proximal (phase dense) region of the growth cone, where the thickness is similar to the axon, the above calculation was used. The distal portions of the growth cone (bright under phase microscopy) are thinner than the axon and approximately the thickness of a mitochondrion, so the following formula was used to calculate the Fm/Fc of mitochondria in those regions: [Flmitochondria/(1/3) Fl cytoplasm]. The value of Fm/Fc was used to determine the intracellular and intercellular variation in DRG neurons. As a measure of intercellular variation, the mean fluorescence ratio of all the mitochondria for each cell was determined giving a collection of cell means, and the SD of those cell means was determined. Intracellular variation was calculated by taking the SD of the mitochondrial fluorescence ratio for each cell to estimate variability and the mean of this collection of SDs was reported. For region comparisons, sections of the axon were categorized as being growth cones, branch points, or axon shafts. The region within 40 μm of the axon–growth cone junction was labeled as “distal axon” (Morris and Hollenbeck, 1993). “Branch points” included the portions of axon within 40 μm of the intersection, in all three directions. “Axon shaft” included areas >40 μm from either branch points or growth cones. Measurements taken in these three regions were compared with measurements made for mitochondria within the growth cones. Mitochondrial TMRM fluorescence ratio values among the four regions were compared with repeated-measures ANOVA (using SAS software) to assess intracellular variation in Fm/Fc.
The length and aspect ratio of individual mitochondria were measured in thresholded images using the integrated morphometry analysis function in MetaMorph. Measurements were collected from bath treatments of NGF, sema3A, 2-(4-morpholinyl)-8-phenyl-4H-1-benzopyran-4-one (LY294002), and 1,4-diamino-2,3-dicyano-1,4-bis[2-amino-phenylthio]butadiene (U0126) as well as treatments with NGF and sema3A beads. Morphology from images of control and treated cells gathered on the same day were compared by a t test.
Mitochondrial movement comparisons.
Cells were labeled with both TMRM and MitoTracker. First, an image of TMRM fluorescence was obtained as a measure of Fm/Fc. Then a series of six MitoTracker images taken at 10 s intervals was used to determine whether the mitochondrion was motile and direction of movement. The TMRM fluorescence of all stationary mitochondria in a single cell was averaged and compared with the fluorescence of moving mitochondria from the same cell using a paired t test. Comparisons of TMRM fluorescence values between anterogradely and retrogradely moving mitochondria from any axon were compared with an unpaired t test.
NGF and sema3A treatments.
Cells were grown overnight in C medium, and then 1 h before the experiment the NGF was washed out by replacement with F medium lacking NGF and returned to 37°C before loading with TMRM. Sema3A application also required removal of NGF-containing media in the same manner followed by 37°C incubation in 0.33 μg/ml sema3A-Fc (R&D Systems) for at least 30 min and up to 2 h. Incubation for 20 min with either 8 or 80 μm tyrphostin α-cyano-(3,5-di-t-butyl-4-hydroxy)thiocinnamide (AG879) along with TMRM (Sigma-Aldrich) was used to block receptor tyrosine kinase signaling. To inhibit phosphatidylinositol-3 (PI3) kinase, cells were exposed to 100 μm LY294002 (Sigma-Aldrich) during the 20 min incubation in TMRM. To inhibit mitogen-activated protein kinase (MAPK) signaling, cells were incubated in 20 μm U0126 with TMRM for 20 min. For focal exposure to NGF or sema3A, melamine beads with reactive carboxylate groups were coupled to carrier-free NGF, or sema3A-Fc (R&D Systems) with carboiidimide using the manufacturer's protocol (Polysciences) as described previously (Gallo et al., 1997; Gallo and Letourneau, 1998; Chada and Hollenbeck, 2003, 2004). Two microliters of beads were rinsed in F12 medium containing 5 ng/ml NGF for 5 min before being resuspended in 20 ml of the same F12 medium. Medium with beads was applied to cultures in 6 × 35 mm multiwell plates and these were incubated for at least 1 and up to 5 h at 37°C before being loaded with TMRM and examined under the microscope. Bead bioactivity was tested as described previously (Chada and Hollenbeck, 2003, 2004), by the active response of growth cones in turning toward NGF beads and away from sema3A beads. Only single beads adherent along the axon shaft were chosen for analysis, as described previously (Chada and Hollenbeck, 2003, 2004). To test for accumulation of mitochondria around a bead, two regions were compared: the 10 μm of the axon in the immediate vicinity of the bead and a 10 μm region of the axon 100 μm away from the bead. Three regions of the axon were considered when comparing Fm/Fc: the 10 μm immediately adjacent to the bead, the 100 μm region spanning 50 μm on either side of the bead not including the previous region, and portions of the axon >50 μm away from the bead. The fluorescence ratios for all mitochondria >50 μm from the bead were averaged, and this value was then compared with each mitochondrion in the two regions close to the bead to normalize for cell–cell variability. All fluorescence values were normalized against the mean fluorescence value from the most distal region of the axon. Data from each cell were normalized individually to take intercellular variability into account.
Results
Determining mitochondrial Fm/Fc using TMRM
Mitochondria use the potential energy stored in the ΔΨm for most mitochondrial functions including the production of ATP, take up or release of calcium or other ions, and import of proteins. A higher ΔΨm can potentially produce ATP, but also produces more reactive oxygen species (ROS). We previously used lipophilic cationic fluorescent dyes to specifically label, locate, and track mitochondria in live neurons (Morris and Hollenbeck, 1993, 1995; Overly et al., 1996; Chada and Hollenbeck, 2003, 2004). Here, we used TMRM, a rapidly equilibrating, relatively nontoxic, lipophilic cationic fluorescent dye (Farkas et al., 1989; Scaduto and Grotyohann, 1999) to label mitochondria and, via the ratio of mitochondrial-to-cytoplasmic fluorescence, to estimate the ΔΨm of individual organelles (Duchen et al., 1998; Mao and Kisaalita, 2004; H. M. Huang et al., 2005; Parihar and Brewer, 2007). To work at subquenching dye concentrations, in which mitochondrial-to-cytoplasmic TMRM fluorescence intensity ratio (Fm/Fc) (as described in Materials and Methods) is proportional to the ΔΨm, we loaded neurons with 20 nm TMRM (Ward et al., 2000; Nakayama et al., 2002). Mitochondrial TMRM intensity alone reflects both the inner membrane potential and the cytoplasmic dye concentration, and the latter can vary with plasma membrane potential. Measuring the ratio of mitochondrial-to-cytoplasmic dye fluorescence, Fm/Fc, corrects for variations in cytoplasmic dye concentration and yields a value reflecting only the inner mitochondrial membrane potential. This method also allows a continuous measure of membrane potential rather than a binary, polarized/depolarized measurement.
To verify the relationship between Fm/Fc and ΔΨm, we applied to dye-labeled cells a series of mitochondrial drugs with well characterized effects on respiration (Fig. 1). When oligomycin was used to inhibit F0/F1 ATPase, the Fm/Fc increased ∼20% compared with controls. The proton ionophore FCCP alone decreased Fm/Fc to 84% of control levels; FCCP treatment together with oligomycin decreased Fm/Fc to 27%. The modest effect of FCCP-alone treatment probably derives from reversal of the F0/F1 ATPase that can occur to maintain membrane potential in uncoupled cells (Leyssens et al., 1996; Takeda et al., 2004); this is supported by the much greater decrease in Fm/Fc when FCCP and oligomycin are used together. Inhibition of complex I or III with rotenone or antimycin A, respectively, decreased the Fm/Fc to 40–60% of controls (Fig. 1D). These predictable changes in fluorescence on treatment with mitochondrial inhibitors demonstrate that the Fm/Fc of TMRM is proportional to ΔΨm, allows reliable detection of changes in ΔΨm, and also confirms that this loading regimen provides a subquenching dye concentration.
Figure 1.
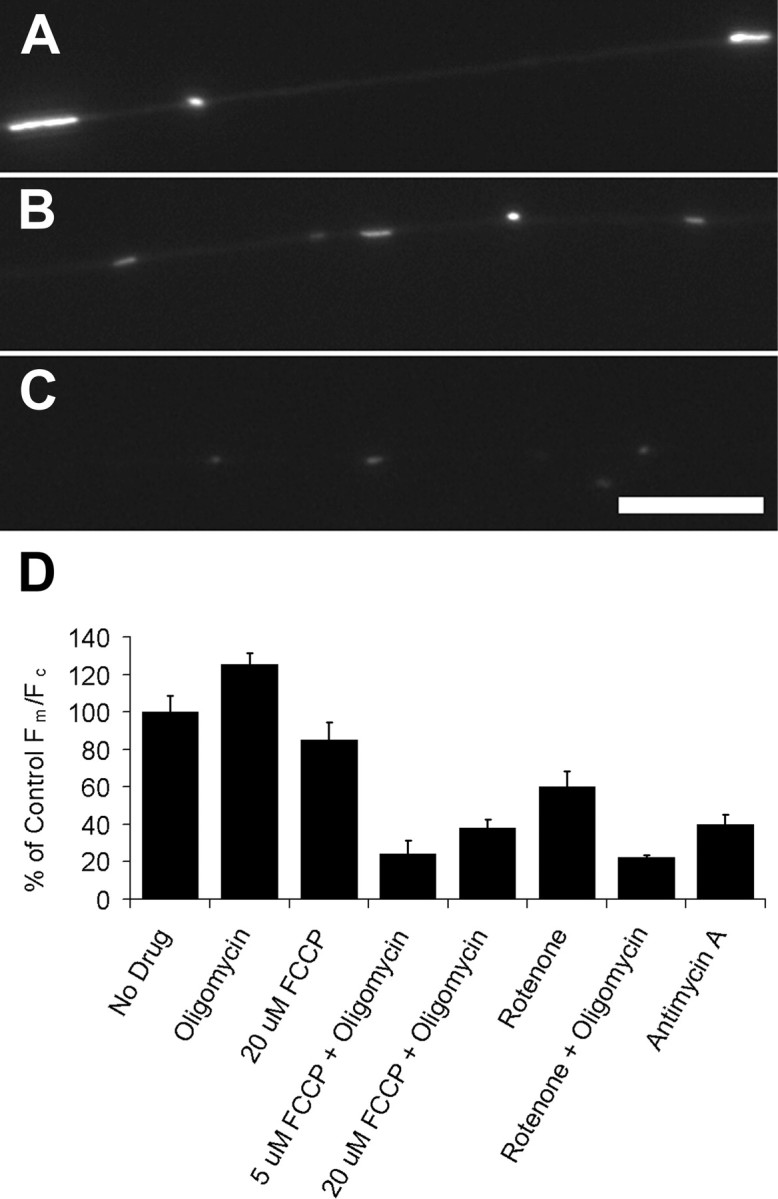
Mitochondrial TMRM fluorescence as a measure of Fm/Fc. Neurons were treated with uncoupler and/or inhibitors of electron transport and ATPase activity in the presence of TMRM. Fm/Fc was assessed using the ratio of mitochondrial-to-cytoplasmic fluorescence as described in Materials and Methods. A, Shown is a control cell with representative mitochondrial TMRM fluorescence. Axons treated with 2 μm rotenone (B) or 2 μm rotenone with 2 μg/ml oligomycin (C) show diminished mitochondrial fluorescence. A appears overexposed because A–C are displayed with identical exposures and image processing. Scale bar, 10 μm. D, The TMRM fluorescence ratio of mitochondria was increased by oligomycin treatment, decreased by FCCP, rotenone, or antimycin A, and decreased the most with combined treatment of oligomycin and FCCP or rotenone. From left to right, n = 18, 20, 12, 16, 15, 12, 8, and 10 neurons. Error bars show SEM.
Regional variation of Fm/Fc in neurons
To determine parameters that might alter Fm/Fc, we first looked at its range of variation in unperturbed cultured neurons. Previous experiments (Johnson et al., 1980, 1981) and our own observations have shown apparent variation in mitochondrial fluorescence among cells using various lipophilic cationic dyes. Variation in ΔΨm has also been noted within individual cells, and this may reflect subcellular control of mitochondrial respiration (Huang et al., 2004). We determined Fm/Fc of individual mitochondria within many neurons in culture and compared intracellular and intercellular variation. Intercellular variation in Fm/Fc was larger than intracellular variation, as can be seen in plots of a set of representative cells (Fig. 2A). The variation in Fm/Fc between cells, measured as the mean of the SDs, was 4.25 and was much larger than the variation in Fm/Fc within the mitochondria in each neuron, measured as the SD of a sample of mean mitochondrial Fm/Fc from different neurons, which was 1.77. The intercellular variation in Fm/Fc could reflect differences in cellular activities among neurons, such as axonal outgrowth or retraction, which would result in regulation of mitochondrial activity. In a larger population of 94 neurons with 1122 mitochondria, the mean Fm/Fc was 11.0 with a slightly one-tailed unimodal distribution including a small population of highly polarized mitochondria (Fig. 2B).
Figure 2.
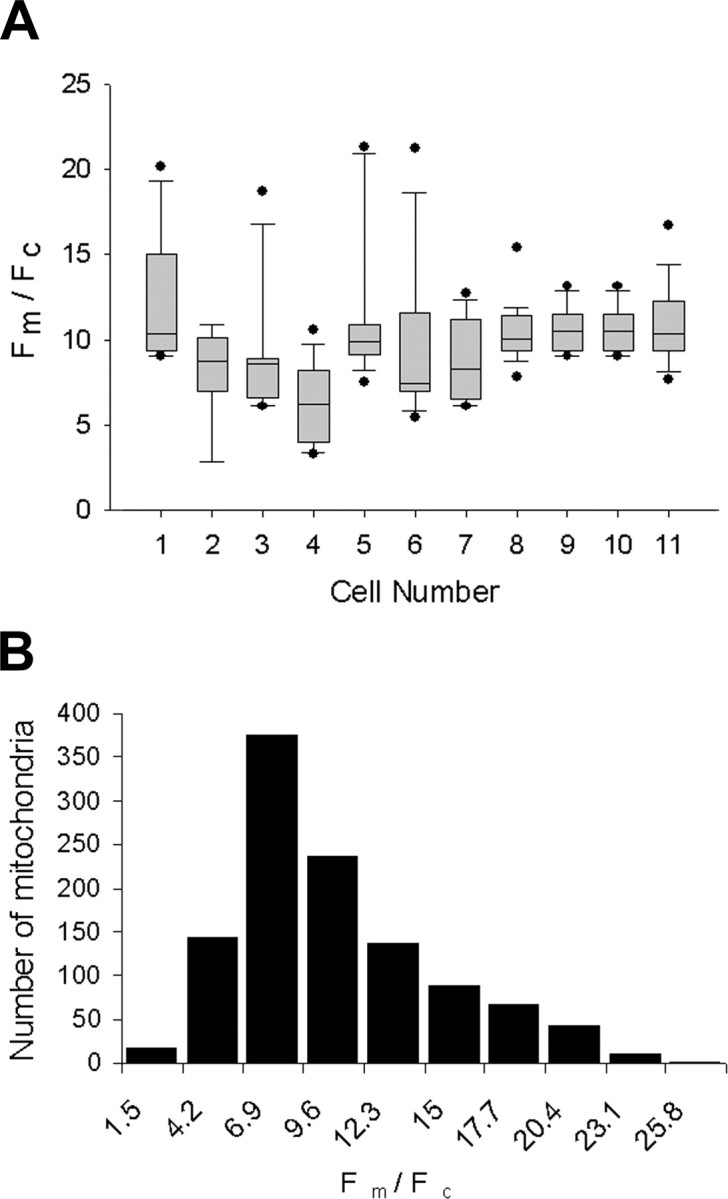
Samples of Fm/Fc show greater intercellular than intracellular variation. A, The mitochondrial fluorescence ratio distribution is shown for a representative sample of 11 neurons using a box plot and shows the mean (middle hash mark), 25th and 75th percentiles (top and bottom of box), 10th and 90th percentiles (top and bottom error bars), and any data points beyond the 10th and 90th percentiles (top and bottom dots). B, Histogram of Fm/Fc shows a larger sample of 94 neurons with 1122 mitochondria but includes the sample of 11 neurons shown in A. The total population of Fm/Fc does not show a normal distribution but has a tail with a higher Fm/Fc. All mitochondria were sampled from the axon shaft with 5–15 mitochondria per axon.
We next determined whether this highly polarized subset was found preferentially in a particular region of the axon. Neurons have long been thought to exert control over mitochondrial position in response to local ATP demand, causing them to accumulate at, for example, active growth cones, synapses, and nodes of Ranvier (Hollenbeck and Saxton, 2005). To investigate whether neurons might also exert local control over Fm/Fc, we examined mitochondria in four functionally different regions of the axon: the axon shaft; the neighborhood of branch points, where mitochondria often accumulate; the distal axon close to growth cones, where mitochondrial transport and distribution are differentially regulated (Morris and Hollenbeck, 1993); and within the growth cones themselves, an anticipated region of higher ATP demand (Bernstein and Bamburg, 2003). To correct for intercellular variation in Fm/Fc, we compared values for all four regions by a repeated-measures ANOVA. There was no significant difference in Fm/Fc among the axon shafts, branch points, or distal axons in these neurons (Table 1, “Comparison along axon”). However, the mitochondrial population found within growth cones had a mean Fm/Fc that was significantly greater (27%) than in surrounding regions (Table 1, “Comparison in growth cone”). Although the difference in uncorrected fluorescence intensities between axonal and growth cone mitochondria was only modest, the corrected Fm/Fc, based on best measurements of thickness for these axons (see Materials and Methods), showed a significantly higher Fm/Fc in the growth cone compared with the axon. Thus, although we found no correlation between Fm/Fc and different regions of the axon, we conclude that growth cones were foci of higher Fm/Fc.
Table 1.
Repeated-measures ANOVA
| Mean FIm/FIc | SD | N = cells/mitos | ||
|---|---|---|---|---|
| Comparison along axon | ||||
| Axon | 3.51 | 1.46 | 83/507 | |
| Branch point | 2.54 | 0.82 | 65/297 | |
| Distal axon | 3.78 | 1.67 | 49/318 | |
| F = 0.94; p = 0.39 | ||||
| Comparison in growth cone | ||||
| Growth cone | 5.76 | 3.51 | 6/12 | |
| Distal axon | 4.53 | 2.03 | 6/34 | |
| F = 48.84; p < 0.001 |
mitos, Mitochondria.
Because mitochondria are delivered to different regions of the axon by regulated transport (Hollenbeck and Saxton, 2005), it is possible that some of the intracellular heterogeneity in Fm/Fc that we observed reflects differences in their transport. The small fraction of mitochondria with a significantly higher Fm/Fc that are distributed throughout the axons might correspond to the minority of mitochondria that are moving at any one time. For example, moving and stationary mitochondria, or anterogradely moving and retrogradely moving mitochondria might differ because of composition, age, or other factors. Experiments in which neuronal mitochondria were labeled with the aggregating dye JC-1 have shown that mitochondria moving anterogradely predominantly have concentrated JC-1 to the point of J aggregation, resulting in red fluorescence, whereas those moving retrogradely displayed predominantly green fluorescence reflecting less concentrated, unaggregated dye. These authors concluded that ΔΨm varies with transport direction (Miller and Sheetz, 2004). We also found a difference in the JC-1 emission spectra of anterogradely and retrogradely moving mitochondria: the predominantly red-fluorescing population in these axons spent 11% of its time moving anterogradely and 6% moving retrogradely, and exhibited net anterograde movement, whereas the predominantly green population spent 5% of its time moving anterogradely and 6% moving retrogradely, yielding net retrograde movement. However, when we compared anterogradely, retrogradely, and stationary mitochondria quantitatively using the Fm/Fc of TMRM, we obtained different results. We discerned among mitochondria moving anterogradely, retrogradely, and not at all by double-labeling cells with MitoTracker Green FM and TMRM, determining the Fm/Fc of axonal mitochondria with the TMRM signal (Fig. 3C), and then observing them for 60 s using the MitoTracker signal to determine whether and in what direction they moved (Fig. 3A,B). Paired t tests showed no significant difference in Fm/Fc between stationary and moving mitochondria, and no difference between mitochondria moving retrogradely and anterogradely (Fig. 3D). Thus, within our limits of resolution, Fm/Fc does not vary with mitochondrial movement.
Figure 3.
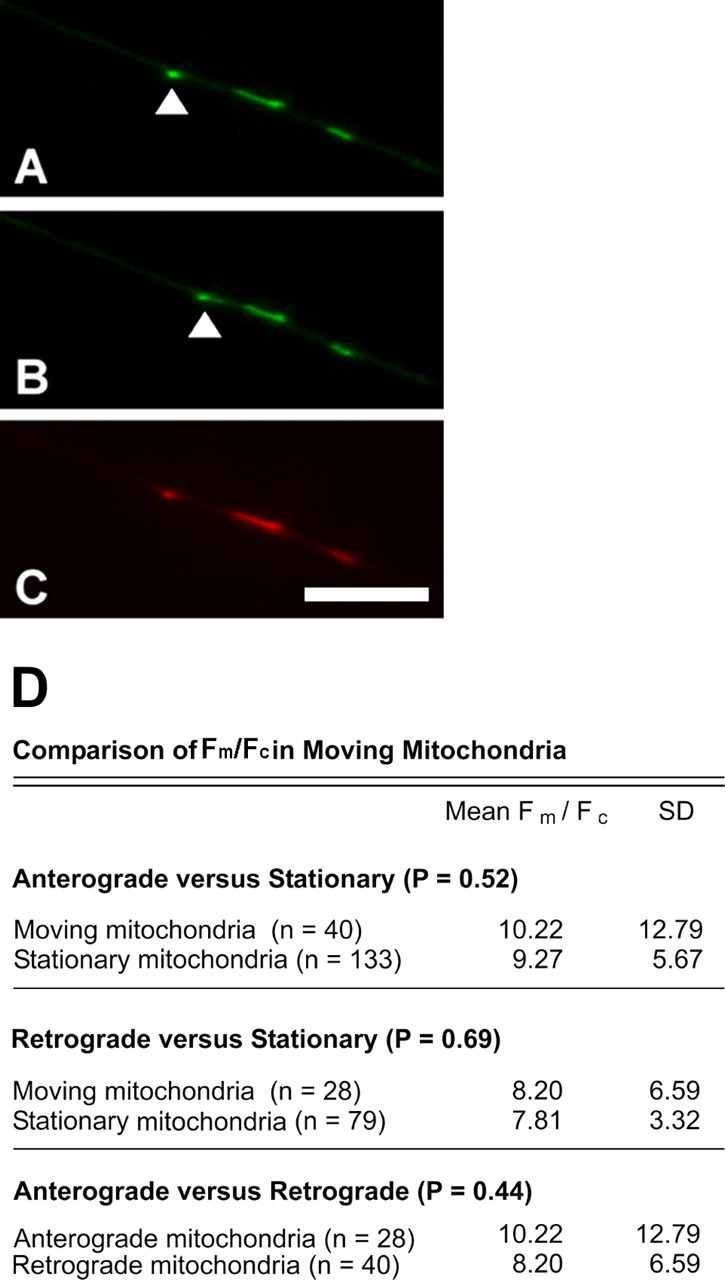
Comparison of Fm/Fc between anterogradely moving, retrogradely moving, and stationary mitochondria shows no difference in Fm/Fc. Mitochondria were stained with both Mitotracker and TMRM. A, B, Imaging of Mitotracker shows the position mitochondria along the axon; these two images were acquired 60 s apart. A single moving mitochondrion is highlighted with an arrow. C, TMRM staining of the same field in A indicates Fm/Fc. Scale bar, 10 μm. D, Comparisons of populations of mitochondria using a paired t test shows that the Fm/Fc does not vary between stationary and moving mitochondria, or between anterogradely and retrogradely moving mitochondria. n = 33 and 21 cells for that containing anterogradely or retrogradely moving mitochondria, respectively.
Axon guidance molecules affect Fm/Fc
Local regulation of ΔΨm could result from intracellular signaling events, perhaps to locally regulate ATP production, calcium sequestration, or generation of ROS as seen in other cell types (Duchen et al., 1998; Kuznetsov et al., 2004; Brown et al., 2006; Naga et al., 2007). Previous experiments have shown that focal NGF signaling along the axon attracts and retains mitochondria in the immediate vicinity of the stimulation, an effect mediated by the PI3 kinase and MAP kinase signaling pathways (Chada and Hollenbeck, 2003, 2004). This recruitment of mitochondrial function could be accentuated if the same stimuli not only retained them in the region but also increased their metabolic activity. To probe the effects of NGF signaling on Fm/Fc, we incubated the neurons with a receptor tyrosine kinase inhibitor, tyrphosin AG879. Tyrphostins inhibit the activity of receptor tyrosine kinases and 100 μm tyrphostin 879 has been shown to prevent cell differentiation and block activation of all three major downstream pathways of NGF without affecting EGF (epidermal growth factor) or PDGF, two other major tyrosine kinases of DRG neurons (Ohmichi et al., 1993; Rende et al., 2000). We found that brief treatment of neurons with 80 μm tyrphostin diminished Fm/Fc by 80%, a large decrease that was comparable with that caused by combined treatment with oligomycin and proton ionophores. Even 8 μm tyrphostin diminished Fm/Fc by 60% (Fig. 4D), indicating that the maintenance of normal Fm/Fc in these neurons depends strongly on receptor tyrosine kinase signaling probably but perhaps not entirely through NGF. Treated neurons appeared otherwise robust and mitochondria were not fragmented, indicating that the large decrease in Fm/Fc was achieved without cell death or damage to the mitochondria. When we merely washed NGF out of the culture medium, the Fm/Fc of axonal mitochondria still underwent a small but significant decrease (Fig. 5). Incubation of cultures with 100 μm LY294002, a PI3 kinase inhibitor, decreased Fm/Fc by 20%, whereas incubation with 10 μm U0126, a MAP kinase inhibitor, decreased it by 34% (Fig. 5), indicating that the effect of NGF on Fm/Fc involves both PI3 kinase and MAPK signaling. However, incubation with both MAPK and PI3K inhibitors decreased Fm/Fc the same amount as inhibiting MAPK alone, suggesting that these pathways intersect upstream of MAPK on the way to their mitochondrial target. None of these drug treatments altered mitochondrial length or morphology (data not shown) (see Materials and Methods) showing that the changes in fluorescence ratio reflect changes in membrane potential rather than geometry. When the cells were cultured in medium containing pyruvate instead of glucose, thereby bypassing glycolysis as a source of substrate, treatment with U0126 still decreased Fm/Fc. This indicates that effects of the MAPK pathway on Fm/Fc do not involve regulation of glycolysis (Fig. 5).
Figure 4.

Inhibition of receptor tyrosine kinase signaling decreases Fm/Fc. Cells were incubated for 20 min with the indicated concentrations of tyrphostin AG879 to block NGF signaling. Fluorescent images were taken of control (A), 8 μm (B), or 80 μm (C) tyrphostin-treated cells. The control images appear overexposed because images in A–C have identical exposure times and image processing to render visible the mitochondria in the 80 μm treatment. Scale bar, 10 μm. D, Tyrphostin AG879 decreased Fm/Fc to 40 and 20% of control cells. For both treatments, p < 0.001 compared with control. From left to right, n = 18, 16, and 12 neurons. Error bars show SEM.
Figure 5.

Global treatment of neurons with NGF and inhibitors of NGF pathways. Addition of 50 ng/ml NGF to the culture medium increased the Fm/Fc. The effect of 50 ng/ml NGF is significantly diminished by adding 100 μm PI3 kinase inhibitor LY294002 or 10 μm MAPK inhibitor U0126. A combination of LY294992 and U0126 decreased Fm/Fc only as much as U0126 alone. U0126 decreased Fm/Fc in neurons cultured in pyruvate when compared with cells also cultured in pyruvate but not treated with U0126. From left to right, n = 26, 22, 18, 17, 24, and 21 neurons. *p < 0.001. Error bars show SEM.
Unlike NGF, which is an attractive cue for growth cones, semaphorins are repulsive guidance molecules. Exposure to semaphorin induces rearrangement of the cytoskeleton and causes the growth cone either to turn away from a source of semaphorin or to collapse completely (Castellani and Rougon, 2002). Semaphorin also influences downstream PIP3 signaling by activating phosphatase and tensin homolog deleted on chromosome 10 (PTEN) and decreasing PIP3 concentrations, and PI3 kinase inactivation is required for semaphorin-induced growth cone collapse (Ming et al., 1999; Atwal et al., 2003; Chadborn et al., 2006). Incubation of neurons in sema3A in the absence of NGF resulted in a decrease in Fm/Fc of 10% [normalized control, 1.00 ± 0.049 (n = 27); sema3A, 0.90 ± 0.058 (n = 25); p < 0.01]. In the presence of saturating NGF, sema3A treatment had no effect on Fm/Fc. As with drug treatments, NGF and sema3A did not induce changes in mitochondrial length or shape (see Materials and Methods).
Although neurons in culture experience a uniform exposure to nutrients and growth factors over their entire surface, in vivo they are exposed to trophic factors and guidance molecules locally or in gradients (Bandtlow et al., 1987; Kennedy et al., 2006). Thus, homogeneous exposure to growth factors could explain the surprisingly low intracellular variation in Fm/Fc that we observed, whereas the higher density of receptors at the growth cone (Kim et al., 1979) could explain the higher Fm/Fc of mitochondria there (Table 1). To provide the axons with a focal source of NGF or sema3A that would more closely mimic the exposure to guidance cues in vivo, we used beads covalently coupled to either NGF or sema3A. Several hours of contact with NGF beads can cause sprouting of new growth cones (Gallo and Letourneau, 1998). On a shorter timescale, NGF-coupled beads affect the transport of mitochondria, and mitochondria accumulate near sites of bead–axon contact (Chada and Hollenbeck, 2003, 2004) (see Fig. 7A) before new axons are formed. We found that mitochondria also accumulate in the immediate vicinity of sema3A-coupled beads compared with a region of the same size 100 μm away from a bead (Fig. 6). Because both NGF and sema3A signaling affect mitochondrial transport and have an effect on ΔΨm when applied homogeneously to the cell, we asked whether ΔΨm of individual mitochondria is affected by local NGF or sema3A stimulation. Compared with control heat-inactivated beads, NGF beads caused an increase of 46% in Fm/Fc in the 10 μm of axon immediately adjacent to the bead (Fig. 7C), whereas sema3A beads caused a 63% increase in Fm/Fc. Mitochondria that were >40 μm away from sites of bead–axon contact showed no effect, whereas those 10–40 μm away from either NGF or sema3A beads showed an intermediate increase of ∼10%. Both NGF and sema3A signaling were dependent on PI3 kinase and MAPK signaling, because the addition of the kinase inhibitors LY294002 or U0126 diminished the increase in Fm/Fc in the 10 μm of axon adjacent to the bead to statistical insignificance (Fig. 7C,D). The specific increase in Fm/Fc adjacent to the beads indicates that neurons can regulate Fm/Fc of individual mitochondria in response to molecular signals, but only within short distances.
Figure 7.
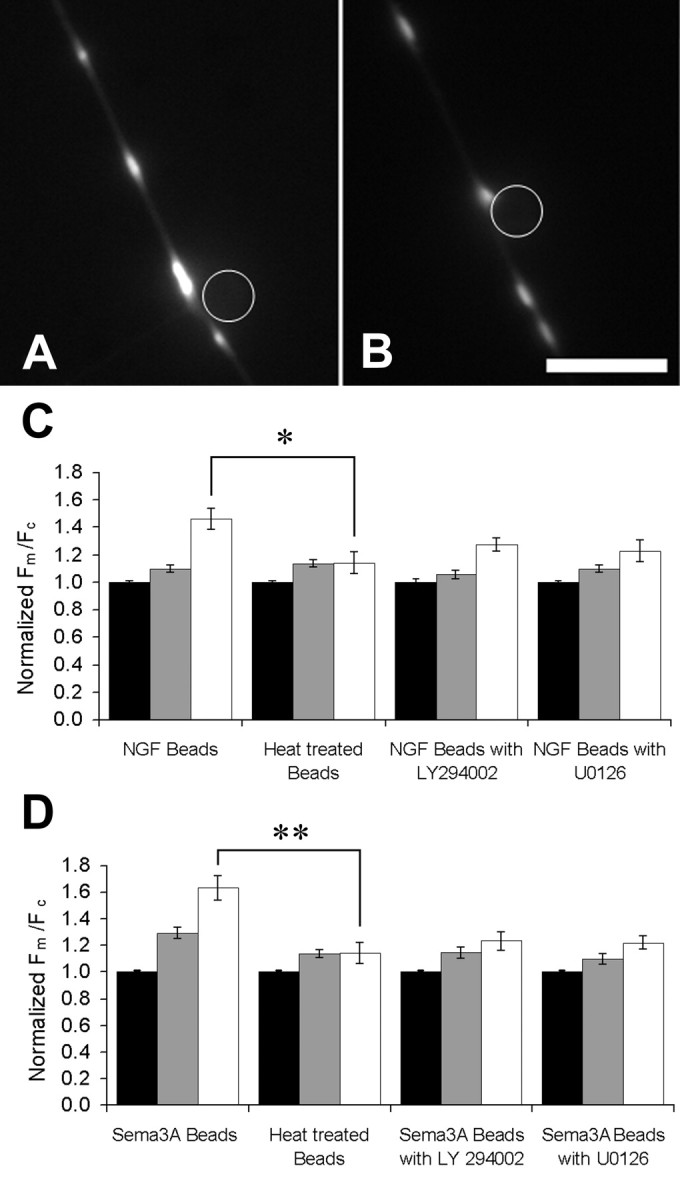
Axons incubated with NGF- or semaphorin 3A-coated beads display a local increase in Fm/Fc in the region of axon immediately adjacent to the bead. Cells were rinsed and incubated in very low NGF medium and beads for 1 h before experiments. Fluorescence images show sites where an NGF-coated bead (A) and a sema3A-coated bead (B) are in contact with otherwise undistinguished regions of axons. Scale bar, 10 μm. C, The distance between the mitochondria and the bead was measured and used to sort them into three groups: those in the 10 μm of axon centered on the bead (white bars), those between 5 and 50 μm away (gray bars), and those >50 μm from the bead (black bars). The mean Fm/Fc of axonal mitochondria was increased within 50 μm of the site of contact with an NGF bead, and this effect was even greater for mitochondria in the 10 μm region centered on the contact site. The increase in Fm/Fc near the NGF bead was partially blocked by either PI3 kinase inhibitor LY294002 or MAPK inhibitor U0126 for 20 min. From left to right, n = 18, 22, 20, and 16 neurons. D, The mitochondria in axons treated with sema3A-coated bead were sorted according to distance from the site of axon–bead contact as just described. The mean Fm/Fc of axonal mitochondria was also increased within 50 μm of the site of contact with a sema3A bead, and this effect was even greater for mitochondria adjacent to the contact site. The increase in Fm/Fc near the sema3A bead was partially blocked by PI3 kinase inhibitor LY294002 or MAPK inhibitor U0126. Heat denaturation of both kinds of beads eliminated their effect on Fm/Fc. From left to right, n = 18, 17, 21, and 16 neurons. *p < 0.05; **p < 0.01. Error bars show SEM.
Figure 6.

Mitochondria accumulate at sites of contact between the axon and semaphorin 3A-coated beads. The total TMRM fluorescence was compared between regions around either sema3A-coupled beads (black bars; n = 28 cells) or heat-treated inactive beads (white bars; n = 20 cells). The 10 μm immediately surrounding the bead was compared with a 10 μm region of the axon 100 μm away from the bead to be far enough away from any effect from the bead. Mitochondria were often closely adjacent to one another and could not be distinguished individually, so total fluorescence was compared between the two regions. Mitochondria accumulate around the sema3A beads shown by a significant increase in mitochondrial fluorescence when compared with heat-inactivated beads by a t test. *p < 0.001. Error bars show SEM.
Discussion
We assessed the proposition that neurons can respond to local demand for mitochondrial function by regulating mitochondrial metabolic state. We measured this quantitatively in intact sensory neurons using the cationic dye TMRM and taking its Fm/Fc ratio to estimate the ΔΨm of mitochondria throughout the axons. We found that mitochondria in the growth cone of steady-state neurons, or close to a bead coated with guidance molecules, showed a significantly higher Fm/Fc that is likely attributable to the stimulation of intracellular signaling pathways.
Most of what we know about the range of mitochondrial transmembrane potential comes from studies with isolated organelles (Scaduto and Grotyohann, 1999; Mattiasson et al., 2003) that show two different respiratory states, depending on substrate and ADP concentrations (Chance and Williams, 1955). The difference in ΔΨm between those two states in isolated mitochondria is only a fraction of the maximal ΔΨm. The range of ΔΨm for mitochondria in a living cell is less certain, but there is some indication that it lies between the two states identified in vitro (Jekabsons and Nicholls, 2004). In sensory neurons, we found that treatment with either FCCP or oligomycin alone caused only a ∼20% change in Fm/Fc, implying that under normal intracellular conditions, as in vitro, modest changes in Fm/Fc can correspond to large differences in respiratory activity. Our data also show that Fm/Fc can be decreased even further by combined treatment with several inhibitors of oxidative phosphorylation. However, a more profound effect than any of the conventional mitochondrial inhibitors was produced by blocking receptor tyrosine kinase and NGF signaling with tyrphostin AG879, suggesting that modulation of cellular signaling plays an important role in regulating ΔΨm and respiratory status in the neuron.
Intrinsic variation in neuronal ΔΨm
Physiological intracellular variation in ΔΨm has been observed in non-neuronal cells (Johnson et al., 1980; O'Reilly et al., 2003) and clearly has functional significance in cells such as myocytes (Duchen et al., 1998). Quantitative evidence for different metabolic states among neuronal mitochondria comes from studies of cultured forebrain neurons, in which mitochondria in axons showed small, spontaneous oscillations between two levels of ΔΨm on a timescale of minutes (Buckman and Reynolds, 2001). Their function is unclear, and similar oscillations occur in vitro, in mitochondria isolated from brain (Vergun et al., 2003). In chick sensory neurons, we found relatively little difference in Fm/Fc among mitochondria throughout an axon compared with the variation we saw among different neurons. For example, we did not observe the differences in Fm/Fc between the distal axon (near the growth cone) and the rest of the axon that we had anticipated based on the range of growth cone effects on mitochondrial motility (Morris and Hollenbeck, 1993). This relative homogeneity in Fm/Fc may derive from the uniform nutritional and growth factor environment experienced by neurons in culture, and thus it is possible that axons in situ show greater regional differences. Nonetheless, we found that mitochondria with a significantly higher Fm/Fc exist in small numbers in the axon and are specifically concentrated in the growth cones. This is likely to reflect the high ATP demand in the growth cone, caused in part by actin and membrane turnover (Zakharenko and Popov, 2000; Bernstein and Bamburg, 2003), as well as the high density there of receptors for signaling ligands and the transient rises of cytoplasmic Ca2+ associated with growth cone function (Gomez and Spitzer, 2000; Soeda et al., 2002; Bolsover, 2005).
Variations in Fm/Fc in a population of mitochondria might reflect not only differences in local ATP demand but also differences in mitochondrial status, with older or damaged mitochondria showing lower Fm/Fc. Studies using the aggregating mitochondrial dye JC-1 (Miller and Sheetz, 2004) have shown differences in fluorescent emission maxima that correlated with the direction of mitochondrial transport. Our results with JC-1 were essentially the same, but when we attempted to confirm this ratiometrically using a subquenching concentration of TMRM, we found no difference in Fm/Fc among mitochondria moving in different directions. This discrepancy could result from the relatively slow equilibration and irreversible aggregation of JC-1, which can prevent it from accurately indicating the current ΔΨm of individual mitochondria (Smiley et al., 1991; Chinopoulos et al., 1999; Ward et al., 2000; Nakayama et al., 2002; Feldkamp et al., 2005). Thus, the red-emitting, J aggregated state of the JC-1 in anterogradely moving mitochondria could result from the cytoplasmic concentration of JC-1 or the ΔΨm in the cell body before their entry into the axon, or to higher levels of ROS in the cell body, which can cause aggregation and red fluorescence of JC-1 in the matrix independent of ΔΨm (Chinopoulos et al., 1999). These factors would produce an artifactually high estimate of ΔΨm from red JC-1 fluorescence early in the axonal transport of the mitochondrion.
ΔΨm and guidance molecule signaling
Previous studies have indicated that growth factor signaling can produce an increase in the mean ΔΨm of the entire neuron (T. J. Huang et al., 2005), but little is known about how mitochondrial activity is regulated regionally, despite its potential importance in a large, asymmetric cell. We focally stimulated axons with NGF and sema3A, two signaling ligands known to affect growth cone activity, advance, and guidance (Gundersen and Barrett, 1980; Fan et al., 1993; Mann and Rougon, 2007). In addition, both regulate mitochondrial distribution in these axons (Chada and Hollenbeck, 2003, 2004) (Fig. 6). Here, we showed that they increase Fm/Fc by a magnitude that is large by in vivo standards, at least for neurons and probably in general. However, the spatial range of the effect was surprisingly narrow. Mitochondria immediately adjacent to the site of NGF or sema3A stimulation showed a 40–50% increase in Fm/Fc, whereas mitochondria 10–50 μm away showed a smaller effect that declined to insignificance beyond 50 μm. This was similar to the range of the effect of NGF stimulation on mitochondrial motility (Chada and Hollenbeck, 2004) but narrower than the effect of an active growth cone (Morris and Hollenbeck, 1993). This may explain why mitochondria with significantly higher ΔΨm in unperturbed neurons are found mainly within the growth cone itself.
Inhibitors of the PI3 kinase and MAP kinase pathways abolished the increase in Fm/Fc produced by both focal and global NGF stimulation, suggesting that these downstream pathways mediate the regulation of mitochondrial potential. Because simultaneous inhibition of both pathways did not have an additive effect, NGF signaling probably converges on one pathway reaching before its target(s) in the mitochondria. The repulsive cue semaphorin has an ostensibly opposed function to NGF, but gave differing responses depending on how the cell was exposed to sema3A. The decrease in ΔΨm with global sema3A application could be through the action of PTEN, a phosphatase of PIP3 that reverses the effect of PI3 kinase. Growth cone turning or neuronal survival in the presence of both NGF and semaphorin signals may be attributable to the opposing function of PTEN and PI3 kinase acting on the same targets (Atwal et al., 2003; Dontchev and Letourneau, 2003; Wanigasekara and Keast, 2006). Consistent with this, we also found that global application of sema3A did not affect Fm/Fc in the presence of saturating NGF. In contrast, local sema3A increased Fm/Fc, which is consistent with growth cone turning in vivo requiring increased ATP, but contrary to expectations if sema3A acted on Fm/Fc exclusively through PTEN. The ability of LY294002 and U0126 to affect ΔΨm near sema3A beads suggests that there may be other mechanisms acting in local sema3A signaling. The overall importance of signaling downstream from RTKs (receptor tyrosine kinases) was underscored by the effect of tyrphostin treatment on the mitochondria: Fm/Fc was diminished by 80%, a magnitude matched in these neurons only with application of two separate mitochondrial poisons. None of the kinase inhibitors caused mitochondrial fragmentation, morphological change, axonal retraction, or any signs of cell death, indicating that treatment did not cause nonspecific insult. Thus, we conclude that kinase inhibition likely has a specific effect on ΔΨm regulation, causing mitochondria to change membrane potential or in some cases to depolarize profoundly.
These data demonstrate that the membrane potential of axonal mitochondria, like their distribution, can be regulated locally, but the identities of the signaling pathways and specific targets of ΔΨm regulation by kinases remain to be elucidated. Nonetheless, our data suggest some of their features. First, the effect of the PI3 kinase and MAPK inhibitors occurred within 20 min, too fast to be explained by changes in mitochondrial protein synthesis, import, or degradation. Kinase regulation of glycolysis and the TCA cycle could affect ΔΨm (Hamilton et al., 2002; Long and Zierath, 2006), but the persistence of mitochondrial responses to NGF and sema3A in pyruvate-containing, glucose-free medium argues against this. It is more likely that the regulation of ΔΨm results from phosphorylation of target proteins that directly or indirectly alter mitochondrial activity. We suggest that the targets of regulation are likely to be mitochondrial phosphoproteins. Mitochondria contain kinases as well as candidate proteins for kinase activation or inhibition (Salvi et al., 2005; J. Lee et al., 2007; Tzatsos and Tsichlis, 2007). For example, kinase activity regulates proteins responsible for mitochondrial fusion and fission, which in turn interact with the complexes of the electron transport chain (Brooks et al., 2007; S. Lee et al., 2007; Zanna et al., 2008). There is also evidence that proteins of the electron transport chain itself may be phosphorylated, which could allow direct control of ΔΨm (Technikova-Dobrova et al., 2001). Other possibilities include protein phosphorylation of inner membrane transporters that could cause changes in matrix concentrations of ions such as potassium or interfere with the transport of other molecules such as adenine nucleotides. The potential similarities among the pathways and targets for the regulation of mitochondrial functions will be important areas of future study.
Footnotes
This work was supported by National Institutes of Health–National Institutes of Neurological Disorders and Stroke Grant NS027073.
References
- Atwal JK, Singh KK, Tessier-Lavigne M, Miller FD, Kaplan DR. Semaphorin 3F antagonizes neurotrophin-induced phosphatidylinositol 3-kinase and mitogen-activated protein kinase kinase signaling: a mechanism for growth cone collapse. J Neurosci. 2003;23:7602–7609. doi: 10.1523/JNEUROSCI.23-20-07602.2003. [DOI] [PMC free article] [PubMed] [Google Scholar]
- Bandtlow CE, Heumann R, Schwab ME, Thoenen H. Cellular localization of nerve growth factor synthesis by in situ hybridization. EMBO J. 1987;6:891–899. doi: 10.1002/j.1460-2075.1987.tb04835.x. [DOI] [PMC free article] [PubMed] [Google Scholar]
- Bernstein BW, Bamburg JR. Actin-ATP hydrolysis is a major energy drain for neurons. J Neurosci. 2003;23:1–6. doi: 10.1523/JNEUROSCI.23-01-00002.2003. [DOI] [PMC free article] [PubMed] [Google Scholar]
- Berthold CH, Fabricius C, Rydmark M, Andersén B. Axoplasmic organelles at nodes of Ranvier. I. Occurrence and distribution in large myelinated spinal root axons of the adult cat. J Neurocytol. 1993;22:925–940. doi: 10.1007/BF01218351. [DOI] [PubMed] [Google Scholar]
- Bolsover SR. Calcium signalling in growth cone migration. Cell Calcium. 2005;37:395–402. doi: 10.1016/j.ceca.2005.01.007. [DOI] [PubMed] [Google Scholar]
- Bray D, Money NP, Harold FM, Bamburg JR. Responses of growth cones to changes in osmolality of the surrounding medium. J Cell Sci. 1991;98:507–515. doi: 10.1242/jcs.98.4.507. [DOI] [PubMed] [Google Scholar]
- Bristow EA, Griffiths PG, Andrews RM, Johnson MA, Turnbull DM. The distribution of mitochondrial activity in relation to optic nerve structure. Arch Ophthalmol. 2002;120:791–796. doi: 10.1001/archopht.120.6.791. [DOI] [PubMed] [Google Scholar]
- Brooks C, Wei Q, Feng L, Dong G, Tao Y, Mei L, Xie ZJ, Dong Z. Bak regulates mitochondrial morphology and pathology during apoptosis by interacting with mitofusins. Proc Natl Acad Sci U S A. 2007;104:11649–11654. doi: 10.1073/pnas.0703976104. [DOI] [PMC free article] [PubMed] [Google Scholar]
- Brown MR, Sullivan PG, Geddes JW. Synaptic mitochondria are more susceptible to Ca2+ overload than nonsynaptic mitochondria. J Biol Chem. 2006;281:11658–11668. doi: 10.1074/jbc.M510303200. [DOI] [PubMed] [Google Scholar]
- Buckman JF, Reynolds IJ. Spontaneous changes in mitochondrial membrane potential in cultured neurons. J Neurosci. 2001;21:5054–5065. doi: 10.1523/JNEUROSCI.21-14-05054.2001. [DOI] [PMC free article] [PubMed] [Google Scholar]
- Castellani V, Rougon G. Control of semaphorin signaling. Curr Opin Neurobiol. 2002;12:532–541. doi: 10.1016/s0959-4388(02)00357-4. [DOI] [PubMed] [Google Scholar]
- Chada SR, Hollenbeck PJ. Mitochondrial movement and positioning in axons: the role of growth factor signaling. J Exp Biol. 2003;206:1985–1992. doi: 10.1242/jeb.00263. [DOI] [PubMed] [Google Scholar]
- Chada SR, Hollenbeck PJ. Nerve growth factor signaling regulates motility and docking of axonal mitochondria. Curr Biol. 2004;14:1272–1276. doi: 10.1016/j.cub.2004.07.027. [DOI] [PubMed] [Google Scholar]
- Chadborn NH, Ahmed AI, Holt MR, Prinjha R, Dunn GA, Jones GE, Eickholt BJ. PTEN couples Sema3A signalling to growth cone collapse. J Cell Sci. 2006;119:951–957. doi: 10.1242/jcs.02801. [DOI] [PubMed] [Google Scholar]
- Chance B, Williams GR. Respiratory enzymes in oxidative phosphorylation. III. The steady state. J Biol Chem. 1955;217:409–427. [PubMed] [Google Scholar]
- Chinopoulos C, Tretter L, Adam-Vizi V. Depolarization of in situ mitochondria due to hydrogen peroxide-induced oxidative stress in nerve terminals: inhibition of alpha-ketoglutarate dehydrogenase. J Neurochem. 1999;73:220–228. doi: 10.1046/j.1471-4159.1999.0730220.x. [DOI] [PubMed] [Google Scholar]
- De Vos KJ, Sable J, Miller KE, Sheetz MP. Expression of phosphatidylinositol (4,5) bisphosphate-specific pleckstrin homology domains alters direction but not the level of axonal transport of mitochondria. Mol Biol Cell. 2003;14:3636–3649. doi: 10.1091/mbc.E02-10-0638. [DOI] [PMC free article] [PubMed] [Google Scholar]
- Diaz G, Falchi AM, Gremo F, Isola R, Diana A. Homogeneous longitudinal profiles and synchronous fluctuations of mitochondrial transmembrane potential. FEBS Lett. 2000;475:218–224. doi: 10.1016/s0014-5793(00)01683-5. [DOI] [PubMed] [Google Scholar]
- Dontchev VD, Letourneau PC. Growth cones integrate signaling from multiple guidance cues. J Histochem Cytochem. 2003;51:435–444. doi: 10.1177/002215540305100405. [DOI] [PubMed] [Google Scholar]
- Duchen MR, Leyssens A, Crompton M. Transient mitochondrial depolarizations reflect focal sarcoplasmic reticular calcium release in single rat cardiomyocytes. J Cell Biol. 1998;142:975–988. doi: 10.1083/jcb.142.4.975. [DOI] [PMC free article] [PubMed] [Google Scholar]
- Ehrenberg B, Montana V, Wei MD, Wuskell JP, Loew LM. Membrane potential can be determined in individual cells from the nernstian distribution of cationic dyes. Biophys J. 1988;53:785–794. doi: 10.1016/S0006-3495(88)83158-8. [DOI] [PMC free article] [PubMed] [Google Scholar]
- Fan J, Mansfield SG, Redmond T, Gordon-Weeks PR, Raper JA. The organization of F-actin and microtubules in growth cones exposed to a brain-derived collapsing factor. J Cell Biol. 1993;121:867–878. doi: 10.1083/jcb.121.4.867. [DOI] [PMC free article] [PubMed] [Google Scholar]
- Farkas DL, Wei MD, Febbroriello P, Carson JH, Loew LM. Simultaneous imaging of cell and mitochondrial membrane potentials. Biophys J. 1989;56:1053–1069. doi: 10.1016/S0006-3495(89)82754-7. [DOI] [PMC free article] [PubMed] [Google Scholar]
- Feldkamp T, Kribben A, Weinberg JM. Assessment of mitochondrial membrane potential in proximal tubules after hypoxia-reoxygenation. Am J Physiol. 2005;288:F1092–F1102. doi: 10.1152/ajprenal.00443.2004. [DOI] [PubMed] [Google Scholar]
- Gallo G, Letourneau PC. Localized sources of neurotrophins initiate axon collateral sprouting. J Neurosci. 1998;18:5403–5414. doi: 10.1523/JNEUROSCI.18-14-05403.1998. [DOI] [PMC free article] [PubMed] [Google Scholar]
- Gallo G, Lefcort FB, Letourneau PC. The trkA receptor mediates growth cone turning toward a localized source of nerve growth factor. J Neurosci. 1997;17:5445–5454. doi: 10.1523/JNEUROSCI.17-14-05445.1997. [DOI] [PMC free article] [PubMed] [Google Scholar]
- Gomez TM, Spitzer NC. Regulation of growth cone behavior by calcium: new dynamics to earlier perspectives. J Neurobiol. 2000;44:174–183. [PubMed] [Google Scholar]
- Gundersen RW, Barrett JN. Characterization of the turning response of dorsal root neurites toward nerve growth factor. J Cell Biol. 1980;87:546–554. doi: 10.1083/jcb.87.3.546. [DOI] [PMC free article] [PubMed] [Google Scholar]
- Hamilton SR, O'Donnell JB, Jr, Hammet A, Stapleton D, Habinowski SA, Means AR, Kemp BE, Witters LA. AMP-activated protein kinase kinase: detection with recombinant AMPK alpha1 subunit. Biochem Biophys Res Commun. 2002;293:892–898. doi: 10.1016/S0006-291X(02)00312-1. [DOI] [PubMed] [Google Scholar]
- He Y, Baas PW. Growing and working with peripheral neurons. Methods Cell Biol. 2003;71:17–35. doi: 10.1016/s0091-679x(03)01002-1. [DOI] [PubMed] [Google Scholar]
- Hollenbeck PJ, Bamburg JR. Comparing the properties of neuronal culture systems: a shopping guide for the cell biologist. Methods Cell Biol. 2003;71:1–16. doi: 10.1016/s0091-679x(03)01001-x. [DOI] [PubMed] [Google Scholar]
- Hollenbeck PJ, Saxton WM. The axonal transport of mitochondria. J Cell Sci. 2005;118:5411–5419. doi: 10.1242/jcs.02745. [DOI] [PMC free article] [PubMed] [Google Scholar]
- Huang HM, Fowler C, Zhang H, Gibson GE. Mitochondrial heterogeneity within and between different cell types. Neurochem Res. 2004;29:651–658. doi: 10.1023/b:nere.0000014835.34495.9c. [DOI] [PubMed] [Google Scholar]
- Huang HM, Fowler C, Xu H, Zhang H, Gibson GE. Mitochondrial function in fibroblasts with aging in culture and/or Alzheimer's disease. Neurobiol Aging. 2005;26:839–848. doi: 10.1016/j.neurobiolaging.2004.07.012. [DOI] [PubMed] [Google Scholar]
- Huang TJ, Verkhratsky A, Fernyhough P. Insulin enhances mitochondrial inner membrane potential and increases ATP levels through phosphoinositide 3-kinase in adult sensory neurons. Mol Cell Neurosci. 2005;28:42–54. doi: 10.1016/j.mcn.2004.08.009. [DOI] [PubMed] [Google Scholar]
- Jekabsons MB, Nicholls DG. In situ respiration and bioenergetic status of mitochondria in primary cerebellar granule neuronal cultures exposed continuously to glutamate. J Biol Chem. 2004;279:32989–33000. doi: 10.1074/jbc.M401540200. [DOI] [PubMed] [Google Scholar]
- Johnson LV, Walsh ML, Chen LB. Localization of mitochondria in living cells with rhodamine 123. Proc Natl Acad Sci U S A. 1980;77:990–994. doi: 10.1073/pnas.77.2.990. [DOI] [PMC free article] [PubMed] [Google Scholar]
- Johnson LV, Walsh ML, Bockus BJ, Chen LB. Monitoring of relative mitochondrial membrane potential in living cells by fluorescence microscopy. J Cell Biol. 1981;88:526–535. doi: 10.1083/jcb.88.3.526. [DOI] [PMC free article] [PubMed] [Google Scholar]
- Kennedy TE, Wang H, Marshall W, Tessier-Lavigne M. Axon guidance by diffusible chemoattractants: a gradient of netrin protein in the developing spinal cord. J Neurosci. 2006;26:8866–8874. doi: 10.1523/JNEUROSCI.5191-05.2006. [DOI] [PMC free article] [PubMed] [Google Scholar]
- Kim SU, Hogue-Angeletti R, Gonatas NK. Localization of nerve growth factor receptors in sympathetic neurons cultured in vitro. Brain Res. 1979;168:602–608. doi: 10.1016/0006-8993(79)90313-5. [DOI] [PubMed] [Google Scholar]
- Kuznetsov AV, Usson Y, Leverve X, Margreiter R. Subcellular heterogeneity of mitochondrial function and dysfunction: evidence obtained by confocal imaging. Mol Cell Biochem. 2004;256–257:359–365. doi: 10.1023/b:mcbi.0000009881.01943.68. [DOI] [PubMed] [Google Scholar]
- Lee J, Xu Y, Chen Y, Sprung R, Kim SC, Xie S, Zhao Y. Mitochondrial phosphoproteome revealed by an improved IMAC method and MS/MS/MS. Mol Cell Proteomics. 2007;6:669–676. doi: 10.1074/mcp.M600218-MCP200. [DOI] [PMC free article] [PubMed] [Google Scholar]
- Lee S, Jeong SY, Lim WC, Kim S, Park YY, Sun X, Youle RJ, Cho H. Mitochondrial fission and fusion mediators, hFis1 and OPA1, modulate cellular senescence. J Biol Chem. 2007;282:22977–22983. doi: 10.1074/jbc.M700679200. [DOI] [PubMed] [Google Scholar]
- Leyssens A, Nowicky AV, Patterson L, Crompton M, Duchen MR. The relationship between mitochondrial state, ATP hydrolysis, [Mg2+]i and [Ca2+]i studied in isolated rat cardiomyocytes. J Physiol. 1996;496:111–128. doi: 10.1113/jphysiol.1996.sp021669. [DOI] [PMC free article] [PubMed] [Google Scholar]
- Li Z, Okamoto K, Hayashi Y, Sheng M. The importance of dendritic mitochondria in the morphogenesis and plasticity of spines and synapses. Cell. 2004;119:873–887. doi: 10.1016/j.cell.2004.11.003. [DOI] [PubMed] [Google Scholar]
- Long YC, Zierath JR. AMP-activated protein kinase signaling in metabolic regulation. J Clin Invest. 2006;116:1776–1783. doi: 10.1172/JCI29044. [DOI] [PMC free article] [PubMed] [Google Scholar]
- Malaiyandi LM, Honick AS, Rintoul GL, Wang QJ, Reynolds IJ. Zn2+ inhibits mitochondrial movement in neurons by phosphatidylinositol 3-kinase activation. J Neurosci. 2005;25:9507–9514. doi: 10.1523/JNEUROSCI.0868-05.2005. [DOI] [PMC free article] [PubMed] [Google Scholar]
- Mann F, Rougon G. Mechanisms of axon guidance: membrane dynamics and axonal transport in semaphorin signalling. J Neurochem. 2007;102:316–323. doi: 10.1111/j.1471-4159.2007.04578.x. [DOI] [PubMed] [Google Scholar]
- Mao C, Kisaalita WS. Determination of resting membrane potential of individual neuroblastoma cells (IMR-32) using a potentiometric dye (TMRM) and confocal microscopy. J Fluoresc. 2004;14:739–743. doi: 10.1023/b:jofl.0000047224.41328.f8. [DOI] [PubMed] [Google Scholar]
- Martin R, Vaida B, Bleher R, Crispino M, Giuditta A. Protein synthesizing units in presynaptic and postsynaptic domains of squid neurons. J Cell Sci. 1998;111:3157–3166. doi: 10.1242/jcs.111.21.3157. [DOI] [PubMed] [Google Scholar]
- Mattiasson G, Friberg H, Hansson M, Elmér E, Wieloch T. Flow cytometric analysis of mitochondria from CA1 and CA3 regions of rat hippocampus reveals differences in permeability transition pore activation. J Neurochem. 2003;87:532–544. doi: 10.1046/j.1471-4159.2003.02026.x. [DOI] [PubMed] [Google Scholar]
- Miller KE, Sheetz MP. Axonal mitochondrial transport and potential are correlated. J Cell Sci. 2004;117:2791–2804. doi: 10.1242/jcs.01130. [DOI] [PubMed] [Google Scholar]
- Ming G, Song H, Berninger B, Inagaki N, Tessier-Lavigne M, Poo M. Phospholipase C-gamma and phosphoinositide 3-kinase mediate cytoplasmic signaling in nerve growth cone guidance. Neuron. 1999;23:139–148. doi: 10.1016/s0896-6273(00)80760-6. [DOI] [PubMed] [Google Scholar]
- Morfini G, Szebenyi G, Elluru R, Ratner N, Brady ST. Glycogen synthase kinase 3 phosphorylates kinesin light chains and negatively regulates kinesin-based motility. EMBO J. 2002;21:281–293. doi: 10.1093/emboj/21.3.281. [DOI] [PMC free article] [PubMed] [Google Scholar]
- Morfini G, Szebenyi G, Brown H, Pant HC, Pigino G, DeBoer S, Beffert U, Brady ST. A novel CDK5-dependent pathway for regulating GSK3 activity and kinesin-driven motility in neurons. EMBO J. 2004;23:2235–2245. doi: 10.1038/sj.emboj.7600237. [DOI] [PMC free article] [PubMed] [Google Scholar]
- Morris RL, Hollenbeck PJ. The regulation of bidirectional mitochondrial transport is coordinated with axonal outgrowth. J Cell Sci. 1993;104:917–927. doi: 10.1242/jcs.104.3.917. [DOI] [PubMed] [Google Scholar]
- Morris RL, Hollenbeck PJ. Axonal transport of mitochondria along microtubules and F-actin in living vertebrate neurons. J Cell Biol. 1995;131:1315–1326. doi: 10.1083/jcb.131.5.1315. [DOI] [PMC free article] [PubMed] [Google Scholar]
- Mueller BK. Growth cone guidance: first steps towards a deeper understanding. Annu Rev Neurosci. 1999;22:351–388. doi: 10.1146/annurev.neuro.22.1.351. [DOI] [PubMed] [Google Scholar]
- Mutsaers SE, Carroll WM. Focal accumulation of intra-axonal mitochondria in demyelination of the cat optic nerve. Acta Neuropathol. 1998;96:139–143. doi: 10.1007/s004010050873. [DOI] [PubMed] [Google Scholar]
- Naga KK, Sullivan PG, Geddes JW. High cyclophilin D content of synaptic mitochondria results in increased vulnerability to permeability transition. J Neurosci. 2007;27:7469–7475. doi: 10.1523/JNEUROSCI.0646-07.2007. [DOI] [PMC free article] [PubMed] [Google Scholar]
- Nakayama S, Sakuyama T, Mitaku S, Ohta Y. Fluorescence imaging of metabolic responses in single mitochondria. Biochem Biophys Res Commun. 2002;290:23–28. doi: 10.1006/bbrc.2001.6185. [DOI] [PubMed] [Google Scholar]
- Nicholls DG, Budd SL. Mitochondria and neuronal survival. Physiol Rev. 2000;80:315–360. doi: 10.1152/physrev.2000.80.1.315. [DOI] [PubMed] [Google Scholar]
- Ohmichi M, Pang L, Ribon V, Gazit A, Levitzki A, Saltiel AR. The tyrosine kinase inhibitor tyrphostin blocks the cellular actions of nerve growth factor. Biochemistry. 1993;32:4650–4658. doi: 10.1021/bi00068a024. [DOI] [PubMed] [Google Scholar]
- O'Reilly CM, Fogarty KE, Drummond RM, Tuft RA, Walsh JV., Jr Quantitative analysis of spontaneous mitochondrial depolarizations. Biophys J. 2003;85:3350–3357. doi: 10.1016/S0006-3495(03)74754-7. [DOI] [PMC free article] [PubMed] [Google Scholar]
- Overly CC, Rieff HI, Hollenbeck PJ. Organelle motility and metabolism in axons vs dendrites of cultured hippocampal neurons. J Cell Sci. 1996;109:971–980. doi: 10.1242/jcs.109.5.971. [DOI] [PubMed] [Google Scholar]
- Palay SL. Synapses in the central nervous system. J Biophys Biochem Cytol. 1956;2:193–202. doi: 10.1083/jcb.2.4.193. [DOI] [PMC free article] [PubMed] [Google Scholar]
- Parihar MS, Brewer GJ. Mitoenergetic failure in Alzheimer disease. Am J Physiol. 2007;292:C8–C23. doi: 10.1152/ajpcell.00232.2006. [DOI] [PubMed] [Google Scholar]
- Ratner N, Bloom GS, Brady ST. A role for cyclin-dependent kinase(s) in the modulation of fast anterograde axonal transport: effects defined by olomoucine and the APC tumor suppressor protein. J Neurosci. 1998;18:7717–7726. doi: 10.1523/JNEUROSCI.18-19-07717.1998. [DOI] [PMC free article] [PubMed] [Google Scholar]
- Rende M, Brizi E, Conner J, Treves S, Censier K, Provenzano C, Taglialatela G, Sanna PP, Donato R. Nerve growth factor (NGF) influences differentiation and proliferation of myogenic cells in vitro via TrKA. Int J Dev Neurosci. 2000;18:869–885. doi: 10.1016/s0736-5748(00)00041-1. [DOI] [PubMed] [Google Scholar]
- Ruthel G, Hollenbeck PJ. Response of mitochondrial traffic to axon determination and differential branch growth. J Neurosci. 2003;23:8618–8624. doi: 10.1523/JNEUROSCI.23-24-08618.2003. [DOI] [PMC free article] [PubMed] [Google Scholar]
- Salvi M, Brunati AM, Toninello A. Tyrosine phosphorylation in mitochondria: a new frontier in mitochondrial signaling. Free Radic Biol Med. 2005;38:1267–1277. doi: 10.1016/j.freeradbiomed.2005.02.006. [DOI] [PubMed] [Google Scholar]
- Scaduto RC, Jr, Grotyohann LW. Measurement of mitochondrial membrane potential using fluorescent rhodamine derivatives. Biophys J. 1999;76:469–477. doi: 10.1016/S0006-3495(99)77214-0. [DOI] [PMC free article] [PubMed] [Google Scholar]
- Scheffler IE. Mitochondria. Ed 1. New York: Wiley; 1999. [Google Scholar]
- Smiley ST, Reers M, Mottola-Hartshorn C, Lin M, Chen A, Smith TW, Steele GD, Jr, Chen LB. Intracellular heterogeneity in mitochondrial membrane potentials revealed by a J-aggregate-forming lipophilic cation JC-1. Proc Natl Acad Sci U S A. 1991;88:3671–3675. doi: 10.1073/pnas.88.9.3671. [DOI] [PMC free article] [PubMed] [Google Scholar]
- Soeda H, Tatsumi H, Kozawa Y, Mishima H, Imai K, Katayama Y. Functional characterization of calcium channels localized on the growth cones of cultured rat dorsal root ganglion cells. Neurosci Lett. 2002;325:5–8. doi: 10.1016/s0304-3940(02)00215-x. [DOI] [PubMed] [Google Scholar]
- Takeda Y, Pérez-Pinzón MA, Ginsberg MD, Sick TJ. Mitochondria consume energy and compromise cellular membrane potential by reversing ATP synthetase activity during focal ischemia in rats. J Cereb Blood Flow Metab. 2004;24:986–992. doi: 10.1097/01.WCB.0000127966.84050.61. [DOI] [PubMed] [Google Scholar]
- Technikova-Dobrova Z, Sardanelli AM, Speranza F, Scacco S, Signorile A, Lorusso V, Papa S. Cyclic adenosine monophosphate-dependent phosphorylation of mammalian mitochondrial proteins: enzyme and substrate characterization and functional role. Biochemistry. 2001;40:13941–13947. doi: 10.1021/bi011066p. [DOI] [PubMed] [Google Scholar]
- Tzatsos A, Tsichlis PN. Energy depletion inhibits phosphatidylinositol 3-kinase/Akt signaling and induces apoptosis via AMP-activated protein kinase-dependent phosphorylation of IRS-1 at Ser-794. J Biol Chem. 2007;282:18069–18082. doi: 10.1074/jbc.M610101200. [DOI] [PubMed] [Google Scholar]
- Vergun O, Votyakova TV, Reynolds IJ. Spontaneous changes in mitochondrial membrane potential in single isolated brain mitochondria. Biophys J. 2003;85:3358–3366. doi: 10.1016/S0006-3495(03)74755-9. [DOI] [PMC free article] [PubMed] [Google Scholar]
- Verstreken P, Ly CV, Venken KJ, Koh TW, Zhou Y, Bellen HJ. Synaptic mitochondria are critical for mobilization of reserve pool vesicles at Drosophila neuromuscular junctions. Neuron. 2005;47:365–378. doi: 10.1016/j.neuron.2005.06.018. [DOI] [PubMed] [Google Scholar]
- Wanigasekara Y, Keast JR. Nerve growth factor, glial cell line-derived neurotrophic factor and neurturin prevent semaphorin 3A-mediated growth cone collapse in adult sensory neurons. Neuroscience. 2006;142:369–379. doi: 10.1016/j.neuroscience.2006.06.031. [DOI] [PubMed] [Google Scholar]
- Ward MW, Rego AC, Frenguelli BG, Nicholls DG. Mitochondrial membrane potential and glutamate excitotoxicity in cultured cerebellar granule cells. J Neurosci. 2000;20:7208–7219. doi: 10.1523/JNEUROSCI.20-19-07208.2000. [DOI] [PMC free article] [PubMed] [Google Scholar]
- Zakharenko S, Popov S. Plasma membrane recycling and flow in growing neurites. Neuroscience. 2000;97:185–194. doi: 10.1016/s0306-4522(00)00022-1. [DOI] [PubMed] [Google Scholar]
- Zanna C, Ghelli A, Porcelli AM, Karbowski M, Youle RJ, Schimpf S, Wissinger B, Pinti M, Cossarizza A, Vidoni S, Valentino ML, Rugolo M, Carelli V. OPA1 mutations associated with dominant optic atrophy impair oxidative phosphorylation and mitochondrial fusion. Brain. 2008;131:352–367. doi: 10.1093/brain/awm335. [DOI] [PubMed] [Google Scholar]