

Abstract
The chemical speciation of Mn2+ within cells is critical for its transport, availability and redox properties. Herein we investigate the redox behavior and complexation equilibria of Mn2+ in aqueous solutions of bicarbonate by voltametry and electron paramagnetic resonance (EPR) spectroscopy, and discuss the implications for the uptake of Mn2+ by mangano-cluster enzymes like photosystem II (PSII). Both the electrochemical reduction of Mn2+ to Mn0 at an Hg electrode and EPR (in the absence of a polarizing electrode), revealed formation of 1:1 and 1:2 Mn-(bi)carbonate complexes as a function of Mn2+ and bicarbonate concentrations. Pulsed EPR spectroscopy, including ENDOR, ESEEM and 2D-HYSCORE, were used to probe the hyperfine couplings to 1H and 13C nuclei of the ligand(s) bound to Mn2+. For the 1:2 complex the complete 13C hyperfine tensor for one of the (bi)carbonate ligands was determined and it was established that this ligand coordinates to Mn2+ in bidentate mode with 13C-Mn distance of 2.85 ± 0.1 Å. The second (bi)carbonate ligand in the 1:2 complex coordinates possibly in monodentate mode, which is structurally less defined, and its 13C signal is broad and unobservable. 1H ENDOR reveals that 1-2 water ligands are lost upon binding of one bicarbonate ion in the 1:1 complex while 3-4 water ligands are lost upon forming the 1:2 complex. Thus, we deduce that the dominant species above 0.1 M bicarbonate concentration is the 1:2 complex, [Mn(CO3)(HCO3)(OH2)3]-.
Keywords: bicarbonate, voltammetry, EPR spectroscopy, manganese, photosystem II
I. Introduction
The bio-availability of essential trace metal ions (Fe2+, Mn2+, Cu2+, Zn2+, Cd2+ and Ni2+) in ecosystems is governed by their complexation equilibria with naturally occurring ligands that exist in open oceans and at soil-water interfaces1. Inorganic ligands like carbonate/bicarbonate ions, derived from CO2 and soluble carbonate minerals, play a dominant role in metal ion speciation in marine ecosystems. This speciation leads to significant changes in the redox potentials of metal ions and thus, influences the bio-geochemical cycles of elements on a macroscopic scale. The carbonate system (CO2/HCO3-/CO32-) is particularly versatile in this regard for several reasons. First, it readily chelates metal ions and also forms μ-carbonato-bridges leading to oligomeric clusters Mx(CO3)y in solution that are in equilibrium with insoluble mineral forms for example siderite (FeCO3), rhodochrosite (MnCO3) etc2. Secondly, the amphoteric properties of bicarbonate (pKa = 6.3, 10.5) straddle the pH of the oceans which enables bicarbonate to drive the metal ion speciation by serving as either an acid or a base. The metal-ligand speciation go together with the changes in redox potential which is exploited by organisms for the selective uptake, intracellular delivery and redox poising of metal ions within functional sites in macromolecules3.
An example of such a macromolecule that uses bicarbonate for metal cluster assembly is photosystem II (PSII), a multi-subunit membrane-spanning protein complex required for oxygenic photosynthesis4,5. A domain within the PSII, known as the Water Oxidizing Complex (WOC), harbors an inorganic Mn-based catalyst that oxidizes water to dioxygen. Early biochemical studies (reviewed in 6) had indicated that bicarbonate is involved in functioning and/or assembly of the WOC inorganic core. In last decade, several types of studies have indicated a specific role for bicarbonate in functioning of the WOC. The rate of electron transfer from Mn2+ ion to apo-PSII is accelerated in presence of bicarbonate7. Bicarbonate increases the affinity of the Mn2+ to apo-PSII by forming a ternary complex, and thus accelerates the rate of light driven assembly of the inorganic core during its biogenesis or repair, a process known as photoactivation8. A recent crystal structure of PSII-WOC from T. elongutus at 3.5 Å resolution has proposed the atomic structure to consist of an Mn4CaO4 core, having four oxo/hydroxo/aquo ligands bridging the metals to form a cubical Mn3CaO4 subcore that is bridged to the fourth external Mn atom at one of the corner oxos4, although this model remains debated9,10. The XRD data provides evidence for the presence of a planar ligand in the active site, suggested to be HCO3-/CO32- or NO3- that is positioned between Ca and the external Mn atom. Site directed mutagenesis of the protein residue that defines the binding site has provided some support for a possible functional bicarbonate at this location.4,11 Geochemical evidence has led to the proposal that Mn-bicarbonate clusters may have played the seminal role in the evolution of the first oxygenic phototroph from an ancestral anoxygenic bacterial precursor12,13. This hypothesis has been supported by evidence from site-directed mutants of non-oxygenic purple bacterial reaction center which are engineered to photo-oxidize Mn2+ when bicarbonate is added to the media14,15.
The stoichiometry and stability constants for the formation of Mn2+-bicarbonate complexes have been studied previously by pH potentiometric titrations as a function of bicarbonate concentration. In these measurements the molecularity of the complexes were assumed based on simple chemical principles of charge balance. Mn-bicarbonate complexes have also been the subject of scrutiny by biologists owing to their efficiency in catalyzing the dismutation of hydrogen peroxide, also known as its ‘pseudo-catalase’ activity16,17. The observed pseudo-catalase rates have been used as an indirect probe for the molecularity of these complexes. On this basis it has been reported that these complexes can form dimers in solution with bicarbonate, although no direct structural evidence has been presented18-20. Previously we have reported direct electrochemical measurements of the oxidation potential for the conversion of Mn2+ to Mn3+ in the presence of bicarbonate21. This suggested the presence of di-manganese or oligomeric forms in solution. In none of the mentioned studies, structure sensitive spectroscopic methods were used to determine the speciation of Mn2+ in bicarbonate solution.
Herein, we characterize the equilibrium constants and chemical structures of Mn2+-bicarbonate complexes that form in aqueous solution using EPR and potentiometric titration. Cyclic voltammetry on reduction of Mn2+ at varied bicarbonate concentrations is used to determine metal:ligand stoichiometry of the Mn2+-bicarbonate complexes. EPR spectroscopy is used to confirm the ligand stoichiometry and to measure the ligand field symmetry of the Mn2+ complexes22,23. Hyperfine couplings to ligand nuclei (13C and 1H) obtained from ENDOR and ESEEM provides us the information about coordination geometry and distances to the ligands24-26.
II. Experimental Section
Solutions of Mn2+ and NaHCO3 were prepared by mixing stock solutions of 10 mM MnClO4·6H2O (Sigma) and freshly prepared 10-300 mM NaHCO3 (Sigma-Aldrich). NaH13CO3 (99% pure) powder from Cambridge Isotopes Laboratory Inc. was used to prepare samples with 13C-labeled bicarbonate. In all the preparations, the pH of the solution was 8.3 (self buffered by NaHCO3).
Mn2+-bicarbonate solutions are quasi-stable at room temperature, with a white precipitate slowly forming upon standing due to formation of insoluble MnCO3(s). At low Mn2+ concentrations (<0.25 mM) used in our voltammetry experiments, a visible precipitate developed within 2-3 hours, time sufficient to perform the experiment. Freshly mixed solutions were always used in these experiments. At high concentrations of Mn2+ (1 mM) and HCO3- (200-300 mM) as used in room temperature EPR experiments, the precipitate forms within minutes, i.e. on the time scale of the experiment. Thus, the Mn2+ EPR signal was recorded at different time points after sample mixing and, the signal at time point zero (i.e. immediately after mixing and before precipitation starts) was reconstructed by back extrapolation.
For frozen solution EPR experiments, the samples were prepared in (1:3) CH3OH/H2O solvent mixture27, with methanol added as a glass-forming agent.a Stock solutions of MnClO4.6H2O and NaHCO3 in (1:3) CH3OH/H2O were mixed and immediately frozen in liquid N2 to avoid any loss of Mn2+ due to precipitation. KHCO3 (in 1:3 CH3OH/H2O) was also tested instead of NaHCO3 to prepare samples, although due to poor glass formation upon freezing it could not be used for any quantitative measurements. Calibrated EPR tubes and identical volumes of the samples were used to allow quantitative comparison. In separate titration experiments (see Figure S3 in Supporting Information) we confirmed that addition of methanol and freezing to low temperatures do not significantly alter the Mn2+ speciation equilibrium from that observed at room temperature.
Voltammetry experiments were done with a standard potentiostat (polarographic analyzer model PA-3; LP, Praha) using a three-electrode cell as described earlier28. In Mn2+ reduction experiments, the working electrode was a hanging mercury drop with a diameter of 0.72 mm which was renewed before each measurement. A Pt plate (1×1 cm) was used as a counter electrode, while a saturated calomel electrode formed the reference electrode. The measured wave potentials were then recalculated versus the normal hydrogen electrode (NHE). Scan rate was 50 mV/sec.
CW EPR spectra were collected using a Bruker ESP300e spectrometer. Room temperature aqueous solution spectra were measured using a flat cell in a standard TM102 cavity at microwave (MW) frequency 9.69 GHz. Frozen solution experiments (77 K) were done using a liquid N2 finger dewar in a TE011 cavity at 9.14 GHz. The MW power setting was 0.2 mW, modulation amplitude 5-10 G, and modulation frequency 100 KHz.
Pulsed EPR experiments were performed using an X-band Bruker Elexsys580 spectrometer. The sample temperature was set in the range 5-10 K using a liquid helium flow cryostat CF935 from Oxford Inst. In all the Electron Spin Echo (ESE) based experiments durations of the π/2 and π pulses were set to 16 and 32 ns, respectively. Field-sweep ESE-detected EPR spectra were collected using 2-pulse echo sequence, π/2 - τ - π - τ - echo, with fixed inter-pulse delay τ = 200 ns; the integrated echo intensity was detected while sweeping the magnetic field. For 2-pulse Electron Spin Echo Envelope Modulation (ESEEM) experiments, π/2 - τ - π - τ - echo, the echo intensity was measured as a function of τ, starting from initial 100 ns and incrementing with 16 ns step. 2D HYSCORE experiment, π/2 - τ - π/2 - t1 - π - t2 - π/2 - τ - echo, was recorded at fixed τ = 176 ns and with t1 and t2 incremented independently from 200 ns by 24 ns steps. For Mims ENDOR experiments, the stimulated echo pulse sequence, π/2 - τ - π/2 - T - π/2 - τ - echo, was used with non-selective microwave pulses (16 ns) and with τ = 200 ns. A selective RF pulse (50 μs) of variable frequency was applied during a time interval T. Whenever necessary, phase cycling was done to eliminate unwanted echo signals.
Data processing and analysis was done with WINEPR software (Bruker BioSpin) and MATLAB 6.0 (MathWorks Inc.). Prior to Fourier Transformation the 1D ESEEM time-domains were normalized to unity background by fitting the relaxation decays with a smoothing spline function followed by division of the experimental time-domain by the fitted baseline decay. The 2D HYSCORE time-domain traces were baseline corrected in two dimensions with a suitable polynomial function. Appodization with a Hamming window and zero filling was performed prior to Fourier Transformation (FT). All the 1D frequency-domain ESEEM spectra shown are the phase-corrected cosine part of the FT. The 2D HYSCORE spectrum is presented in absolute mode after 2D-FT. The ENDOR spectra shown were normalized to the echo signal intensity in the absence of radio frequency.
EPR theory and simulations
Mn2+ has 5 unpaired electrons (3d5) and its electronic ground state in octahedral ligand field has the high spin configuration (6S) with electron spin S=5/2. The spin-Hamiltonian for Mn2+ is represented in the form
| (1) |
Here the first term describes the electron Zeeman interaction; g is electron g-factor, β the Bohr magneton, B0 the magnetic field applied along Z-axis in the laboratory coordinate system. The g-factor is assumed to be isotropic which is a good approximation for Mn2+ in octahedral ligand field at X-band frequency. The second term is a zero-field splitting (ZFS) interaction described by a traceless tensor . It results from spin-orbit interaction of the 6S ground state with excited electronic states, and its magnitude and symmetry depends on both the strength and symmetry of the ligand field around Mn2+. The tensor D is usually described by two parameters D and E representing the axial and rhombic ZFS components, respectively. The third term is the magnetic hyperfine interaction with the 55Mn nuclear spin (I=5/2); since Mn2+ has half-filled 3d5 configuration, the hyperfine coupling AMn is isotropic to a good approximation. The last term represents the hyperfine interaction and the nuclear Zeeman interaction (gn is nuclear g-factor, βn the nuclear magneton) summed over all magnetic nuclei (i) in the coordination sphere of Mn2+. In our case, the possible ligands to Mn2+ are HCO3-, CO32- and H2O.
All EPR experiments described in this work were analyzed using the spin-Hamiltonian (1), however not all its terms are equally important in describing each experiment. Since the electron Zeeman interaction ≫ ( and AMn) ≫ ( and nuclear Zeeman interactions), a perturbation approach can be conveniently applied. The field-sweep EPR spectra can be fully described by the first three terms of the spin-Hamiltonian, and accordingly only the electron g-tensor, ZFS coupling and 55Mn hyperfine parameters are obtainable from these spectra. The weak hyperfine couplings with ligand nuclei are usually unresolved in the EPR spectra and contribute only to the EPR linewidth.
ESEEM and ENDOR experiments were performed to resolve weak hyperfine couplings from ligand nuclei. Recent work by Astashkin et al. has considered the case of high spin systems interacting with a nuclear spin I=1/229. It has been demonstrated that the position and intensity of the nuclear transitions in ESEEM/ENDOR spectra depend mostly on the ZFS interaction and the ligand hyperfine coupling. The position of the sum combination line (νσ) in ESEEM spectra has been found to be most sensitive and described by the product of two parameters: the ZFS coupling D and the anisotropic part of hyperfine coupling tensor T. Thus, D and T can in principle be derived from the observed shift in νσ, and the isotropic part of the hyperfine tensor can then be estimated from the position of other lines in the spectra29. We found in practice that situation is more complex, and we were only able to extract these parameters after analyzing the correlation peaks in the 2D HYSCORE spectra. In this analysis and spectral simulations we used the analytical expressions published by Astashkin et al. for nuclear transition frequencies in high-spin electron system. All spectral simulation programs for ESEEM, ENDOR and HYSCORE were written using MATLAB® (the programs are available on request). ESEEM and HYSCORE were first simulated in the time domain and then after introducing appropriate dead times (to simulate experimental conditions) were Fourier transformed to form frequency domain spectra. Since in our pulsed EPR experiments, the excitation bandwidth of the pulses (10G) was comparable to the linewidth of the ±1/2 transition, in simulations we assume that complexes in all orientations with respect to the magnetic field contribute equally to the calculated spectrum.
III. Results
(A) Electrochemistry
The voltage-current curves corresponding to the electrochemical reduction of to Mn0 in the voltammetry experiments are shown in Figure 1A. In each curve, the current reaches a maximum at a potential designated by Ep, the peak potential. For one- or two-electron reversible processes, the difference between the peak potential (Ep) and the mid-point potential (E1/2) is equal to 28 mV and 14 mV, respectively30. In the discussion below, we use Ep (instead of E1/2) for data plotting and analysis.
Figure 1.

(A) Voltage-current curves of Mn2+ (0.25 mM MnSO4) reduction in aqueous solutions of 0.1 M LiClO4 at different concentrations of added NaHCO3: 0 mM (curve 0); 2.91mM (curve 1); 5.81mM (curve 2); 8.72 mM (curve 3); 17.4 mM (curve 4); 26.2 mM (curve 5); 37.8 mM (curve 6); 49.4 mM (curve 7); 78.5 mM (curve 8); 113 mM (curve 9); 157 mM (curve 10); 209 mM (curve 11); 296 mM (curve 12); 381mM (curve 13). The curves are shifted on the x-axis for clarity. The peak potentials are indicated at the top of each curve. (B) Peak potentials (Ep) from (A) are plotted as a logarithmic function of bicarbonate concentration (see Fig 1A for experimental conditions). The data fits are shown using the Lingane (solid line) and DeFord-Hume (dashed line) equations, in the later case the speciation model of Eqn. (7) was assumed. Also shown are the major species at each concentration range. The arrow shows the bicarbonate concentration at which the pulsed EPR measurements were carried out.
In the absence of added bicarbonate (curve 0 in Figure 1A) the peak potential Ep is observed at - 1.200 V, which corresponds to a mid-point potential E1/2 = -1.186 V for the two-electron reduction of Mn2+ (Mn2+/Mn0 couple), in agreement with the literature values31. It is important to note that Ep does not depend on the concentration of Mn2+ (data not shown), although the height of the observed reduction wave is directly proportional to [Mn2+] concentration (for [Mn2+] = 55 μM to 1 mM). The difference between the potentials the peak potential (Ep) and the mid-point potential (E1/2) is equal to 30 mV. These facts indicate a diffusion controlled and reversible transfer of two electrons. The cyclic voltage-current curves (0-13) do not show an anodic peak upon reversing the voltage sweep, indicating irreversibility of the process. This irreversible behavior is typically observed for aqueous cations of metals that are weakly soluble or insoluble in mercury (Fe, Co, Ni, Mo, W, Mn)32. At present, it is generally accepted that cathodic reduction of Mn2+ ions on mercury electrode is quasireversible and the absence of anodic peaks upon reversing the voltage sweep (Figure 1A, curve 0) results from dissolution of reduced Mn0 within the mercury drop and the additional energy spent in forming of a manganese/mercury amalgam33,34. Thus, Mn2+ reduction at the Hg electrode can be expressed by the following two-step process:
| (2) |
| (3) |
where the first reaction (2) describes reversible reduction of the ion at the electrode surface, and the second reaction (3) is irreversible dissolution of the metal to form an amalgam. The standard rate constant of an electrode process (kS) for reduction of Mn2+ on a Hg electrode in 1 M NaClO4 or NaCl, is equal to 5·10-4 cm·s-1, and the transfer coefficient α is equal to 0.66 at 30 °C. These values characterize the process of Mn2+ reduction as quasi-reversible according to Bond30. Therefore, in spite of the formal irreversibility of the reduction and re-oxidation voltamograms, we can consider the reduction process as quasi-reversible and thus use standard equations to determine the stability constants and the stoichiometry of complexation.
In the presence of coordinating anions like bicarbonate, Mn2+ may form a coordination complex with bicarbonate by displacing coordinated water molecule(s):
| (4) |
Here q defines the number of bicarbonate ions in the coordination shell of Mn2+, and K is the stability constant of the complex (water ligands are not shown). Since bicarbonate is a negatively charged ligand, the formed complex [Mn(HCO3)q](2-q) is expected to have a more negative reduction potential compared to . Accordingly, we find that the peak potential in the Mn2+-bicarbonate solutions shifts to more negative potentials at increasing bicarbonate concentrations (curves 4-13 in Figure 1A). Also, the peak current Ip decreases and the peak broadens due to complexation as more bicarbonate is titrated in solution. It is expected that complex formation affects only the reversible reduction step of eq. (2), while not affecting the irreversible dissolution of Mn0 shown in eq. (3). In a simple case when Mn2+ speciation in bicarbonate solution is dominated by only one complex, eg. [Mn(HCO3)q](2-q), the dependence of Mn2+ reduction potential (Ep) on bicarbonate concentration can be described by the Lingane equation32
| (5) |
where potentials E are in volts, and n = 2 for two-electron reduction of Mn2+ to Mn0. In this case, plotting the peak potential Ep versus log of bicarbonate concentration will result in a linear plot with a slope defining q and an intercept defining K. designates the peak potential corresponding to the Mn2+ aqua ion.
The dependence of Ep on bicarbonate concentration is shown in Figure 1B where three distinct regions of bicarbonate concentrations can be distinguished by their different slopes. Assuming that the Lingane approximation is applicable (ie. the slope of each linear region corresponds to one dominant [Mn(HCO3)q](2-q) species), the following three species can be deduced. At low bicarbonate concentrations (0-10 mM), the Mn2+ peak potential is insensitive to added bicarbonate (q=0) which reveals that free ion is the dominant species in solution. At the highest bicarbonate concentrations (50 to 200 mM), a linear phase of the potential yields a slope of 60 mV/log [HCO3-], corresponding to q ≅ 2 at n = 2. Thus, [Mn(HCO3)2] is the most abundant species at these high concentrations. Extrapolation of the fitted line to log [HCO3-] = 0 allows evaluation of the standard reduction potential E0 = -1.275 V and the stability constant K2 = 349 M-2 (at 22°C) for this species.
At intermediate bicarbonate concentrations (10-60 mM) a slope of 14 mV/log[HCO3-] is observed which formally corresponds to q = 0.5 and thus indicates a complex consisting of two Mn2+ per one HCO3-, i.e. [Mn2(HCO3)]3+. This stoichiometry is unreasonable in the context of the Lingane equation, as it deals only with complexes where q is integer and ≥ 1 35. To verify whether dimeric Mn2 clusters occur in solution, as suggested by the slope q = 0.5, we examined the dependence of Ep on Mn2+ concentration between 55 μM to 1 mM. The results show that Ep does not depend on the Mn2+ concentration. Also, the reduction current Ip depends linearly on [Mn2+] which clearly shows that the stoichiometry of 2:1 is not feasible (Figure S1 in Supporting Information). Additional support for the absence of dimeric Mn2+ clusters in solution speciation is provided below by analyzing the EPR data. We conclude that the slope with q = 0.5 is an artifact of the use of the Lingane equation and its underlying assumptions of non-overlapping speciation35.
The titration data were therefore re-examined using the DeFord-Hume method eqn. (6) which explicitly accounts for two or more species present in solution at equal or substantial fractions35. The DeFord-Hume equation:
| (6) |
where Ki denotes the stability constant for each complex involved in speciation, was used to fit the data (shown with a dashed curve in Figure 1B). The fit is equally good as the Lingane equation although the new model shown in eqn. (7) does not involve any dimeric Mn2 complexes and only involves monomeric Mn2+ species in solution. The stability constants derived from the fit are shown in Table 1, together with other data available from the literature and obtained through other techniques36.
| (7) |
Table 1.
Mn2+ stability constants (K) with HCO3-/CO32- from the electrochemistry and EPR data at room temperature
| Mn:HCO3- | Literature Data19,34 K (μ)* | This Work K (μ)* |
|---|---|---|
| 1:1 | 63.1 M-1 (0) 18.6 M-1 (0.3) 2.82 M-1 (3) |
22 ± 5 M-1 (0.1) 18 ± 2 M-1 (0.3) |
| 1:2 | n.a | 550 ± 200 M-2 (0.1) 568 ± 50 M-2 (0.3) |
‘μ’: ionic strength of solution (in M).
The stability constant K2 of the 1:2 complex Mn(HCO3)2 can be viewed as a product K2 = K1·K21 which involves two reversible steps, i.e. binding of the first (K1) and the second (K21) bicarbonate ligands. The binding constant of the second bicarbonate ligand can then be estimated as K21 = K2/K1 = 568/18.5 = 30.7 M-1. The fact that K21 and K1 are comparable makes it evident that at intermediate bicarbonate concentrations (10-60 mM in Figure 1B) two complexes with stoichiometries 1:1 and 1:2 are present at comparable fractions in solution. The Lingane equation (5) is clearly not applicable in this situation and the misleading slope q = 0.5 results from the transient region where more than two distinct Mn2+ species are present in the equilibrium. This analysis serves as a caveat for using the Lingane equation when interpreting changes of redox potentials in metal-ligand solution equilibria.
(B) EPR Spectroscopy
1. Room Temperature EPR Measurements
In liquid solutions, Mn2+ is subject to fast rotational and tumbling motion which causes all anisotropic interactions in the spin-Hamiltonian eqn. (1) to average out, resulting in an EPR spectrum (shown as inset in Figure 2A) which can be described by only using isotropic interactions. The spectrum consists of six lines centered at g = 2.0 which are split by isotropic hyperfine coupling with the 55Mn nucleus (I=5/2). Each of the six hyperfine lines consists of five overlapping, electron spin transitions within the S=5/2 electron spin multiplet of Mn2+. These five transitions occur between adjacent MS sublevels (MS = ±5/2, ±3/2, ±1/2, where Ms is the electron spin projection) and are weighted by the respective transition probabilities, S(S+1)-MS(MS+1), to contribute non-equally to the EPR signal intensity37. In addition, incomplete motional averaging of the anisotropic interactions (like ZFS and anisotropic hyperfine interactions) can result in MS-dependent broadening of the transitions, and thus those transitions which involve higher MS states are usually broader than transition between the inner states MS = +1/2 and -1/2.38 This nonequivalent broadening results in additional weighting of the transitions, so that broader transitions (higher MS) contribute smaller peak intensity into the EPR signal.
Figure 2.

(A) Dependence of the Mn2+ EPR signal intensity on bicarbonate concentration in aqueous solution at room temperature (Mn2+ concentration 0.5 mM, pH 8.3). Fit to an equilibrium model described in Eqn. 8 is shown with solid line. Inset shows typical Mn2+ EPR signal in aqueous solution centered at g 2.0. (B) Dependence of the Mn2+ EPR signal intensity (normalized to total amount of Mn2+ in the sample) as a function of Mn2+ concentration at fixed 50 mM NaHCO3 in aqueous solution at room temperature. The straight line shows the invariance on Mn2+ concentration, clearly eliminating the presence of any Mn2+ clusters in speciation.
The Mn2+ aqua ion has small but finite ZFS (∼280-300 MHz) arising from small distortions to the octahedral symmetry of the six water ligands22.Complex formation with bicarbonate further reduces the symmetry of the ligand field around Mn2+ ion and thereby causes the ZFS to increase. Larger ZFS in the complex results in broader electron spin transitions and thus weaker intensity of the six-line EPR signal compared to more symmetric ion. The transitions that involve higher spin states MS = ±3/2 and ±5/2 are mostly affected and can be broadened to contribute little or no intensity in the six-line EPR signal. However, the inner spin transition between MS = +1/2 and -1/2 (which contributes approximately 25% of the total signal intensity) is least affected and broadened only to the second order by ZFS. Thus, the lower symmetry Mn2+-bicarbonate complexes might be expected to show fewer than 25% of the EPR intensity of more symmetric ion based on transition probabilities.
Upon addition of anions like bicarbonate, three Mn2+ complexes of different ligand field symmetry co-exist in solution as represented by eqn. (7). If these complexes are assumed to be in slow exchange equilibrium (10-7-10-8 s)39, then the EPR spectrum at any concentration of bicarbonate can be represented as a weighted sum of the individual Mn2+ signals from each involved complex. At small bicarbonate concentrations the ion prevails in solution and therefore the EPR intensity is expected high. By increasing the bicarbonate concentration, the low-symmetry Mn2+-bicarbonate complexes become abundant in solution and thus the EPR signal reduces in intensity.
Figure 2A describes the experimentally observed changes in intensity of the six-line Mn2+ EPR spectrum (normalized to the intensity of signal) as a function of bicarbonate concentration. Since linewidth of the hyperfine lines in the spectrum remains invariant with ligand concentration, the peak-to-peak intensity was used to plot the spectral intensity. The normalized intensity decreases at higher bicarbonate concentrations, indicating the equilibrium shifts from the free towards the lower symmetry bicarbonate complex(es). The drop of intensity approaches saturation at about 30-40% of the initial Mn2+ intensity: This residual intensity corresponds to the lower symmetry complex(es) whose intensity comes primarily from the ±1/2 transition, as discussed earlier. The experimental points were fitted using a model shown in eqn. (8):
| (8) |
where ni(c) and Ii are the concentration dependent statistical weights and individual spectral intensities, respectively, of the Mn2+ complexes with i bicarbonate ligands; ni(c) was calculated using the equilibrium model eqn. (7) and assuming the equilibrium constants Ki to be close to those derived from the electrochemical titration data (Figure 1B). The good fits (the dashed line in Figure 2A) were obtained at K1 = 22 ± 5 M-1 and K2 = 550 ± 200 M-2 and the intrinsic intensity coefficients I1 = 0.3 ± 0.1 and I2 = 0.45 ± 0.15 for complexes with one and two bicarbonate ligands, respectively (the spectral intensity I0 of the ion was assumed to be unity). The derived values for I1 and I2 are consistent with expected lower symmetry of the ligand field in the Mn2+- bicarbonate complexes (and thus larger ZFS and lower EPR intensity) as compared to . The fact that I1 < I2 indicates that symmetry of the ligand field is higher in case of two bicarbonate ligands bound to Mn2+.
In order to test for the presence of cluster-like species in solution (i.e. Mn2+-dimer as might be inferred from the slope q = 0.5 in the electrochemistry titration data), the EPR intensity was examined at a fixed bicarbonate concentration (50 mM) and over the range 0.2-1 mM of Mn2+ concentrations, as shown in Figure 2B. The observed zero-order dependence of the fractional Mn2+ intensity (i.e. weighted by the total amount of Mn2+ in solution) as seen in Figure 2B rules out the possibility of oligomeric forms of Mn2+ in solution speciation.
2. Frozen Solution EPR Measurements
Concentration dependence of EPR intensity
The perpendicular-mode EPR spectra on Mn2+ in 25% CH3OH/water frozen glass at 8-77 K shows a characteristic six-line signal centered around g = 2 and a low intensity feature at g = 4 (Figure S2A in Supporting Information). The signal at g = 2 arises from monomeric Mn2+ complexes. Its peak-to-trough intensity when plotted as a function of bicarbonate concentration (Figure S3 in Supporting Information) can be used to evaluate the stability constants of [Mn(HCO3)+] and [Mn(HCO3)2] complexes formed in solution, in a fashion similar to described above for the room temperature EPR data. The stability constants derived from the fit in frozen solutions are similar to those extracted from the room temperature experiments. This agreement indicates that there are no appreciable changes in Mn2+-bicarbonate speciation equilibrium upon addition of 25% methanol and/or upon freezing to low temperatures.
Also extracted from the fit are individual spectral intensities (Ii) of the contributing complexes. The values I1 = 0.15 ± 0.05 and I2 = 0.38 ± 0.1 in frozen solution are lower as compared to room temperature results. This difference is not unexpected because there is no motional averaging at frozen solution and thus the transitions with higher MS are broadened more significantly by ZFS and therefore contribute smaller intensity than at room temperature.
The weak g = 4 signal observable in the EPR spectra at low temperatures is assignable to either a double-quantum transition of monomeric Mn2+ or to a transition within the excited state S=1 of an anti-ferromagnetically coupled di-manganese complex Mn2+-L-Mn2+ 40. To resolve this uncertainty, the intensity of the g = 4 signal was examined while varying the Mn2+ concentration (Figure S2B in Supporting Information). The intensity is found to scale linearly with Mn2+ concentration proving that the g = 4 feature belongs to a monomeric form(s) of Mn2+. This assignment is in line with the room temperature EPR and electrochemistry data showing that the ‘dimer’-like species (or oligomeric Mn2+) are absent in the bicarbonate solutions.
Field-sweep pulsed EPR spectra
All pulsed EPR experiments reported below were done on samples with 0.5 mM Mn2+ and with no added or 100 mM bicarbonate in solution. As can be estimated using the equilibrium constants in Table 1, at 100 mM bicarbonate the total Mn2+ in solution is represented by a mixture of 70% [Mn(HCO3)2], about 20% [Mn(HCO3)]+ and 10% .
Figure 3 shows the absorption EPR lineshapes of Mn2+ in the absence and presence of added bicarbonate, recorded using field-sweep electron spin echo (ESE)-detected EPR. In addition to the resolved six-line hyperfine pattern at the center of the spectrum (also observed in the first-derivative CW EPR spectra, Figure S2A in Supporting Information), the absorption lineshapes in Figure 3 also reveal a broad underlying signal which extends for hundreds of gauss on either side of the central g = 2 feature. A detailed interpretation of the Mn2+ absorption spectrum, in the case of Mn2+ aqua ion, has been given elsewhere.22 It was shown that the Mn2+ spin-Hamiltonian (1), involving two isotropic terms (electron Zeeman and 55Mn hyperfine interactions) and one anisotropic ZFS coupling, is sufficient to fully describe the absorption spectrum. Non-zero ZFS (estimated as D = 280-300 MHz for )22 both broadens and shifts four out of five electron spin transitions, ±1/2 ↔ ±3/2 and ±3/2 ↔ ±5/2, away from g = 2 and thus spreads them around the center to produce the broad signal. The central transition, +1/2 ↔ -1/2, is only susceptible to the second-order broadening by ZFS and forms the resolved six-line hyperfine pattern that sits on top of the broad signal. Additional broadening effects come from significant D- and A-strains (caused by heterogeneity in the ligand field) that affect the outer transitions to a larger extent than the inner transitions22.
Figure 3.

EPR absorption signal of Mn2+ (0.5 mM) detected using 2-pulse ESE field-sweep technique in frozen glass solution (H2O/CH3OH) at 10 K: (solid black) with no added bicarbonate; (dashed red) with 100 mM NaH12CO3; (dashed green) with 100 mM NaH13CO3. Vertical line indicates the magnetic field position (3490 G) at which ESEEM, ENDOR and HYSCORE measurements were carried out. Interpulse delay τ = 400 ns was used in the field-sweep experiments.
Upon addition of 100 mM bicarbonate, the absorption EPR spectrum transforms to show less intensity at the center and stronger intensity at the spectrum wings (Figure 3). This spectral transformation is expected for [Mn(HCO3)2] which has a lower ligand field symmetry and a larger ZFS as compared to . The larger ZFS forces the outer transitions, ±1/2 ↔ ±3/2 and ±3/2 ↔ ±5/2, to spread further around the spectrum center, and thus to produce even broader underlying signal and an increased intensity at the spectral wings. In addition, the increased ZFS causes a second-order broadening of the inner transition (+1/2 ↔ -1/2), resulting in lower signal intensity at the center. This spectral transformation can be qualitatively reproduced in spectral simulations using D ∼ 700 MHz. However, we have not attempted a detailed spectral simulation owing to spectral complexity associated with the presence of a background signal from 20% Mn(HCO3)+ and also to lack of exact knowledge of spin relaxation times (T2 and its orientation dependence) which are essential for accurate simulation of the ESE-detected spectra. Finally, we note that the Mn2+ spectral transformation is identical upon addition of 12C or 13C bicarbonate. This lack of resolution is expected because the ligand 13C hyperfine couplings are small and therefore unresolved in the broad EPR linewidth. ESEEM/ENDOR methods are applied to resolve this small coupling, as described below.
13C hyperfine coupling for bicarbonate ligands
Two-pulse ESEEM spectra were recorded at magnetic field 3490 G (marked by an arrow in Figure 3), the center of one of the resolved 55Mn hyperfine lines. This field corresponds mostly to the +1/2 ↔ -1/2 transition, however, the other four transitions also contribute appreciably (about 30-40 % of the spectral intensity) at this field. The cosine FT ESEEM traces recorded for Mn2+ frozen solutions in the absence and presence of 12C or 13C-bicarbonate are shown in Figure 4A. In the absence of bicarbonate, only two peaks are seen in the spectrum: a positive peak at proton Zeeman frequency 14.96 MHz (νH) and a negative peak at 29.8 MHz (∼ 2νH). These peaks, also known as the matrix lines, arise from weakly coupled 1H nuclei surrounding the Mn2+ aqua ion41. The low frequency feature at around ∼0.5 MHz is an artifact of the FT procedure.
Figure 4.
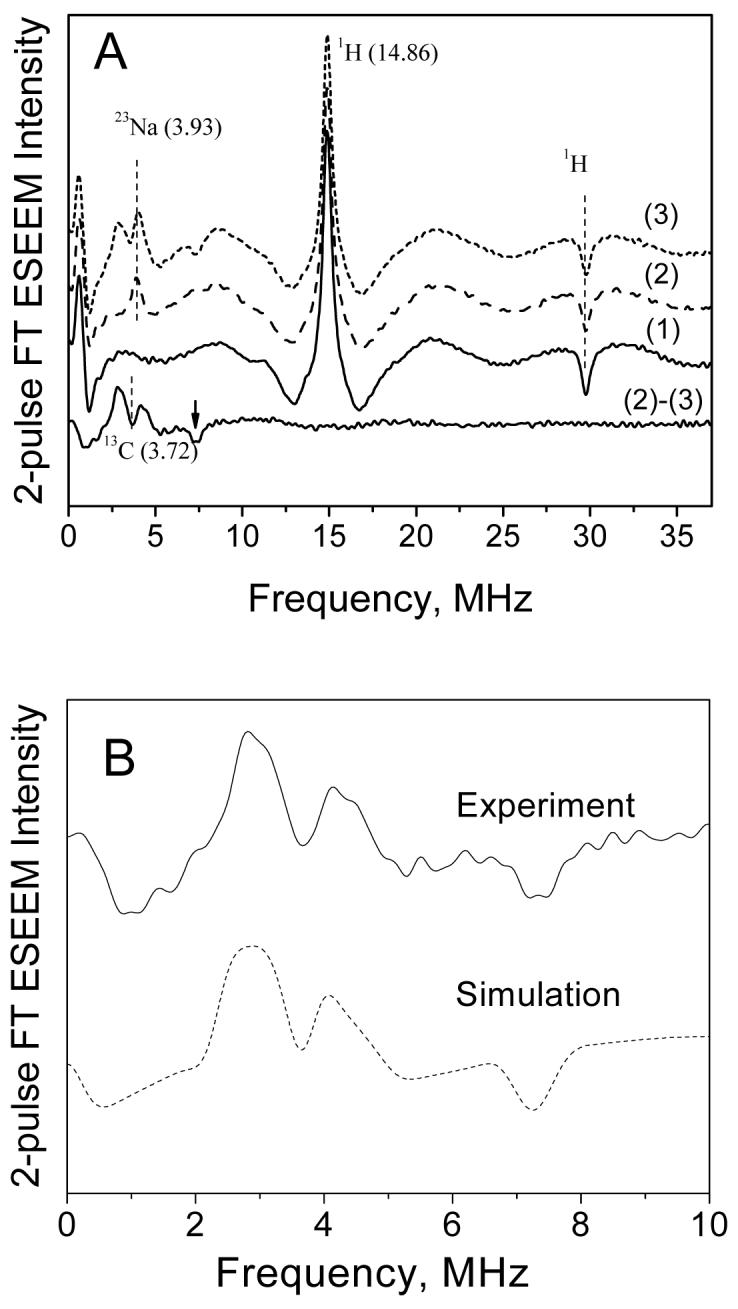
(A) Cosine FT traces of 2-pulse ESEEM of Mn2+ (0.5 mM) in frozen glass solution (H2O/CH3OH) recorded at 3490 G and 10 K. Trace (1) no added bicarbonate, trace (2) 100mM NaH12CO3, and trace (3) 100mM NaH13CO3. Trace (2)-(3) at the bottom is the difference spectrum of (2) and (3) and shows the nuclear spin transitions arising only from 13C nuclei (this difference spectrum is also shown in (B)). The vertical lines show the positions of Zeeman frequencies for 1H, 23Na and 13C nuclei at 3490 G. The arrow indicates the sum combination line of 13C. (B) Comparison of experimental (solid line) and simulated (dash-dot line) 13C ESEEM spectra. Simulation parameters are shown in Table 2.
Upon addition of12C (I = 0) bicarbonate (NaHCO3), the spectrum (trace 2 in Figure 4A) shows the new peak at 3.93 MHz which is assigned to the matrix frequency of 23Na (I=3/2). Upon addition of 13C (I = 1/2) bicarbonate (NaH13CO3), the spectrum (trace 3) shows additional lines in the spectral region of 2-5 MHz, overlapping with the 23Na line. These additional features can be clearly revealed by subtracting the normalized spectra of 13C and 12C-bicarbonate that eliminates the lines from 1H and 23Na nuclei (bottom trace in Figure 4A and also zoomed in Figure 4B). The prominent features in this difference spectrum are the two positive-amplitude peaks at 2.9 and 4.26 MHz and also their sum combination at 7.34 MHz which has negative amplitude. The two positive peaks are positioned around the Zeeman frequency of 13C (νI = 3.72 MHz at 3490 G) and correspond to 13C nuclear transition frequencies within two electron spin manifolds MS = ±1/2.b Their splitting of 1.4 MHz gives an approximate measure of isotropic part (aiso) of the 13C hyperfine coupling. The individual linewidth of each line ∼1 MHz gives a measure of anisotropic part (T) of the 13C hyperfine coupling29. The significant values of aiso and T indicate that this 13C belongs to a bicarbonate ligand in the first coordination shell of Mn2+.
The sum combination line at 7.34 MHz is downshifted from the value 2νI (= 7.44 MHz), the double Zeeman frequency of 13C at 3490 G. It has been shown that the combination line can shift from 2νI to higher or lower frequencies depending on the magnitude and relative signs of dipolar part (T) of 13C hyperfine tensor and the axial ZFS parameter (D), and also on the relative orientation of these two tensors29. The negative shift in our case indicates either the same sign of T and D at 0 deg orientation of the two tensors or their opposite sign at 90 deg orientation. Although the shift of the combination line can be useful in estimating T and D, more accurate values can be extracted from the correlation 2D HYSCORE spectra (see below).
Mims ENDOR was recorded at 3490 G, and the difference spectrum (13C-bicarbonate - 12C-bicarbonate) is shown in Figure 5 in the region around 13C Zeeman frequency (see Figure S5 in Supporting Information for the experimental raw data). The two broad lines at 3.0 and 4.2 MHz are the same as seen in the ESEEM spectrum, however their anisotropic lineshapes are much better resolved in the ENDOR spectrum. These anisotropic lineshapes arise from orientation dependence of the 13C nuclear transition frequencies in the Mn2+ complex. At 3490 G many Mn2+ complexes with different orientations are excited by microwave pulses, and their weighted contributions sum up to produce the broad anisotropic lines. Each line shows two turning points corresponding to minimum and maximum nuclear transition frequencies in their orientation dependence. These turning points are useful for accurate determination of the 13C hyperfine parameters in spectral simulations.
Figure 5.

Experimental (top trace) and simulated (bottom trace) Mims 13C ENDOR spectra of Mn2+ (0.5 mM) in frozen glass solution (H2O/CH3OH) at 3490 G and 10 K. The experimental spectrum was obtained by subtraction of the spectra recorded using 13C and 12C-labeled bicarbonate. The vertical arrow labeled νI indicates the position of 13C Zeeman frequency at 3490 G. Simulation parameters are given in Table 2.
Two-dimensional (2D) HYSCORE was done at 3490 G in order to correlate the 13C nuclear transition frequencies in the two MS = ±1/2 sublevels. Figure 6A shows the contour plot of the 2D spectrum in the low-frequency region where lines from 13C are expected. Only the (+ +) quadrant of the full 2D spectrum is shown, since the other (+ -) quadrant shows no additional features. The peaks lying along the main diagonal of the 2D spectrum correspond to the matrix lines of weakly-coupled 13C and 23Na. The two off-diagonal cross-peaks are also seen and correlate the 13C nuclear transitions in the two electron spin sublevels. These two cross-peaks are mirror images of each other with respect to the main diagonal of the 2D spectrum. Each cross-peak has a pyramidal shape with a triangular base that is outlined for clarity in Figure 6A. The edges of the triangular base, while not resolved clearly, can be outlined qualitatively from analyzing the cross-peak slices along the x- and y-directions in the 2D plot (e.g. some slices are seen in a 3D surface plot presentation of this spectrum in Figure S7 in Supporting Information and show a rectangular lineshape with clearly resolved low- and high-frequency turning points). The top of the pyramid is shifted toward one corner of the triangular base and peaks at 2D coordinates (3.45, 4.05) MHz.
Figure 6.

(A) Contour plots of experimental (A) and simulated (B) 2D HYSCORE spectra (shown in the range of 2-6 MHz) of Mn2+ in frozen solution (H2O/CH3OH) in the presence of 100 mM NaH CO3, recorded at 3490 G and 10 K. The position of the 13C cross-peaks are bordered by triangles for clarity. Matrix lines from distant 13C and 23Na nuclei are also seen at (3.72, 3.72) MHz and (3.92, 3.92) MHz. The dashed line is shown perpendicular to the main diagonal of the 2D spectrum and passing through (νI, νI). The entire body of the 13C cross-peaks is positioned below this line. Simulation is done using parameters from Table 2.
These pyramidal cross-peak shapes arise from superposition of many orientations of the Mn2+ complex in frozen solution samples and result from orientation-dependent correlation of the 13C nuclear transition frequencies in two electron spin manifolds MS = ±1/2. The triangular cross-peak shape indicates that the spin-Hamiltonian of Mn2+ has rhombic symmetry which can arise either from rhombicity in 13C hyperfine or ZFS tensor, or (in case of axial tensors) from non-collinear orientation of the two tensors 42. The corners of the triangular base represent three turning points in the anisotropic cross-peak lineshape. This feature contrasts with only two turning points found in spectral lineshapes of the 1D ENDOR spectrum in Figure 4. However, when the 2D spectrum in Figure 6A is projected onto the horizontal (or vertical) axis, two of the three turning points coincide resulting in a lineshape with only two turning points, consistent with the 1D ENDOR spectrum. We also point out that the triangular cross-peaks are shifted below the line (shown dashed in Figure 6A) that is perpendicular to the main diagonal and passes through coordinates (νI, νI) in the 2D spectrum. This shift to lower frequencies has the same origin as the negative shift of the sum combination line observed in the 1D ESEEM spectrum (Figure 4) and it can only arise for specific values of T and D and at specific orientations of the two tensors.
Simulations of the 2D HYSCORE spectrum were performed to extract the ZFS coupling and the 13C hyperfine parameters associated with the Mn-bicarbonate complexes. Since our goal was to reproduce the lineshapes of the cross-peaks and not their relative intensities, only the inner transition (-1/2 ↔ +1/2) was taken into account for the HYSCORE simulations. The extracted parameters from HYSCORE simulations were then refined in simulations of 1D ESEEM and ENDOR spectra. In this HYSCORE simulation our criteria for the best fit were (1) the pyramidal shape of the 13C cross-peak with triangular base and three turning points, (2) the peak intensity of the cross-peak which is shifted towards one (inner) corner of the triangular base, (3) the entire body of the cross-peak shifted to low frequencies, e.g. below the dashed line in Figure 6A. This set of constraints allowed us to uniquely determine the simulation parameters as explained below.
Six fitting parameters were involved in the simulation: the isotropic (aiso) and anisotropic (T) components of the 13C hyperfine tensor (axial symmetry of the tensor was assumed), the coupling (D) and rhombicity (E) of the ZFS tensor, and two Euler angles (β and γ) to define orientation of the hyperfine tensor in the ZFS tensor frame (only two Euler rotations are needed because we assumed the hyperfine tensor to be axial). The Euler angles β and γ are defined as two subsequent rotations of the hyperfine tensor eigen-frame around X and then Z axes in the eigen-frame of the ZFS tensor. The initial settings for three out of six parameters were estimated from the above analysis of the ESEEM/ENDOR spectra (e.g. aiso = 1.4 MHz and T = 1 MHz) and from the qualitative simulations of the absorption EPR spectrum (e.g. D ∼ 700 MHz). The remaining parameters (E, β and γ) were allowed to span over all possible values. The simulated HYSCORE spectrum was highly sensitive to the relative signs of D and T, and also to the angle β between the principal axes of the two tensors (e.g. see some selected simulations for different values of D and β in Figure S6 in Supporting Information). Therefore, these three parameters were optimized first. Considering the case of T and D having the same sign, only the narrow range of β from 0 to 10 degrees produced the triangular cross-peak shapes positioned below the dashed diagonal line in Figure 6A (which thus satisfies the criteria 1 and 3). However, the peak intensity was shifted to the centroid of the triangular shape unlike in the experimental spectrum where the peak intensity is at the corner of the triangular base (criteria 2). When β was increased close to 45 degrees, the triangular shape shrinked to stripes with no sharp edges positioned along the dashed line in Figure 6A, and for β > 45 degrees the cross-peaks were positioned above this line. Thus, fixing the signs of T and D to be the same and at any angle β is insufficient to simulate the experimental spectrum.
Considering unlike signs of T and D, angles β from 0-45 degrees resulted in cross-peaks above the dashed line, while 45 < β ≤ 70 degrees produced the “bell”-shaped peaks (Figure S6C in Supporting Information). However, for values 70 < β ≤ 90 degrees, the cross-peaks are triangular shaped and below the dashed line. Also at β close to 90 degrees, the peak intensity of the cross-peak shifts to the inner corner of the triangular base as is observed in the experimental spectrum (Figure S6E in Supporting Information). Thus, all three fitting criteria are satisfied for T and D of the opposite signs and β = 90 ± 10 degrees. Fine tuning of the simulated spectrum was performed next by varying γ, E and aiso. We found that introducing non-zero E sharpened the turning points of the triangular shaped cross-peak making it closer to the experimental lineshape. The closest fit was obtained at D/6 < E < D/3 and angles 45 < γ ≤ 90 degrees. In the final step, the accurate position of the peaks was adjusted by varying aiso in the range of 1.0-1.3 MHz. The best fit parameters are summarized in Table 2.
Table 2.
Spin-hamiltonian parameters for the 1:2 complex, Mn2+(CO32-)(HCO3-)(OH2)3, as derived from the 2D HYSCORE simulations
| aiso (MHz) | T (MHz) | D (MHz) | E (MHz) | Euler Angles (β,γ) in degrees |
|---|---|---|---|---|
| -1.1(±0.1) | 0.8(±0.1) | -700(±50) | ±115(±25) | 90(±10) 90(±45) |
The best fit parameters obtained from HYSCORE simulations were then used to simulate the 1D ESEEM and ENDOR spectra and an excellent agreement was found between the simulated and experimental spectra as demonstrated in Figures 4 and 5. Both lineshapes and line positions, including two lineshape turning points, are reproduced in the simulated spectra. To obtain the correct relative intensities of the 13C transitions in the simulated ESEEM spectrum it was important to include the contributions from electron spin transitions which involve higher MS states. Assuming 70-80% of the ESEEM intensity from the +1/2 ↔ -1/2 transition and the rest 20-30% from other transitions produces the best fit to the experimental intensities as shown in Figure 4B (the simulations with other fractional contribution from the high spin state transitions are shown for comparison in Figure S4B in Supporting Information).
In order to deduce the absolute number of 13C nuclei bound to Mn2+, the absolute peak intensities in the normalized simulated ESEEM spectra were compared to the experimental ESEEM (Figure S4A in Supporting Information). The ESEEM simulations for two equivalent 13C nuclei were done using an approximation of “uncorrelated orientations of the nuclei”43 and accordingly the time-domain for two nuclei was calculated as a simple square of the time-domain of a single 13C. The validity of this approximation was examined by extending the simulations to account for specific relative orientations of the two 13C nuclei in the complex. It was found that for any orientation of the two nuclei (including the special case of “trans” orientation of the ligands where suppression of modulation depth is observed in S=1/2 and I=1/2 systems44) yielded closely comparable result to the approximation of “uncorrelated orientations”. By comparing the simulations for one and two nuclei, it was concluded that only one 13C nucleus contributes to the observed experimental ESEEM spectra (see Figure S4A). The second 13C of the second bicarbonate ligand in [Mn(HCO3)2] is probably coordinated in different mode, therefore has different hyperfine coupling and is not observed in the ESEEM spectra.
Hyperfine interactions to Mn2+ ligand protons
Mims 1H ENDOR was used to probe the hyperfine couplings to ligand protons in the coordination sphere of Mn2+. The spectra recorded at three different concentrations of added bicarbonate in solution are shown in Figure 7A. All three spectra are quite similar and show the same set of resolved peaks (labeled with arrows) with only their relative intensities varying on bicarbonate concentration. The most intense peak at 14.9 MHz (labeled as νp) and also the small features that are partially resolved on this peak correspond to interactions to remote protons from the 2nd and farther coordination shells of Mn2+. All other resolved peaks are due to protons of the water ligands from the 1st coordination sphere of Mn2+ (labeled with ±1/2 and ±3/2) and correspond to nuclear spin transitions from the complexes orientated perpendicular to the static magnetic field arising from the electron spin manifolds MS = ±1/2 and ±3/2, respectively22. As reported previously by Tan et.al. 22 and Manikandan et. al.45, there are additional overlapping features that arise from the parallel orientations of the complex which are hidden underneath the more pronounced perpendicular features (e.g. weak parallel features from the MS = ±1/2 sublevels overlap with the perpendicular features from the MS = ±3/2 sublevel).
Figure 7.

(A) Mims 1H ENDOR spectra of Mn2+ (0.5 mM) in frozen glass solution (H2O/CH3OH) at 3490 G and 10 K, and at different concentration of added NaHCO3: (black) 0 mM, (red) 50mM and (green) 100mM. The 1H matrix line is shown by the arrow marked by νp. The lines marked with ±1/2 (perpendicular feature) and ±3/2 (perpendicular feature, although a small contribution from the ±1/2 parallel feature is also present) are from protons of water ligands and arise from electron spin manifolds ±1/2 and ±3/2, respectively. Their splitting gives a measure of the perpendicular component of 1H hyperfine coupling (A⊥). Each ENDOR spectrum was normalized to the respective echo intensity in the absence of RF pulse. (B) Normalized intensities of the 1H ENDOR lines from (A) are plotted as a function of bicarbonate concentration. These lines are from the water ligands to Mn2+ and correspond to the four electron spin sublevels: MS = -3/2  , -1/2 (■), +1/2
  and +3/2
  . The line intensities of each transitions were normalized by the respective line intensities in the spectra (no added bicarbonate) and 12 protons were assumed in the first coordination shell of . The upper and lower horizontal dashed lines mark the normalized ENDOR intensities for and for the 1:2 complex, [Mn(CO3)(HCO3)(H2O)3]-, respectively. The solid line represents the fit to the model shown in Eqn. (9).
Upon addition of bicarbonate, no new peaks appear in the ENDOR spectra. At 100 mM bicarbonate, 80% of Mn2+ has two bicarbonate ligands but no new peaks assignable to bicarbonate protons could be resolved. Protons of the bicarbonate ligands are probably weakly coupled to the Mn2+ ion (because of the longer proton-Mn2+ distance) and their transitions must be hidden unresolved in the intense matrix 1H line. We further notice that the resolved peaks from the water ligands (labeled with ±1/2 and ±3/2 in Figure 7) do not change their position and shape but only their intensity decreases upon addition of bicarbonate and formation of the Mn2+-bicarbonate complex. The peaks become less intense as greater fraction of the complexes form at higher bicarbonate concentrations. This suggests that bicarbonate ligands bind to Mn2+ by replacing some of the water ligands (therefore the decrease in the peaks intensity) but coordination geometry of the remaining water ligands is not affected (therefore the peak frequencies are unchanged).
Reduction of the peak intensity of the MS = ±1/2 and ±3/2 transitions as a function of added bicarbonate can be used to assess the number of the remaining water ligands in the coordination shell of the Mn2+ complexes. Figure 7B shows the normalized intensity of the ENDOR peaks plotted as a function of added bicarbonate. Since the MS = ±1/2 transitions overlap with the matrix line (νP) their intensities were determined as peak-to-trough amplitudes in the first derivative plots (calculated numerically) of the ENDOR spectra. This approach enables extraction of accurate intensities of these transitions without requiring spectral deconvolution. The peak intensities for the ±3/2 transitions were measured directly from the ENDOR spectra after baseline correction. For Figure 7B, the intensities for each of the four transitions measured at different concentrations of bicarbonate were normalized to the intensity of the respective peak in the spectra (no added bicarbonate). Because has six water ligands (i.e. 12 protons) in the first coordination shell39, then the normalized intensities in Figure 7B give a quantitative measure of the average number of water ligands (protons) per one Mn2+ in bicarbonate solution. We notice that the four ENDOR transitions show nearly identical dependence on bicarbonate concentration within experimental error. We interpret this as clear indication that the relative contributions from the five EPR transitions of Mn2+ to the ENDOR spectrum at 3490 G do not change appreciably with bicarbonate concentration. Furthermore, these relative contributions are comparable for all three complexes involved in the bicarbonate equilibrium (Eqn. 7), namely and the 1:1 and 1:2 complexes. These conclusions together with the assumption that geometry of the remaining water ligands in the first shell of Mn2+ is not appreciably affected upon bicarbonate complexation, allow us to formulate a simple model to describe the dependence of the ENDOR peak intensity on bicarbonate concentration:
| (9) |
where, pi is the number of water ligand protons in each complex involved in the equilibrium (p0 = 12 for ), and ni(c) is the mole fraction for each complex as a function of bicarbonate concentration c. To calculate ni(c) we used the equilibrium model of Eqn. (7) and the binding constants K1 and K2 obtained from the room temperature EPR and electrochemistry data (Table 1). This leaves only two fitting parameters p1 and p2. Fitting of the four dependences in Figure 7B using the same set of parameters results in p1 = 8-10 protons (4-5 water ligands) for the 1:1 complex and p1 = 4-6 protons (2-3 water ligands) for the 1:2 complex. Based on these numbers we formulate the 1:1 complex as [Mn2+(HCO3-)(OH2)4-5] and the 1:2 complex as [Mn2+(HCO3-)2(OH2)2-3].
Discussion
Stability constants of the Mn2+ complexes
The observed changes in redox potential (Figure 1A and 1B) of the Mn2+/Mn0 couple in the presence of bicarbonate is rationalized by the formation of two electro-active Mn-bicarbonate complexes with metal:ligand stochiometries of 1:1 and 1:2, respectively. The 1:1 complex forms at bicarbonate concentrations between 10 and 75 mM, and a 1:2 complex dominates in solution above 100 mM bicarbonate. This speciation was also confirmed in room temperature EPR measurements (Figure 2A). Both methods resulted in stability constants in agreement with each other (Table 1) with K1=18 M-1 and K2=568 M-2. This constants are in good agreement with K1 = 18.6 M-1 for the 1:1 complex [Mn(HCO3)]+ determined by potentiometric titrations at 298 K19, and with K1 = 63 and 2.8 M-1 measured at 298 K at different ionic strengths of solution equal to 3.0 and 0.0, respectively36. The value of K2 has never been reported before.
Binding modes and local structure
The 13C-hyperfine tensor resolved from ESEEM, ENDOR and HYSCORE spectra unequivocally show that Mn2+ forms first coordination shell complexes with bicarbonate/carbonate. The simulations parameters (Table 2) can be used to infer the local structure and specifically the binding modes of carbonate ligand in the coordination sphere of Mn2+.
The anisotropic part of the 13C hyperfine tensor (T = 0.8 MHz) may involve two contributions: a direct dipole-dipole hyperfine interaction (Tdd) between the 13C nucleus and the unpaired electron spin residing on Mn2+, and also the anisotropic term (Tp) arising from the finite electron spin density localized on the p-orbital of the bicarbonate ligand. The isotropic coupling extracted from our simulations aiso = -1.1 MHz corresponds to about ∼3% of the unpaired electron spin density on the p-orbital of the bicarbonate ligand as can be estimated based on aiso ∼ 33 MHz reported for 100% spin density localized on the p-orbital of the (bi)carbonate radical in solutions46. This 3% of p-orbital spin density translates into Tp = 0.09 MHz as estimated using the value Tp = 3 MHz reported for carbonate radical anion47. Assuming that the main axes of the two anisotropic tensors (Tdd and Tp) are oriented by 90 degrees to each other (as might be expected for the complex geometry shown in Scheme 1), the actual value of the dipole-dipole term can then be estimated Tdd = 0.85 MHz. This later value can be used in a point-dipole approximation to estimate distance (R) between the electron spin density localized on Mn2+ ion and the 13C nucleus of the bound (bi)carbonate ligand:
| (10) |
Here all parameters are as defined above for Eq. (1). In case of 13C, this equation reduces to T = 19.9/R3(in MHz), where R is in Å. Thus, Tdd = 0.85 ± 0.1 MHz derived from the spectral simulations corresponds to a distance of 2.85 ± 0.1 Å between the Mn2+ and 13C nuclei.
Scheme I.

Deduced structure of the 1:2 complex, Mn2+(CO32-)(HCO3-)(OH2)3, formed in solution at high bicarbonate concentrations (> 50 mM) at pH 8.3. The arrows (DZZ and AZZ) show orientations of the principal axes of ZFS and 13C hyperfine coupling tensors. Their relative angle 90° corresponds to angle β derived from 13C HYSCORE simulations.
Carbonate complexes of 3d-transition metal ions have previously been synthesized and their X-ray structures have been resolved (reviewed in 48). It has been shown that (bi)carbonate can bind in either mono-dentate or bi-dentate modes and the average distances (Mn-C) for both types of coordination are summarized in Table 3. No distances have been reported for Mn2+-bicarbonate complexes although a distance of 3.048 Å for a bridging bicarbonate in polymeric MnCO3(s) has been observed49. For other transition metal ions, e.g. Cu2+ and Co2+/Co3+, the metal-carbon distances are known for both mono-dentate and bi-dentate coordination modes (Table 3). Co2+ usually exhibits a mono-dentate coordination while Co3+ prefers a bi-dentate coordination. Cu2+ was observed in both mono- and bi-dentate coordination modes. Limited EPR data are available on Cu2+-bicarbonate complexes in solutions and demonstrate comparable metal-carbon distances to what found in single crystals50. Based on the Cu2+-C and Co2+/Co3+-C distances and renormalizing for a greater ionic radius of Mn2+ (see a footnote for Table 3), we estimated the expected Mn-C distances of 2.75-2.9 Å for a bi-dentate coordination of bicarbonate to Mn2+ and 3.3-3.35 Å for a mono-dentate coordination. It is concluded that the distance 2.85 ± 0.1 Å derived from our EPR data for one of the (bi)carbonate ligands in the 1:2 complex corresponds to the bi-dentate coordination. The bi-dentate mode of coordination invokes a π-type overlap between 2pπ orbital of carbonate ligand and two dπ orbitals (dzx and dzy) of Mn2+. Thus a significant transfer of unpaired electron spin density from Mn2+ onto (bi)carbonate ligand can be expected that explains the substantial isotropic hyperfine coupling, aiso = 1.1 MHz, found on the 13C nucleus. To our best knowledge the bi-dentate coordination has never been previously identified in aqueous solution speciation of Mn2+.
Table 3.
X-ray distances for metal-(bi)carbonate complexes. Both mono- and bi-dentate coordination modes are included
| r(Metal-13C) in carbonate modes | (Cu-13C) Å | (Co-13C) Å | (Mn-13C) Å |
|---|---|---|---|
| Mono-dentate | 2.9a | 3.1b | 3.35c |
| Bi-dentate | 2.4-2.5a | 2.3-2.4b | 2.75-2.9c |
| 2.75-2.95 (this work) |
Based on X-ray diffraction on single crystals of copper complexes: [Cu(HCO3)](aq), [Cu(CO3)](aq), [Cu(CO3)2]2-(aq) and Na2[Cu(CO3)2](s)50
Based on X-ray diffraction on single crystal of cobalt complexes: K2[CoII(H2O)4(CO3)2](s) for mono-dentate, [CoIII(NH3)4CO3]Br(s) for bi-dentate48
Estimated based on ionic radii (Co3+ = 0.63 Å, Co2+ = 0.74 Å, Cu2+ = 0.69 Å and Mn2+ = 0.80 Å)
Upon comparing the experimental and simulated ESEEM intensities (Figure S4A) we concluded that the resolved 13C coupling belongs to one (bi)carbonate ligand in the 1:2 complex and that the second bicarbonate ligand is EPR-invisible. We thus speculate that this second ligand coordinates probably in a different (mono-dentate) mode and its poor spectral resolution is explained by either a small hyperfine coupling or by a large dispersion (strain) in the hyperfine tensor rendering the nuclear spin transitions to be broad and unobservable (e.g. the disappearance of the proton combination line was reported in ESEEM spectra of )29. The 1H ENDOR data supports this model by revealing that there are three water ligands in the first coordination shell of Mn2+ in 1:2 complex. Having three water ligands leaves only three coordination sites on Mn2+ to bind two (bi)carbonate ligands. Two of these sites are occupied by the first carbonate ligand bound in bi-dentate mode. The second bicarbonate thus binds to the remaining vacant binding site in a mono-dentate coordination mode.
Our suggested structure for the 1:2 complex is shown in Scheme I. This involves two (bi)carbonate ligands, one in bi-dentate and the second in mono-dentate mode, and also three water ligands. We assume a trans relative position for the two (bi)carbonate ligands (not known directly from our simulations), yielding a facially ligated pseudo-octahedral complex. The arrows show orientations of the principal axes of ZFS tensor (DZZ) and also the 13C hyperfine tensor (AZZ) for the bi-dentate bicarbonate ligand in the molecular frame of the complex. The hyperfine tensor arises from dipole electron-nuclear spin interaction and its principal axis (AZZ) lies along a vector connecting Mn2+ to 13C nucleus of the ligand. The ZFS tensor arises from non-cubic distortions to the Mn2+ ligand field and therefore the ZFS principal axis (DZZ) should lie oriented along the main symmetry axis of the ligand field. (Bi)carbonate ions are known to be a stronger ligand than H2O molecules, and therefore for the structure shown in Scheme I the two (bi)carbonate ligands define the plain of the strongest distortion to the ligand field symmetry of Mn2+. The symmetry axis of the ligand field (and thus the orientation of the principal axis of ZFS) should be perpendicular to the plain as is shown with arrow in Scheme I. With this arrangement the principal axes of ZFS tensor (DZZ) and the 13C hyperfine tensor (AZZ) form an angle 90° which is consistent to β = 90° derived from the HYSCORE spectral simulations.
Mn2+ speciation model and its significance
Scheme II shows the chemical speciation of Mn2+ in aqueous bicarbonate solutions as inferred from the data presented in this work. The room temperature electrochemistry and EPR data reveal the presence of 1:1 and 1:2 complexes in solution. The 1:1 species formed in the concentration range of 10-50 mM bicarbonate is represented in Scheme II by two species [Mn(HCO3)]+ and [MnCO3], e.g. bicarbonate and carbonate forms of the complex. The existence of two (protonated and deprotonated) forms can be rationalized as follows. The pKa of free bicarbonate ion in solution is 10.5. The pKa of bicarbonate bound to Mn2+ is unknown but expected to be significantly lower because of the electropositive nature of Mn2+. Upon binding to Mn2+ the pKa of water molecule is decreased by 5 units, from 15.6 to 10.5. Taking into account the negative charge on bicarbonate molecule one expects a smaller effect (decrease by 2-3 units) as compared to a water molecule. The stability constants for the 1:1 Mn-bicarbonate and Mn-carbonate complexes have been measured48 and can be used to estimate pKa∼8.5 for bicarbonate bound to Mn2+. Thus at pH = 8.3 used in our electrochemistry and EPR experiments both bicarbonate and carbonate complexes are expected at comparable fractions. Similarly, the 1:2 species in Scheme II is also represented by the equilibrium of [Mn(HCO3)2] and [Mn(CO3)(HCO3)]- considering the deprotonation of one of the bound bicarbonate ligands. Thus the overall Mn2+ speciation is represented by equilibrium of five species and their population depends on bicarbonate concentration and pH of the solution.
Scheme II.

Model describing speciation equilibrium of Mn2+ in bicarbonate solutions at pH 8.3.
The speciation shown in Scheme II is important for understanding the redox chemistry of Mn2+ in aqueous solutions. The oxidation potentials (in Mn2+/Mn3+ redox couple) for the 1:1 and 1:2 Mn2+-bicarbonate complexes have been found to decrease significantly from E0 = 1.18 V for to 0.67 V and 0.52 V, respectively21. These low oxidation potentials bring these bicarbonate complexes well within the range of oxidation capability of many metal enzymes, like photosystem II. Thus formation of the Mn2+-bicarbonate complexes might have important implication for biological oxidation pathways of Mn2+. An important example is found in the field of photosynthesis. The photo-pigments of the native reaction centers from Rhodobacter sphaeroides, a class of anoxygenic phototrophs, have redox potential close to 0.5 V which can be raised slightly to 0.6-0.7 V by selective mutation of the residues near the reaction center14. These potentials are not high enough to oxidize (1.18 V). However, it has been shown that the redox potential of the mutant is already sufficiently high to allow oxidation of Mn2+-bicarbonate complexes which have potentials 0.55-0.6 V. This work has demonstrated unequivocally that upon formation of Mn2+-bicarbonate complexes, Mn2+ becomes available for a broader range of biological reactions.
Another important example is the photo-assembly process of the Mn4-cluster in PSII-WOC. Previous study has shown that bicarbonate anion plays a selective role in enhancing the rate of assembly of the inorganic Mn4 core responsible for oxygen evolution activity during biogenesis and repair of PSII-WOC. In vitro studies indicate that presence of bicarbonate (∼ 1 mM) leads to a 4-fold acceleration of the net rate of light-induced photo-oxidation of the first Mn2+ by apoWOC-PSII and an increase in the yield of reconstituted centers owing to reduction of photoinhibition8. Formation of ternary Mn2+-bicarbonate-apoPSII complex (with a low oxidation potential) appears to be the origin of the increased assembly rate of the cluster in the presence of bicarbonate51.
The Mn2+-bicarbonate complexes have also been hypothesized to play important role in the evolutionary origin of oxygenic photosynthesis in the archean era12,52. At highly elevated bicarbonate concentration in archean ocean the speciation of many polyvalent metal ions was largely shifted in favor of metalx-(bi)carbonatey complexes. The low pH of the archean ocean prevented from precipitation of insoluble metal-carbonate/hydroxide minerals, thus leading to increased concentration of the metal-bicarbonate complexes in solution. The favorable oxidation potentials of the resulting Mn-bicarbonate species would have enabled them to serve as possible electron donors to early photosynthetic prokaryotes.
The present work on Mn2+ bicarbonate speciation clearly rules out the earlier speculations of Mn2+ dimeric complexes in bicarbonate solutions20,53. Although the pseudo-catalase activity rate was observed to be proportional to square of Mn2+ concentration, this could probably be explained by either a transient dimeric complex or an outer-sphere interaction of two monomeric species in the rate-determining step of peroxide degradation. Our spectroscopic study does not support the existence of a pre-formed dimanganese (II, II) complex in solution.
V. Conclusions
Electroreduction and EPR spectroscopy have provided a self-consistent description of the chemical speciation of Mn2+ with bicarbonate in aqueous solution. The speciation involves two complexes with Mn2+:bicarbonate stoichiometries of 1:1 and 1:2; their stability constants have been determined. The molecular structure of 13C-labelled complexes has been studied using ESEEM, ENDOR and 2D HYSCORE. The derived structures are Mn2+(HCO3-)(OH2)4-5 for the 1:1 complex and Mn2+(CO32-)(HCO3-)(OH2)3 for the 1:2 complex.
Supplementary Material
Acknowledgements
The authors thank Drs. Andrei Astashkin, Sergei Baranov and Michael Russell for helpful discussions and suggestions. This work has been supported by grants from National Institutes of Health (GM-39932) and the Human Frontiers Science Program (RGP 29).
ABBREVIATIONS
- CW
continuous wave
- EPR
electron paramagnetic resonance
- ENDOR
electron-nuclear double resonance
- ESEEM
electron spin echo envelope modulation
- HYSCORE
hyperfine sublevel correlation spectroscopy
- RT
room temperature
- XRD
X-ray diffraction
- ZFS
zero field splitting.
Footnotes
Inert salts like NaNO3 & KNO3 are often used as alternative glass forming agent for aqueous solutions but we found that these salts do not yield good glasses even at saturating 2M concentrations unlike other metal-carbonate systems26.
In ESEEM experiment at 3490 G, all five electron spin transitions within the S=5/2 manifold of Mn2+ are excited (however, with different weights) and therefore the nuclear spin transitions from all six electron spin manifolds (MS = ±1/2, ±3/2, and ±5/2) are expected to show up in the ESEEM spectrum22. However, only the nuclear transitions from MS = ±1/2 are usually observed because the other four transitions from MS = ±3/2 and ±5/2 are broader and therefore less intense (by factor 3 and 5, respectively)29. Also their weighting factors are much smaller than for MS = ±1/2 transitions because only part of the broad linewidth of the transitions involving high MS states is excited by the microwave pulses.
References
- (1).Stumm W, Morgan JJ. Aquatic Chemistry. 3rd ed. Wiley Interscience; New York: 1996. [Google Scholar]
- (2).Martin W, Russell MJ. Phil. Trans. Roy. Soc. London Series B-Biol. Sci. 2003;358:59. doi: 10.1098/rstb.2002.1183. [DOI] [PMC free article] [PubMed] [Google Scholar]
- (3).Ramirez DC, Mejiba SEG, Mason RP. J. Biol. Chem. 2005;280:27402. doi: 10.1074/jbc.M504241200. [DOI] [PubMed] [Google Scholar]
- (4).Ferreira KN, Iverson TM, Maghlaoui K, Barber J, Iwata S. Science. 2004;303:1831. doi: 10.1126/science.1093087. [DOI] [PubMed] [Google Scholar]
- (5).Blankenship RE. Molecular Mechansims of Photosynthesis. Blackwell Science; Oxford: 2002. [Google Scholar]
- (6).Stemler AJ. Photosynth. Res. 2002;73:177. doi: 10.1023/A:1020447030191. [DOI] [PubMed] [Google Scholar]
- (7).Klimov VV, Baranov SV. Biochim. Biophys. Acta. 2001;1503:187. doi: 10.1016/s0005-2728(00)00222-x. [DOI] [PubMed] [Google Scholar]
- (8).Baranov S, Tyryshkin A, Katz D, Dismukes G, Ananyev G, Klimov V. Biochemistry. 2004;43:2070. doi: 10.1021/bi034858n. [DOI] [PubMed] [Google Scholar]
- (9).Biesiadka J, Loll B, Kern J, Irrgang KD, Zouni A. Phys. Chem. Chem. Phys. 2004;6:4733. [Google Scholar]
- (10).Kamiya N, Shen JR. Proc. Nat. Acad. of Sci. U.S.A. 2003;100:98. doi: 10.1073/pnas.0135651100. [DOI] [PMC free article] [PubMed] [Google Scholar]
- (11).Ananyev GM, Nguyen T, Putnam-Evans C, Dismukes GC. Photochem. Photobiol. Sci. 2005 doi: 10.1039/b507519j. In press. [DOI] [PubMed] [Google Scholar]
- (12).Dismukes GC, Klimov VV, Baranov SV, Kozlov YN, Dasgupta J, Tyryshkin AM. Proc. Nat. Acad. of Sci. U.S.A. 2001;98:2170. doi: 10.1073/pnas.061514798. [DOI] [PMC free article] [PubMed] [Google Scholar]
- (13).Russell MJ, Hall AJ. Geochemical News. 2002;113:6. [Google Scholar]
- (14).Kalman L, LoBrutto R, Allen JP, Williams JC. Biochemistry. 2003;42:11016. doi: 10.1021/bi034747o. [DOI] [PubMed] [Google Scholar]
- (15).Thielges M, Uyeda G, Camara-Artigas A, Kalman L, Williams JC, Allen JP. Biochemistry. 2005;44:7389. doi: 10.1021/bi050377n. [DOI] [PubMed] [Google Scholar]
- (16).Schallreuter KU, Moore J, Wood JM, Beazley WD, Gaze DC, Tobin DJ, Marshall HS, Panske A, Panzig E, Hibberts NA. J. Invest. Derm. Symp. Proc. 1999;4:91. doi: 10.1038/sj.jidsp.5640189. [DOI] [PubMed] [Google Scholar]
- (17).Liochev SI, Fridovich I. Proc. Nat. Acad. of Sci. U.S.A. 2004;101:12485. doi: 10.1073/pnas.0404911101. [DOI] [PMC free article] [PubMed] [Google Scholar]
- (18).Fouillac C, Criaud A. Geochem. J. 1984;18:297. [Google Scholar]
- (19).Lesht D, Bauman JEJ. Inorg. Chem. 1978;17:3332. [Google Scholar]
- (20).Sychev AY, Isac VG. Russ. Chem. Rev. 1993;62:279. [Google Scholar]
- (21).Kozlov YN, Zharmukhamedov SK, Tikhonov KG, Dasgupta J, Kazakova AA, Dismukes GC, Klimov VV. Phys. Chem. Chem. Phys. 2004;6:4905. [Google Scholar]
- (22).Tan XL, Bernardo M, Thomann H, Scholes CP. J. Chem. Phys. 1993;98:5147. [Google Scholar]
- (23).Coffino AR, Peisach J. J. Mag. Reson. B. 1996;111:127. doi: 10.1006/jmrb.1996.0071. [DOI] [PubMed] [Google Scholar]
- (24).Tan XL, Bernardo M, Thomann H, Scholes CP. J. Chem. Phys. 1995;102:2675. [Google Scholar]
- (25).Halkides CJ, Bellew BF, Gerfen GJ, Farrar CT, Carter PH, Ruo B, Evans DA, Griffin RG, Singel DJ. Biochemistry. 1996;35:12194. doi: 10.1021/bi9605954. [DOI] [PubMed] [Google Scholar]
- (26).Astashkin AV, Feng CJ, Raitsimring AM, Enemark JH. J. Am. Chem. Soc. 2005;127:502. doi: 10.1021/ja0461466. [DOI] [PubMed] [Google Scholar]
- (27).Ross RT. J. Chem. Phys. 1965;42:3919. [Google Scholar]
- (28).Kozlov YN, Kazakova AA, Klimov VV. Biologicheskie Membrany. 1997;14:93. [Google Scholar]
- (29).Astashkin AV, Raitsimring AM. J. Chem. Phys. 2002;117:6121. [Google Scholar]
- (30).Bond AM. Modern Polarographic Methods in Analytical Chemistry. Marcel Dekker; New York: 1983. [Google Scholar]
- (31).Liang CC. In: Encyclopedia Electrochem. Elem. Bard AJ, editor. Marcel Dekker; New York: 1973. p. 351. [Google Scholar]
- (32).Kolthoff IM, Lingane JJ. Polarography. Interscience Publishers; New York: 1941. [Google Scholar]
- (33).Komula W, Galus Z. Roczniki Chem. 1962;36:1223. [Google Scholar]
- (34).Biernat J, Korita J. Coll. Czechoslov. Chem. Communs. 1960;25:38. [Google Scholar]
- (35).DeFord DD, Hume DN. J. Am. Chem. Soc. 1951;73:5321. [Google Scholar]
- (36).Smith RM, Martell AE. Critical Stability Constants. Vol. 4. Plenum; New York: 1976. Inorganic Complexes. [Google Scholar]
- (37).Abragam A, Bleaney B. Electron paramagnetic resonance of transition ions. Dover Publications; New York: 1986. [Google Scholar]
- (38).Niccolai N, Tiezzi E, Valensin G. Chem. Rev. 1982;82:359. [Google Scholar]
- (39).Richens DT. Chemistry of Aqua Ions. J. Wiley; Chichester: 1997. [Google Scholar]
- (40).Khangulov SV, Pessiki PJ, Barynin VV, Ash DE, Dismukes GC. Biochemistry. 1995;34:2015. doi: 10.1021/bi00006a023. [DOI] [PubMed] [Google Scholar]
- (41).Dikanov SA. In: New Advances in Analytical Chemistry. Atta-ur-Rahman, editor. Harwood Academic Publishers; Amsterdam: 2000. [Google Scholar]
- (42).Dikanov SA, Bowman MK. J. Mag. Reson. A. 1995;116:125. [Google Scholar]
- (43).Dikanov SA, Tsvetkov YD. Electron Spin Echo Envelope Modulation (ESEEM) Spectroscopy. CRC Press; London: 1992. [Google Scholar]
- (44).Spoyalov P, Samoilova RI, Tyryshkin AM, Dikanov SA, Liu B, Hoff AJ. J. Chem. Soc. Perkin Trans. 1992;9:1519. [Google Scholar]
- (45).Manikandan P, Carmieli R, Shane T, Kalb AJ, Goldfarb D. J. Am. Chem. Soc. 2000;122:3488. [Google Scholar]
- (46).Bonini MG, Radi R, Ferrer-Sueta G, Ferreira AMD, Augusto O. J. Bio. Chem. 1999;274:10802. doi: 10.1074/jbc.274.16.10802. [DOI] [PubMed] [Google Scholar]
- (47).Chantry GW, Horsfield A, Morton JR, Whiffen DH. Mol. Phys. 1962;5:589. [Google Scholar]
- (48).Palmer DA, Vaneldik R. Chem. Rev. 1983;83:651. [Google Scholar]
- (49).Maslen EN, Streltsov VA, Streltsova NR, Ishizawa N. Acta Crystallographica Section B. 1995;B51:929. [Google Scholar]
- (50).Schosseler PM, Wehrli B, Schweiger A. Inorg. Chem. 1997;36:4490. doi: 10.1021/ic9703383. [DOI] [PubMed] [Google Scholar]
- (51).Dasgupta J, Tyryshkin AM, Baranov SV, Dismukes GC. unpublished results. [Google Scholar]
- (52).Dismukes GC, Blankenship RE. The Origin and Evolution of Photosynthetic Oxygen Production. Photosystem II. Springer; The Netherlands: 2005. Ch 30, in press. [Google Scholar]
- (53).Stadtman ER, Berlett PB, Chock PB. Proc. Nat. Acad. of Sci. U.S.A. 1990;87:384. doi: 10.1073/pnas.87.1.384. [DOI] [PMC free article] [PubMed] [Google Scholar]
Associated Data
This section collects any data citations, data availability statements, or supplementary materials included in this article.