Abstract
PURPOSE
To understand better the cell and molecular basis for the epidemiologic association between cigarette smoke, oxidant injury, and age-associated macular degeneration, the authors examined the effects of acrolein, a major toxicant in cigarette smoke, on oxidative mitochondrial damage in retinal pigment epithelial (RPE) cells and the reduction of this damage by lipoic acid.
METHODS
Cultured human ARPE19 cells and primary cultures of human fetal (hf)RPE were treated with acrolein. The toxicity of acrolein and the protective effects of R-α-lipoic acid were examined with a variety of previously described techniques.
RESULTS
Acute acrolein exposure exceeding 50 µM (24 hours) in ARPR19 cells caused toxicity, including decreases in cell viability, mitochondrial potential, GSH, antioxidant capacity, Nrf2 expression, enzyme activity (mitochondrial complexes I, II, III; superoxide dismutase; and glutathione peroxidase). Acute exposure also increased oxidant levels, protein carbonyls, and calcium. Continuous acrolein exposure over 8 or 32 days caused similar toxicity but from 10- to 100-fold lower doses (0.1–5 µM). Pretreatment with R-α-lipoic acid effectively protected ARPE-19 cells from acrolein toxicity. Primary hfRPE cells were comparable to the ARPE-19 cells in sensitivity to acrolein toxicity and lipoic acid protection.
CONCLUSIONS
These results show that acrolein is a mitochondrial toxicant in RPE cells and that acrolein-induced oxidative mitochondrial dysfunction is reduced by lipoic acid. The similar sensitivity of the ARPE-19 and hfRPE cells suggests that both models are useful for studying RPE toxicity and protection. These experiments indicate that mitochondria-targeted antioxidants such as lipoic acid may be an effective strategy for reducing or preventing chronic oxidant-induced RPE degeneration in vivo from a variety of sources, including cigarette smoke.
Smoking is a primary risk factor associated with the prevalence and the incidence of neovascular macular degeneration and geographic atrophy.1,2 This link between smoking and age-associated macular degeneration (AMD) has recently been strengthened by three large epidemiologic studies, including the AREDS (Age-Related Eye Disease Study).3–5 Smoking is a cause of severe oxidative stress, due to the high concentrations of aldehydes and NOx in cigarette smoke, which markedly deplete ascorbic acid levels and protein sulfhydryl concentrations and cause oxidation of lipids and proteins.6–8
Six toxicants present in cigarette smoke are of particular concern as health risks: acrolein, acetaldehyde, acrylonitrile, benzene, 1,3-butadiene, and formaldehyde.9 Acrolein has a high hazard index and causes oxidative stress by reacting with sulfhydryl groups.10 It is more toxic (~10–1000 times) than formaldehyde, acetaldehyde, and 4-hydroxynonenal11 and can reach 80 µM in the respiratory tract fluid in smokers.12
Although the pathogenesis of AMD includes different clinical signs, the degeneration of RPE cells is often observed at early stages of the disease. Initial AMD pathogenesis includes abnormal RPE morphology and pigmentation, accumulation of lipofuscin in RPE cells, and accumulation of drusen between RPE and the underlying Bruch’s membrane. Electron microscopic and morphometric studies reveal qualitative and quantitative alterations of mitochondria in human RPE from AMD and from age- and sex-matched control subjects.13
The strong epidemiologic evidence linking smoking to AMD raises several questions that should be addressed: (1) What are the cellular and molecular mechanisms that underlie this link? (2) Do cigarette smoke components such as acrolein cause injury, especially mitochondrial dysfunction, to RPE cells, as in other cellular and tissue models? (3) Does lipoic acid, a potent inducer of phase-2 antioxidant and sulfhydryl protective enzymes, 14,15 protect RPE cells from smoke/acrolein-caused injury and mitochondrial dysfunction? (4) Are there different responses to acrolein toxicity in a human RPE cell line and primary human fetal RPE cells?
In the present study, the ARPE19 cell line, was treated with acrolein, a major toxicant in tobacco smoke, and the effects on cellular toxicity and mitochondrial function were examined. Acrolein-induced toxicity was also studied using primary cultures of hfRPE, which are similar to native hfRPE.16 Both preparations were used to study the protective effects against acrolein-induced toxicity of α-lipoic acid (LA), which is a mitochondria-targeted antioxidant17 and mitochondrial nutrient.18 We hypothesize that smoking may cause oxidative mitochondrial damage in RPE cells and that the mitochondrial dysfunction may be a major cause in promoting the onset and progress of age-related macular degeneration.
MATERIALS AND METHODS
Reagents
Acrolein was purchased from Sigma-Aldrich Chemical Co. (St. Louis, MO) or Sinopharm Chemical Reagent Co., Ltd (Shanghai, China). (R)-α-LA Tris salt was a gift from Klaus Wessel (Viatris, Germany) and was used for all experiments. R-α-LA, S-α-lipoic acid, and R,S-α-lipoic acid used in one comparative experiment were gifts from Asta Medica, Frankfurt, Germany. Unless otherwise stated, all reagents were purchased from Sigma-Aldrich Chemical Co.
Cell Culture
The human ARPE-19 cell line was obtained from Nancy J. Philp (Thomas Jefferson University, Philadelphia, PA) and was cultured according to her methods.19 The ARPE cells were maintained in DMEM-F12 supplemented with 10% fetal bovine serum, 0.348% sodium bicarbonate, 2 mM l-glutamine, 100 U/mL penicillin, and 100 µg/mL streptomycin. Cell cultures were maintained at 37°C in a humidified atmosphere of 95% air and 5% CO2. The medium was changed every 3 to 4 days. ARPE-19 cells were used within 10 generations. hfRPE cells were obtained and cultured as previously reported.16,20
Acrolein Exposure and LA Supplementation
All experiments were performed with an 80% confluent monolayer grown in 96- or 6-well plates. (R)-α-LA Tris salt was dissolved in PBS, and other forms of LA (R-LA, S-LA, and R,S-LA) were dissolved in 1 N NaOH solution, and the pH of the solutions were adjusted to 7.4 with hydrochloric acid. Acrolein was dissolved in PBS each time immediately before an experiment. For the acute toxicity study, cells were exposed to acrolein for 24 hours while for the chronic toxicity study, cells were exposed to acrolein for 8 or 32 days. The protective effects of LA were studied with the acute toxicity model by pretreating cells with LA for 48 hours or 8 days.
MTT Assay for Cell Viability
The MTT reduction assay was used as a qualitative index of cell viability. The optical densities were read at 555 nm with a microplate spectrophotometer (Spectra Max 340; Molecular Devices, Sunnyvale, CA). Absorbance values were normalized with untreated cells to calculate the changes in cell viability.
JC-1 Assay for Mitochondrial Membrane Potential
Mitochondrial potential change (Δψ) was assessed in live APRE-19 cells by using the lipophilic cationic probe 5,5′,6,6′-tetrachloro-1,1′,3,3′-tetraethylbenzimidazol-carbocyanine iodine (JC-1).21 For quantitative fluorescence measurement, cells were rinsed once after JC-1 staining and scanned with a multilabel counter (Wallac 1420; PerkinElmer Life Sciences, Wellesley, MA) at 485-nm excitation and 535- and 590-nm emission, to measure green and red JC-1 fluorescence, respectively. Each well was scanned at 25 areas rectangularly arranged in 5 × 5 pattern with 1-mm intervals and an approximate beam area of 1 mm2 (bottom scanning). For microscopic observation of JC-1 staining of ARPE-19 cells, images were collected with FITC and TRITC fluorescence filter cubes on a microscope (Axiover25; Carl Zeiss Meditec, Inc., Thornwood, NY) equipped with a charge-coupled device (CCD) digital camera (Diagnostic Instruments, Sterling Heights, MI), and processed with image-management software (Photoshop, ver. 7.0; Adobe Systems, Mountain View, CA).
Determination of Oxidant Generation
The generation of intracellular oxidants was determined by the formation of fluorescent 2′,7′-dichlorofluorescein (DCF) on oxidation of the nonfluorescent, reduced DCFH.22 The fluorescence intensity of the supernatant was measured with a plate reader (Wallac; PerkinElmer) at 485 nm excitation and 535 nm emission. Cellular oxidant level was expressed as relative DCF fluorescence per microgram of protein (bicinchoninic acid [BCA] method).
Total Antioxidant Power
Intracellular total antioxidant power of ARPE-19 cells was assayed by the a colorimetric microplate assay kit (total antioxidant power product No. TA 01; Oxford Biomedical Research, Oxford, MI) according to the kit instructions.
Glutathione Peroxidase and Superoxide Dismutase Measurement
Intracellular glutathione peroxidase (G-Px) and superoxide dismutase (SOD) activity was measured with respective assay kits (G-Px, catalog no. 703102, and SOD catalog no. 706002; Cayman Chemical), according to the manufacturer’s instructions.
Assay for GSH Levels
The GSH level was assayed with a commercially available assay kit (Jiancheng Biochemical Inc., Nanjing, China) that is based on a thiol-specific reagent, dithionitrobenzoic acid (DTNB), and the adduct was measured spectrophotometrically at 412 nm.
Detection of Protein Carbonyls
For determination of protein carbonyls, a measure of protein oxidation, cells were grown on 100-mm plates. Protein carbonyls in soluble proteins were assayed with a protein oxidation detection kit (Oxyblot; Cell Biolabs, San Diego, CA).
Total and Nuclear Levels of Nuclear Factor-E2–Related Factor 2
Cells were grown on 100-mm plates and were homogenized (1:10) in RIPA buffer (150 mM PBS containing 1% [vol/vol] Igepal CA630, 0.5% [wt/vol] sodium deoxycholate, 0.1% [wt/vol] SDS, and 5 µg/µL protease inhibitor mixture), pH 7.4, and 50 µg of protein was used for Western blot analysis of total and nuclear nuclear factor-e2–related factor 2 (Nrf2) levels and probed with anti-Nrf2 antibodies (Santa Cruz Biotechnology, Santa Cruz, CA) at a 1:500 titer. Chemiluminescent detection was performed with a Western Blot analysis kit (ECL; GE Healthcare, Piscataway, NJ).14
Intracellular Calcium Assay
Intracellular Ca2+ levels were determined by a calcium assay kit (DICA-500, Quantichrom; BioAssay Systems, Hayward, CA), according to the manufacturer’s instructions.
Assays for Activities of Mitochondrial Complex I, II, and III
ARPE-19 cells were cultured in 100-mm plates, washed in PBS, resuspended in an appropriate isotonic buffer (0.25 M sucrose, 5 mM Tris-HCl [pH 7.5] and 0.1 mM phenylmethylsulfonyl fluoride), and homogenized. Mitochondria were isolated by differential centrifugation of the cell homogenates. NADH-CoQ oxidoreductase (Complex I), succinate-CoQ oxidoreductase (complex II), CoQ-cytochrome c reductase (complex III) were assayed spectrometrically using conventional assays,23,24 with minor modifications.
Statistical Analysis
Data are presented as the mean ± SD of results of two or three separate experiments, as specified in the figure legends. Statistical significance was calculated (Prism software, ver. 4.0a; GraphPad, San Diego, CA) with one-way ANOVA. P < 0.05 was considered significant.
RESULTS
Effects of Acrolein on Cell Viability in ARPE-19 and hfRPE Cells
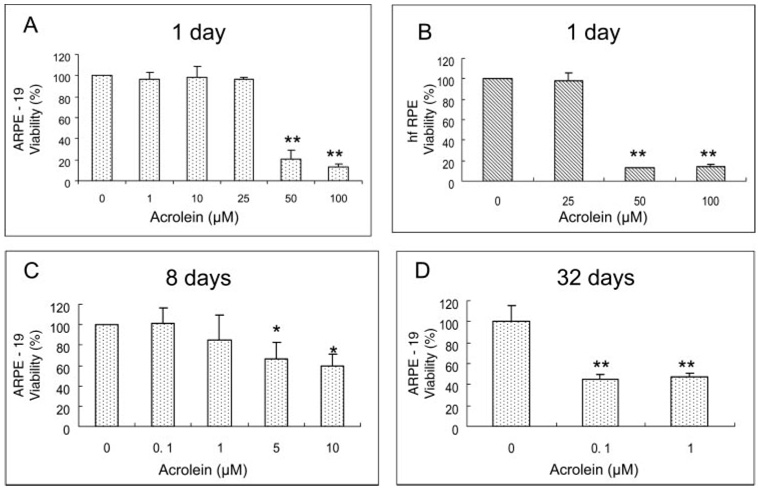
ARPE-19 cells were acutely exposed to 1.0, 10, 25, 50, and 100 µM acrolein for 24 hours. Figure 1A shows that there was no effect on ARPE-19 cell viability when acrolein was 1 to 25 µM, but the viability of the cells was sharply decreased to 21% and 13% compared with the control when acrolein was at 50 and 100 µM. Figure 1B shows that, similar to ARPE-19 cells, acrolein below 25 µM had no effect on hfRPE cell viability but at 50 and 100 µM caused significant decreases (11% and 12% of control, respectively).
FIGURE 1.
Dose-dependent effects of acrolein on cell viability measured by the MTT assay. (A) ARPE-19 cell viability with 24-hour acrolein exposure. Data are the mean ± SD of data from three separate experiments, each performed in triplicate. (B) hfRPE cell viability with 24-hour acrolein exposure. Data are the mean ± SD of data from two separate experiments, each performed in triplicate. **P < 0.01 versus control. (C) ARPE-19 cell viability with 8-day acrolein exposure. (D) ARPE-19 cell viability with 32-day acrolein exposure. Data in (C) and (D) are the mean ± SD of results of one representative experiment of three or six experiments showing the same trend. Each experiment was performed in triplicate.
In the chronic toxicity assay, ARPE-19 cells were exposed to various concentrations of acrolein for 8 or 32 days, respectively. Acrolein caused a significant decrease in cell viability at concentrations of 5 and 10 µM with the 8-day exposure (Fig 1C) and of 0.1 and 1 µM with the 32-day exposure (Fig 1D).
Effects of Acrolein on Mitochondrial Membrane Potential in ARPE-19 and hfRPE Cells
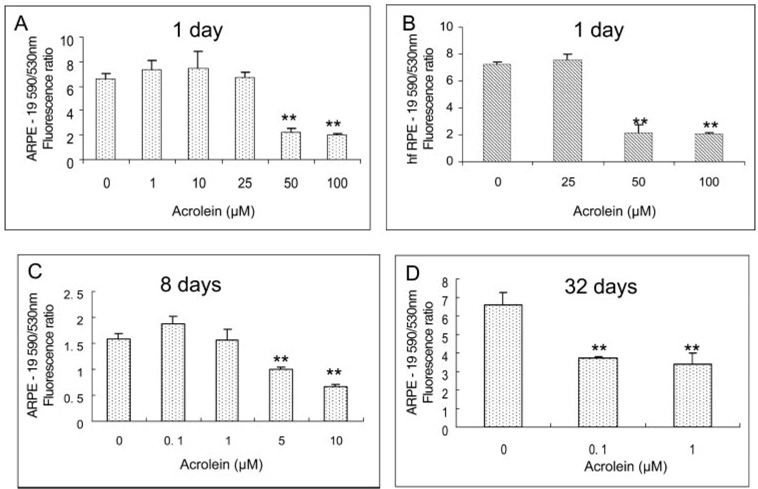
Figure 2A shows the results of the JC-1 assay for mitochondrial membrane potential in ARPE-19 cells. Similar to the cell viability results shown in Figure 1A, acrolein below 25 µM had no effect on mitochondrial membrane potential in ARPE-19 cells but at 50 and 100 µM caused significant decreases (34.4% and 31.3% of control, respectively). Figure 2B shows the results in hfRPE cells. There was no effect below 25 µM acrolein, but significant decreases (29.6% and 28.2% of control) were seen at 50 and 100 µM acrolein concentrations.
FIGURE 2.
Dose-dependent effects of acrolein on mitochondrial membrane potential measured by the JC-1 assay. (A) ARPE-19 cells. Data are the mean ± SD of results of three separate experiments, each was performed in triplicate. (B) hfRPE cells. Data are the mean ± SD of results of two separate experiments, each performed in triplicate. **P < 0.01 versus control. (C) ARPE-19 cells with 8-day acrolein exposure. (D) ARPE-19 cell viability with 32-day acrolein exposure. Data in (C) and (D) are the mean ± SD of results of one representative experiment of three or five separate experiments showing the same trend; each experiment was performed in triplicate.
Prolonged exposure of acrolein to ARPE cells caused a significant decrease in mitochondrial membrane potential. Acrolein caused a decrease in mitochondrial potential at 5 and 10 µM in cells exposed for 8 days (Fig. 2C) and at 0.1 and 1 µM when exposed for 32 days (Fig. 2D).
Protective Effect of LA on the Acrolein-Induced Decrease in Cell Viability in ARPE-19 and hfRPE Cells
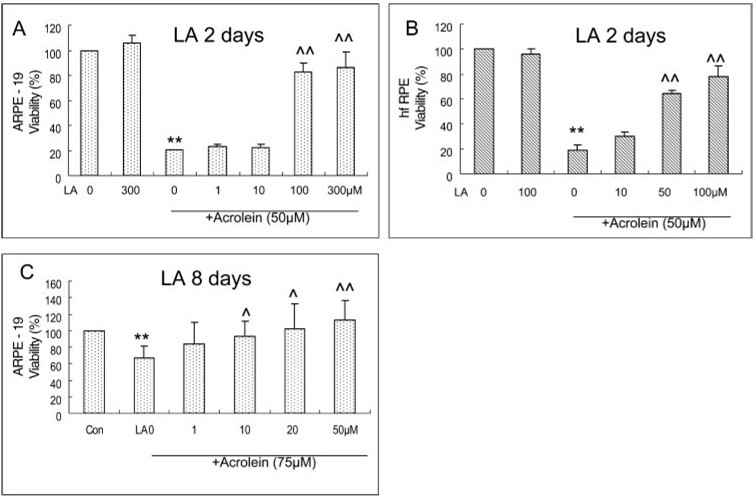
The ARPE-19 and hfRPE cells were seeded at 4 × 10⁴ per well in a 96-well plate. Cells were pretreated with different levels of LA for 48 hours when they were 80% confluent and then were treated with 50 µM acrolein for 24 hours. LA itself had no apparent effect on cell viability in the concentrations used (1–300 µM LA in ARPE-19 and 10–100 µM in hfRPE cells; Fig 3). The pretreatments of ARPE-19 and hfRPE cells with LA resulted in a significant protection against 50 µM acrolein-induced toxicity when the concentration of LA was greater than 100 µM. The protection was 83% and 87% of the control for 100 and 300 µM LA in ARPE-19 cells (Fig. 3A) and 64% and 78% of the control for 50 and 100 µM LA in hfRPE cells (Fig. 3B), respectively. In the 10- to 50-µM range, LA protected against an acute acrolein-induced decrease in cell viability. LA at 50 µM completely abolished acrolein toxicity when ARPE-19 cells were pretreated for 8 days (Fig. 3C).
FIGURE 3.
Protective effects of LA on acrolein-induced decrease in cell viability measured by the MTT assay. (A) ARPE-19 cells with 48-hour LA pretreatment. Data are the mean ± SD of results of three separate experiments; each experiment was performed in triplicate. (B) hfRPE cells with 48-hout LA pretreatment. Data are the mean ± SD of results of two separate experiments, each performed in triplicate. **P < 0.01 versus control (LA 0 µM). ^^P < 0.01 versus acrolein 50 µM without LA. (C) ARPE-19 cells with 8 days-LA pretreatment. Data are the mean ± SD of results of five separate experiments, each experiment performed in triplicate. ^P < 0.05 and ^^P < 0.01 versus acrolein without LA.
Protective Effect of LA on the Acrolein-Induced Decrease in Mitochondrial Membrane Potential in ARPE-19 and hfRPE Cells
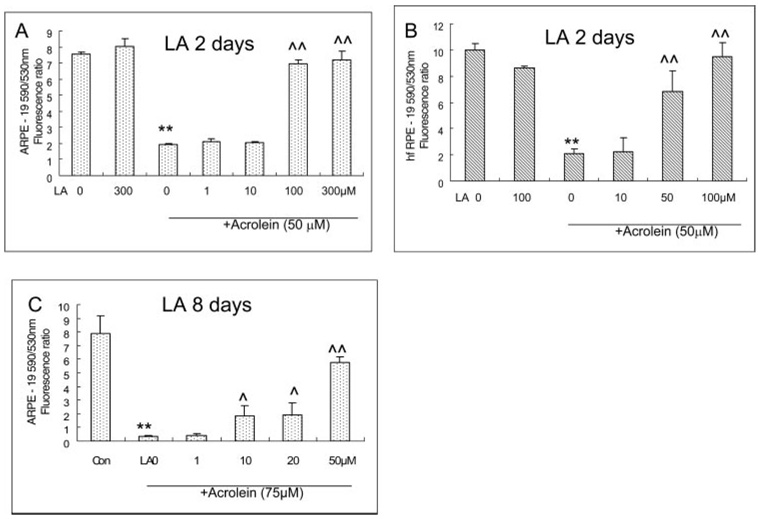
Similar to the cell viability results, LA itself had no apparent effect on mitochondrial membrane potential in both ARPE-19 and hfRPE cells at the concentrations used (1–300 µM LA in ARPE-19 and 10–100 µM in hfRPE cells). Treatment with 50 µM acrolein decreased the 590:530 fluorescence ratio of JC-1 dye by 74% and 80% in ARPE-19 and hfRPE cells, respectively. Pretreatment with LA resulted in 2.6-fold (100 µM LA) and 2.7-fold (300 µM LA) increases in the red-green JC-1 fluorescence ratio relative to 50 µM acrolein-treated cells, respectively, in ARPE-19 cells (Fig. 4A), and 2.3-fold (50 µM LA) and 3.6-fold (100 µM) increases respectively, in hfRPE cells (Fig. 4B). LA at concentrations lower than 10 µM showed no protective effect against acrolein-induced cell toxicity in both ARPE-19 and hfRPE cells. Similar to the protection of cell viability, an 8-day pretreatment enhanced the protective effect of LA. As shown in Figure 4C, 10, 20, and 50 µM LA significantly protected the acute acrolein-induced decrease in mitochondrial membrane potential.
FIGURE 4.
Protective effects of LA on acrolein-induced decrease acrolein-induced decrease mitochondrial membrane potential measured by JC-1 assay. (A) ARPE-19 cells with 48 h-LA pretreatment. Data are the mean ± SD of results of three separate experiments; each experiment was performed in triplicate. (B) hfRPE cells with 48-hour LA pretreatment. Data are the mean ± SD of results of two separate experiments, each experiment was performed in triplicate.**P < 0.01 versus LA 0. ^^P < 0.01 versus LA 0+acrolein 50 µM. (C) ARPE-19 cells with 8-day LA pretreatment. Data are the mean ± SD of results of one representative of five experiments, performed in triplicate.**P < 0.01 versus control ^P < 0.05 and ^^P < 0.01 versus acrolein without LA.
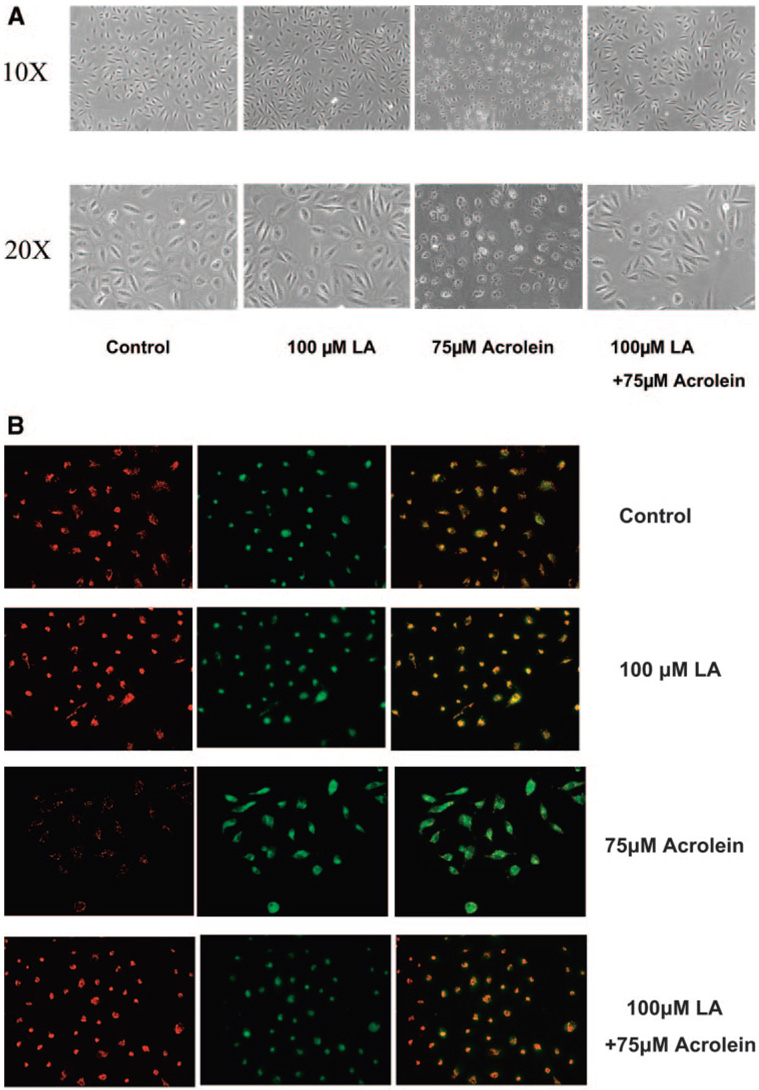
Figure 5 shows representative images of ARPE-19 cells without (Fig. 5A) and with JC-1 staining (Fig. 5B). Acrolein treatment (50 µM) resulted in a significant decrease in cell numbers and a decrease in red J-aggregate fluorescence, reflecting an acrolein-induced decrease in cell viability and mitochondrial potential. Pretreatment with 100 µM LA prevented the acrolein-induced decrease in ARPE-19 cell viability and mitochondrial membrane potential, as demonstrated by the increased number and normal shape of the cells (Fig. 5A) and red J-aggregate staining of LA-pretreated cells (Fig. 5B). Similar results were obtained with hfRPE cells as reported previously on protection by LA on the t-butylhydroperoxide-induced decrease in mitochondrial membrane potential in hfRPE cells.20
FIGURE 5.
Representative images of ARPE-19 cells pretreated with LA for 48 hours and followed by acrolein exposure for 24 hours. (A) Images of cells without staining obtained by light microscopy. (B) Cells stained with JC-1 under fluorescent microscopy: left: the mitochondrial membrane potential at 590 nm; middle: the living cells at 530 mm; right: the merged image. Each is representative of two separate experiments, performed in duplicate.
Inhibition by LA of Acrolein-Induced Generation of Intracellular Oxidants in ARPE-19 and hfRPE Cells
Acrolein at 50 µM induced a significant increase in intracellular oxidants in ARPE-19 and hfRPE cells (2.9 and 2.2 times, respectively) compared with the control. Pretreatment with 100 and 300 µM LA caused significant inhibitions of oxidants (52% and 76% reduction, respectively) in ARPE-19 cells (Table 1). Pretreatment with 50 and 100 µM LA also caused significant inhibition of oxidants (50% and 54%, respectively) in hfRPE cells (Table 2). This protection may be partly due to the effect of LA on inhibiting the basal level of oxidants, because LA alone at concentrations higher than 100 µM caused an inhibition of oxidant generation in untreated normal ARPE-19 and hfRPE cells: 17% inhibition at 100 µM LA in ARPE-19 cells (Table 1) and 18% inhibition at 100 µM LA in hfRPE cells (Table 2).
TABLE 1.
Acute Acrolein Exposure-Induced Changes in Intracellular ROS, G-Px, SOD, Antioxidant Power, and Ca2+ Levels and Modulation by LA Pretreatment in ARPE-19 Cells
| LA (µM) | Acrolein (µM) | ROS | G-Px | SOD | Antioxidant Power | Ca2+ |
|---|---|---|---|---|---|---|
| 0 | 0 | 16205.4 ± 1312.9 | 63.85 ± 9.54 | 8.57 ± 0.39 | 100.51 ± 19.91 | 2.55 ± 0.02 |
| 0 | 50 | 46743.4 ± 429.5** | 48.66 ± 3.86** | 5.57 ± 0.13** | 69.73 ± 9.01** | 2.83 ± 0.07** |
| 1 | 50 | 43454.1 ± 1572.8 | 67.92 ± 1.76†† | 4.91 ± 0.67** | — | 2.77 ± 0.04 |
| 10 | 50 | 43651.1 ± 1622.4 | 65.98 ± 18.66†† | 5.52 ± 1.01** | 63.57 ± 14.90** | 2.77 ± 0.13 |
| 100 | 50 | 22539.4 ± 2397.4†† | 67.02 ± 7.29†† | 8.53 ± 0.49†† | 108.71 ± 20.58†† | 2.70 ± 0.04† |
| 300 | 50 | 11219.6 ± 264.4†† | — | 10.84 ± 1.09†† | 106.83 ± 6.15†† | 2.58 ± 0.03†† |
| 100 | 0 | 13450.5 ± 562.63* | 90.72 ± 4.75** | 10.52 ± 0.29** | 129.41 ± 11.24* | 2.51 ± 0.06 |
Data are the mean ± SD. Exposure was for 24 hours, and pretreatment was for 48 hours. ROS (fluorescence/µg protein), G-Px(nmol/min per milligram protein), SOD(U/µg protein), Antioxidant power (copper reducing equivalences), and Ca2+ (mg/g protein). — no test.
P < 0.05
P < 0.01 versus LA 0 + acrolein 0.
P < 0.05
P < 0.01 versus LA0 + acrolein 50.
TABLE 2.
Acute Acrolein Exposure–Induced Changes in Intracellular ROS, G-Px, SOD, Antioxidant Power, and Ca2+ Levels and Modulation by LA Pretreatment in hfRPE Cells
| LA (µM) | Acrolein (µM) | ROS | G-Px |
|---|---|---|---|
| 0 | 0 | 254.46 ± 56.12 | 52.09 ± 4.25 |
| 0 | 50 | 539.39 ± 61.79** | 33.32 ± 5.24** |
| 10 | 50 | 493.71 ± 17.24** | 37.92 ± 8.94** |
| 50 | 50 | 268.86 ± 68.34†† | 46.73 ± 8.26† |
| 100 | 50 | 248.81 ± 10.46†† | 64.48 ± 16.35†† |
| 100 | 0 | 209.33 ± 13.21* | 61.13 ± 14.41* |
Data are the mean ± SD. Exposure was for 24 hours, and pretreatment was for 48 hours. ROS(fluorescence/µg protein) and G-Px(nmol/min per milligram protein).
P < 0.05
P < 0.01 versus LA0 + acrolein 0.
P < 0.05
P < 0.01 versus LA0 + acrolein 50.
Modulation of the Acrolein-Induced Decrease in Intracellular G-Px in ARPE-19 and hfRPE Cells
Treatment with 50 µM acrolein induced a significant decrease in intracellular G-Px activity in ARPE-19 cells (24%; P < 0.01; Table 1). Pretreatment with 1, 10, and 100 µM LA resulted in a significant protection against G-Px decrease by 39%, 35%, and 37% increase relative to acrolein treatment (Table 1). However, this protection may be due to an effect of LA on stimulating G-Px activity, because treatment with 100 µM LA without acrolein increased G-Px activity by 42% relative to the control (Table 1).
Treatment with 50 µM acrolein decreased intracellular G-Px activity by 36% (P < 0.01) in hfRPE, and pretreatment with 50 and 100 µM LA resulted in a significant protection of G-Px activity (1.4- and 1.9-fold relative to acrolein treatment; Table 2). Treatment with 100 µM LA without acrolein also caused an increase in intracellular G-Px activity in hfRPE cells as in ARPE-19 cells (Table 2).
Modulation of the Acrolein-Induced Decrease in Intracellular SOD in ARPE Cells
Treatment with 50 µM acrolein caused a significant decrease in intracellular SOD activity by 35% in ARPE-19 cells (Table 1). LA pretreatment at 100 µM prevented the decrease in SOD activity. The SOD activities were 1.5-fold for LA 100 µM and 1.9-fold for LA 300 µM group to that of acrolein treated, respectively. Similar to the results of G-Px activity, treatment with 100 µM LA without acrolein increased intracellular SOD activity by 23% relative to control in untreated normal ARPE-19 cells (Table 1).
Modulation of the Acrolein-Induced Decrease in Intracellular Total Antioxidant Power in ARPE-19 Cells
Acrolein at 50 µM decreased intracellular antioxidant power in ARPE-19 cells 30% relative to control (P < 0.01). Pretreatment with 100 µM LA prevented the cells from an acrolein-induced decrease completely (Table 1). Again as on G-Px and SOD activity, this protection may be due to the antioxidant activity of LA itself, since LA at 100 µM without acrolein elevated the intracellular total antioxidant power by 29% compared with control (P < 0.05; Table 1).
Modulation of the Intracellular Ca2+ Increase Caused by Acrolein in ARPE-19 Cells
Mitochondrial dysfunction usually results in an increase in cytoplasmic Ca2+ level, which is a biomarker of oxidative stress and mitochondrial dysfunction. Treatment of ARPE-19 cells with 50 µM acrolein caused a significant increase in the intracellular Ca2+ level by 10.9%, compared with the control (P < 0.01; Table 1). Pretreatment with 100 or 300 µM LA before 50 µM acrolein significantly inhibited the increase in Ca2+ by 4.6% and 8.8% (P < 0.05 and P < 0.01), respectively. LA at 100 µM without acrolein did not significantly change the intracellular Ca2+ level in ARPE-19 cells.
LA Inhibition of Acrolein-Induced Decreases in GSH Level in ARPE-19 Cells
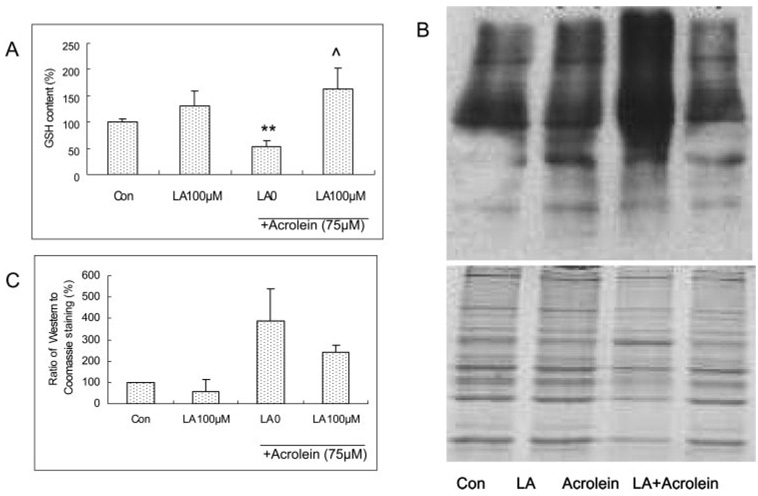
Pretreatment of ARPE-19 cells with LA for 48 hours showed a trend in increasing the GSH level (Fig. 6A). Acrolein at 75 µM for 24 hours caused a significant decrease in the GSH level and LA at 100 µM for 48 hours provided full protection of the GSH level (Fig. 6A).
FIGURE 6.
(A) Acrolein-induced changes in GSH levels and protective effect of LA in ARPE cells. Data are the mean ± SD of results of three separate experiments, each performed in triplicate. **P < 0.01 versus control, ^P < 0.05 versus 75 µM acrolein without LA. (B) Western blot image of protein carbonyls, (C) Quantitative data of protein carbonyls from three separate experiments. LA pretreatment for 48 hours and acrolein exposure for 24 hours in the experiments for both GSH and protein carbonyl assays.
Inhibition of Acrolein-Induced Increase in Protein Carbonyls in ARPE-19 Cells
Acrolein at 75 µM for 24 hours caused a significant increase in protein carbonyls, an index of protein oxidation (Figs. 6B, 6C). Pretreatment with 100 µM LA for 48 hours showed significant inhibition of the acrolein-induced increase in protein carbonyls (Figs. 6B, 6C).
Modulation of the Acrolein-Induced Decrease in Total and Nuclear Nrf2 Expression in ARPE-19 Cells
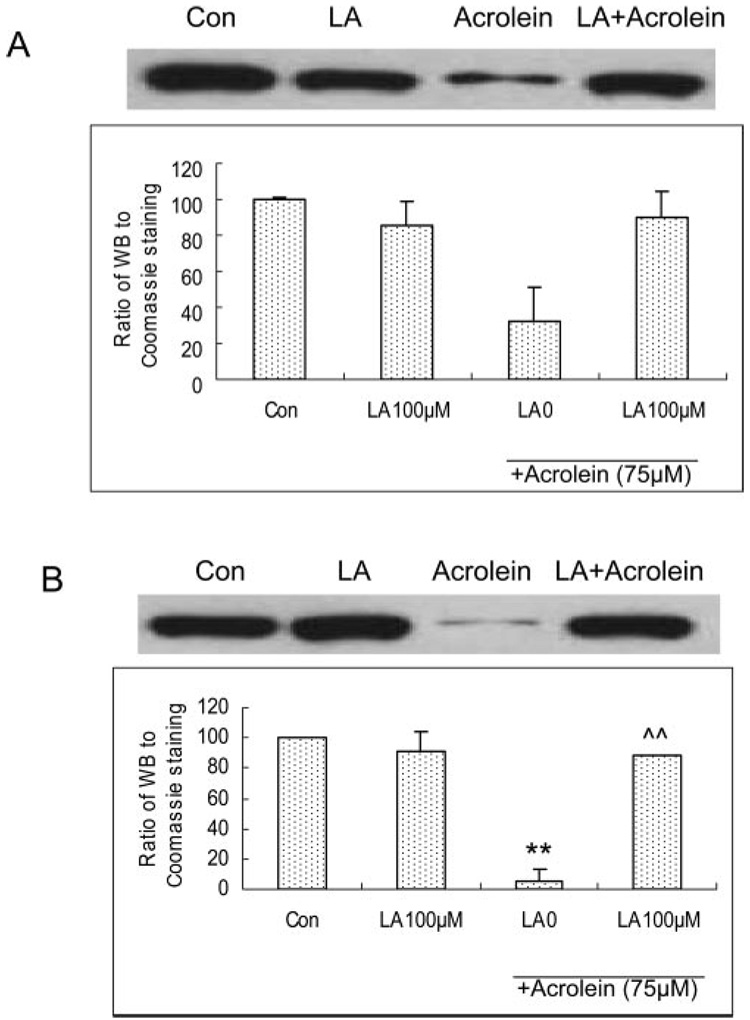
Acrolein at 75 µM for 24 hours caused a significant decrease in both total and nuclear Nrf2 expression in ARPE-19 cells, and pretreatment with LA at 100 µM for 48 hours significantly prevented the cells from acrolein-induced decrease in both total Nrf2 (Fig. 7A) and nuclear Nrf2 (Fig. 7B).
FIGURE 7.
Acrolein-induced changes in total and nuclear Nrf2 expressions and protective effect of LA in ARPE cells assayed by Western blot analysis. LA pretreatment for 48 hours and acrolein exposure for 24 hours. (A) Total and (B) nuclear Nrf2 expression. **P < 0.01 versus control, ^^P < 0.01 versus 75 µM acrolein without LA.
Modulation of Decreases in Mitochondrial Complex I, II, and III Activity Due to Acrolein in ARPE-19 Cells
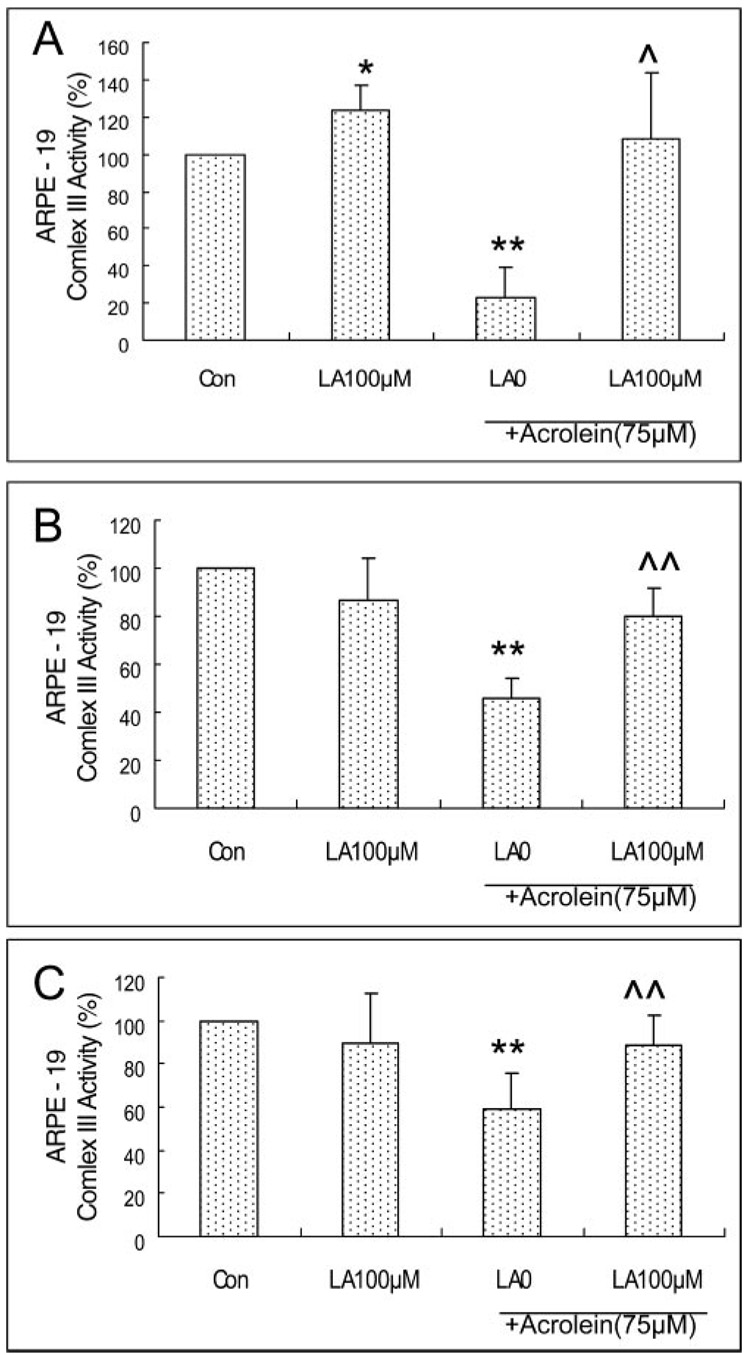
Acrolein at 75 µM for 24 hours caused a significant decrease in the activity of mitochondrial complex I, II, and III in ARPE-19 cells by 68%, 54% and 41% respectively relative to control (Fig. 8). Pretreatment with 100 µM LA showed significant protection of complexes I (Fig. 8A), II (Fig. 8B), and III (Fig. 8C) by 3.4-, 1.7-, and 1.5-fold, respectively, compared with 75 µM acrolein without LA.
FIGURE 8.
Protection by LA of the acrolein-induced decrease in mitochondrial complexes in ARPE-19 cells. (A) Complex I, (B) II, and (C) III. ARPE-19 cells were pretreated with different concentrations of LA and then treated with 75 µM acrolein. Data are the mean ± SD of results of three separate experiments for complex I, and six separate experiments for each of complex II and III, and each experiment was performed in duplicate.*P < 0.05, **P < 0.01 versus control, ^P < 0.05, ^^P < 0.01 versus 75 µM acrolein without LA.
Comparison of the Effect of R-LA, S-LA, and R,S-LA on the Acrolein-Induced Decrease in Cell Viability in ARPE-19 Cells
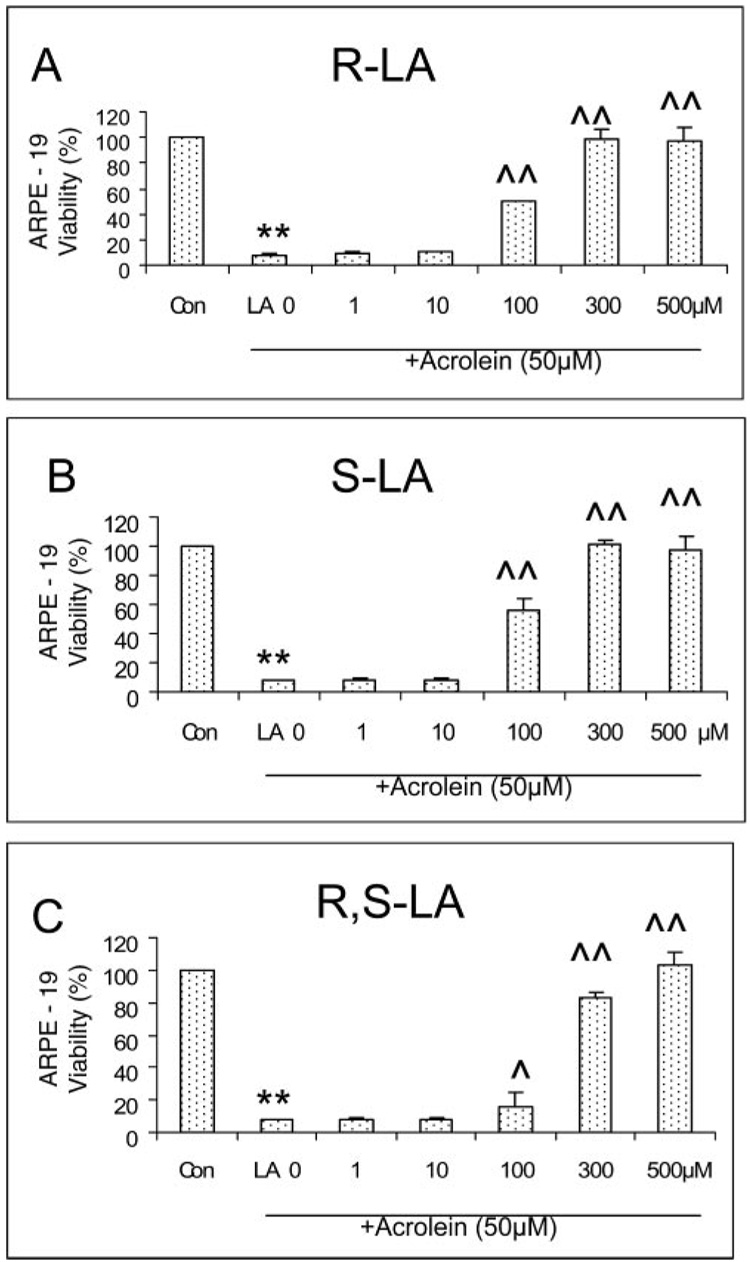
We compared the protective effects of three forms of LA (R-LA, S-LA, and R,S-LA) on the acrolein-induced decrease in cell viability in ARPE-19 cells and found that the protective effects of R-LA, the natural form, and S-LA are similar. They had no effect at concentrations lower than 100 µM and showed full protection at concentrations higher than 300 µM (Fig. 9). R,S-LA afforded weaker protection than R- or S-LA, though at higher concentrations, it also provided full protection (Fig. 9).
FIGURE 9.
Different forms of LA (R-LA, S-LA, and R,S-LA) protect against a 50-µM acrolein-induced decrease in cell viability in ARPE-19 cells. Data are the mean ± SD of results of two separate experiments, and each experiment was performed in duplicate. **P < 0.01 versus control, and ^P < 0.05 and ^^P < 0.01 versus acrolein at 50 µM without LA.
DISCUSSION
We first investigated the effect of acrolein on cell viability in a 1-day (acute) study by MTT assay. Cells lost 79% and 87% of viability after ARPE-19 cells were exposed to 50 and 100 µM acrolein for 24 hours, whereas lower concentrations (1–25 µM) of acrolein had no apparent effect (Fig. 1). Our doses of acrolein are somewhat higher, but still comparable, to those in a study of human bronchial epithelial cells with an LD50 (median lethal dose) of approximately 20 µM.25 This result suggests that acrolein, a particularly toxic cigarette smoke component, can cause RPE injury. It is estimated that acrolein is present in the gas phase of cigarette smoke in amounts of approximately 25 to 140 µg/cigarette.10 Acrolein reaches a concentration of approximately 80 µM in respiratory tract lining fluids as a result of smoking,12 and although the level of acrolein in the retina of smokers is unknown, this result suggests that 50 to 75 µM of acrolein may be higher than physiological levels in the retina. Because smoking is a habitual practice and the concentration of acrolein during smoking is less than that shown in the acute exposure, we exposed RPE cells to low doses of acrolein for 8 days or 32 days and found that long-term exposure to low doses of acrolein (as low as 0.1 µM) induced similar toxicity (demonstrated by cell viability and mitochondrial membrane potential) in the RPE cells. The toxic effect of acrolein, especially, at less than 1 µM during prolonged exposure, strongly suggests that acrolein is a plausible RPE toxicant and that it may be a contributing factor to RPE degeneration due to smoking. The oxidant effect of the high NOx concentration in cigarette smoke is another plausible contributor.6 Acrolein, besides being a smoking component and a ubiquitous pollutant in the environment, can also be generated in several other ways: by polyunsaturated fatty acids during lipid peroxidation, both in vitro and in vivo; by enzymatic oxidation of polyamine metabolites; by biotransformation of allyl alcohol; and by the widely used anticancer drug cyclophosphamide.10,26
ARPE-19 is a human diploid RPE cell line, which displays many differentiated properties typical of RPE in vivo; therefore, the ARPE-19 cell line has been the most commonly used RPE cell in eye research.27 However, hfRPE primary cells from fetal eyes, may more closely mimic the morphology, biochemistry, and physiology of native human and adult RPE.16,20 We compared the ARPE-19 cells and hfRPE cells by testing the following parameters: cell viability, mitochondrial potential, oxidant generation, and G-Px activity. We found that both ARPE-19 and hfRPE cells have similar sensitivity to acrolein toxicity on all parameters tested, and LA, showed similar protective effects in both cell systems. These results suggest that the effects of acrolein and LA shown in the present study may be applicable to clinical eye problems, and that ARPE-19 cells may be suitable for studying the biochemical mechanisms of RPE toxicants and protective agents.
Oxidative damage to RPE cells and photoreceptors has been implicated in the pathogenesis of AMD, and RPE protein oxidation could be induced by different types of oxidative stress, such as hyperoxia, H2O2, and paraquat.28 Both in vitro and in vivo studies show that acrolein toxicity is mediated by increased oxidants and oxidative damage29 and that acrolein may act a generator of oxidants by different pathways.30 Acrolein can directly react with antioxidants such as GSH by a Michael addition mechanism to form a 1,4-addition intermediate product and then isomerize into a 1,2-addition product.10 Exposure of the ARPE-19 cells to micromolar levels of acrolein resulted in significant increases in the levels of oxidants, in protein oxidation, and in significant decreases in GSH, in total antioxidant power, and in antioxidant enzymes (SOD and G-Px). Pretreatment of the RPE cells with the antioxidant LA before the acrolein treatment significantly protected RPE cells from acrolein-induced oxidative damage. These results suggest that oxidative stress is, at least in part, responsible for acrolein cytotoxicity and that acrolein may act as an oxidant, perhaps indirectly,31 causing oxidative damage to RPE cells.
Nrf2 is known as a key regulator of antioxidant response element-mediated gene expression and the induction of phase 2 detoxifying enzymes and antioxidant enzymes. Several chemopreventive agents, including sulforaphane32 and LA,14 have been shown to be phase-2 enzyme inducers. In the present study, acrolein exposure caused a significant decrease in total and nuclear Nrf2 expression and LA pretreatment significantly elevated the total and nuclear Nrf2 expressions to the control level. These results suggest that LA, like sulforaphane protects RPE from photo-oxidative damage32 and prevents acrolein-induced oxidative damage by activating the Keap1/Nrf2 pathway.
Mitochondrial dysfunction may be a key mechanism for acrolein toxicity. Mitochondria are the main generation sites of oxidants and are the targets of oxidants because they are particularly sensitive to oxidative insults.33 Acrolein is a cytotoxic and genotoxic environmental pollutant.10 The mechanisms of the toxicity have been suggested to be linked to mitochondrial dysfunction and tested in mitochondria isolated from rat brain11,24,34 and heart35; however, no studies have been performed with RPE systems. To demonstrate the involvement of mitochondrial dysfunction in acrolein toxicity, we assessed the effects of acrolein on mitochondrial membrane potential (Δψ) by the JC-1 assay. The results showed that in ARPE-19 cells, acrolein at 50 µM or above caused a significant decrease in mitochondrial membrane potential. Pretreatment with LA at 100 µM or higher before exposure to acrolein significantly protected against this acrolein-induced decrease in membrane potential. These results suggest that acrolein acts as a mitochondrial toxicant to cause mitochondrial dysfunction in ARPE cells. The protection of LA against an acrolein-induced decrease in mitochondrial membrane potential in ARPE-19 cells suggests that LA is a potent mitochondrial antioxidant, perhaps by inducing GSH synthesis of enzymes and other phase-2 antioxidant protective enzymes.14,15,20,36
Increased cytosolic Ca2+ as a consequence of mitochondrial dysfunction may play an important role in the development of AMD because gene expression can be changed due to increasing cytosolic Ca2+, and these gene expression changes contribute to some of the manifestations in AMD, such as RPE cell migration, angiogenesis, and lipid deposition.37 Acrolein at 50 µM increased intracellular Ca2+ significantly compared with control and a pretreatment with 100 and 300 µM LA before acrolein protected the acrolein-induced decrease in intracellular Ca2+.
Decreased activity of the inner membrane complexes is another index of oxidative mitochondrial dysfunction. We measured the effects of acrolein treatment on mitochondrial electron transfer chain complex I, II, and III, and found that acrolein caused significant decreases in complex I, II, and III. Pretreatment with LA effectively protected ARPE cells from acrolein-induced damage to these mitochondrial enzymes. These results, together with the intracellular Ca changes, support the involvement of mitochondrial dysfunction in acrolein toxicity due to oxidative stress. Because smoking components cause damage to the choroid and Bruch’s membrane, then RPE, it is possible that the direct RPE toxicity could be further amplified by their effects on choroid/Bruch’s membrane during the development of AMD.
The natural endogenous mitochondrial form of LA is R-LA, but synthetic LA is an R,S mixture (50% R/50% S), which is used for dietary supplements. By comparing their protective effects on acrolein-induced decrease in cell viability in ARPE-19 cells, we found that the protective effects of R-LA and S-LA are similar, but the R,S-LA showed a weaker protection than R- or S-LA. These results are consistent with that obtained by Wolz and Krieglstein38 in primary cultures of neurons from chick embryo telencephalons, in an in vivo study in rats, with subcutaneous injection, and also in a HT22 mouse neuronal cell line,39 but different from that in an ex vivo study with isolated rat hepatocytes.40
In summary, the present study demonstrated that acrolein, one major component in the gas phase of cigarette smoking, is an oxidant and mitochondrial toxicant in RPE and provided strong evidence for the role of mitochondrial dysfunction in RPE oxidative damage. The protection effects of LA suggest that administering mitochondria-targeted nutrients may be an effective strategy for reducing or preventing chronic oxidant-induced RPE degeneration in vivo from a variety of sources including cigarette smoke.
Acknowledgments
The authors thank Ludmila Voloboueva and Arvydas Maminishkis for help with the human fetal RPE cell culture, Nancy Philp for providing ARPR19 cells, and Carla Shultz for technical assistance with cell culture.
Supported by National Eye Institute Grant EY0160101, Macular Degeneration Research (MDR) Grant 2005-038, and Chinese Academy of Sciences Grant 05PG14104. LJ was a visiting scholar from the School of Public Health, China Medical University, Shenyang, China. LS is a visiting graduate student from the State Key Laboratory of Bioreactor Engineering, East China University of Science and Technology, Shanghai, China.
Footnotes
Disclosure: L. Jia, None; Z. Liu, None; L. Sun, None; S.S. Miller, None; B.N. Ames, None; C.W. Cotman, None; J. Liu, None
References
- 1.Thornton J, Edwards R, Mitchell P, Harrison RA, Buchan I, Kelly SP. Smoking and age-related macular degeneration: a review of association. Eye. 2005;19:935–944. doi: 10.1038/sj.eye.6701978. [DOI] [PubMed] [Google Scholar]
- 2.Khan JC, Thurlby DA, Shahid H, et al. Smoking and age related macular degeneration: the number of pack years of cigarette smoking is a major determinant of risk for both geographic atrophy and choroidal neovascularisation. Br J Ophthalmol. 2006;90:75–80. doi: 10.1136/bjo.2005.073643. [DOI] [PMC free article] [PubMed] [Google Scholar]
- 3.Tomany SC, Wang JJ, Van Leeuwen R, et al. Risk factors for incident age-related macular degeneration: pooled findings from 3 continents. Ophthalmology. 2004;111:1280–1287. doi: 10.1016/j.ophtha.2003.11.010. [DOI] [PubMed] [Google Scholar]
- 4.Evans JR, Fletcher AE, Wormald RP. 28,000 Cases of age related macular degeneration causing visual loss in people aged 75 years and above in the United Kingdom may be attributable to smoking. Br J Ophthalmol. 2005;89:550–553. doi: 10.1136/bjo.2004.049726. [DOI] [PMC free article] [PubMed] [Google Scholar]
- 5.Clemons TE, Milton RC, Klein R, Seddon JM, Ferris FL., 3rd Risk factors for the incidence of advanced age-related macular degeneration in the Age-Related Eye Disease Study (AREDS). AREDS report no. 19. Ophthalmology. 2005;112:533–539. doi: 10.1016/j.ophtha.2004.10.047. [DOI] [PMC free article] [PubMed] [Google Scholar]
- 6.Lykkesfeldt J, Christen S, Wallock LM, Chang HH, Jacob RA, Ames BN. Ascorbate is depleted by smoking and repleted by moderate supplementation: a study in male smokers and nonsmokers with matched dietary antioxidant intakes. Am J Clin Nutr. 2000;71:530–536. doi: 10.1093/ajcn/71.2.530. [DOI] [PubMed] [Google Scholar]
- 7.O’Neill CA, Halliwell B, van der Vliet A, et al. Aldehyde-induced protein modifications in human plasma: protection by glutathione and dihydrolipoic acid. J Lab Clin Med. 1994;124:359–370. [PubMed] [Google Scholar]
- 8.Cross CE, O’Neill CA, Reznick AZ, et al. Cigarette smoke oxidation of human plasma constituents. Ann NY Acad Sci. 1993;686:72–89. doi: 10.1111/j.1749-6632.1993.tb39157.x. discussion 89-90. [DOI] [PubMed] [Google Scholar]
- 9.Nazaroff WW, Singer BC. Inhalation of hazardous air pollutants from environmental tobacco smoke in US residences. J Expo Anal Environ Epidemiol. 2004;14 suppl 1:S71–S77. doi: 10.1038/sj.jea.7500361. [DOI] [PubMed] [Google Scholar]
- 10.Esterbauer H, Schaur RJ, Zollner H. Chemistry and biochemistry of 4-hydroxynonenal, malonaldehyde and related aldehydes. Free Radic Biol Med. 1991;11:81–128. doi: 10.1016/0891-5849(91)90192-6. [DOI] [PubMed] [Google Scholar]
- 11.Nguyen E, Picklo MJ., Sr Inhibition of succinic semialdehyde dehydrogenase activity by alkenal products of lipid peroxidation. Biochim Biophys Acta. 2003;1637:107–112. doi: 10.1016/s0925-4439(02)00220-x. [DOI] [PubMed] [Google Scholar]
- 12.Eiserich JP, van der Vliet A, Handelman GJ, Halliwell B, Cross CE. Dietary antioxidants and cigarette smoke-induced biomolecular damage: a complex interaction. Am J Clin Nutr. 1995;62 suppl 6:1490S–1500S. doi: 10.1093/ajcn/62.6.1490S. [DOI] [PubMed] [Google Scholar]
- 13.Feher J, Kovacs I, Artico M, et al. Mitochondrial alterations of retinal pigment epithelium in age-related macular degeneration. Neurobiol Aging. 2006;27:983–293. doi: 10.1016/j.neurobiolaging.2005.05.012. [DOI] [PubMed] [Google Scholar]
- 14.Suh JH, Shenvi SV, Dixon BM, et al. Decline in transcriptional activity of Nrf2 causes age-related loss of glutathione synthesis, which is reversible with lipoic acid. Proc Natl Acad Sci. USA. 2004;101:3381–3386. doi: 10.1073/pnas.0400282101. [DOI] [PMC free article] [PubMed] [Google Scholar]
- 15.Suh JH, Wang H, Liu RM, Liu J, Hagen TM. (R)-alpha-lipoic acid reverses the age-related loss in GSH redox status in post-mitotic tissues: evidence for increased cysteine requirement for GSH synthesis. Arch Biochem Biophys. 2004;423:126–135. doi: 10.1016/j.abb.2003.12.020. [DOI] [PMC free article] [PubMed] [Google Scholar]
- 16.Maminishkis A, Chen S, Jalickee S, et al. Confluent monolayers of cultured human fetal retinal pigment epithelium (hfRPE) exhibit morphology and physiology of native tissue. Invest Ophthalmol Vis Sci. 2006;47:3612–3624. doi: 10.1167/iovs.05-1622. [DOI] [PMC free article] [PubMed] [Google Scholar]
- 17.Packer L, Roy S, Sen CK. Alpha-lipoic acid: a metabolic antioxidant and potential redox modulator of transcription. Adv Pharmacol. 1997;38:79–101. doi: 10.1016/s1054-3589(08)60980-1. [DOI] [PubMed] [Google Scholar]
- 18.Liu J, Ames BN. Reducing mitochondrial decay with mitochondrial nutrients to delay and treat cognitive dysfunction, Alzheimer’s disease, and Parkinson’s disease. Nutr Neurosci. 2005;8:67–89. doi: 10.1080/10284150500047161. [DOI] [PubMed] [Google Scholar]
- 19.Philp NJ, Wang D, Yoon H, Hjelmeland LM. Polarized expression of monocarboxylate transporters in human retinal pigment epithelium and ARPE-19 cells. Invest Ophthalmol Vis Sci. 2003;44:1716–1721. doi: 10.1167/iovs.02-0287. [DOI] [PubMed] [Google Scholar]
- 20.Voloboueva LA, Liu J, Suh JH, Ames BN, Miller SS. (R)-alpha-lipoic acid protects retinal pigment epithelial cells from oxidative damage. Invest Ophthalmol Vis Sci. 2005;46:4302–4310. doi: 10.1167/iovs.04-1098. [DOI] [PMC free article] [PubMed] [Google Scholar]
- 21.Smiley ST, Reers M, Mottola-Hartshorn C, et al. Intracellular heterogeneity in mitochondrial membrane potentials revealed by a J-aggregate-forming lipophilic cation JC-1. Proc Natl Acad Sci USA. 1991;88:3671–3675. doi: 10.1073/pnas.88.9.3671. [DOI] [PMC free article] [PubMed] [Google Scholar]
- 22.LeBel CP, Ischiropoulos H, Bondy SC. Evaluation of the probe 2′,7′-dichlorofluorescin as an indicator of reactive oxygen species formation and oxidative stress. Chem Res Toxicol. 1992;5:227–231. doi: 10.1021/tx00026a012. [DOI] [PubMed] [Google Scholar]
- 23.Humphries KM, Yoo Y, Szweda LI. Inhibition of NADH-linked mitochondrial respiration by 4-hydroxy-2-nonenal. Biochemistry. 1998;37:552–557. doi: 10.1021/bi971958i. [DOI] [PubMed] [Google Scholar]
- 24.Picklo MJ, Montine TJ. Acrolein inhibits respiration in isolated brain mitochondria. Biochim Biophys Acta. 2001;1535:145–152. doi: 10.1016/s0925-4439(00)00093-4. [DOI] [PubMed] [Google Scholar]
- 25.Grafstrom RC, Dypbukt JM, Willey JC, et al. Pathobiological effects of acrolein in cultured human bronchial epithelial cells. Cancer Res. 1988;48:1717–1721. [PubMed] [Google Scholar]
- 26.Uchida K, Kanematsu M, Morimitsu Y, Osawa T, Noguchi N, Niki E. Acrolein is a product of lipid peroxidation reaction: formation of free acrolein and its conjugate with lysine residues in oxidized low density lipoproteins. J Biol Chem. 1998;273:16058–16066. doi: 10.1074/jbc.273.26.16058. [DOI] [PubMed] [Google Scholar]
- 27.Dunn KC, Aotaki-Keen AE, Putkey FR, Hjelmeland LM. ARPE-19, a human retinal pigment epithelial cell line with differentiated properties. Exp Eye Res. 1996;62:155–169. doi: 10.1006/exer.1996.0020. [DOI] [PubMed] [Google Scholar]
- 28.Lu L, Hackett SF, Mincey A, Lai H, Campochiaro PA. Effects of different types of oxidative stress in RPE cells. J Cell Physiol. 2006;206:119–125. doi: 10.1002/jcp.20439. [DOI] [PubMed] [Google Scholar]
- 29.Luo J, Shi R. Acrolein induces axolemmal disruption, oxidative stress, and mitochondrial impairment in spinal cord tissue. Neurochem Int. 2004;44:475–486. doi: 10.1016/j.neuint.2003.09.006. [DOI] [PubMed] [Google Scholar]
- 30.Adams JD, Jr, Klaidman LK. Acrolein-induced oxygen radical formation. Free Radic Biol Med. 1993;15:187–193. doi: 10.1016/0891-5849(93)90058-3. [DOI] [PubMed] [Google Scholar]
- 31.Espinosa-Heidmann DG, Suner IJ, Catanuto P, et al. Cigarette smoke-related oxidants and the development of sub-RPE deposits in an experimental animal model of dry AMD. Invest Ophthalmol Vis Sci. 2006;47:729–737. doi: 10.1167/iovs.05-0719. [DOI] [PubMed] [Google Scholar]
- 32.Gao X, Talalay P. Induction of phase 2 genes by sulforaphane protects retinal pigment epithelial cells against photooxidative damage. Proc Natl Acad Sci USA. 2004;101:10446–10451. doi: 10.1073/pnas.0403886101. [DOI] [PMC free article] [PubMed] [Google Scholar]
- 33.Shigenaga MK, Hagen TM, Ames BN. Oxidative damage and mitochondrial decay in aging. Proc Natl Acad Sci USA. 1994;91:10771–10778. doi: 10.1073/pnas.91.23.10771. [DOI] [PMC free article] [PubMed] [Google Scholar]
- 34.Luo J, Shi R. Acrolein induces oxidative stress in brain mitochondria. Neurochem Int. 2005;46:243–252. doi: 10.1016/j.neuint.2004.09.001. [DOI] [PubMed] [Google Scholar]
- 35.Biagini RE, Toraason MA, Lynch DW, Winston GW. Inhibition of rat heart mitochondrial electron transport in vitro: implications for the cardiotoxic action of allylamine or its primary metabolite, acrolein. Toxicology. 1990;62:95–106. doi: 10.1016/0300-483x(90)90034-e. [DOI] [PubMed] [Google Scholar]
- 36.Satoh T, Okamoto SI, Cui J, et al. Activation of the Keap1/Nrf2 pathway for neuroprotection by electrophilic [correction of electrophillic] phase II inducers. Proc Natl Acad Sci USA. 2006;103:768–773. doi: 10.1073/pnas.0505723102. [DOI] [PMC free article] [PubMed] [Google Scholar]
- 37.Miceli MV, Jazwinski SM. Nuclear gene expression changes due to mitochondrial dysfunction in ARPE-19 cells: implications for age-related macular degeneration. Invest Ophthalmol Vis Sci. 2005;46:1765–1773. doi: 10.1167/iovs.04-1327. [DOI] [PubMed] [Google Scholar]
- 38.Wolz P, Krieglsteinc J. Neuroprotective effects of alpha-lipoic acid and its enantiomers demonstrated in rodent models of focal cerebral ischemia. Neuropharmacology. 1996;35:369–375. doi: 10.1016/0028-3908(95)00172-7. [DOI] [PubMed] [Google Scholar]
- 39.Liu J, Atamna H, Kuratsune H, Ames BN. Delaying brain mitochondrial decay and aging with mitochondrial antioxidants and metabolites. Ann New York Acad Sci. 2002;959:133–166. doi: 10.1111/j.1749-6632.2002.tb02090.x. [DOI] [PubMed] [Google Scholar]
- 40.Hagen TM, Vinarsky V, Wehr CM, Ames BN. (R)-alpha-lipoic acid reverses the age-associated increase in susceptibility of hepatocytes to tert-butylhydroperoxide both in vitro and in vivo. Antioxid Redox Signal. 2000;2:473–483. doi: 10.1089/15230860050192251. [DOI] [PubMed] [Google Scholar]


