

Abstract
Genotyping errors that are undetected in genome-wide association studies using single nucleotide polymorphisms (SNPs) may degrade the likelihood of detecting true positive associations. To estimate the frequency of genotyping errors and assess the reproducibility of genotype calls, we analyzed two sets of duplicate data, one dataset containing twenty blind duplicates and another dataset containing twenty-eight non-random duplicates, from a genome-wide association study using Affymetrix GeneChip® 100K Human Mapping Arrays. For the twenty blind duplicates the overall agreement in genotyping calls as measured with the Kappa statistics, was 0.997, with a discordancy rate of 0.27%. For the twenty-eight nonrandom duplicates, the overall agreement was lower, 0.95, with a higher discordancy rate of 4.53%. The accuracy and probability of concordancy were inversely related to the genotyping uncertainty score, i.e., as the genotyping uncertainty score increased, the concordancy and probability of concordant calls decreased. Lowering of the uncertainty score threshold for rejection of genotype calls from the Affymetrix recommended value of 0.25 to 0.20 resulted in an increased predicted accuracy from 92.6% to 95% with a slight increase in the “No Call” rate from 1.81% to 2.33%. Hence, we suggest using a lower uncertainty score threshold, say 0.20, which will result in higher accuracy in calls at a modest decrease in the call rate.
Keywords: duplicates, genetic association studies, genotyping accuracy, genotyping error, genotype uncertainty score
1. Introduction
Genotyping of single nucleotide polymorphisms (SNPs) is becoming increasingly affordable and efficient and, hence, SNPs are being used as genetic markers in genetic linkage and association studies (Collins et al., 1997). An error in genotyping occurs when the observed (“called”) genotype of an individual is different from the true unknown genotype (Bonin et al., 2004). Random genotyping errors can lead to loss of power to determine genetic associations, by biasing results towards the null hypothesis (Gordon et al., 2002; Mote and Anderson, 1965). Genotyping errors are less likely to cause false-positive results since genotyping errors and missing data should affect cases and controls similarly/equally (Hirschhorn and Daly, 2005). Simulation studies show that the effect of genotype errors on linkage disequilibrium analysis can be serious even if the error rate is low (< 3%) (Akey et al., 2001). In most studies, the called genotype is taken to be the true or correct genotype when fitting a statistical model to assess genetic associations. Methods to incorporate genotype error into the statistical association analysis can be applied in large scale whole–genome association analysis with many thousands of SNPs (Gordon and Ott, 2001; Gordon et al., 2004; Gordon et al., 2007; Hao and Wang, 2004; Rice and Holmans, 2003; Sobel et al., 2002; Tintle et al., 2007), where genotyping errors may be more pronounced than in candidate gene association studies. In addition, erroneous genotype calls can result in possible bias when samples with a particular genotypes are more often misclassified or result in a no call for the genotype, as is seen often with heterozygotes (Hirschhorn and Daly, 2005; Miller et al., 2002).
A possible difficulty arises in case-control studies when the cases and controls are ascertained at different times, such that DNA processing may not be similar between cases and controls with differential misclassification errors (Rebbeck et al., 2004). To assess genotyping errors, a standard laboratory practice would be to genotype blind duplicate samples to assess error rates and reproducibility of genotype calls. Pompanon et al (2005) (Pompanon et al., 2005) outline a number of methods to quantify error rates, some including mean error rate per allele and error rate per reaction.
This paper will illustrate results for reproducibility and accuracy of genotype calls for Affymetrix GeneChip® 100K Human Mapping Array Set based on 20 blind duplicate samples and 28 non random duplicate samples that were re-genotyped (due to low initial call rates) in a pharmacogenomic study of antihypertensive drug response.
2. Materials and Methods
Sample selection
The data for this study were derived from samples collected in the Genetic Epidemiology of Responses to Anti-hypertensives (GERA) study. The initial objective was to determine whether polymorphisms in candidate genes of the renin-angiotensin-aldosterone system predict inter-individual differences in BP response to a thiazide diuretic (i.e.,, hydrochlorothiazide) in hypertensive African-Americans from Atlanta GA (n = 300) and non-Hispanic whites from Rochester MN (n = 300). (Chapman et al., 2002)
We subsequently undertook a genome-wide search for pharmacogenetic loci influencing BP response in the 200 "best" responders and the 200 "worst" responders (i.e., non-responders) to hydrochlorothiazide. "Good" and "bad" responders to diuretic therapy were identified from opposite tails of the respective ethnic-and-gender specific distributions of diastolic BP response. Before selecting the best and worst responders, the ethnic-and-gender specific distributions of diastolic BP response were adjusted to remove variation attributable to differences in age and pretreatment level of diastolic BP(Chapman, et al., 2002).
Between February, 2004 and December, 2005 genomic DNA samples from 194 African-Americans and 195 non-Hispanic whites were successfully genotyped using the Affymetrix GeneChip® Human Mapping 100K Array Set in collaboration with the Genotyping Shared Resource facility at the Mayo Clinic, Rochester MN. In the course of this effort, 28 samples were re-genotyped because of low call rates on an initial run, and 20 "blind duplicate" samples (10 African-Americans, 10 European Americans) were re-genotyped by completing the entire assay on two separate occasions with the laboratory personnel blinded to the identity of the DNA source. This study design of having duplicates allows assessment of random genotyping errors.
Genotyping
Genotyping was performed using the GeneChip® Human Mapping 50K Xba1 array and the 50K HindIII array following Affymetrix’s recommendations. Genomic DNA controls provided by the manufacturer were used as a routine experimental positive control and for troubleshooting. In addition, several quality control parameters were routinely monitored to reduce the assay failure rate. Specifically, after PCR was performed, we required amplification of fragments up to 2 kb to be observed for samples to be hybridized to arrays.
The probe arrays were scanned after the staining and washing protocols were completed. Raw data were acquired from the scanner using the GCOS software (.dat and .cel files) and transferred to the GeneChip® Genotyping Analysis Software (GTYPE) for generation the SNP genotype calls (.chp file) and the uncertainty score for each SNP genotype call. Each SNP is represented on the arrays by 40 probes organized into ten quartets consisting of perfect-match and mismatch pairs for both alleles. Using a model-based genotyping algorithm motivated by the work of Cutler and colleagues (Cutler et al., 2001; Di et al., 2005), the DM algorithm calculates the log-likelihood of the possible genotype models (homozygote A or B, heterozygote AB, and null (i.e., "no call") according to hybridization intensity patterns observed in the quartets. For each quartet and model, log-likelihood ratios are determined by comparing the log-likelihood of one model to the highest log-likelihood of the other three models.
The Wilcoxon signed rank test is applied to the log-likelihood ratios of all ten quartets to compute uncertainty scores (i.e., p-value) for each model and the model with the most significant score is called as the genotype. The uncertainty score provides a statistical assessment of call reliability. Imposing uncertainty score cutoffs filters out potentially erroneous calls as "no-calls." Unlike the classification-based algorithm previously implemented, (Liu et al., 2003) the DM-based algorithm does not require prior training and enables accurate scoring of SNPs with low (<5%) minor allele frequency (MAF), for which homozygotes for the minor allele may not appear during training.
Relationship between discordancy of call and uncertainty score
Even within the range of acceptable uncertainty scores, i.e., those below the threshold, one might hypothesize that the smaller the uncertainty score, the more reliable the resulting genotype call. Thus, one might expect a relationship between the pair of uncertainty scores and the likelihood that two replicate genotype calls would agree. To investigate the relationship between concordancy in genotype calls and the corresponding uncertainty scores, logistic regression models were fit with discordancy in genotype calls (yes/no) being the dependent variable. Analyses were completed with log of the uncertainty scores for the 1st and 2nd genotype calls as 2 predictor variables, and with fixed subject effects (in addition) included or excluded from the models. That is, for a model with the log of the uncertainty scores and fixed subject effects, the model fit was log represents the probability of discordancy for SNP j on subject i , N is the number of subjects,αi represents the effect for subject i, and S1ij and S2ij are the uncertainty score of the 1st and 2nd genotype calls for SNP j on subject i, respectively.
Latent Variable Model for relationship between discordancy and uncertainty score
In addition to fitting logistic regression models to investigate the relationship between uncertainty score of the genotype calls and the probability of discordancy, the probability of discordancy between genotype calls was modeled in terms of the probabilities that each call is correct, which in turn was modeled as a logistic function of the call uncertainty score. In general, duplicate samples directly capture genotyping consistency rather than accuracy. Therefore, to model accuracy, it was assumed that, in the case of two genotype calls agreeing, both calls were correct. Otherwise, we assumed that one of 2 discordant genotype calls was correct. In short, we always assumed that at least one call was correct. Lastly, the model assumes that the heterozygote-to-homozygote and homozygote-to-heterozygote error rates are equal and the homozygote-to-homozygote error rate is zero. Under these assumption, we can express P(discordancy in calls | at least one call correct) as
Next, the probability of a genotype call being correct was modeled as a logistic function of the uncertainty score of the call,
with the same relationship between correctness of call and uncertainty score between the two replicates/runs (i.e., calls with high uncertainty scores may have higher probability of being incorrect). Combining the model for the probability of discordancy and the model for probability of correctness of call, a likelihood function for the latent variable model is
where p1 = α + β log(S1ij), p2=α + β log(S2ij), N is the number of individuals genotyped, S is the number of SNPs, Cij is 1 if there was a discordancy in calls for SNP j for individual i and 0 if there was a match in calls, and S1ij and S2ij are the uncertainty score of the 1st and 2nd calls for SNP j on subject i, respectively. It should be noted that this model assumes that the SNP genotypes are independent, which in the case of high linkage disequilibrium may not be entirely appropriate. The likelihood function L(α, β | X) can be maximized in terms of α and β to find estimates for the parameters α and β. This latent variable model leads to further insight into the relationship between the uncertainty score of the calls, probability of the call being correct, and probability of discordance/concordance in two calls for the same SNP. This latent variable model was fit within SAS® version 9.1 using PROC NLP. The NLP procedure in SAS offers a set of optimization techniques for minimizing or maximizing a continuous nonlinear function subject to linear and nonlinear, equality and inequality, and lower and upper bound constraints.
3. Results
To investigate genotype errors and error rates, the two sets of genotype data were analyzed separately, since the reason for re-genotyping of a sample was in one case random and in the other case non-random. Discordancy rates, and thus error rates, were determined for the two sets of data separately, along with relationship of accuracy of calls with the uncertainty score and discordancy of calls.
For the 20 blind duplicates, results for both the Xba1 and HindIII assays and enzyme chips were re-genotyped to get two separate calls for each SNP marker. The overall discordancy rate between two calls was 0.27% with an agreement (Kappa) of 0.997, with an average call rate between the two replicates of 97.8%. Table 1 cross-tabulates the genotype calls for the 1st and 2nd runs. As illustrated in Table 1, the percentage of no calls appears to differ between heterozygote calls and homozygote calls (i.e., 1% of homozygous first calls are no calls for second call, 4.9% of heterozygous first calls are no calls for second call, p-value < 0.00001. Similar results where also seen by Tintle et al (Tintle et al., 2005).
Table 1.
Reproducibility of calls for blind duplicates. The table presents the genotype call for the first replicate verses the genotype call for the second replicate for the 20 blind duplicates.
| 2nd Call | |||||
|---|---|---|---|---|---|
| 1st Call | AA | AB | BB | No Call | Total |
| AA | 818093 | 1266 | 7 | 7146 | 826512 |
| 35.20% | 0.05% | 0.00% | 0.31% | 35.56% | |
| AB | 2013 | 596894 | 1567 | 31370 | 631844 |
| 0.09% | 25.68% | 0.07% | 1.35% | 27.19% | |
| BB | 16 | 1445 | 812433 | 9257 | 823151 |
| 0.00% | 0.06% | 34.96% | 0.40% | 35.42% | |
| No Call | 4701 | 20555 | 5023 | 12294 | 42573 |
| 0.20% | 0.88% | 0.22% | 0.53% | 1.83% | |
| Total | 824823 | 620160 | 819030 | 60067 | 234080 |
| 35.49% | 26.68% | 35.24% | 2.58% | 100.00% | |
For the 28 nonrandom duplicates (28 individuals with either the Xba1 enzyme chip, HindIII enzyme chip or both), in which the genotyping was redone due to low initial call rates, the overall discordancy rate between two calls was 4.53%, with agreement, measured by a weighted Kappa statistic, of 0.95. The average call rate, across the two replicates, for the nonrandom duplicates was 91.6%. Table 2 shows the agreement between the first and second calls. The percent of homozygote and heterozygote calls was similar between the 1st and 2nd calls, with 0.07% and 0.08% of individuals switching between the type of homozygote from one call to another. With a homozygote-to-homozygote genotype error the most costly error in terms of loss of power for genetic association analyses, it is important that this error rate is small, which was observed in our duplicates(Ahn et al., 2007; Kang, Finch et al., 2004; Kang, Gordon et al., 2004). Lastly, the percent of no calls was lower for the second replicate than the first (3.22% 10 verses 13.65%). This is not surprising, since these chips were selected to be re-genotyped due to low initial call rates. Based on the results presented in Table 1 and Table 2, along with the work of Tintle et al (Tintle, et al., 2005), that the assumed genotyping error model, in which we assumed the probability of homozygote-to-homozygote error is practically 0 and the P(observed heterozygote genotype call | true homozygous genotype) is equal to P(observed homozygous genotype call | true heterozygous genotype), looks reasonable.
Table 2.
Reproducibility of calls for nonrandom duplicates. The table presents the genotype call for the first replicate verses the genotype call for the second replicate for the 28 non random duplicates.
| 2nd Call | |||||
|---|---|---|---|---|---|
| 1st Call | AA | AB | BB | No Call | Total |
| AA | 557600 | 16207 | 1213 | 6292 | 581312 |
| 31.93% | 0.93% | 0.07% | 0.36% | 33.28% | |
| AB | 16839 | 311247 | 17573 | 10852 | 356511 |
| 0.96% | 17.82% | 1.01% | 0.62% | 20.41% | |
| BB | 1013 | 14595 | 548147 | 6444 | 570199 |
| 0.06% | 0.84% | 31.39% | 0.37% | 32.65% | |
| No Call | 42269 | 115619 | 47919 | 32663 | 238470 |
| 2.42% | 6.62% | 2.74% | 1.87% | 13.65% | |
| Total | 617721 | 457668 | 614852 | 56251 | 1746492 |
| 35.37% | 26.20% | 35.20% | 3.22% | 100.00% | |
Very high discordancy rates in calls between the first and second replicates were observed in 3 subjects: (subject e000211 had discordancy rate of 37.2%, subject e000106 had discordancy rate of 19.6%, and subject e000014 had discordancy rate of 11.4%). Subject e000211 had both the Xba1 enzyme and HindIII enzyme chips re-analyzed with similar discordancy rates between the two chips (35.4% verses 39.1%). In addition to having higher discordancy rates, as compared to the other 25 individuals, these three individuals had an agreement of only 0.6785, along with having a higher percent of switching between type of homozygote (0.46% and 0.55%). We were unable to determine the reason for the poor performance of these three samples and completed the analysis with these three subjects removed. When these three samples were excluded, the overall discordancy drops from 4.53% to 1.17% with an agreement of 0.9873.
We investigated visually the relationship between error (i.e., discordancy between the two calls) and uncertainty score of the call for the 20 blind duplicates, in addition to modeling the probability of discordancy as a function of uncertainty scores of the calls. In doing so, we only included observations in which there was a call for both replicates (i.e., “no calls” were excluded). Figure 1A shows the relationship between the average of the maximum uncertainty score for the two calls against discordancy percentage for each of the 20 randomly selected individuals. Figure 1A illustrates that genotype uncertainty score increased as a function of the percentage of discordant genotype calls.
Figure 1.
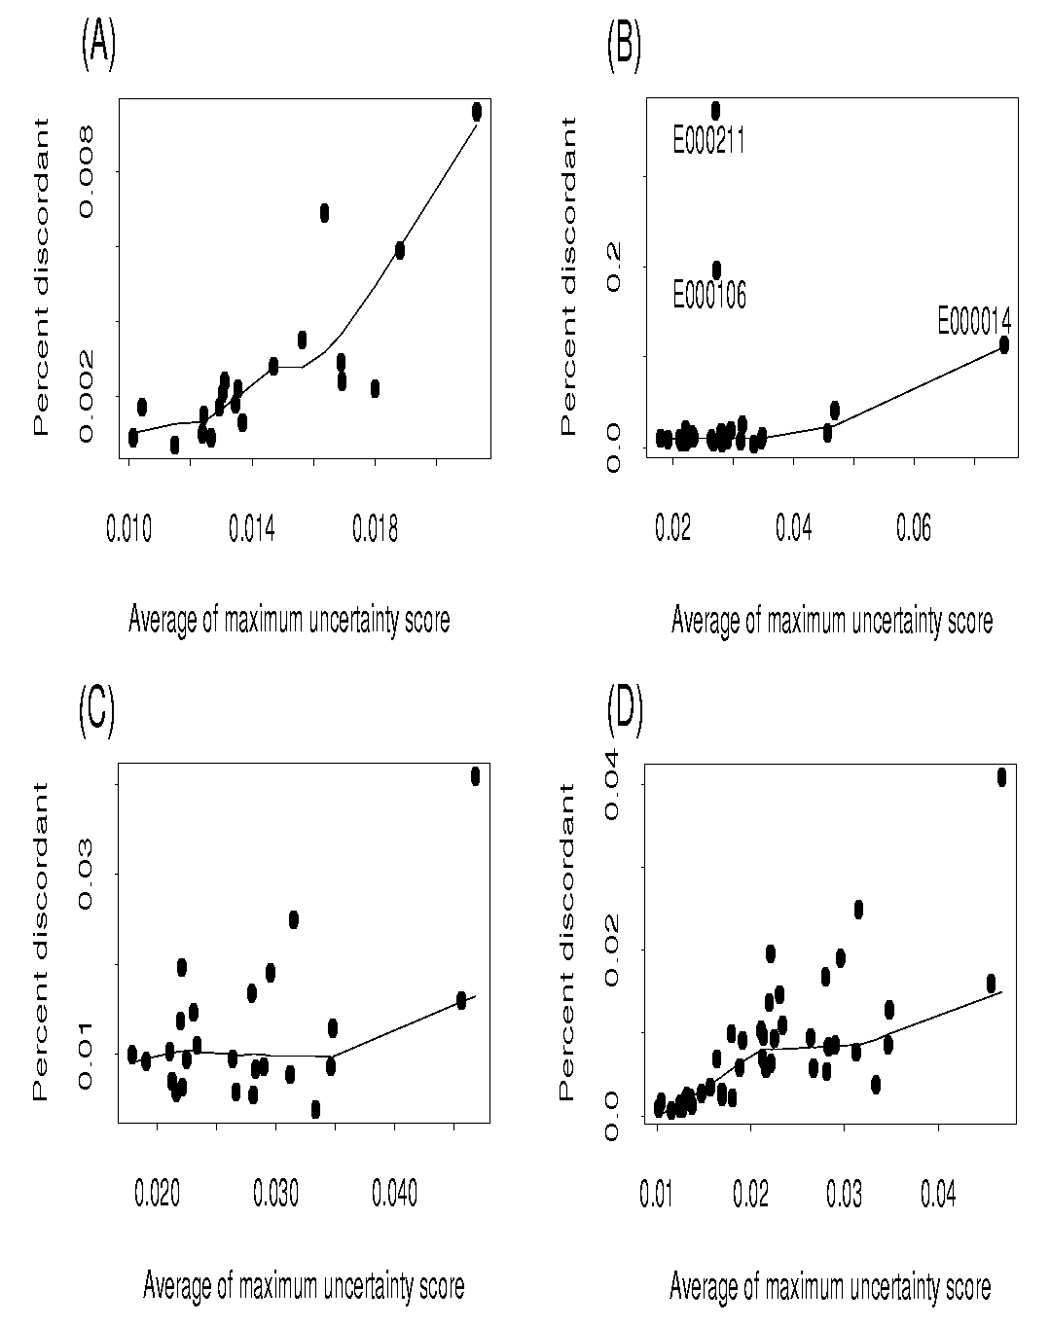
Percent discordant versus average of the maximum uncertainty score of call; (A) Blind duplicates (B) Nonrandom duplicates (C) Nonrandom duplicates excluding E000211, E000106 and E000014 (D) Blind duplicates and nonrandom duplicates excluding E000211, E000106 and E000014
Logistic regression models for the 20 blind duplicates were also fit showing that the uncertainty score of the 1st and 2nd calls, on the log scale, were both significant predictors of discordancy of the calls. The regression equation for predicting the probability of mismatch for SNP genotype j on subject i, pij, including the uncertainty scores for the two genotype calls (S1ij and S2ij) was estimated to be logit(pij) = 0.1181 + 0.3869*log(S1ij) + 0.8730*log(S2ij) with both uncertainty scores making significant contributions to predicting probability of mismatch (p-value < 0.0001). Figure 2 shows the predicted probability of discordancy as a function of log(S1ij) = log(S2ij) for the 20 blind duplicates.
Figure 2.

Predicted Probability of discordancy from logistic regression where the uncertainty score of 1st and 2nd calls are equal for the 28 nonrandom duplicates, the 28 nonrandom duplicates minus e000014, e000211 and e000106, and the 20 blind duplicates. The vertical line indicates an uncertainty score of 0.25.
A similar logistic regression model was fit in which subject-specific fixed effects were also included, in which both uncertainty scores (p-value < 0.0001) and all subject effects were significant (p-value < 0.05), with the exception of blind duplicates 3, 9, 11 and 16. The 95% confidence interval for the odds ratio for effect of log(S1ij) and log(S2ij) from model with subject effects were (1.54, 1.59) and (2.22, 2.31), respectively.
As with the 20 blind duplicates, we evaluated the relationship between uncertainty score of the call and the probability of discordancy for the 28 nonrandom duplicates. Figure 1B shows the relationship between percent of discordant calls and average maximum uncertainty score for the two calls in the 28 nonrandom duplicates. Most of the 28 individuals had average maximum uncertainty scores of their calls less than 0.035, with the average uncertainty score for an individual’s calls being much lower for the second replicate. This was expected because chip(s) were rerun to correct the low initial call rates, and thus high uncertainty scores (uncertainty score > 0.25 resulted in a no call for the genotype). Note in Figure 1B that two individuals (e000211 and e000106) had high discordancy rates despite low average maximum uncertainty scores.
Figure 1C is a plot excluding the three outliers for subject e000211, e000106 and e000014. Combining the 20 blind duplicates and the 28 nonrandom duplicates (excluding the three subjects e000211, e000106 and e000014) into a single figure (Figure 1D), the increase in percent of discordant calls with uncertainty score is more pronounced. To further investigate the relationship between discordant calls and uncertainty score for the 28 nonrandom duplicates, a logistic regression model was fit including both the uncertainty score for the 1st and 2nd genotype calls: logit(pij) = − 0.6564+0.349*log(S1ij) + 0.1096*log(S2ij), with pij representing the probability of mismatch for SNP genotype j on subject i and S1ij and S2ij representing the uncertainty scores for the 1st and 2nd genotype calls for person i, SNP j. If the three individuals with high discordancy rates are removed from the analysis, the estimated logistic regression function is logit(pij) = −2.487+0.388*log(S1ij) + 0.119*log(S2ij). The estimate of the effect of the uncertainty scores on the probability of mismatch was observed to be much smaller for the nonrandom duplicates as compared to the blind duplicates. This discrepancy is somewhat expected, in that, for the nonrandom duplicates the probability of mismatch may be attributed to other factors (sample processing issues, DNA quality, etc.) as they had low call rates on the first round of genotyping. Figure 2 shows the predicted probability of discordancy as a function of uncertainty score of the calls on the log scale for the 28 duplicates excluding the individual e000211, e000106 and e000014 from the analysis. To account for possible difference between subjects, we also included fixed subject effects in the logistic regression model. All predictors in this latter model were statistically significant (p-values < 0.0001).
In addition to logistic modeling to assess the relationship between discordancy of genotyping calls and confidence score, we fit the latent variable model that predicts probability of discordancy as a function of correctness of the call and confidence score for both the 28 nonrandom duplicates and the 20 blind duplicates, assuming the same relationship for each of the uncertainty score measures (i.e., same effect for both the first and second uncertainty score). The analysis of blind duplicates shows that for log uncertainty score in calls less than −3 (uncertainty score around 0.05), the predicted probability of error is close to zero. The probability of error was found to be highly significantly associated dependent on the genotype uncertainty score, with a slope estimate of β̂= −1.545, approximate standard error of 0.0153, and a p-value < 0.0001. This estimate was similar to the estimate of β found with the nonrandom duplicate, minus the three outlier subjects (e000014, e000106 and e000211). Hence, if the uncertainty score of the calls was 0.20 (high uncertainty score), the predicted probability of an error would be 13.5%. Figure 3 displays the predicted probability of accuracy based on the latent variable model for the 20 blind duplicates and the 28 nonrandom duplicates. Looking at Figure 3, which displays the predicted probability of accuracy (i.e., probability the call is correct) for various uncertainty scores. As the uncertainty score increases (i.e., less confidence in the genotype call), the probability of accuracy decreases for the blind duplicates. Moreover, there is a high probability of accuracy when the call uncertainty score is less than 0.05 in the blind duplicates.
Figure 3.

Predicted probability of accuracy based on latent variable model fitted to data from the blind duplicates and the nonrandom duplicates with and without removing subject e000014, e000106 and e000211; Call Rates for various uncertainty score thresholds based on the blind duplicates. The horizontal line represents a probability of correct call of 0.95 and the vertical line represents an uncertainty score of 0.25.
In comparison, the latent variable model was fit to the 28 nonrandom duplicates, producing estimates of α and β to be 1.149 and −0.499 and standard errors of 0.01 and 0.002, respectively. When subjects e000014, e000106 and e000211 were excluded from the analyses, the estimates of α and β where α̂= 0.22 (SE = 0.024) and β̂ = − 1.277 (SE = 0.009), which are similar to the estimates found based on the 20 blind duplicates. They were both highly significant with predicted probability of discordancy being large when the uncertainty score for the call is large (i.e., low uncertainty score in the call). Figure 3 illustrates that if the uncertainty score of the call was 0.20 (log uncertainty score of −1.60) the predicted probability of discordancy was 22% based on the model fit to the nonrandom duplicates.
4. Discussion and Conclusions
We studied the reproducibility and error rates for genotypes determined by the Affymetrix GeneChip® 100K Human Mapping Array Set using the Dynamic Modeling Genotyping Algorithm. Overall, we found excellent reproducibility and accuracy for the Affymetrix GeneChip® 100K Human Mapping Array Set based on blind duplicate data collected on 20 individuals. We also observed a relationship between the genotype accuracy and discordance rate and the uncertainty score for the genotype call (i.e., as the uncertainty score increases, the probability of concordance in genotype calls and accuracy decrease). We observed an overall discordancy rate of 4.53% and 0.27% for the 28 nonrandom duplicates and 20 blind duplicates, respectively. When the three extreme discordancy cases are removed from the 28 nonrandom duplicates, the overall discordancy rate is 1.17%, down from 4.53%. In addition to observing the low discordancy (error) rate for the 20 blind duplicates, we observed an overall agreement of 99.7% between the two calls. We also observed that the uncertainty score for the SNPs was significantly associated with the probability of discordancy. This was true, both when each subject’s data were aggregated and used as one observation, but also when this association was examined within individual.
Matsuzaki et al (2004) (Matsuzaki et al., 2004) investigated the reproducibility, accuracy and call rates using the HapMap CEPH trios for 116,204 SNPs genotyped using oligonucleotide arrays with the Dynamic Modeling (DM) algorithm for calling the genotype (Cutler, et al., 2001). The uncertainty score is the p-value produced by the DM algorithm for testing which genotype is more likely to be correct. Matsuzaki et al (Matsuzaki, et al., 2004) reported a genotype concordance rate of 99.76%. A low uncertainty score is indicative of a significant genotype call in which the test for a particular genotype call was highly significant (i.e., low p-value). In addition, they investigated the relationship of the DM call uncertainty score, using various uncertainty score cut-offs (ranging from 0.01 to 1.0), with the reproducibility, Mendelian inheritance and concordance. They found that as the uncertainty score cut-off increased, the reproducibility, inheritance and concordance decreased, while the call rates increased. An uncertainty score cut-off of 0.25 was proposed to provide optimal balance between call rate and reproducibility. Modification of the calling uncertainty score threshold from 0.25 to >0.25 would improve accuracy in the called genotypes but at a cost of a reduced call rate (Figure 3). For the blind duplicates when the threshold was set to 0.25, 0.20, 0.15 and 0.10 the percent of “No Calls” was 1.81%, 2.33%, 2.87% and 4.16%, respectively. Thus, lowering the threshold from 0.25 to 0.15 results in only a modest increase in “No Calls” (1%) and would increase the predicted accuracy from 0.926 to 0.965. To have accuracy of 95%, the score threshold would need to be around 0.20 resulting in 2.33% “No Calls”.
Planned duplicates are a desirable feature of any genome-wide association study and can provide insight into the nature and possible causes for genotyping errors that could otherwise go undetected. Further research in genotype calling algorithms, methods for detecting genotyping errors and methods for incorporating these errors into the statistical analysis are needed for large genome-wide association studies to be successful.
Acknowledgment
This work is supported by U.S. Public Health Services grants R01 HL74735 and R01 HL53330. We would like to thank Prabin Thapa, Jodie Van De Rostyne, Jeremy Palbicki and Zhiying Wang for their help with the genotyping, sample management, and the analysis of the data. We would also like to thank Dr. Ramanath Majumdar for use of 8 Xba1 chips and 1 tube of PCR primer.
Footnotes
Publisher's Disclaimer: This is a PDF file of an unedited manuscript that has been accepted for publication. As a service to our customers we are providing this early version of the manuscript. The manuscript will undergo copyediting, typesetting, and review of the resulting proof before it is published in its final citable form. Please note that during the production process errorsmaybe discovered which could affect the content, and all legal disclaimers that apply to the journal pertain.
References
- Ahn K, Haynes C, Kim W, Fleur RS, Gordon D, Finch SJ. The effects of SNP genotyping errors on the power of the Cochran-Armitage linear trend test for case/control association studies. Ann Hum Genet. 2007;71:249–261. doi: 10.1111/j.1469-1809.2006.00318.x. [DOI] [PubMed] [Google Scholar]
- Akey JM, Zhang K, Xiong M, Doris P, Jin L. The effect that genotyping errors have on the robustness of common linkage-disequilibrium measures. American Journal of Human Genetics. 2001;68:1447–1456. doi: 10.1086/320607. [DOI] [PMC free article] [PubMed] [Google Scholar]
- Bonin A, Bellemain E, Bronken Eidesen P, Pompanon F, Brochmann C, Taberlet P. How to track and assess genotyping errors in population genetics studies. Molecular Ecology. 2004;13:3261–3273. doi: 10.1111/j.1365-294X.2004.02346.x. [DOI] [PubMed] [Google Scholar]
- Chapman AB, Schwartz GL, Boerwinkle E, Turner ST. Predictors of antihypertensive response to a standard dose of hydrochlorothiazide for essential hypertension. Kidney International. 2002;61:1047–1055. doi: 10.1046/j.1523-1755.2002.00200.x. [DOI] [PubMed] [Google Scholar]
- Collins FS, Guyer MS, Charkravarti A. Variations on a theme: cataloging human DNA sequence variation. Science. 1997;278:1580–1581. doi: 10.1126/science.278.5343.1580. [DOI] [PubMed] [Google Scholar]
- Cutler DJ, Zwick ME, Carrasquillo MM, Yohn CT, Tobin KP, Kashuk C, Mathews DJ, Shah NA, Eichler EE, Warrington JA, Chakravarti A. High-throughput variation detection and genotyping using microarrays. Genome Research. 2001;11:1913–1925. doi: 10.1101/gr.197201. [DOI] [PMC free article] [PubMed] [Google Scholar]
- Di X, Matsuzaki H, Webster TA, Hubbell E, Liu G, Dong S, Bartell D, Huang J, Chiles R, Yang G, Shen MM, Kulp D, Kennedy GC, Mei R, Jones KW, Cawley S. Dynamic model based algorithms for screening and genotyping over 100 K SNPs on oligonucleotide microarrays. Bioinformatics. 2005;21:1958–1963. doi: 10.1093/bioinformatics/bti275. [DOI] [PubMed] [Google Scholar]
- Gordon D, Ott J. Assessment and management of single nucleotide polymorphism genotype errors in genetic association analysis. Pac Symp Biocomput. 2001:18–29. doi: 10.1142/9789814447362_0003. [DOI] [PubMed] [Google Scholar]
- Gordon D, Finch SJ, Nothnagel M, Ott J. Power and sample size calculations for case-control genetic association tests when errors are present: application to single nucleotide polymorphisms. Hum Hered. 2002;54:22–33. doi: 10.1159/000066696. [DOI] [PubMed] [Google Scholar]
- Gordon D, Yang Y, Haynes C, Finch SJ, Mendell NR, Brown AM, Haroutunian V. Increasing power for tests of genetic association in the presence of phenotype and/or genotype error by use of double-sampling. Stat Appl Genet Mol Biol. 2004;3 doi: 10.2202/1544-6115.1085. Article26. [DOI] [PubMed] [Google Scholar]
- Gordon D, Haynes C, Yang Y, Kramer PL, Finch SJ. Linear trend tests for case-control genetic association that incorporate random phenotype and genotype misclassification error. Genet Epidemiol. 2007;31:853–870. doi: 10.1002/gepi.20246. [DOI] [PubMed] [Google Scholar]
- Hao K, Wang X. Incorporating individual error rate into association test of unmatched case-control design. Human Heredity. 2004;58:154–163. doi: 10.1159/000083542. [DOI] [PubMed] [Google Scholar]
- Hirschhorn JN, Daly MJ. Genome-wide association studies for common diseases and complex traits. Nature Reviews Genetics. 2005;6:95–108. doi: 10.1038/nrg1521. [DOI] [PubMed] [Google Scholar]
- Kang SJ, Finch SJ, Haynes C, Gordon D. Quantifying the percent increase in minimum sample size for SNP genotyping errors in genetic model-based association studies. Hum Hered. 2004;58:139–144. doi: 10.1159/000083540. [DOI] [PubMed] [Google Scholar]
- Kang SJ, Gordon D, Finch SJ. What SNP genotyping errors are most costly for genetic association studies? Genet Epidemiol. 2004;26:132–141. doi: 10.1002/gepi.10301. [DOI] [PubMed] [Google Scholar]
- Liu WM, Di X, Yang G, Matsuzaki H, Huang J, Mei R, Ryder TB, Webster TA, Dong S, Liu G, Jones KW, Kennedy GC, Kulp D. Algorithms for large-scale genotyping microarrays. Bioinformatics. 2003;19:2397–2403. doi: 10.1093/bioinformatics/btg332. [DOI] [PubMed] [Google Scholar]
- Matsuzaki H, Dong S, Loi H, Di X, Liu G, Hubbell E, Law J, Berntsen T, Chadha M, Hui H, Yang G, Kennedy GC, Webster TA, Cawley S, Walsh PS, Jones KW, Fodor SP, Mei R. Genotyping over 100,000 SNPs on a pair of oligonucleotide arrays.[see comment] Nature Methods. 2004;1:109–111. doi: 10.1038/nmeth718. [DOI] [PubMed] [Google Scholar]
- Miller CR, Joyce P, Waits LP. Assessing allelic dropout and genotype reliability using maximum likelihood. Genetics. 2002;160:357–366. doi: 10.1093/genetics/160.1.357. [DOI] [PMC free article] [PubMed] [Google Scholar]
- Mote VL, Anderson RL. An Investigation of the Effect of Misclassification on the Properties of Chi-2-Tests in the Analysis of Categorical Data. Biometrika. 1965;52:95–109. [PubMed] [Google Scholar]
- Pompanon F, Bonin A, Bellemain E, Taberlet P. Genotyping errors: causes, consequences and solutions. Nature Reviews Genetics. 2005;6:847–859. doi: 10.1038/nrg1707. [DOI] [PubMed] [Google Scholar]
- Rebbeck TR, Ambrosone CB, Bell DA, Chanock SJ, Hayes RB, Kadlubar FF, Thomas DC. SNPs, haplotypes, and cancer: applications in molecular epidemiology. Cancer Epidemiology, Biomarkers & Prevention. 2004;13:681–687. [PubMed] [Google Scholar]
- Rice KM, Holmans P. Allowing for genotyping error in analysis of unmatched case-control studies. Ann Hum Genet. 2003;67:165–174. doi: 10.1046/j.1469-1809.2003.00020.x. [DOI] [PubMed] [Google Scholar]
- Sobel E, Papp JC, Lange K. Detection and integration of genotyping errors in statistical genetics. American Journal of Human Genetics. 2002;70:496–508. doi: 10.1086/338920. [DOI] [PMC free article] [PubMed] [Google Scholar]
- Tintle NL, Ahn K, Mendell NR, Gordon D, Finch SJ. Characteristics of replicated single-nucleotide polymorphism genotypes from COGA: Affymetrix and Center for Inherited Disease Research. BMC Genet. 2005;6S154 Suppl 1 doi: 10.1186/1471-2156-6-S1-S154. [DOI] [PMC free article] [PubMed] [Google Scholar]
- Tintle NL, Gordon D, McMahon FJ, Finch SJ. Using duplicate genotyped data in genetic analyses: testing association and estimating error rates. Stat Appl Genet Mol Biol. 6 doi: 10.2202/1544-6115.1251. Article4. [DOI] [PubMed] [Google Scholar]