

Abstract
We propose here an approach for the analysis of single-molecule trajectories which is based on a comprehensive comparison of an experimental data set with multiple Monte Carlo simulations of the diffusion process. It allows quantitative data analysis, particularly whenever analytical treatment of a model is infeasible. Simulations are performed on a discrete parameter space and compared with the experimental results by a nonparametric statistical test. The method provides a matrix of p-values that assess the probability for having observed the experimental data at each setting of the model parameters. We show the testing approach for three typical situations observed in the cellular plasma membrane: i), free Brownian motion of the tracer, ii), hop diffusion of the tracer in a periodic meshwork of squares, and iii), transient binding of the tracer to slowly diffusing structures. By plotting the p-value as a function of the model parameters, one can easily identify the most consistent parameter settings but also recover mutual dependencies and ambiguities which are difficult to determine by standard fitting routines. Finally, we used the test to reanalyze previous data obtained on the diffusion of the glycosylphosphatidylinositol-protein CD59 in the plasma membrane of the human T24 cell line.
INTRODUCTION
There is increasing interest in a detailed understanding of the structure and dynamics of the cellular plasma membrane (1), particularly upon recognizing its essential role for controlling cellular signaling processes. In recent years a picture emerged which ascribes to the plasma membrane a high degree of organization at very short length scales of tens of nanometers (2–4). Experiments performed on single biomolecules in particular added to this picture, as they provide access to spatial information below the diffraction limit of classical light microscopy (5–10).
A moving biomolecule may experience multiple forces that influence its characteristic motion. In consequence, the path will deviate to a greater or lesser extent from a Brownian trajectory. Deviations from free diffusion may be caused by i), the confinement of the tracer molecule in a periodic meshwork of permeable barriers, resulting in hop diffusion (11); ii), the transient binding of the tracer to an (immobile) plasma membrane structure, yielding short periods of altered—generally reduced—mobility (12,13); iii), periods of active transport via motor proteins (14); iv), direct or indirect anchorage to the cytoskeleton, yielding immobilization or tethered motion of the tracer (15); v), fixed obstacles at high surface density (16); and vi), the partitioning of the tracer to mobile or immobile membrane domains (“rafts”) (17,18).
From the 1980s on, researchers have studied the path of single plasma membrane constituents by specific labeling via particles, which provide signals strong enough to be detectable in a microscope; fluorescent lipoproteins (19), phycobiliproteins (20), quantum dots (21), or 40 nm gold particles (22) have been frequently employed as label. Although the data quality has been astounding and has yielded enormous insights into the organization of the plasma membrane (3), the comparably large size of the labels of tens of nanometers may have affected the tracking results. In one study, residual cross-linking of the diffusing probe was found to reduce the diffusion coefficients (23). Another study reported the alteration of the diffusion behavior from free diffusion to anomalous subdiffusion upon labeling with quantum dots (24). To circumvent such pitfalls, some researchers have switched to less invasive labels such as single dye molecules (9,23,25–29), but at the expense of data quality: single dye images show a lower signal/noise ratio, and the trajectory length is limited by photobleaching to only a few observations.
Although there are multiple mathematical tools available for analyzing long traces obtained from single-particle tracking experiments (30–33), only the most simple methods have so far been applied for analyzing the short tracks of single dye molecules (reviewed in Wieser and Schütz (34)). It is common practice to analyze the mean-square displacement (msd) as a function of the time lag (9,25,29,35) or to study the distribution of displacement steps (27,28,36). However, in both cases a closed analytical theory is available only for the simplest models; extensions to more realistic scenarios that account for complex diffusion processes or include obvious experimental constraints like the effect of tracer movement during illumination are still difficult to tackle.
The aim of this study is to provide a rapid and versatile tool for analysis of single-molecule tracking data. We reasoned that a full analytical description of the suspected diffusion process may not be required to characterize an experimental data set; it may well be sufficient to compare the experimental data with Monte Carlo simulations of the process, which can be performed in most cases in a decent amount of time on a standard personal computer. Our idea is therefore to test the experimental data sample against a comprehensive set of simulated probe distributions based on a parameterized model. Each probe distribution is determined by a voxel in a multidimensional discretized parameter space; the difference between the experimental data set and the Monte Carlo simulation is measured by the p-value, which allows statistical interpretation of the results.
The work is organized in the following way: first, we introduce the method on the simple case of a single species showing pure Brownian motion (Fig. 1 A); second, we describe the analysis of hop diffusion (Fig. 1 B) and apply the method for analysis of experimental data obtained by tracking the glycosylphosphatidylinositol (GPI)-anchored protein CD59 in living T24 cells (25); and third, we describe the analysis of transient binding of a tracer molecule to a slowly diffusing receptor (Fig. 1 C).
FIGURE 1.

Three diffusion models used for evaluating the test. (A) Free diffusion of a tracer molecule in a two-dimensional membrane. (B) Hop diffusion in a periodic meshwork of square corrals with size L. The confinement strength  was varied from
  (free diffusion) to
  (strong confinement). (C) Transient binding of the tracer (solid) to its receptor (light shaded). Upon binding, the mobility changes from DA to DAB.
MONTE CARLO SIMULATIONS
Hop diffusion and free diffusion
Off-lattice random walks were simulated in MATLAB (R2007a, The MathWorks, Natick, MA) on a standard personal computer. #sub substeps with fixed length lsub and random angle were generated, so that  tdel and till denoting the delay between two consecutive frames and the illumination time. The random walk was simulated within an infinite meshwork of periodic squares with size L. lsub was adapted to the domain size by
  We characterized the meshwork by the confinement strength
  Dmacro denoting the reduced mobility over macroscopic timescales.
  specifies free diffusion,
  the confined motion of the tracer in a square domain with impermeable barriers. Whenever the molecule hits a barrier, a number rand is generated at random between 0 and 1 and compared to a predefined escape probability η. If rand <η, the barrier is crossed; if not, the molecule remains at its previous position. For our choice of lsub, we find η to be a function of
  alone. The functionality was determined in a Monte Carlo simulation by calculating the resulting
  for various values of η, yielding a lookup table (Supplementary Material, Fig. S1, Data S1) that was used for our test simulations. Note that the relation deviates slightly from the escape-probability reported for on-lattice simulations (37). Illumination times were accounted for by calculating the average tracer position during the adjusted illumination. Localization errors were included by addition of Gaussian noise of mean zero and standard deviation σxy to every position within the trajectory.
Trajectories are specified by a sequence of positions  with i ranging from 1 to the number of observations of this trajectory. The msds
  were calculated as a function of the time lag
  according to
  with n denoting the difference in the frame index. Note that by taking the average only over nonoverlapping segments of the trajectory we assure that each data set
  contains only independent entries (38), a precondition for application of the test strategy.
Transient binding
In the transient binding model, we treat the interaction of a freely diffusing tracer (mobility DA), which may bind to a slowly mobile receptor, thus reducing its mobility to DAB (Fig. 1 C). Off-lattice random walks were simulated in MATLAB on a standard personal computer. #sub was calculated according to  thereby generating 10 substeps for the shortest time interval out of τoff, τon, tdel. To assign the time course of transitions between the bound and free states of the tracer, a vector was generated of the form
  with every entry denoting the mobility for an individual substep. The substep length lsub is defined by the diffusion constants via
  and was distributed exponentially. The start of the vector was chosen randomly with a probability specified by the bound fraction
  The duration of the individual states was calculated from an exponential distribution with the parameter τoff (τon) for the bound (free) state. Localization errors were included by addition of Gaussian noise of mean zero and standard deviation σxy to every position within the trajectory.
Kolmogorov-Smirnov test
We used the MATLAB function kstest2 for the two-sample Kolmogorov-Smirnov hypothesis test.
RESULTS
Methodology
We introduce our method with the simple scenario of free two-dimensional diffusion (Fig. 1 A). A virtual data set Xfree was simulated to mimic the result of a single-molecule tracking experiment. The diffusion constant was set to D0 = 0.3 μm2/s, and the delay between two observations tdel = 1 ms. The trajectory lengths were distributed exponentially with a mean of 10 observations; a subset of 200 trajectories longer than 5 observations was selected for further analysis. For this introductory example, we neglected any influence of the illumination time, i.e., till = 0 ms. Furthermore, we added a Gaussian distributed localization error of σxy,0 = 20 nm to every position. Fig. 2, A and B, shows a conventional analysis of Xfree: The msd  increases linearly with the time lag tlag according to
  ; the slope specifies the diffusion coefficient D; and the offset on the y axis specifies the localization precision σxy. We also plotted the cumulative distribution function (cdf) of the square displacements r2, which is frequently used for diffusion analysis (27,36). For free Brownian motion, the cdf is given by the monoexponential function
 |
(1) |
For this simple scenario, the exact analytical expressions for both  and cdf are of course known; therefore, standard regression methods can be used to determine the parameters D0 and σxy,0 (34). However, for more general diffusion models this might not be the case. To enable analysis for such cases, we propose here a different approach that is based on comprehensive testing against multiple simulated probe distributions in a parameterized model. The idea of our method is to generate probe data sets Y at different parameter settings using Monte Carlo simulations and compare them with the virtual data set X using a statistical test. The simulations for Y are performed on a discretized parameter space which covers the suspected region of interest. In this introductory example, the parameter pairs (Di,σxy,j) fully specify the required probe data sets Yij.
FIGURE 2.

Conventional analysis of free diffusion. We simulated trajectories with exponentially distributed length (mean 10 observations) and selected a subset of 200 trajectories with more than 5 observations for analysis. We set D0 = 0.3 μm2/s, σxy,0 = 20 nm, till = 0 ms. (A) The msd  is shown as a function of the time lag. Data for tdel = 1 ms (open symbols) and tdel = 10 ms (solid symbols) are included. (B) The cumulative density function cdf(r2) is plotted for tlag = 1 ms. A monoexponential fit according to Eq. 1 is inserted as a dashed line.
For comparison of the two samples X and Y, we propose to employ statistical tests. In general, such two-sample tests are designed to assess whether X and Y are drawn from the same underlying distribution (H0 hypothesis). Multiple two-sample tests have been introduced in the literature (e.g., the Kolmogorov-Smirnov test, the Wilcoxon rank sum test or Mann-Whitney U test, and the Ansari-Bradley test; for comparison see Pappas and DePuy (39)). In general, the Kolmogorov-Smirnov test performs best in cases when no information is available on the underlying distributions. If it can be assumed that the spreads and shape of the distributions are the same, the Wilcoxon rank sum test is more powerful; if the median and shapes are the same, the Ansari-Bradley test is more powerful.
To account for the fact that the distribution functions are unknown, we implemented here the two-sample Kolmogorov-Smirnov test (see the Supplementary Material (Data S1) for a discussion on the two-sample Kolmogorov-Smirnov test). As an output the test yields the p-value, which is a measure of the statistical difference of the two distributions X and Y. The p-value quantifies the extremeness of a randomly drawn sample by specifying the probability of obtaining a sample at least as extreme as the one which was actually observed, assuming that H0 is true. In other words, the distribution of p-values under the null hypothesis is uniform in the interval [0,1]. If we specify a significance level α such that H0 will be accepted for α < p-value and rejected for α > p-value, then α defines the probability of falsely rejecting H0. By calculating the p-value between X and every Yij, we get an estimate of the parameter settings which likely lead to the observed data and of those parameters which would rarely lead to data as extreme as observed.
For this example, we used as virtual data sets X(n) the square displacements r2(n) obtained at different time lags; n = tlag/tdel denotes the time lag in units of frames. To characterize the true null hypothesis, we first tested two data sets X and Y drawn from the same distribution. In particular, we were interested in the stability of the calculated p-values against a rerun of the test with another sample Y. We therefore used a specific sample X(n = 1) containing the square displacements of 200 trajectories, which was tested against different probe samples Y(n = 1) of varying size and calculated the standard deviation (std) of the p-value (Fig. 3 A). std(P) decreases with the increasing size of Y, since the underlying distribution function can be better approximated for large samples. In the following, we used samples Y with size 20-fold or 100-fold larger than X. We also checked the distribution of the p-values, which was indeed uniform on the interval [0,1] (Fig. 3 B).
FIGURE 3.

Characterization of the p-value distribution. For the test data set X, we simulated trajectories with exponentially distributed length (mean 10 observations) and selected a subset of 200 trajectories with more than 5 observations for analysis. Both X and the probe data set Y were simulated at the same parameter settings D0 = 0.3 μm2/s, σxy,0 = 20 nm, till = 0 ms, tdel = 1 ms, n = 1. A shows the dependence of p-value variations on the probe sample size. For this, 1 sample X was tested against 50 different samples Y of a particular size, and the standard deviation of the resulting p-value is plotted as a function of the sample size ratio. (B) The distribution of p-values is uniform on the interval [0,1]. We tested 10,000 samples X against probe samples simulated at the same set point with a 100-fold larger sample size.
For the actual test, we simulated probe samples Yij at parameter settings Di ranging 0–0.6 μm2/s and σxy,j ranging 0–40 nm and tested every combination against the virtual data set X. Fig. 4 A shows a two-dimensional plot of the p-values obtained at the different parameter settings. A significance level α = 5% was chosen for all tests in this study. The gray levels for each plot scale from p-value = 1% to p-value = 100%. The reading and interpretation of the plot goes as follows. In the region with p-value < α, the probability for falsely rejecting H0 is <5% (light regions in the plot); in this parameter regime it is unlikely that the test data set X agrees with the model. In the remaining parameter regions with p-value ≥ α (shaded to solid regions), the test data set would agree with the model. For this test data set, the majority of parameter combinations can be ruled out with a p-value even <10−4. The broad curved region with p-values > 5% indicates the parameter range which would be consistent with the data. Importantly, the parameter pair (D0 = 0.3 μm2/s, σxy,0 = 20 nm) assumed for the test statistics is contained in this region. However, apparently additional alternative interpretations would agree with the data set X: a somewhat lower mobility can be compensated by a larger localization error and vice versa.
FIGURE 4.

Tests for free diffusion, performed at different time lags and delays. We simulated trajectories with exponentially distributed length (mean 10 observations) and selected a subset of 200 trajectories with more than 5 observations for analysis. The set point for X was at the parameter settings D0 = 0.3 μm2/s, σxy,0 = 20 nm, till = 0 ms. Probe data sets Y were simulated in a parameter range D = 0–0.6 μm2/s and σxy = 0–40 nm, with a size of 20,000 trajectories. The plots show the decadic logarithm of the p-values as a function of D and σxy. The α = 5% significance contour is indicated by a thick solid line, the set point by a dotted line. Gray scales were chosen to highlight the p-value range 1%–100%. Additional contours were added for p-values smaller than α (10−2, 10−4, 10−6, 10−8). Data sets simulated for tdel = 1 ms were analyzed at a time lag n = 1 (A), 2 (B), and 3 (C). When combining the three data sets, the confidence region becomes further restricted (D); this analysis particularly allows precise estimation of σxy. When using tdel = 10 ms and including n = 1, 2, and 3 for analysis, the significance contour gets tilted, yielding higher sensitivity for determination of the diffusion coefficient D (E). By including all data for analysis, the set point can be precisely extracted (F).
It is also clear that standard msd analysis requires additional data at n > 1 to determine the mobility exactly; evidently, the msd may be generated not only by the preset values via  but also by any other combination of D and σxy, which is consistent with
 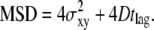 Fig. 4 B (C) shows the p-value analysis at n = 2 (3), which yield different shapes of the significance contours; the maximum follows the curve specified by
 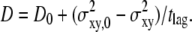 Naturally, one would consider the information from all three plots to lead to a conclusion on whether to reject H0. A simple way of combining the three plots is by taking the minimum p-value at each parameter setting. However, the distribution of the minimum of nmax uniformly distributed values
 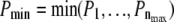 is not uniform but follows the function
 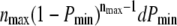 ; Pmin can therefore not be directly interpreted as the p-value.
To allow such an interpretation, we used the transformation 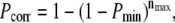 which—in the case of independent entries—yields uniformly distributed Pcorr on the interval [0,1]. Note that
  shows an increasing correlation with increasing n, which would require different transformations when including data points obtained at large n (40); up to n = 3, however, no significant deviation from uniform distribution was found (Fig. S2, Data S1). Fig. 4 D shows Pcorr calculated from the first three time lags. The significance contour engulfs now a restricted region containing the correct diffusion constant D = 0.3 μm2/s and the localization precision 20 nm. Still, the region is rather large, ranging from D ∼ 0.2 μm2/s to D ∼ 0.45 μm2/s. This is a natural consequence of the limited sample volume available from a single experiment, in this case 200 trajectories. At first glance it would appear attractive to take the parameter pair with the highest p-value as the best guess for the set point. However, it should be noted that a second run of the virtual experiment X would in general yield different results, and concomitantly an altered shape of the
  region; a statistically correct interpretation, therefore, allows us to exclude only the areas outside the confidence region. The shape of this particular confidence contour is elliptic, reminiscent of confidence ellipses from standard regression problems; the tilt angle of the major axes of the ellipse depends on the correlation between the parameter D and σxy.
To further ascertain the diffusion constant, an experimentalist may perform an additional independent measure of the diffusion process at higher delay times. We therefore simulated another virtual data set X(tdel = 10 ms), made the corresponding test for n = 1, 2, and 3, and plotted the corrected p-value Pcorr (Fig. 4 E). Compared to the data set obtained at tdel = 1 ms, we find here a significance contour which is much narrower along the D axis, but rather broad along the σxy axis. Both effects can be rationalized by considering that the observed displacements are now much larger than the localization errors (  ). Combining, finally, the results from tdel = 1 ms and tdel = 10 ms yields a very good approximate of the parameter pair used for the virtual data set (Fig. 4 F).
Hop diffusion
Having introduced the test strategy on a simple example, we next applied it to a situation which is more difficult to solve with standard tools. Multiple researchers faced the problem of how to analyze confined diffusion or the more general case of hop diffusion (9,23,25,27,29,37). Fig. 1 B sketches the model: a tracer molecule experiences periodic barriers to its diffusional path; the barriers define adjacent corrals of size L. In consequence, observations at short time lags would yield the free mobility of the tracer within a corral, Dmicro. Observation on long time lags would result in a reduced macroscopic mobility 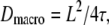 with τ the residence time in a domain. The permeability of the barriers determines the deceleration of the molecule at long time lags, which can be quantified by the confinement strength
 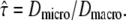 By definition
  with
with  denoting free diffusion and
  the case of impermeable barriers (totally confined diffusion). The hop diffusion model is fully specified by the parameters L,
  Dmacro, and σxy. In the following, we used L0 = 100 nm,
  Dmacro,0 = 0.3 μm2/s, and σxy,0 = 20 nm as set points, which are plausible values for hop diffusion of a GPI-anchored protein in the plasma membrane of T24 cells (25,37). We start our discussion with till = 0.
For hop diffusion, an analytical formula describing the msd as a function of the time lag is given by Wieser et al. (25):
 |
(2) |
with  ) and
) and  However, it is often difficult to draw unambiguous conclusions from experimental data (34). The information content at the level of the distribution of square displacements would be much higher, yet analytical treatment soon becomes exhausting even for the simplest case of a meshwork of squares (41). The challenge can be seen on virtual data sets Xhop. In Fig. 5 A we plotted
  as a function of tlag.
  shows the characteristic change in the slope from Dmicro to Dmacro at a time lag
  here at 1 ms. For tlag < 1 ms, the linear increase directly specifies Dmicro via
  For tlag > 1 ms, the curve approximates
  Also in this regime, the curve increases linearly with tlag, and the slope specifies Dmacro. However, an extra offset adds now to the localization errors, which depends on the domain size and the confinement strength. The cdf is monoexponential at both very short and very long tlag (Fig. 5, B and D); interestingly, slightly above the transition region from Dmicro to Dmacro a significant deviation from monoexponential behavior can be observed (Fig. 5 C).
FIGURE 5.

Conventional analysis of hop diffusion. A test data set was simulated with the parameter settings L0 = 100 nm,  Dmacro = 0.3 μm2/s, and σxy,0 = 20 nm, till = 0 ms. A shows the msd as a function of the time lag. The data set can be well described by Eq. 2. Note that the shortest time lag was assumed to be insufficient to catch the bending of the curve. B–D show cumulative density functions for tlag = 1 ms, 10 ms, and 50 ms, respectively. Although the curves obtained for tlag = 1 ms and tlag = 50 ms follow a monoexponential function according to Eq. 1, the data simulated for tlag = 10 ms clearly deviate.
Apparently, when data from all time regimes would be available, the full msd curve could be resolved, yielding fairly robust estimates of the domain size and the confinement strength. However, in particular, tdel < 1 ms is experimentally difficult to achieve (25). If data are available for only tdel ≥ 1 ms, an unambiguous identification and characterization of hop diffusion is extremely difficult. An increased offset in  due to hop diffusion can be taken as a readout parameter but requires very precise knowledge on the localization precision (25). We were therefore interested in whether the deviation from monoexponential behavior observable in the cdf alone would directly allow sensing and characterizing hop diffusion in particular for data obtained at a time resolution tdel = 1 ms and 10 ms.
Fig. 6 shows the results of our test. Analysis was performed by calculating the minimum of the p-values obtained for n = 1, 2, and 3; all plots show the corrected p-value Pcorr. We assumed Dmacro, which is commonly not difficult to determine, to be known. Our sample was tested against probe data sets Yijk specified by the parameters  and
and 
FIGURE 6.

Test results for a hop diffusion data set. We simulated trajectories with exponentially distributed length (mean 10 observations) and selected a subset of 500 trajectories with more than 5 observations for analysis. The set point for X was at the parameter settings L0 = 100 nm,  Dmacro = 0.3 μm2/s, and σxy,0 = 20 nm, till = 0 ms. Probe data sets Y were simulated in a parameter range
  L = 50–150 nm and σxy = 0–40 nm, with a size of 10,000 trajectories. The plots show the decadic logarithm of the corrected p-values as a function of D and σxy. Display settings are identical to those in Fig. 4. A shows the results for tdel = 1 ms and n ≤ 3. Free diffusion would explain the data, although only at a biased σxy ∼ 30 nm. B shows the results for tdel = 10 ms and n ≤ 3. In this case, free diffusion can be ruled out to high significance. When combining both data sets, the set point can be extracted to high precision (C).
The different time regimes show different characteristic features. The data set simulated at tdel = 1 ms (Fig. 6 A) does not rule out free diffusion ( ), but the corresponding value of
  would be too large. Apparently, in this regime the test is sensitive to the offset in
  versus tlag and correctly measures its magnitude, but it cannot exclude the possibility that this offset is caused solely by localization errors. Due to the dependence of this offset on
  we observed a tilted confidence region. If there is no additional information on σxy, analysis at tdel = 1 ms would hardly exclude any value of
  up to a domain size of 100 nm. On the other hand, if the domain size is assumed to be much larger than the set point of 100 nm (e.g., L = 150 nm in Fig. 6 A), the concomitant offset becomes too large to be compensated by σxy, so that no significant Pcorr value is obtained for this scenario at
When testing against L = 120 nm, which is only slightly above the set point, we find two well-separated maxima of Pcorr, one at  and the second at
  ; interestingly, the region between the two maxima can be excluded with high significance. A closer look on the tlag dependence of
  (Fig. 5 A) allows us to rationalize this effect. At intermediate values of
  the curve shows a pronounced transition region from Dmicro to Dmacro at a location
  ; for
; for  this transition region would be located at tlag ∼ 2 ms, which would have been sensed by the test performed at a delay of 1 ms. Since the data do not contain the transition in this particular region, the intermediate values of
  were excluded. Fig. 6 B shows the second data set simulated at tdel = 10 ms. It hardly contains information on Dmicro; therefore,
  cannot be specified precisely. However, this data set can significantly rule out free diffusion, which is a consequence of the deviation of the hop diffusion cdf from a monoexponential function (compare Fig. 5, B–D).
In the following, we attempt to extract further information from data sets at tdel ≥ 1 ms. First, we can combine the two data sets for tdel = 1 ms and 10 ms in one plot by calculating the corrected p-values (Fig. 6 C). From this analysis it becomes clear that free or barely confined diffusion can be significantly ruled out, and  can be specified. Moreover, domain sizes outside the significance region between 80 nm and 120 nm can be excluded. Note that for L = 100 nm and L = 120 nm, changes in
  result in pronounced changes in the localization precision. In particular, a domain size of 120 nm at
  would only be consistent when assuming a localization precision of ∼12 nm. Additional prior information on σxy would therefore enable us to further narrow the significance contours.
Second, we may also consider effects due to the diffusion of a molecule during its illumination. The effect on the msd has been estimated in the literature (25,42,43), yielding in particular an apparent reduction in the domain size by a factor of  with
with  till the illumination time (25). Basically, the centroid of the tracer's trajectory during its illumination is biased toward the domain center; after a jump of the tracer to an adjacent domain, the centroid also hops accordingly. Interestingly, such hops of the centroids may become more pronounced at long illumination times compared to the unbiased hop diffusion recorded at short illumination times (see also Fig. 5 in Ritchie et al. (42)). In particular, clear deviations from a monoexponential function should be visible in the cdf. As a test, we used an illumination time till = 2 ms, where the apparent domain size would shrink to 30% of the original value; the corresponding msd would be barely distinguishable from free diffusion (insets to Fig. 7).
FIGURE 7.

Conventional analysis of a hop diffusion data set including effects of diffusion during illumination. Data were simulated for L0 = 100 nm,  Dmacro = 0.3 μm2/s, and σxy,0 = 20 nm. The main plots show the cumulative density function of r2, the inset the msds as a function of time lag (Eq. 2). The cdf was fitted by a monoexponential function (Eq. 1, dotted line). The panels show results for till = 0 ms, tdel = 4 ms (A), till = 2 ms, tdel = 2 ms (B) and till = 4 ms, tdel = 0 ms (C). Note that the difference to free diffusion is decreased with increasing till when considering the msds but becomes pronounced when considering the cdf. In addition, the probability for small displacements is larger when using longer illumination times, resulting in a steeper increase of the cdf. It is caused by a more pronounced collapse of the trajectory segment in the domain center, yielding smaller position fluctuations of the centroid.
Indeed, when plotting the cdf for this data set, we found strong deviations from the monoexponential function (Fig. 7). We next used our test to extract the simulated parameter. A time delay of 2 ms and the inclusion of the first three time lags (n = 1, 2, 3) proved sufficient to identify hop diffusion (Fig. 8 A). A lower boundary for the confinement strength can be specified (  ); only domain sizes from 80 nm to 120 nm were found to be consistent with the data set. Further narrowing of the significance region was achieved by combining data recorded at different illumination times till = 0 ms, 2 ms, and 4 ms, which results in the precise confirmation of the chosen sample statistics underlying our test data set (Fig. 8 B). These data show the importance of including illumination time effects for the analysis of single-molecule tracking data. Furthermore, they demonstrate how the choice of intermediate illumination times and their systematic variation enables a much more precise approach for the discrimination of diffusion models. Note that in general the localization precision also depends on the illumination time; to compensate for this effect, it is in general sufficient to reduce the illumination intensity accordingly.
FIGURE 8.

Test results for a hop diffusion data set including effects of diffusion during illumination. We simulated trajectories with exponentially distributed length (mean 10 observations) and selected a subset of 500 trajectories with more than 5 observations for analysis. The set point for X was at the parameter settings L0 = 100 nm,  Dmacro = 0.3 μm2/s, and σxy,0 = 20 nm. Probe data sets Y were simulated in a parameter range
  L = 50–150 nm, and σxy = 0–40 nm, with a size of 10,000 trajectories. The plots show the decadic logarithm of the corrected p-values as a function of D and σxy. Display settings are identical to those of Fig. 4. A shows results for tdel = 2 ms and till = 2 ms including data for n = 1, 2, and 3. For this setting, the set point can be well extracted. When combining data sets simulated at (till = 0 ms, tdel = 4 ms), (till = 2 ms, tdel = 2 ms), and (till = 4 ms, tdel = 0 ms), the significance region can be further reduced (B).
For the next example, we checked whether the testing approach allows identifying free diffusion against the hypothesis of hop diffusion. We simulated Xfree assuming D0 = 0.3 μm2/s, σxy,0 = 20 nm, tdel = 2 ms, and till = 2 ms and performed the test as described above (Fig. 9). For domain sizes  hop diffusion with
  can be ruled out with high significance, indicating that here the combined effects of diffusion during illumination and time dependence of r2 also strongly restrict the number of possible model parameters. Yet, no conclusion can be drawn for hop diffusion between small domains
  ; in this case, the effect on the offset of the msd and on the distribution of r2 is too small to be detectable.
FIGURE 9.

Test results for a free diffusion data set including effects of diffusion during illumination. We simulated trajectories with exponentially distributed length (mean 10 observations) and selected a subset of 500 trajectories with more than 5 observations for analysis. The set point for X was at the parameter settings  Dmacro = 0.3 μm2/s, σxy,0 = 20 nm, till = 2 ms, and tdel = 2 ms. Probe data sets Y were simulated in a parameter range
  L = 50–150 nm, and σxy = 0–40 nm, with a size of 10,000 trajectories. The plots show the decadic logarithm of the corrected p-values as a function of D and σxy. Display settings are identical to those of Fig. 4.
Finally, we applied the test for the analysis of experiments reported previously (25). In that study, we measured and characterized the diffusion of CD59—a GPI-anchored protein—in the plasma membrane of the human bladder carcinoma cell line T24. For labeling CD59 we used a fluorescent Fab fragment of a monoclonal antibody. Based on the analysis of the msd versus time lag, we found no indication for hop diffusion, in contrast to a study on the same system where single-particle tracking of gold-labeled CD59 revealed hop diffusion between domains with a size L = 120 nm (37). We interpreted the conflicting results to be a consequence of the different experimental strategies.
The measured data set was recorded at 37°C, at a delay tdel = 0.7 ms and an illumination time till = 0.3 ms (green curve in Fig. 9 of Wieser et al. (25)). We included 262 trajectories with a mean length of 7.5 observations in this analysis. We fixed the macroscopic mobility to the value determined from the slope of  versus tlag, Dmacro = 0.47 μm2/s. Note that in contrast to our previous analysis, we did not fix the localization precision here but regarded it as free parameter. Fig. 10 shows the results of the tests: hop diffusion between small domains of size
  cannot be ruled out over the whole spectrum of
  yet for
  the test rules out high confinement strength. The results of the two analytical approaches are consistent; in particular, both indicate that hop diffusion appears exaggerated in single-particle tracking experiments. However, it should also be noted that the test strategy applied here is more tolerant toward variations in confinement strength. No conclusion can be drawn up to
  compared with a maximally allowed
  for L = 100 nm reported previously. The higher accuracy of the previous analysis was due mainly to the inclusion of prior information on σxy = 22 ± 5 nm, which was not taken into account here. Indeed, the three parameters L,
  and σxy show mutual dependencies, which result in a tilted confidence region; in particular for L = 120 nm and L = 150 nm, the excluded values of
  strongly depend on the choice of σxy. Further constraining the confidence region would therefore be possible by considering additional prior information on localization errors.
FIGURE 10.

Test results for data from experiments described in Wieser et al. (25). We included 262 trajectories in the analysis (mean trajectory length 8). Data were recorded at tlag = 0.7 ms, till = 0.3 ms. Probe data sets Y were simulated in a parameter range  L = 50–150 nm, and σxy = 0–40 nm, with a size of 5240 trajectories (mean trajectory length 8). To facilitate analysis, we fixed the macroscopic mobility at the value derived from msd analysis Dmacro = 0.47 μm2/s. The plots show the decadic logarithm of the corrected p-values as a function of D and σxy. Display settings are identical to those of Fig. 4. See main text for discussion.
Transient binding to slow receptors
Dynamic molecular interactions are fundamental to cellular processes. Many signaling events are initiated and regulated by the transient binding of plasma membrane associated pairs of molecules such as receptors and ligands or enzymes and substrates. Besides the cis interaction of two reactants (44), the transinteraction in a cell-cell contact region is of great interest to understand the regulation of cellular adhesion and activation (45,46).
Currently, the preferred approach for characterizing molecular interactions between a fluorescently labeled reactant and its receptor is based on the analysis of the fluorescence recovery after photobleaching (FRAP) (47). In such an experiment, a specific region of the cell is photobleached by a strong laser pulse; the increase of signal due to the diffusion of unbleached reactant into the bleach spot is measured. The dynamics of the fluorescence recovery depends on the mobility of the two reactants (D1 and D2), the binding rate constants (kon and koff), and the geometry of the bleaching profile (48). As examples, FRAP was used to deduce the rate constants for a green fluorescent protein tagged glucocorticoid receptor interacting transiently with nuclear binding sites (49), or to characterize the transinteraction of a protein with its counterreceptor moving in the opposing membranes of an immunological synapse (46,50,51). Although widely used, caution should be taken in interpreting FRAP data, as they depend critically on the diffusion mechanism (52) and on the geometry of the system (47).
The interaction dynamics between two proteins may also be probed at the single-molecule level. Conceptually the most straightforward approach would be based on two-color microscopy. The interaction time of the two reactants labeled in two different colors could be directly read off via the duration of the signal colocalization. However, since photobleaching limits the observation time for a single molecule to only a few frames, this approach would hardly produce any hits; moreover, the few correlation events will be biased toward short interaction times. Alternatively the change in mobility of a fluorescent reactant upon binding to its receptor may be analyzed; yet, although there are methods for detecting abrupt changes in the mobility of a tracer (30), in this case most of the trajectories may not be long enough to cover the full lifetime of the interaction.
In the following, we describe the application of our testing algorithm to infer kinetic binding constants from single-molecule tracking data. The underlying model is illustrated in Fig. 1 C. Let us assume two mobile species A and B which may interact transiently according to the equations
 |
with  and
and  the forward and reverse reaction rate constants for species A, which will be fluorescently labeled. In its free form, it will diffuse with diffusion constant DA; the bound complex is characterized by the mobility DAB, with
  Let us further assume the total length of single-molecule trajectories to be distributed exponentially. This assumption approximates real life experiments fairly well; whenever longer tails are observed in the bleaching curves (53), they can also be accounted for in the algorithm. Next, every trajectory is analyzed by calculating an estimator of the single-molecule mobility according to
  The top panel of Fig. 11 shows the results of Dest for a simulation of 2500 trajectories with the parameters DA = 1 μm2/s, DAB = 0.1 μm2/s, τoff = 100 ms, τon = 200 ms, and σxy = 0 nm. We assumed a mean number of 10 steps per trajectory, which was distributed exponentially. In panel A, we show Dest for a simulation which was run at a delay of 1 ms. Two peaks can be discriminated, corresponding to the diffusion constants DA and DAB. The normalized area of the left and right peak specifies the bound and unbound fraction
  and
and  respectively. Upon increasing the delay between two consecutive observations to 25 ms, transitions between the bound and the unbound state within a single trajectory become likely (B). Consequently, the peaks become connected, and the maxima shift toward an intermediate mobility
  This effect is more pronounced at a delay of 300 ms, where the peaks have merged to a single peak (C). In essence, the ratio between the transition rate constants and the delay time defines the shape of the histogram.
FIGURE 11.

Test of a virtual data set Xbinding simulated at DA = 1 μm2/s, DAB = 0.1 μm2/s, τoff = 100 ms, τon = 200 ms, and σxy = 0 nm. We included 2500 trajectories of exponentially distributed length with mean 10. A, B, and C show simulations for tdel = 1 ms, 25 ms, and 300 ms, respectively. In the top panel, histograms of the estimated single-molecule diffusion coefficient Dest are depicted. For tdel = 1 ms the two mobile species can be well separated, as hardly any transition occurs within the individual trajectories. For tdel = 25 ms, the two peaks start to merge, yielding a pronounced shoulder around DAB. For tdel = 300 ms, no indication for two different species remains. The bottom panel shows the corresponding test results, using a 100-fold larger probe data set Y. The decadic logarithm of the p-values is shown as a function of the bound fraction K and the off-rate τoff. The α = 5% significance contour is indicated by a thick solid line, the set point by a dotted line. Gray scales were chosen to highlight the p-value range 1%–100%. Additional contours were added for p-values smaller than α (10−2, 10−4, 10−6, 10−8). The three simulations exemplify the extreme cases: A (C) allows us to specify a lower (upper) boundary for τoff; B yields a precise estimate of the set point. The precision in estimating K hardly depends on tdel.
We therefore based our testing approach on the parameter Dest, with an attempt to extract information on K and τoff. The remaining parameter DA, DAB, σxy, and the trajectory length are assumed to be known from independent experiments. The bottom panels of Fig. 11 show the test results for the respective virtual data sets Xbinding in the top panel; probe data sets Y were simulated with a 100-fold larger size than Xbinding. The simulated bound fraction K0 = 33% can be extracted at high precision for all chosen delay times. The high sensitivity for K originates from the strong effect of changes in the area proportion on the shape of the cdf; this effect appears at any time delay. In contrast, the confidence regions for the interaction time depend strongly on the settings of tdel. For a delay of 25 ms, we find a sharp region in τoff including the set point of τoff,0 = 100 ms; the p-values rapidly decline when testing against values of τoff which deviate from the set point by a factor of 2 (Fig. 11 B). An experiment performed at tdel = 1 ms, however, would only provide a lower boundary for τoff at ∼25 ms. This effect is plausible, since at short delays hardly any transition between fast and slow diffusion occurs within a single trajectory. Yet the test can rule out rapid turnovers, as such a scenario would have been inconsistent with the well-separated peaks observed in the histogram. The effect is reversed when too long a delay is (tdel = 300 ms); in this case, the test senses the single peak in the distribution of Dest (Fig. 11 C), which would agree with any turnover faster than the upper boundary for τoff at ∼250 ms but would be inconsistent with a slower off-rate.
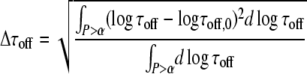
To further evaluate the potential of the test for extracting the two parameters K0 and τoff,0 under various constraints of the known parameters, we determined the average square deviation of K and τoff from the set points K0, τoff,0 in the significance region:
 |
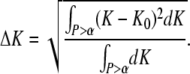 |
Fig. 12 summarizes the results. Panel A shows a more detailed characterization of the dependence on tdel, confirming the trends visible in Fig. 11. Precise estimation of the bound fraction K is barely affected by variation of tdel. For τoff, lower boundaries (for tdel ≪ τoff) or upper boundaries (for tdel ≫ τoff) can be specified; around tdel ∼ τoff, a correct estimate of the set point can be achieved. We next varied the assumed bound fraction K from 15% to 85%. The plot reveals an interesting asymmetry: both Δτoff and ΔK increase when K decreases from 50%, but there is barely any effect when K increases. This is caused by the residual asymmetry of the distributions of Dest, a consequence of the rather short trajectories used for the calculation; a sharper edge on the right side of the Dest histograms allows higher reliability in detecting a shoulder on the high mobility side.
FIGURE 12.

Evaluation of the test for different parameter ranges. Data sets Xbinding were simulated at DA = 1 μm2/s, DAB = 0.1 μm2/s, τoff = 100 ms, τon = 200 ms, tdel = 25 ms, and σxy = 0 nm, except where indicated. We included 2500 trajectories of exponentially distributed length with mean 10. We plotted Δτoff and ΔK to measure the mean deviation of the confidence region from the set point. Whenever the confidence region exceeds the simulated parameter space (0.02–0.5 s for τoff, 26%–40% for K), data points are put in brackets; in these cases, only a lower boundary can be provided. A shows a systematic variation of tdel between 1 ms and 300 ms, including the data shown in Fig. 11. Optimum readout of the interaction lifetime can be performed with a delay of ∼25 ms. The precision for estimating the bound fraction hardly depends on tdel. (B) We varied the bound fraction K by changing τon while keeping τoff = 100 ms constant. The test precision improves for both K and τoff by increasing the bound fraction. Note the asymmetry in the plot, which is a consequence of asymmetric histograms for Dest. (C) Variation of the ratio DA/DAB. DA was kept constant at 1 μm2/s; DAB was adjusted. For all chosen settings, the bound fraction can be extracted with fairly good precision. Interestingly, a ratio of 3 is sufficient to significantly restrict the parameter range for τoff. Data obtained for a ratio of 2, however, contain hardly any information on the interaction lifetime. (See Fig. S3, Data S1, for all contour plots). (D) To mimic a real life experiment more closely, we also included localization errors σxy in the analysis. In this plot, the errors are assumed to be known from prior experiments. We find only a modest deterioration of the results with increasing σxy.
We also assessed the quality of the test for different ratios DA/DAB (panel C). Evidently, the test strategy depends critically on a significant difference between DA and DAB, which is reflected in this plot by an increase of both Δτoff and ΔK with decreasing DA/DAB. Interestingly, the off-rate can be well estimated when the diffusion constants between the bound and unbound forms differ only by a factor of 3 (see also Fig. S3, Data S1).
Fig. 12 D shows the dependence of the results on the localization precision. Higher errors—if taken correctly into account—deteriorate the results only modestly. However, when localization errors are wrongly estimated from prior experiments, the results may be biased (Fig. 13). In this case, the bound fraction in particular will be underestimated for too low σxy or overestimated for too high σxy; yet, the test does not sense an erroneous estimation of σxy,0. The effect is caused by a shift of the distribution of Dest to higher values when increasing σxy. Interestingly, τoff is less affected. The magnitude of the bias may further depend on the set points for DA, DAB, and tdel (compare with Fig. 4). Note that we have chosen here rather large deviations of σxy from the set point.
FIGURE 13.

Test stability under wrong assumption of σxy. Data sets Xbinding were simulated at DA = 1 μm2/s, DAB = 0.1 μm2/s, τoff = 100 ms, τon = 200 ms, and tdel = 25 ms and σxy = 50 nm. We included 2500 trajectories of exponentially distributed length with mean 10. We tested against the assumption of σxy = 25 nm (A), σxy = 50 nm (B), and σxy = 75 nm (C). Apparently, the test would tolerate such significantly wrong assumptions, yielding extended regions with p-value > α for all settings of σxy; yet the significance regions are somewhat biased to lower K and τoff or higher K and τoff for underestimation or overestimation of the localization errors. It should be noted, however, that even such significantly wrong assumptions lead only to a minor bias of the results.
CONCLUSIONS
We have described a test-based approach for the analysis of single-molecule tracking data. Although generally applicable, the approach is particularly useful for models where analytical treatment is challenging. We demonstrated the working principle for the analysis of free diffusion, hop diffusion, and transient binding of the tracer molecule to slowly moving receptors. The test directly yields significance contours in a multidimensional parameter space, which allows us to discriminate consistent from inconsistent parameter settings.
We foresee two main applications of the test strategy. First, the test will help in the analysis of data when no analytical theory is at hand. It is ironic that the majority of membrane proteins are found to diffuse anomalously. However, since the according deviations from free Brownian motion are difficult to tackle, experimentalists restrict themselves to specify subdiffusion coefficients; model-based analysis is hardly possible. With the described approach, analysis may be performed on the basis of even complex models, including, e.g., the partitioning of the tracer molecule to mobile plasma membrane domains such as rafts, the presence of obstacles, or the effect of altered matrix geometry. It should be emphasized that our approach is not limited to the analysis of short traces; long trajectories obtained in single-particle tracking studies also can be used as input sample. In fact, any test data set with elements following a Markov chain may be analyzable. In particular, single-molecule Förster resonance energy transfer data frequently contain specific substates which may transit in time; also in such cases, the test approach will allow extracting transition times from the characteristic shapes of the Förster resonance energy transfer histograms.
Second, the testing approach enables the precise configuration of the measurement parameters to maximize the sensitivity. In particular, potential pitfalls due to the inappropriate selection of the measurement parameter can be avoided a priori. Having selected a specific experimental design, it may well be appropriate to compare the power of different two-sample tests (e.g., Kolmogorov-Smirnov versus the Wilcoxon rank sum).
SUPPLEMENTARY MATERIAL
To view all of the supplemental files associated with this article, visit www.biophysj.org.
Supplementary Material
Acknowledgments
We thank Mario Brameshuber for critical comments on the manuscript.
This work was supported by the Austrian Science Fund (FWF) project No. Y250-B10, and by the GEN-AU project of the Austrian Federal Ministry for Science and Research.
Stefan Wieser and Markus Axmann contributed equally to this work.
Editor: Michael Edidin.
References
- 1.Vereb, G., J. Szollosi, J. Matko, P. Nagy, T. Farkas, L. Vigh, L. Matyus, T. A. Waldmann, and S. Damjanovich. 2003. Dynamic, yet structured: the cell membrane three decades after the Singer-Nicolson model. Proc. Natl. Acad. Sci. USA. 100:8053–8058. [DOI] [PMC free article] [PubMed] [Google Scholar]
- 2.Jacobson, K., O. G. Mouritsen, and R. G. Anderson. 2007. Lipid rafts: at a crossroad between cell biology and physics. Nat. Cell Biol. 9:7–14. [DOI] [PubMed] [Google Scholar]
- 3.Kusumi, A., C. Nakada, K. Ritchie, K. Murase, K. Suzuki, H. Murakoshi, R. S. Kasai, J. Kondo, and T. Fujiwara. 2005. Paradigm shift of the plasma membrane concept from the two-dimensional continuum fluid to the partitioned fluid: high-speed single-molecule tracking of membrane molecules. Annu. Rev. Biophys. Biomol. Struct. 34:351–378. [DOI] [PubMed] [Google Scholar]
- 4.Lenne, P. F., L. Wawrezinieck, F. Conchonaud, O. Wurtz, A. Boned, X. J. Guo, H. Rigneault, H. T. He, and D. Marguet. 2006. Dynamic molecular confinement in the plasma membrane by microdomains and the cytoskeleton meshwork. EMBO J. 25:3245–3256. [DOI] [PMC free article] [PubMed] [Google Scholar]
- 5.Saxton, M. J., and K. Jacobson. 1997. Single-particle tracking: applications to membrane dynamics. Annu. Rev. Biophys. Biomol. Struct. 26:373–399. [DOI] [PubMed] [Google Scholar]
- 6.Schutz, G. J., and P. Hinterdorfer. 2002. Single molecule fluorescence and force microscopy. Exp. Gerontol. 37:1495–1511. [DOI] [PubMed] [Google Scholar]
- 7.Manley, S., J. M. Gillette, G. H. Patterson, H. Shroff, H. F. Hess, E. Betzig, and J. Lippincott-Schwartz. 2008. High-density mapping of single-molecule trajectories with photoactivated localization microscopy. Nat. Methods. 5:155–157. [DOI] [PubMed] [Google Scholar]
- 8.Hess, S. T., T. J. Gould, M. V. Gudheti, S. A. Maas, K. D. Mills, and J. Zimmerberg. 2007. Dynamic clustered distribution of hemagglutinin resolved at 40 nm in living cell membranes discriminates between raft theories. Proc. Natl. Acad. Sci. USA. 104:17370–17375. [DOI] [PMC free article] [PubMed] [Google Scholar]
- 9.Schütz, G. J., G. Kada, V. P. Pastushenko, and H. Schindler. 2000. Properties of lipid microdomains in a muscle cell membrane visualized by single molecule microscopy. EMBO J. 19:892–901. [DOI] [PMC free article] [PubMed] [Google Scholar]
- 10.Baumgartner, W., G. J. Schütz, J. Wiegand, N. Golenhofen, and D. Drenckhahn. 2003. Cadherin function probed by laser tweezer and single molecule fluorescence in vascular endothelial cells. J. Cell Sci. 116:1001–1011. [DOI] [PubMed] [Google Scholar]
- 11.Fujiwara, T., K. Ritchie, H. Murakoshi, K. Jacobson, and A. Kusumi. 2002. Phospholipids undergo hop diffusion in compartmentalized cell membrane. J. Cell Biol. 157:1071–1081. [DOI] [PMC free article] [PubMed] [Google Scholar]
- 12.Chen, Y., W. R. Thelin, B. Yang, S. L. Milgram, and K. Jacobson. 2006. Transient anchorage of cross-linked glycosyl-phosphatidylinositol-anchored proteins depends on cholesterol, Src family kinases, caveolin, and phosphoinositides. J. Cell Biol. 175:169–178. [DOI] [PMC free article] [PubMed] [Google Scholar]
- 13.Suzuki, K. G., T. K. Fujiwara, F. Sanematsu, R. Iino, M. Edidin, and A. Kusumi. 2007. GPI-anchored receptor clusters transiently recruit Lyn and Gα for temporary cluster immobilization and Lyn activation: single-molecule tracking study 1. J. Cell Biol. 177:717–730. [DOI] [PMC free article] [PubMed] [Google Scholar]
- 14.DeMond, A. L., K. D. Mossman, T. Starr, M. L. Dustin, and J. T. Groves. 2008. T cell receptor microcluster transport through molecular mazes reveals mechanism of translocation. Biophys J. 94:3286–3292. [DOI] [PMC free article] [PubMed] [Google Scholar]
- 15.Sako, Y., A. Nagafuchi, S. Tsukita, M. Takeichi, and A. Kusumi. 1998. Cytoplasmic regulation of the movement of E-cadherin on the free cell surface as studied by optical tweezers and single particle tracking: corralling and tethering by the membrane skeleton. J. Cell Biol. 140:1227–1240. [DOI] [PMC free article] [PubMed] [Google Scholar]
- 16.Saxton, M. J. 1994. Anomalous diffusion due to obstacles: a Monte Carlo study. Biophys. J. 66:394–401. [DOI] [PMC free article] [PubMed] [Google Scholar]
- 17.Marguet, D., P. F. Lenne, H. Rigneault, and H. T. He. 2006. Dynamics in the plasma membrane: how to combine fluidity and order. EMBO J. 25:3446–3457. [DOI] [PMC free article] [PubMed] [Google Scholar]
- 18.Simons, K., and E. Ikonen. 1997. Functional rafts in cell membranes. Nature. 387:569–572. [DOI] [PubMed] [Google Scholar]
- 19.Ghosh, R. N., and W. W. Webb. 1994. Automated detection and tracking of individual and clustered cell surface low density lipoprotein receptor molecules. Biophys. J. 66:1301–1318. [DOI] [PMC free article] [PubMed] [Google Scholar]
- 20.Wilson, K. M., I. E. Morrison, P. R. Smith, N. Fernandez, and R. J. Cherry. 1996. Single particle tracking of cell-surface HLA-DR molecules using R-phycoerythrin labeled monoclonal antibodies and fluorescence digital imaging. J. Cell Sci. 109:2101–2109. [DOI] [PubMed] [Google Scholar]
- 21.Michalet, X., F. F. Pinaud, L. A. Bentolila, J. M. Tsay, S. Doose, J. J. Li, G. Sundaresan, A. M. Wu, S. S. Gambhir, and S. Weiss. 2005. Quantum dots for live cells, in vivo imaging, and diagnostics. Science. 307:538–544. [DOI] [PMC free article] [PubMed] [Google Scholar]
- 22.Kusumi, A., Y. Sako, and M. Yamamoto. 1993. Confined lateral diffusion of membrane receptors as studied by single particle tracking (nanovid microscopy). Effects of calcium-induced differentiation in cultured epithelial cells. Biophys. J. 65:2021–2040. [DOI] [PMC free article] [PubMed] [Google Scholar]
- 23.Umemura, Y. M., M. Vrljic, S. Y. Nishimura, T. K. Fujiwara, K. G. Suzuki, and A. Kusumi. 2008. Both MHC class II and its GPI-anchored form undergo hop diffusion as observed by single-molecule tracking. Biophys J. 95:435–450. [DOI] [PMC free article] [PubMed] [Google Scholar]
- 24.Nechyporuk-Zloy, V., P. Dieterich, H. Oberleithner, C. Stock, and A. Schwab. 2008. Dynamics of single potassium channel proteins in the plasma membrane of migrating cells. Am. J. Physiol. Cell Physiol. 294:C1096–C1102. [DOI] [PubMed] [Google Scholar]
- 25.Wieser, S., M. Moertelmaier, E. Fuertbauer, H. Stockinger, and G. J. Schutz. 2007. (Un)Confined diffusion of CD59 in the plasma membrane determined by high-resolution single molecule microscopy. Biophys. J. 92:3719–3728. [DOI] [PMC free article] [PubMed] [Google Scholar]
- 26.Sako, Y., S. Minoghchi, and T. Yanagida. 2000. Single-molecule imaging of EGFR signalling on the surface of living cells. Nat. Cell Biol. 2:168–172. [DOI] [PubMed] [Google Scholar]
- 27.Lommerse, P. H., G. A. Blab, L. Cognet, G. S. Harms, B. E. Snaar-Jagalska, H. P. Spaink, and T. Schmidt. 2004. Single-molecule imaging of the H-ras membrane-anchor reveals domains in the cytoplasmic leaflet of the cell membrane. Biophys. J. 86:609–616. [DOI] [PMC free article] [PubMed] [Google Scholar]
- 28.Vrljic, M., S. Y. Nishimura, S. Brasselet, W. E. Moerner, and H. M. McConnell. 2002. Translational diffusion of individual class II MHC membrane proteins in cells. Biophys. J. 83:2681–2692. [DOI] [PMC free article] [PubMed] [Google Scholar]
- 29.Jacquier, V., M. Prummer, J. M. Segura, H. Pick, and H. Vogel. 2006. Visualizing odorant receptor trafficking in living cells down to the single-molecule level. Proc. Natl. Acad. Sci. USA. 103:14325–14330. [DOI] [PMC free article] [PubMed] [Google Scholar]
- 30.Simson, R., E. D. Sheets, and K. Jacobson. 1995. Detection of temporary lateral confinement of membrane proteins using single-particle tracking analysis. Biophys. J. 69:989–993. [DOI] [PMC free article] [PubMed] [Google Scholar]
- 31.Jin, S., and A. S. Verkman. 2007. Single particle tracking of complex diffusion in membranes: simulation and detection of barrier, raft, and interaction phenomena. J. Phys. Chem. B. 111:3625–3632. [DOI] [PubMed] [Google Scholar]
- 32.Jin, S., P. M. Haggie, and A. S. Verkman. 2007. Single-particle tracking of membrane protein diffusion in a potential: simulation, detection, and application to confined diffusion of CFTR Cl-channels. Biophys. J. 93:1079–1088. [DOI] [PMC free article] [PubMed] [Google Scholar]
- 33.Saxton, M. J. 1993. Lateral diffusion in an archipelago. Single-particle diffusion. Biophys. J. 64:1766–1780. [DOI] [PMC free article] [PubMed] [Google Scholar]
- 34.Wieser, S., and G. J. Schütz. 2008. Tracking single molecules in the live cell plasma membrane—do's and don't's. Methods. In press. [DOI] [PubMed]
- 35.Wieser, S., G. J. Schutz, M. E. Cooper, and H. Stockinger. 2007. Single molecule diffusion analysis on cellular nanotubules: implications on plasma membrane structure below the diffraction limit. Appl. Phys. Lett. 91:233901. [Google Scholar]
- 36.Schütz, G. J., H. Schindler, and T. Schmidt. 1997. Single-molecule microscopy on model membranes reveals anomalous diffusion. Biophys. J. 73:1073–1080. [DOI] [PMC free article] [PubMed] [Google Scholar]
- 37.Murase, K., T. Fujiwara, Y. Umemura, K. Suzuki, R. Iino, H. Yamashita, M. Saito, H. Murakoshi, K. Ritchie, and A. Kusumi. 2004. Ultrafine membrane compartments for molecular diffusion as revealed by single molecule techniques. Biophys. J. 86:4075–4093. [DOI] [PMC free article] [PubMed] [Google Scholar]
- 38.Saxton, M. J. 1997. Single-particle tracking: the distribution of diffusion coefficients. Biophys. J. 72:1744–1753. [DOI] [PMC free article] [PubMed] [Google Scholar]
- 39.Pappas, P. A., and V. DePuy. 2004. An overview of non-parametric tests in SAS: when, why, and how. Proc. SouthEast SAS Users Group Conference (SESUG 2004): paper TU04.
- 40.Qian, H., M. P. Sheetz, and E. L. Elson. 1991. Single particle tracking. Analysis of diffusion and flow in two-dimensional systems. Biophys. J. 60:910–921. [DOI] [PMC free article] [PubMed] [Google Scholar]
- 41.Powles, J. G., M. J. D. Mallett, G. Rickayzen, and W. A. B. Evans. 1992. Exact analytic solutions for diffusion impeded by an infinite array of partially permeable barriers. Proc. R. Soc. Lond. A. 436:391–403. [Google Scholar]
- 42.Ritchie, K., X. Y. Shan, J. Kondo, K. Iwasawa, T. Fujiwara, and A. Kusumi. 2005. Detection of non-Brownian diffusion in the cell membrane in single molecule tracking. Biophys. J. 88:2266–2277. [DOI] [PMC free article] [PubMed] [Google Scholar]
- 43.Destainville, N., and L. Salome. 2006. Quantification and correction of systematic errors due to detector time-averaging in single-molecule tracking experiments. Biophys. J. 90:L17–L19. [DOI] [PMC free article] [PubMed] [Google Scholar]
- 44.Mayawala, K., D. G. Vlachos, and J. S. Edwards. 2006. Spatial modeling of dimerization reaction dynamics in the plasma membrane: Monte Carlo vs. continuum differential equations. Biophys. Chem. 121:194–208. [DOI] [PubMed] [Google Scholar]
- 45.Bell, G. I., M. Dembo, and P. Bongrand. 1984. Cell adhesion. Competition between nonspecific repulsion and specific bonding. Biophys. J. 45:1051–1064. [DOI] [PMC free article] [PubMed] [Google Scholar]
- 46.Lee, S. J., Y. Hori, J. T. Groves, M. L. Dustin, and A. K. Chakraborty. 2002. The synapse assembly model. Trends Immunol. 23:500–502. [DOI] [PubMed] [Google Scholar]
- 47.Sprague, B. L., and J. G. McNally. 2005. FRAP analysis of binding: proper and fitting. Trends Cell Biol. 15:84–91. [DOI] [PubMed] [Google Scholar]
- 48.Kang, M., and A. K. Kenworthy. 2008. A closed-form analytic expression for FRAP formula for the binding diffusion model. Biophys. J. 95:L13–L15. [DOI] [PMC free article] [PubMed] [Google Scholar]
- 49.Sprague, B. L., R. L. Pego, D. A. Stavreva, and J. G. McNally. 2004. Analysis of binding reactions by fluorescence recovery after photobleaching. Biophys. J. 86:3473–3495. [DOI] [PMC free article] [PubMed] [Google Scholar]
- 50.Tolentino, T. P., J. Wu, V. I. Zarnitsyna, Y. Fang, M. L. Dustin, and C. Zhu. 2008. Measuring diffusion and binding kinetics by contact area FRAP. Biophys. J. 95:920–930. [DOI] [PMC free article] [PubMed] [Google Scholar]
- 51.Wu, J., Y. Fang, V. I. Zarnitsyna, T. P. Tolentino, M. L. Dustin, and C. Zhu. 2008. A coupled diffusion-kinetics model for analysis of contact area FRAP experiment. Biophys. J. 95:910–919. [DOI] [PMC free article] [PubMed] [Google Scholar]
- 52.Feder, T. J., I. Brust-Mascher, J. P. Slattery, B. Baird, and W. W. Webb. 1996. Constrained diffusion or immobile fraction on cell surfaces: a new interpretation. Biophys. J. 70:2767–2773. [DOI] [PMC free article] [PubMed] [Google Scholar]
- 53.Füreder-Kitzmüller, E., J. Hesse, A. Ebner, H. J. Gruber, and G. J. Schütz. 2005. Non-exponential bleaching of single bioconjugated Cy5 molecules. Chem. Phys. Lett. 404:13–18. [Google Scholar]
Associated Data
This section collects any data citations, data availability statements, or supplementary materials included in this article.