Abstract
Our overall research goal is to devise a robust method of tracking and compensating patient motion by combining an emission data based approach with a visual tracking system (VTS) that provides an independent estimate of motion. Herein, we present the latest hardware configuration of the VTS, a test of the accuracy of motion tracking by it, and our solution for synchronization between the SPECT and the optical acquisitions. The current version of the VTS includes stereo imaging with sets of optical network cameras with attached light sources, a SPECT/VTS calibration phantom, a black stretchable garment with reflective spheres to track chest motion, and a computer to control the cameras. The computer also stores the JPEG files generated by the optical cameras with synchronization to the list-mode acquisition of events on our SPECT system. Five Axis PTZ 2130 network cameras (Axis Communications AB, Lund, Sweden) were used to track motion of spheres with a highly retro-reflective coating using stereo methods. The calibration phantom is comprised of seven reflective spheres designed such that radioactivity can be added to the tip of the mounts holding the spheres. This phantom is used to determine the transformation to be applied to convert the motion detected by the VTS into the SPECT coordinates system. The ability of the VTS to track motion was assessed by comparing its results to those of the Polaris infra-red tracking system (Northern Digital Inc. Waterloo, ON, Canada). The difference in the motions assessed by the two systems was generally less than 1mm. Synchronization was assessed in two ways. First, optical cameras were aimed at a digital clock and the elapsed time estimated by the cameras was compared to the actual time shown by the clock in the images. Second, synchronization was also assessed by moving a radioactive and reflective sphere three times during concurrent VTS and SPECT acquisitions and comparing the time at which motion occurred in the optical and SPECT images. The results show that optical and SPECT images stay synchronized within a 150 ms range. The 100Mbit network load is less than 10%, and the computer's CPU load is between 15 and 25%; thus, the VTS can be improved by adding more cameras or by increasing the image size and/or resolution while keeping an acquisition rate of 30 images per second per camera.
I. Introduction
Patient motion during SPECT acquisition is one of the main causes of artifacts [1], and various approaches relying solely on SPECT data inconsistencies to track and compensate motion have been described [2-6]. However, the use of external tracking devices providing additional information independent of SPECT data is expected to result in more robust correction than use of solely the emission data. Following the work of others for head motion compensation in brain SPECT and PET [7-9], our goal is to devise a robust method to track and compensate patient body motion and respiration in cardiac SPECT by combining an emission data based approach with a visual tracking system (VTS) that provides an independent estimate of motion.
Our research program on motion detection and compensation is divided in three parts corresponding to three logical steps: 1) acquire data about the patient motion during the SPECT exam from an external device [10-13], 2) process the data obtained in step 1 in order to extract relevant information about the patient motion [10-13], and 3) compensate SPECT data for motion by combining the information obtained in step 2 with an emission data based approach [14]. This article primarily deals with the solutions implemented to acquire data (step 1).
The basic idea of the VTS is to track patient motion using pairs of optical cameras for stereo imaging during the SPECT acquisition. The main difficulty with this approach is to come up with a solution that takes into account the many constraints of the demanding clinical environment. The constraints and our current answers to them are detailed in the “Methods” section of this article. Our VTS is comprised of pairs of optical cameras, a SPECT/VTS calibration phantom, a garment with reflective spheres to track chest motion, and a computer for camera control and data acquisition in synchrony with list-mode acquisition on our SPECT system. The feasibility of the VTS has already been established [10-13]. In the present work, we detail the latest hardware configuration of the VTS. We also present the results of the tests we conducted to validate the ability of the VTS to accurately track motion, and confirm the synchronization between the SPECT and the optical acquisitions.
II. Methods
A. Constraints
In the process of designing and improving the VTS, we have kept in mind the following requirements, relevant for any situation in which patients are involved:
- Any solution has to be safe. For that reason, solutions involving radioactive markers and/or electrical wires on the patient's body were excluded from consideration.
- The solution should impose a minimal additional burden to the technologist performing the study. The garment with the reflective spheres presented below is designed such that it can be easily put on atop the patient's clothes, and does not go over the patient's head so that the presence of intravenous catheters (IV) and EKG leads does not present a problem.
- There should be minimal alteration in the imaging procedure as far as the patient is concerned. Again, solely adding the wearing of a stretchy garment with reflective spheres meets this constraint.
- The system should operate independent of the level of room lighting. Our use of spheres with a retro-reflective coating to meet this constraint is illustrated herein.
- The patient's privacy has to be respected. Institutional Review Board approval has to be obtained and the patients will give their informed consent. The image files will not contain any reference to the patient's identity. Prior to storage on disk the images will be processed so that all but the region of the images where the markers are visible is masked.
- The failure of the VTS should not compromise the SPECT acquisition.
In addition to the constraints above, several technical requirements must be met:
- The VTS has to be able to track chest motion even when the visibility of the chest is limited by the gamma-camera heads.
- The SPECT and optical acquisitions have to be synchronized.
- The VTS has to be able to capture and store thirty 352×240 gray scale images per second per camera, for up to 30 minutes from the number of cameras selected for use in the VTS.
B. The Visual Tracking System
The overall design of the VTS is presented in figure 1. The main parts of the VTS hardware are discussed in the following. The patient will wear a garment to which highly visible retro-reflective spheres are attached (Figure 2). These spheres are coated with micro glass beads. The diameter (a few dozen micrometers) and the refraction index of the glass beads are such that the incoming light or an infra-red (IR) beam was very efficiently reflected back towards its origin. Note that the spheres on the garment are not radioactive. The garment is a rectangular piece of stretchable black fabric used for swimsuits. The stretchable property ensures that the spheres do not loosely move on the chest. The garment closely fits male and female torsos of different shapes and sizes, without the need for the patient to remove his/her own clothes. The garment is attached on the back with two large Velcro bands, and has no sleeves so that it is easy to take on and off even for patients with an i.v. perfusion in their arm.
Fig. 1.
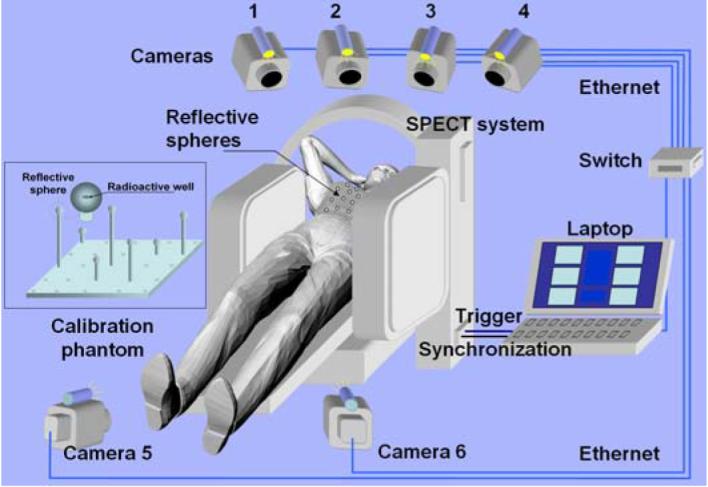
The concept of the visual tracking system (VTS)
Fig. 2.
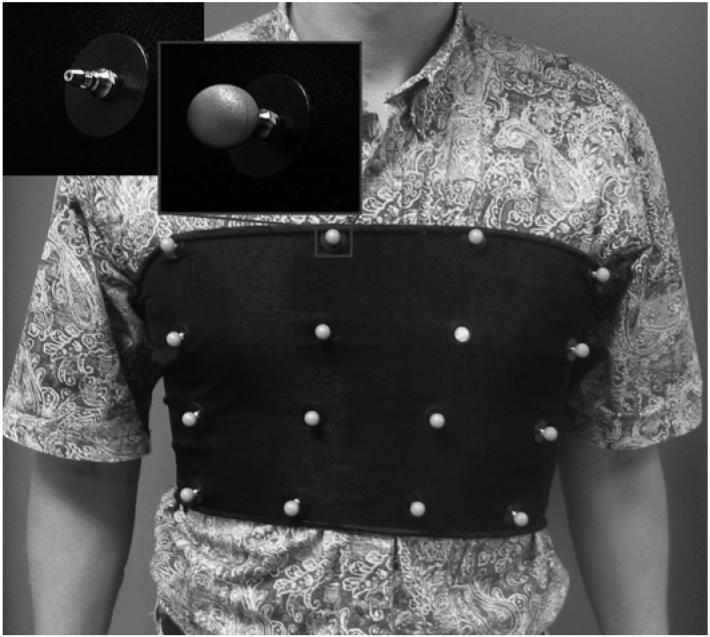
Sixteen highly retro-reflective spheres can be clipped on a garment made of black stretchable fabric. This garment is placed around the chest and the spheres 3D motion is tracked by stereo techniques. Shown as inserts, are a mounting pin with and without sphere attached.
In clinical acquisitions, five Axis PTZ 2130 network cameras (Axis Communications AB, Lund, Sweden) (Figure 3) with pan, tilt and zoom capabilities will be aimed at the patient's chest during the SPECT acquisition. The cameras will be mounted on the walls of the exam room, four from the head and two from the feet of the patient, because the thorax and the abdomen cannot be seen from the same point of view, due to the obstruction of the view by the gamma-camera heads as they rotate around the patient. This is especially the case for obese patients and when body-contouring acquisitions are employed. The light emitted by a LED light source attached to each camera makes the reflective spheres appear in the images as white disks with an excellent contrast relative to the dark background of the garment regardless of room lighting.
Fig. 3.
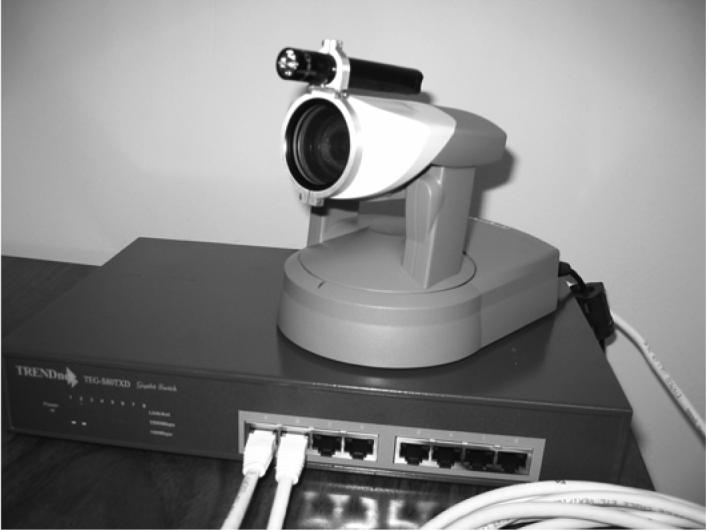
One of the Axis Network Cameras shown sitting on top of the hi-speed switch to which all cameras are attached when in use. On top of the camera is an LED light source. The light source is mounted to the camera, as shown, and moves with the camera during pan and tilt operations.
The 3D location of the reflective spheres detected by the optical cameras was expressed in the SPECT coordinate system thanks to a calibration detailed in the next section. Our current calibration phantom is comprised of seven rods attached to a 25×25 cm black plastic board. Atop of each of the rods is a reflective sphere, whose center can be radioactive (Fig. 4).
Figure 4.
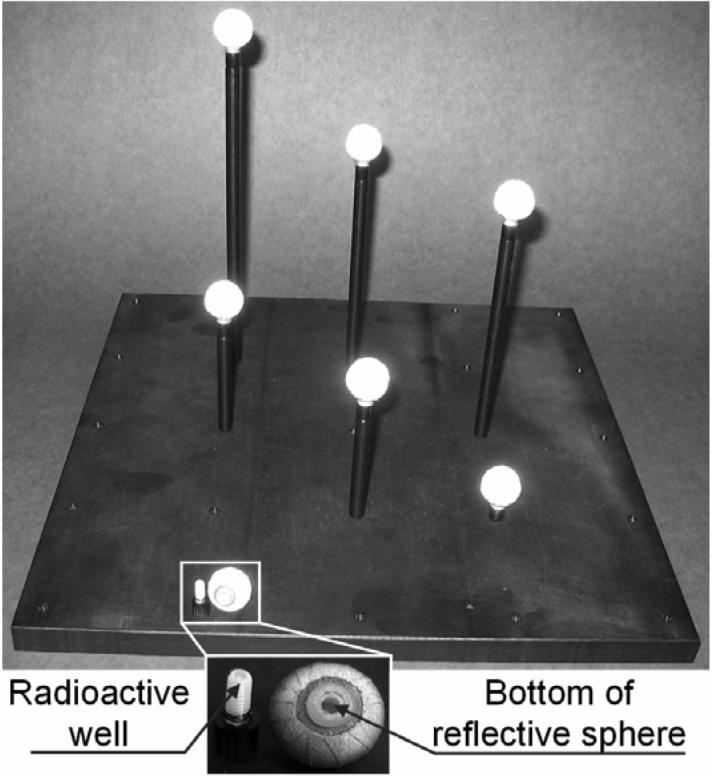
The calibration phantom consists of seven reflective spheres placed on top of rods of various heights with a well in their upper end that could receive a drop of radioactivity. During the calibration step, the phantom is placed in the field of view of the SPECT system. Snapshots are taken with the optical cameras and a SPECT acquisition is performed.
A Labview (National Instruments Co., Austin, TX) program running on a Dell Latitude C840 laptop with Windows XP was used to set the pan, tilt, and zoom of the cameras, to trigger the SPECT acquisition, to synchronize the optical and SPECT acquisitions, and to collect the optical images. The Labview graphical user interface (GUI) is presented in figure 5.
Figure 5.
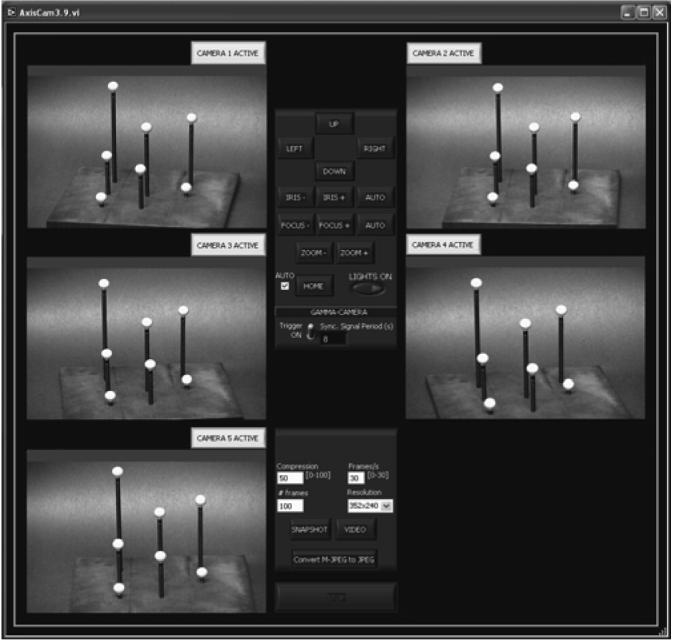
The graphical user interface of the Labview program used to control the cameras and to capture the data streams.
The sequence of events and the synchronization process are presented in figure 6. A square signal with an 8-second period generated by the Labview GUI is recorded in the list-mode file on the SPECT system. The missing parts of this signal are used to determine when the list-mode acquisition actually started (typically about 2 seconds after the triggering signal was sent) and for how long the SPECT system stopped acquiring during each gantry rotation in the step-and-shoot acquisition.
Figure 6.
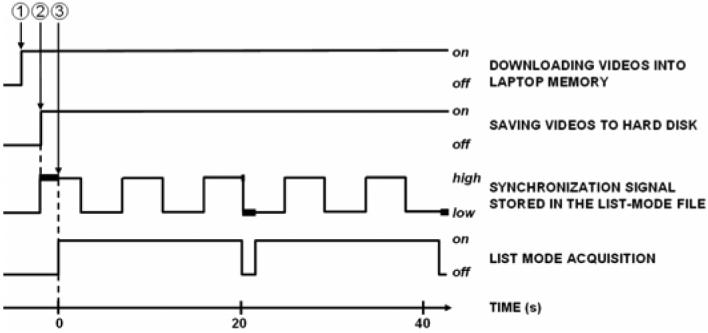
The sequence of events for the VTS/SPECT synchronization
(1) The user initiates the process by clicking a button on a Labview GUI. During the following 2-second period, each optical camera begins sending the Motion JPEG file to the laptop and the synchronization process is initialized.
(2) The Labview GUI sends a trigger signal to start the SPECT acquisition, sends a synchronization signal to be recorded in the SPECT list-mode file, and starts saving the image streams to disks.
(3) The list-mode acquisition actually starts, and is interrupted during each rotation of the detectors in a step-and-shoot acquisition. The parts of the synchronization signal missing (thick lines) in the list-mode file indicated the actual start time and the duration of each rotation when data SPECT data is not acquired.
We described in the above paragraph how to determine the time offset between the beginning of the image streams from the network cameras and the beginning of the list-mode acquisition by the SPECT system. The acquisition time of any optical image since the first image of a stream is determined in the following way. In each Axis camera, a Linux program sends on-the-fly, through a Transmission Control Protocol (TCP) connection, the image stream to the computer as a single file (motion JPEG file). This file is the result of the concatenation of the images as JPEG files. Between two successive JPEG images in the M-JPEG file, the program optionally inserts additional information. We have selected to have the time in ms between the two successive JPEG images inserted with the images. We called this time “delta time” because it is the name used in the Axis camera user's guide. The delta time is very valuable information, since it allows us to know the acquisition time of any image in the stream since the acquisition of the first image of that stream.
Typically the JPEG images (352×240 pixels, 24 bits color, 50% compression) are acquired during the up to 30 minute SPECT acquisition, at a requested rate of 30 frames per second, for a total of 54,000 images per camera. The size of each MJPEG file is about 350 Mbytes. The 100-Mbit network load is less than 10%, and the load of the laptop CPU is typically about 15-25%.
An experiment was conducted to investigate the accuracy of the elapsed time since the start of video acquisition using the delta times from a given camera in the MJPEG file. The cameras were aimed at the monitor of a Linux workstation displaying a digital clock with an accuracy limited by the refresh rate of the monitor (refresh rate 48-160Hz). The actual time (as displayed by the digital clock in the JPEG images) was compared to the time estimated using the delta times as recorded in the MJPEG file from each camera. The degree to which these times agree indicates to what extent this method could be used to accurately monitor elapsed time since the start of acquisition.
In a second experiment, the optical cameras were aimed at the field of view of the SPECT system. Optical and SPECT acquisitions were performed with a point source in the center of a reflective sphere (one of the spheres of the calibration phantom). During SPECT acquisition, this phantom was manually moved 3 times. The JPEG files were extracted from the MJPEG file and the images in which motion occurred were visually determined. The list-mode file was binned into 10 ms images, and the axial center of mass (COM) of the images was computed. The variations of the temporal curve of the COM location indicated the time of the motions. This time was assessed based on the time stamps in the list-mode file and the synchronization signal for the SPECT acquisition, and based on the delta times for the optical acquisitions. Comparison was made between the timing of the motions as recorded from the five cameras and the list mode file to determine the degree of agreement between these events recorded on separate computers.
Finally, we tested the ability of the VTS to track 1, 2 and 5 mm motion of a retro-reflective sphere by comparing the VTS determined motions against the measurements provided by the Polaris stereo IR tracking system (Northern Digital Inc., Waterloo, ON, Canada) (Figure 7) [15].
Figure 7.
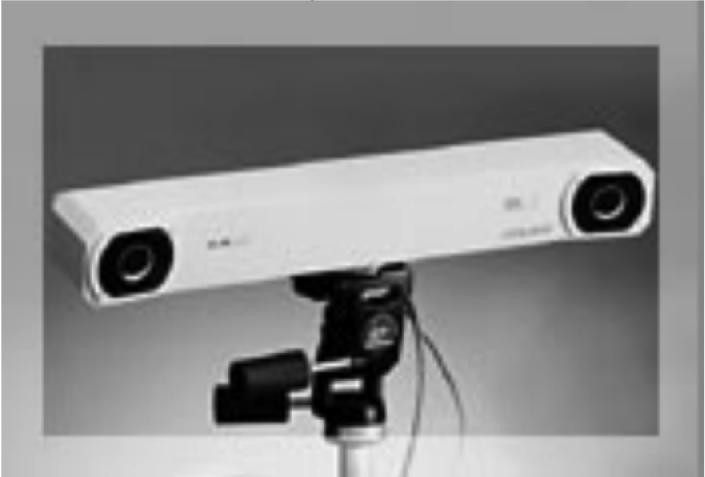
The Polaris IR tracking device. The black rings contains many IR-emitting LEDs. One IR camera is located at the center of each LED ring.
The Polaris system has the ability to report the 3D location of the same reflective spheres used for optical imaging. The 3D locations were reported in millimeters relative to the center of the Polaris coordinate system with stated 0.35 mm accuracy and 0.2 mm reproducibility. Two optical cameras and Polaris were approximately at the same location in the room, the cameras being above Polaris, facing one sphere that was moved five times successively in two directions (away from the cameras and then to the right of the cameras), in 5, 2 and 1 mm steps. The distance between the sphere on one hand, and Polaris and the optical cameras on the other hand was approximately 2 m. Prior to these experiments, the location of the spheres of the calibration phantom was determined by both the VTS and the Polaris system, and a VTS/Polaris calibration was performed based on these locations. No radioactive sources were needed for that experiment. Then, after that calibration step, the ability of the optical cameras to track various 3D motions of the phantom was investigated: the phantom was moved, the X,Y,Z coordinates as given by Polaris were recorded, and snapshots with the 2 optical cameras were taken. After stereo processing, the X,Y,Z coordinates obtained with the optical cameras were obtained. Subtracting the coordinates after motion from the coordinates before motion gave the motion vector.
C. Image processing
In the following, the images of the spheres (appearing as white disks) will be referred to as markers. The JPEG images were extracted from the MJPEG file and decompressed into 24-bit RGB bitmaps. Then, they were binarized using a threshold value to separate the markers from the background. The markers were segmented and their centroids computed. For sake of patient privacy, clinical images will be cropped before being stored on the computer, to show only the markers. The markers were matched between the images, so that the location of each sphere in all images was known. Finally, 3D locations of the spheres in the world coordinate system were found as described below. The world coordinate system can be any system providing 3D coordinates, such as the SPECT system, or in the particular experiment described in section II.B, the Polaris coordinate system.
The goal of stereo processing was to determine the location vector Xw=(xw,yw,zw)t for any reflective sphere on the garment in the world coordinate system using the location (xi, yi)t and (xj, yj)t of the two markers Xi and Xj corresponding to that sphere in the images of two cameras “i” and “j” respectively (figure 8) [16]. Note that superscripts i and j do not refer to the location of a point in an image, but to cameras “i” and “j”. It can be shown [16] that the relationships between Xw, Xi, and Xj are the following:
| [Eq. 1] |
where Mi and Mj are matrices called the calibration matrices for cameras i and j respectively. Notice that there is one calibration matrix M per camera. A solution for Xw can be found by solving Equation 1, when Xi, Xj, Mi, and Mj are known. The Xi and Xj are the centroids of the marker in optical images i and j respectively. Prior determination of matrices Mi and Mj is known as the calibration problem and is presented below.
Figure 8.
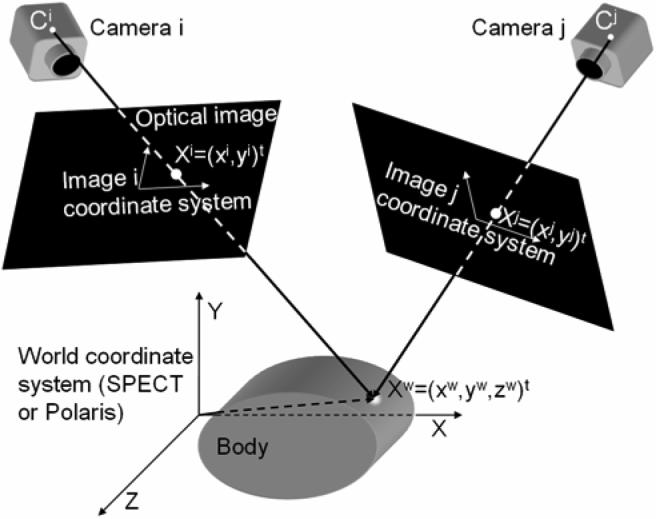
The geometry of a stereo acquisition with the coordinate systems. (xi,yi) and (xj, yj) are the coordinates in images “i” and “j” of the markers corresponding to 3D point located at (xw, yw, zw) in the SPECT or Polaris coordinate system. The origin of the SPECT coordinate system is a corner of the stack of reconstructed SPECT slices. Geometrically, the point Xw is the intersection of the lines passing through the optical centers Ci and Cj of the cameras and the points Xi and Xj respectively.
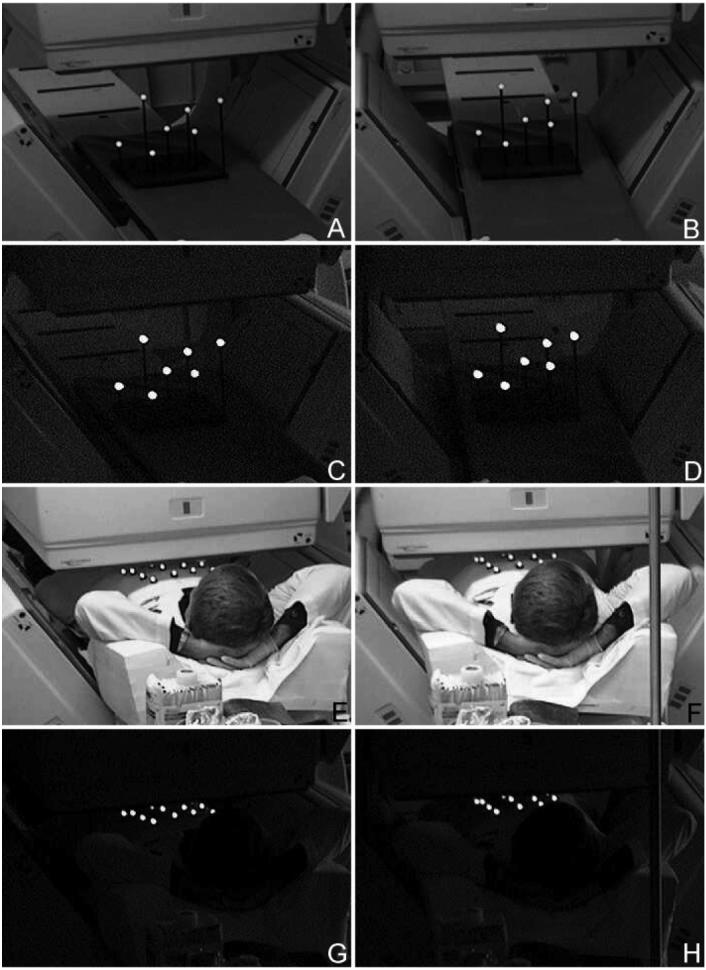
The two columns represent images acquired from each of a stereo pair of cameras. The top row (A and B) are pictures of our calibration phantom laying on the bed of our SPECT system with room lights on. The second row (C and D) shows the visibility of the spheres of the calibration phantom with room lights off. The third row (E and F) shows stereo images acquired with room lights on a volunteer laying in imaging position on the bed of the SPECT system wearing a garment made up of four rows of four spheres each. The last row (G and H) is the same as E and F except the room lights have been turned off. Notice that the spheres are easily visible regardless of room lighting.
The purpose of the VTS/SPECT calibration is to determine the unknown coefficients of the calibration matrix for each camera. Developing the matrix product MiXw=Xi yields two equations for each pair (Xw, Xi), so the SPECT coordinates Xw and the image coordinates Xi of at least 6 points are required. When the world coordinate system is the SPECT coordinate system, we use our calibration phantom presented in figure 4. It consists of 7 retro-reflective spheres whose center can receive a drop of radioactive tracer. This hot phantom is placed in the field of view of the SPECT system. A SPECT acquisition is performed, slices are reconstructed and the centroid of each of the 7 hot spots in the stack of slices are the (xw,yw,zw) coordinates for each of the 7 spheres. When Polaris is used as the world coordinate system, then Xw is simply the 3D coordinates of each of the 7 spheres as given by Polaris. An optical image of the same phantom is taken by camera i and provides the coordinates (xi,yi) of each reflective sphere. With 7 spheres, 7*2=14 equations are formed with 12 unknowns and Mi is found by singular value decomposition.
III. Results
An illustration of the images obtained with the optical cameras is presented in figure 8. The location of the cameras was selected as that which allowed visualization of the patient's anterior surface at least part way under the camera heads as they rotate during SPECT acquisition. Having computer control of the pan/tilt/optical zoom of the cameras greatly facilitated their configuration. The reflective spheres were clearly seen on the images as white disks, no matter the angle of view, thus facilitating the determination of their location. The contrast was more than sufficient with ambient lights off or on. The spheres located on the upper part of the chest were visible even when the heads of the gamma-camera were as close as they are in clinical routine.
Table I illustrates the typical results for one camera in terms of being able to accurately keep track of the time since the start of recording the video images to disk. Results with the other cameras (not shown) are similar. The actual time (as displayed by the digital clock in the JPEG images) is compared to the time estimated using the times between successive images (delta time). The difference is 30ms or less, showing that using the delta time is an accurate way to find the time each image is acquired.
Table I.
Comparison of actual and estimated times in a synchronization test
| Image # | Actual time (s) | Estimated time (s) |
|---|---|---|
| 10,000 | 333.66 | 333.64 |
| 20,000 | 667.35 | 667.32 |
| 30,000 | 1001.07 | 1001.04 |
| 40,000 | 1334.77 | 1334.76 |
| 50,000 | 1668.52 | 1668.54 |
| 54,000 | 1802.08 | 1802.10 |
Recording images of a red LED which is turned on when the synchronization signal (Fig. 5) is high was used to investigate the delay between initiating the recording of streams to disk and sending of the synchronization signal to the SPECT. This LED was on in the first or second image of each stream, thereby demonstrating the temporal synchrony between these.
The results for determining the time of motion of the single reflective sphere with Tc-99m in the video streams from the 5 cameras and the list-mode file of the SPECT system are presented in table II. There it can be seen that the motions are recorded within a 150 ms range for all five network cameras and the list-mode file of the SPECT system, thereby demonstrating that synchronization can be achieved between SPECT and optical acquisition with this accuracy.
Table II.
Time of motions (in S) since the beginning of the SPECT acquisition.
| 1st motion | 2nd motion | 3rd motion | |
|---|---|---|---|
| SPECT | 181.51 | 258.65 | 616.68 |
| Cam 1 | 181.48 | 258.53 | 616.76 |
| Cam 2 | 181.53 | 258.57 | 616.79 |
| Cam 3 | 181.48 | 258.52 | 616.75 |
| Cam 4 | 181.50 | 258.55 | 616.77 |
| Cam 5 | 181.49 | 258.54 | 616.73 |
The results of testing the ability of the VTS to track 1, 2 and 5 mm motion of a sphere by compared to measurements provided by the Polaris stereo IR tracking system are presented in Table III. Note there that the standard deviation in the experiments includes the ability of the experimenter to manually move the phantom by very small amounts in a reproducible fashion. It is not just a measure of the intrinsic reproducibility of the two systems. Thus the agreement between the two systems is excellent indicating that the VTS can accurate measure motions on the order of a 1mm which is quite sufficient compared to the typical spatial resolution of SPECT systems. In a typical optical image, the pixel size was 1.3 mm depending on zoom. This is not contradictory with our accuracy of about 1mm, because the centroid, and not the center, of the reflective spheres is used, and the centroid can be determined in the optical images with a sub-pixel accuracy.
Table III.
Comparison of Motions assessed by the VTS and the Polaris (Mean +/− SD - N=5, in mm)
| Left to right motion | Forward to backward motion | ||
|---|---|---|---|
| VTS | Polaris | VTS | Polaris |
| 5.01+/− 0.38 | 5.02+/− 0.09 | 5.01+/−0.11 | 5.05 +/− 0.10 |
| 2.08 +/− 0.14 | 2.04+/− 0.12 | 2.00+/− 0.15 | 2.01 +/− 0.12 |
| 1.11 +/− 0.13 | 1.03+/− 0.07 | 1.25+/−0.23 | 1.11+/− 0.16 |
IV. Discussion
When performing motion correction, we plan to first compensate for rigid-body motion before correcting respiratory motion. The rigid-body motion information as determined by the stereo optical cameras will be incorporated in ordered-subset expectation-maximization (OSEM) reconstruction as part of the projection and backprojection steps as described in [14]. Our approach [14] is derived from the ideas proposed by Fulton et al. [17] and Kyme et al. [18]. The basic principle is that each data set is successively included into the reconstruction process. Following each inclusion, the current reconstructed data set is reoriented so that it matches the next projection data set. The steps of the algorithm are:
Combine all the data sets together and reconstruct a motion-uncorrected set of slices.
Reorient the slices and forward project them until the computed projections match a measured projection data set.
Reconstruct a respiratory dataset using the optimally reoriented slices as an initial estimate.
Repeat steps 2 and 3 for the remaining projection data sets.
The VTS has demonstrated its ability to acquire large amounts of data at a sustained rate with no CPU or network overload or bottleneck. Actually, the network and the CPU were far from overwhelmed by the amount of data, despite a rate of 30 frames per second. This leaves room for future improvements in terms of additional optical cameras, or increased image size and/or quality. As we have shown, a resolution of 352 × 240 pixels in the JPEG images is sufficient for the VTS to track motions of about 1mm; however an even finer sampling might be desirable.
The VTS/SPECT synchronization can be tricky and has been carefully designed and tested, because neither Windows nor Linux are real-time operating systems. In the present work, we show that an excellent synchronization between the acquisitions of the optical cameras and the SPECT system can be achieved.
The VTS uses light (as opposed to IR) to locate the spheres, and this solution has proven to be simple and efficient. One advantage of IR is its independence from room lighting. We have shown that by use of a retro-reflective coating on spheres (as used by IR systems) and an LED light source mounted on the network cameras that our VTS can also operate independent of room lighting (Figure 8). Another potential advantage of IR systems is that they do not collect a picture of the patient. We will add to the VTS masking of all but the regions of the spheres being tracked to overcome this potential problem in terms of patient privacy.
Acknowledgments
This work was supported by the National Institute of Biomedical Imaging and Bioengineering under grant R01-EB001457. The contents are solely the responsibility of the authors and do not necessarily represent the official views of the NIBIB.
V. References
- 1.Tsui BMW, Segars WP, Lalush DS. Effects of upward creep and respiratory motion in myocardial SPECT. IEEE Trans. Nucl. Sci. 2000;47(3):1192–1195. [Google Scholar]
- 2.Eisner RL, Noever T, Nowak D, Carlson W, Dunn D, Oates J, et al. Use of cross-correlation function to detect patient motion during SPECT imaging. J. Nucl. Med. 1987;28(1):97–101. [PubMed] [Google Scholar]
- 3.Geckle WJ, Frank TL, Links JM, Becker LC. Correction for patient and organ movement in thallium-201 cardiac imaging. J. Nucl. Med. 1988;29:441–450. [PubMed] [Google Scholar]
- 4.Arata LK, Pretorius PH, King MA. Correction of organ motion in SPECT using reprojection data; Proc. IEEE Nuclear Science Symp. Medical Imaging Conf; 1995. pp. 1456–1460. [Google Scholar]
- 5.O'Connor MK, Kanal KM, Gebhard MW, Rossman PJ. Comparison of four motion correction techniques in SPECT imaging of the heart: a cardiac phantom study. J. Nucl. Med. 1998;39(12):2027–2034. [PubMed] [Google Scholar]
- 6.Matsumoto N, Berman DS, Kavanagh PB, Gerlach J, Hayes SW, Lewin HC, et al. Quantitative assessment of motion artifacts and validation of a new motion-correction program for myocardial perfusion SPECT. J. Nucl. Med. 2001;42(5):687–694. [PubMed] [Google Scholar]
- 7.Fulton RR, Eberl S, Meikle SR, Hutton BF, Braun M. A practical 3D tomographic method for correcting patient head motion in clinical SPECT. IEEE Trans. Nucl. Sci. 1999;46(3):667–672. [Google Scholar]
- 8.Fulton RR, Meikle SR, Eberl S, Pfeiffer J, Constable RT, Fulham MJ. Correction for head movements in positron emission tomography using an optical motion-tracking system. IEEE Trans. Nucl. Sci. 2002;49(1):116–123. [Google Scholar]
- 9.Buhler P, Just U, Will E, Kotzerke J, van den Hoff J. An accurate method for correction of head movement in PET. IEEE Trans. Med. Imag. 2004;23(9):1176–1185. doi: 10.1109/TMI.2004.831214. [DOI] [PubMed] [Google Scholar]
- 10.Gennert MA, Bruyant PP, Narayanan MV, King MA. Detecting patient motion in SPECT imaging using stereo optical cameras. J. Nucl. Med. 2002;43(5 Supp):222P. [Google Scholar]
- 11.Gennert MA, Bruyant PP, Narayanan MV, King MA. Calibrating optical images and gamma-cameras images for motion detection. J. Nucl. Med. 2002;43(5 Suppl):222P. [Google Scholar]
- 12.Gennert MA, Bruyant PP, Narayanan MV, King MA. Assessing a system to detect patient motion in SPECT imaging using stereo optical cameras; Proc. IEEE Nuclear Science Symp. Medical Imaging Conf; 2002. pp. 1567–1570. [Google Scholar]
- 13.Morgenstern JD, Gennert MA, Nadella S, Kumar N, Speckert GC, Bruyant PP, King MA. A real-time multi-threaded system to detect motion in SPECT imaging using multiple optical cameras; Proc. IEEE Nuclear Science Symp. Medical Imaging Conf; 2004. submitted. [Google Scholar]
- 14.Boening G, Bruyant PP, Beach RD, Byrne CL, King MA. Motion correction for cardiac SPECT using a RBI-ML partial reconstruction approach; Nucl. Sci. Symposium Med. Imaging Conf. 2004; Rome, Italy. October 16-22, 2004; contribution M4-6. [Google Scholar]
- 15.Beach RD, Pretorius PH, Boening G, Bruyant PP, Feng B, Fulton RR, Gennert MA, Nadella S, King MA. Feasibility of stereo-infrared tracking to monitor patient motion during cardiac SPECT imaging. IEEE Trans. Nucl. Sci. 2004;51(5):2693–2698. doi: 10.1109/TNS.2004.835786. [DOI] [PMC free article] [PubMed] [Google Scholar]
- 16.Trucco E, Verri A. Introductory techniques for 3-D computer vision. Prentice-Hall; Upper Saddle River, New Jersey 07458, USA: 1998. [Google Scholar]
- 17.Fulton RR, Hutton BF, Braun M, Ardekani B, Larkin R. Use of 3D reconstruction to correct for patient motion in SPECT. Phys Med Biol. 1994;39:563–574. doi: 10.1088/0031-9155/39/3/018. [DOI] [PubMed] [Google Scholar]
- 18.Kyme AZ, Hutton BF, Hatton RL, Skerett DW, Barnden LR. Practical aspects of a data-driven motion correction approach for brain SPECT. IEEE Trans. Med. Imag. 2003;22(6):722–729. doi: 10.1109/TMI.2003.814790. [DOI] [PubMed] [Google Scholar]


