

1. Introduction
The interplay between nuclear and mitochondrial genomes creates a variety of presentations of mitochondrial disease that makes diagnosis difficult (Zeviani and DiDonato, 2007). Patients can have non-specific symptoms and even those patients with clinical findings compatible with known mitochondrial syndromes often have mixed etiologies. Therefore, although the recent advances in genetics have provided both the diagnostic tools and pathogenic insights into many mitochondrial disorders, the majority of patients suspected on clinical grounds to have a mitochondrial disease, require a combination of modalities for diagnostic confirmation (Hass et al., 2007; Thorburn et al., 2004).
In addition to the etiologic complexity of clinical diagnosis, the progressive and fluctuating course of mitochondrial disease can result in variable presentation. Due to this heterogeneity, it is not surprising that multiple systematic approaches to diagnosis exist; all of which use a combination of clinical, biochemical and structural criteria (Morava et al., 2006; Bernier et al., 2002; Wolf and Smeitink, 2002; Nonaka 2002; Nissenkorn et al., 1999; Walker et al., 1996). Most patients with mitochondrial disease demonstrate neurological symptoms and central nervous system findings that provide the foundation of diagnostic protocols. Although neurological symptoms often lead to the initial clinical referral, magnetic resonance imaging (MRI) plays an important role in interrogating the presence and pattern of central nervous system changes. As expected in this broad group of patients suspected to have a mitochondrial disease, MRI can reveal “signature” disease features, non-specific abnormalities, or a brain that appears structurally normal (Kinopoulous et al., 2005, Barragan-Campos et al., 2005; Munoz et al., 1999; Valanne et al., 1998). Metabolic and oxidative defects in mitochondrial disease can be further probed using magnetic resonance spectroscopy (MRS), which measures brain chemistry present in the millimolar (mM) range. Combined with clinical indices, these structural and biochemical probes can aid in identifying and characterizing a specific disorder. Due to the extremely safe and non-invasive nature of MRI and MRS, it is well suited to follow and evaluate disease progression, and to monitor therapeutic changes in these metabolic markers. The studies described below provide a detailed overview of the specific and non-specific changes in MRI and MRS shown to occur in mitochondrial disorders to date.
Prior to the availability of MRI, computed tomography (CT) was the mainstay for neuroimaging. Though MRI is more sensitive for detection of most pathology, CT can be useful for some pathological findings of mitochondrial disease, particularly in detecting calcification. With this in mind, we will concentrate on MRI and MRS and their use in mitochondrial disease.
2. Background of MRI
MRI is based on a physics phenomenon discovered in the 1930s, called nuclear magnetic resonance or NMR, which was initially developed as an analytical chemistry tool. NMR is based on the quantum mechanical property of spin possessed by protons and neutrons. Atomic nuclei with an odd number of protons have a net spin, a proportion of which, when placed in a magnetic field a subset of protons will align in one of two energy states. Slightly more nuclei will align with the field in the low energy state (said to be “aligned” with the field), than in the high energy state (said to be “aligned” against the field). Energy in the form of radiofrequency (RF) electromagnetic radiation at the correct frequency (Larmour frequency) will induce an increased number of the nuclei spins to orient in the higher energy state. Nuclei that absorb this energy will then emit it, in the form of radio signals, when the RF is turned off. The strength of each emitted radio signal is proportional to the concentration of the originating nucleus as well as the specific nucleus and the magnetic field strength. The exact position of the emitted signal in its possible radiofrequency range depends on the molecule in which the nucleus is located because of interactions with neighboring nuclei as well as other micro-environmental factors.
The development of spatial localization of nuclear magnetic resonance signals (Lauterbur, 1973), allowed for methods to form images from those signals (Garroway et al., 1974) and the production of large magnets, led to the development of what is now used for clinical MRI.
MRI creates high-resolution anatomic images using primarily the bulk hydrogen signals primarily from fat and water. It is also possible to utilize MRI to create images that exploit differences in micro-environmental properties between tissues. Clinically, it is common to collect images sensitive to transverse or longitudinal relaxation (T2 and T1, respectively), inherent properties of how tissues relax in the magnet, as well as techniques such as FLAIR (fluid-attenuated inversion recovery) which can accentuate particular tissue water states. For example, lesions characterized by edema demonstrate prolongation of T2 relaxation (therefore bright on T2-weighted sequences), darker on T1-weighted sequences and usually bright on FLAIR. Lesion blood products in certain states exhibit shortening of T1, which results in increased signal on T1-weighted sequences. Other sequences can also be tailored to be sensitive to the Brownian motion of water which is restricted in edema associated with acute ischemia (cytotoxic edema) and contrastingly increased in vasogenic and interstitial edema (i.e. seen in subacute ischemia, tumors and trauma). This imaging type called diffusion weighted imaging (DWI) can be of particular use in determining whether new ischemic lesions are present in the setting of multiple abnormalities. Of note is that diffusion imaging is typically viewed in trace images where areas of restricted diffusion appear bright. This needs to be confirmed by comparing to the associated apparent diffusion coefficient (ADC) images, which should demonstrate a corresponding dark area as the trace images can be bright just on the basis of a lesion, which is very bright on T2, so called ‘T2 shine through’. Though a detailed discussion of these imaging sequences and clinical relevance of various contrast patterns are beyond the scope of this review, changes where noted reflect abnormality in signal intensity compared to healthy control subjects or in some cases normal appearing tissue (e.g. lesion versus bordering normal tissue).
MR sequences can also be tailored to measure hydrogen atoms in molecules other than water; similar to the analytical chemistry techniques NMR was initially exploited. These sequences are termed Magnetic Resonance Spectroscopy (MRS or 1H MRS when explicitly detecting hydrogen as opposed to other nuclei) or in the case of multivoxel MRS also termed Chemical Shift Imaging (CSI) or magnetic resonance spectroscopy imaging (MRSI). Using resolution less than in MRI, in vivo MRS is sensitive to molecules in the 1 − 10 mM concentration range. Again, the details and limitations of MRS is beyond the scope of this review but several pathologically important molecules or combination of molecules are or can be present in mM concentrations within brain, most notable in investigation of mitochondrial disease being lactate.
MR sequences can also be tailored to be sensitive to motion. This is exploited to image flowing blood in MR angiography (MRA). Though catheter angiography remains the gold standard, often valuable information can be gained from MRA without the small but present risks of catheter angiography. In particular, MRA can be used to rule out significant vascular lesions in medium and large cerebral vessels when appropriate.
MRI is the mainstay of radiological evaluation of anatomic structures in neurometabolic disorders. Due to the variability of brain changes and the evolving nature of mitochondrial disease, MRI may not have a high sensitivity or specificity for disease diagnosis (Valanne et al., 1998; Barkovich et al., 1995; van der Knaap et al., 1996;), though some disease types are more separable from others (Farina et al., 2002; Castillo et al., 1995).
3. MRI: Specific and Non-specific Changes in Mitochondrial Disease
Though most of the brain imaging abnormalities in patients with mitochondrial disease is non-specific, the pattern of these abnormalities can often be suggestive of metabolic disease. Non-specific global MRI abnormalities or structural changes of the brain are common in patients with mitochondrial disorders. The most common is a global delay in myelination pattern early in the course of the disease with “catch-up” as development continues (Dinopoulos et al., 2005; Munoz et al., 1999; Valanne et al., 1998). Recently, delayed myelination was not found to be an isolated finding in idiopathic developmental delay (Maricich et al, 2007), suggesting the presence of delayed myelination might be an abnormal metabolic process. Therefore, when a delayed myelination pattern is detected in the context of a clinical picture of a possible mitochondrial disorder, further work-up may be warranted.
Several studies have demonstrated that mitochondrial disease patients with clinical central nervous system involvement usually have non-specific MRI detected abnormalities (Valanne et al., 1998; Barragán-Campos et al., 2005). However, it is those patients without central nervous system involvement, such as those with pure myopathy that can demonstrate a normal MRI (Dinopoulos et al., 2005). Even those patients with central nervous system involvement can have normal MRI depending on the timing of MRI scan.
There are certain MRI findings that are sensitive and quite suggestive in diagnosis of mitochondrial disease. The most common specific MRI findings are a symmetrical signal abnormality of deep gray matter presenting with hyperintensity on T2 and FLAIR images, and hypointensity on T1 images. Any deep structure can be involved and the character of the lesion can be either patchy or homogeneous. Cerebral and cerebellar atrophy may be present in varying degrees. These specific MRI findings are more likely to be associated with syndromic phenotypes as detailed below.
3.1. Leigh Syndrome
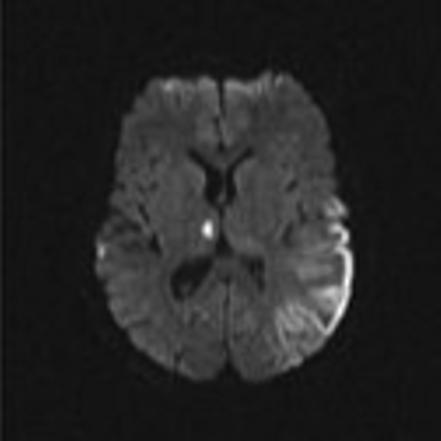
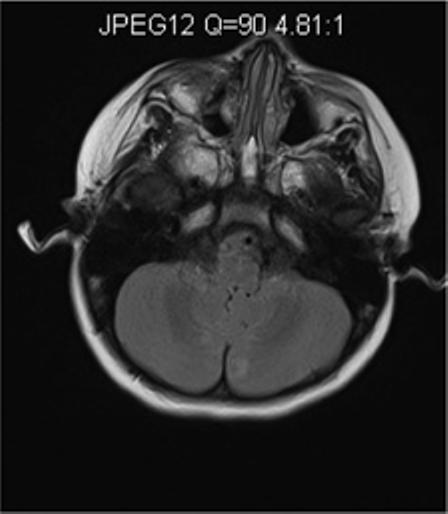
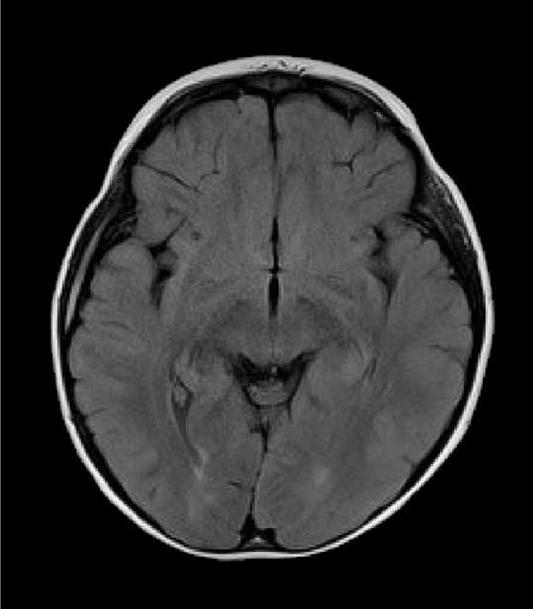
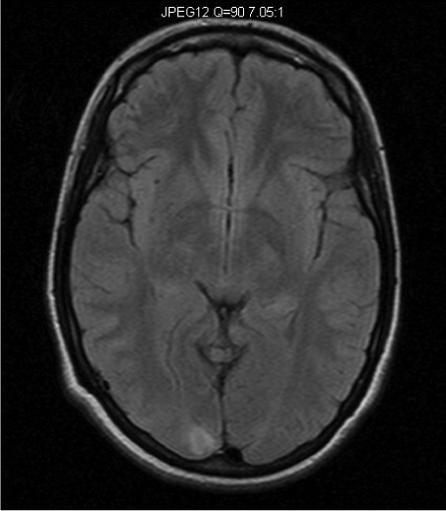
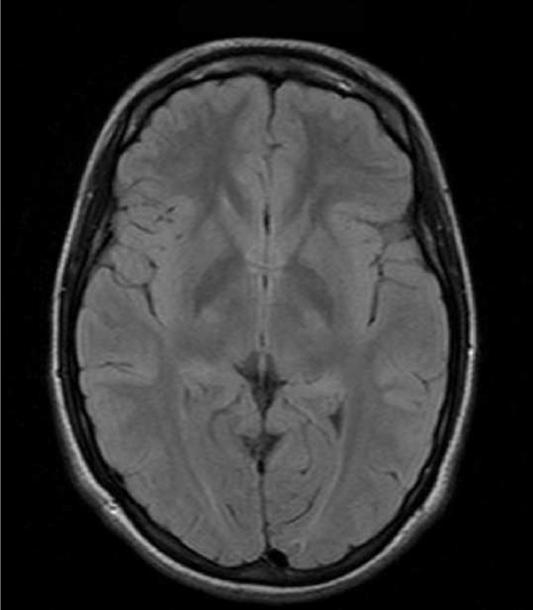
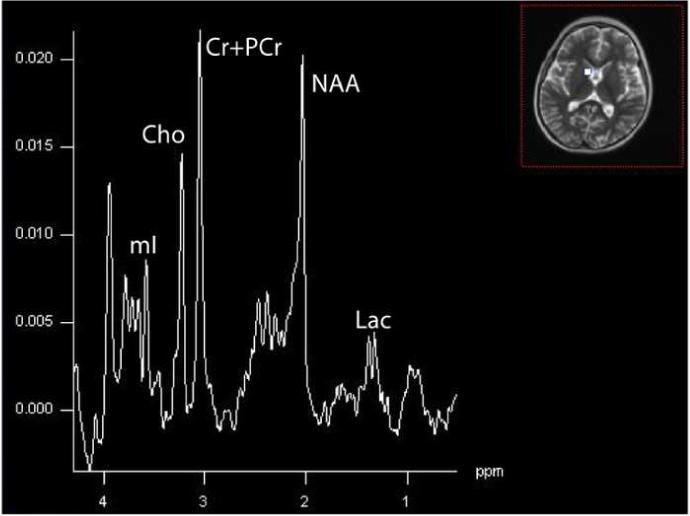
Leigh syndrome or subacute necrotizing encephalomyelopathy is the prototype mitochondrial disease, with hallmark neuroimaging findings. It is a progressive degenerative disorder caused by mitochondrial DNA (mtDNA) or nuclear DNA (nDNA) mutations that affect infants, children, and sometimes adults (DiMauro 2004). Clinical presentation can include global developmental delay, feeding and swallowing difficulties, vomiting, spasticity, brainstem dysfunction, dystonia, abnormal eye movements and multiple organ involvement. Denis Leigh described the neuropathological features of focal, bilateral, and symmetric necrotic lesions associated with demyelination, vascular proliferation and gliosis in the brain stem, diencephalon, basal ganglia, and cerebellum (Leigh, 1951). MRI demonstrates progressive signal abnormalities, most frequency in the lentiform nuclei and caudate nuclei, but abnormalities involving the thalamus, periaquiductal gray, tegmentum, red nuclei and dentate nuclei are also commonly seen. (Figure 1). The MRI high T2 signal reflects the spongiform changes and vocuolation in these deep gray structures. In most cases the white matter is generally preserved, but in some cases there is extensive gliosis and cystic degeneration. The volumes of the lesion(s) are preserved on follow-up studies, in sharp contrast to the cerebral organic acidurias that lead to severe global degeneration. In some cases of Leigh syndrome, a marked global atrophy over time can be seen, although basal ganglia lesions appear preserved. As seen in Figure 1D and 1E, as the disease progresses, basal ganglia can also show volume loss.
Figure 1.
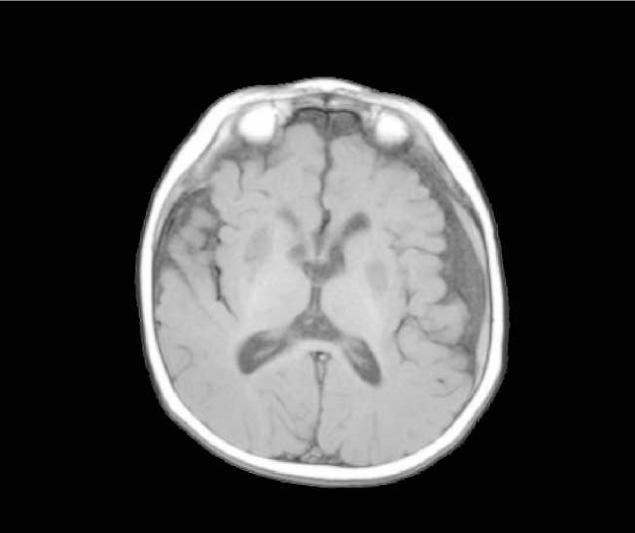
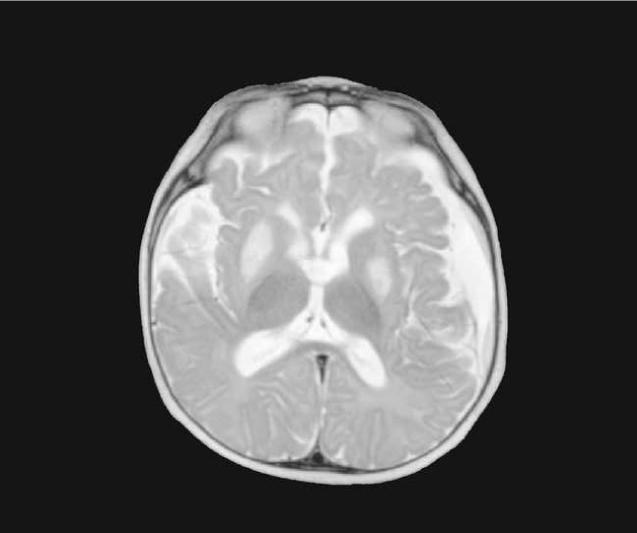
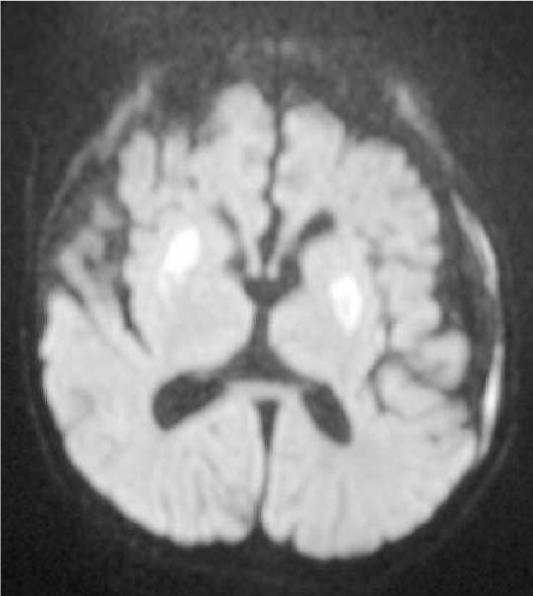
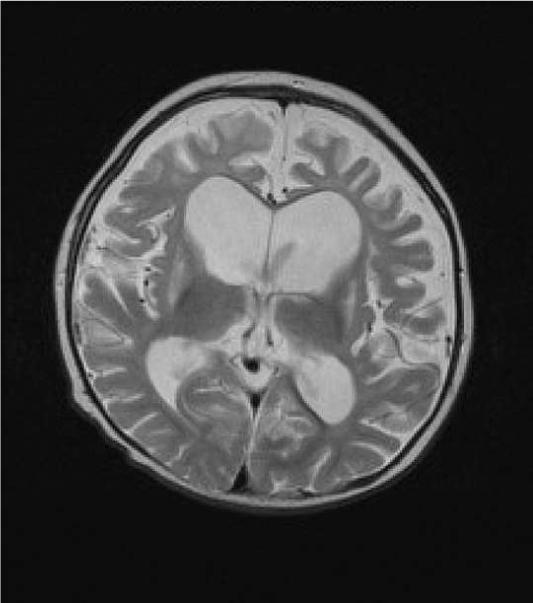
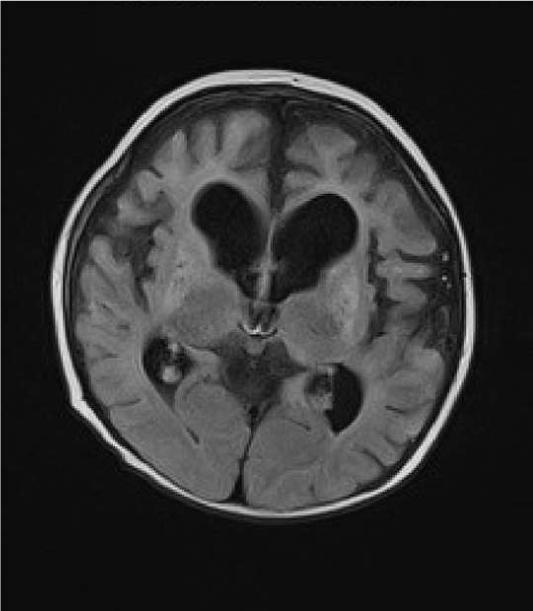
MRI and MRS from a boy with Leigh Syndrome. At 7 months bilateral putamenal lesions demonstrate low signal intensity on T1 weighted (Figure 1A) and hyperintensity on T2 weighted (Figure 1B) images while a diffusion weighted image ( Figure 1C) demonstrates hyperintensity reflecting restricted diffusion typical of acute ischemia in the putamen. Follow up imaging at 19 months demonstrates focal atrophy of the putamen and as well as generalized atrophy on T2 weighted (Figure 1D) and FLAIR imaging (Figure 1E), and increased lactate in the putamen (arrow) on MRS (see figure 8)
MRI findings may suggest distinct etiologies of Leigh syndrome. MRI scans of patients with SURF-1 mutations have lesions in the brain stem, subthalamic nuclei, and possibly cerebellum with few patients having basal ganglia abnormalities (Farina et al., 2002). Patients with Leigh syndrome from other etiologies have T2 hyperintensities in the putamina with involvement of the caudate nuclei, globus pallidi, thalami, and brain stem, while some patients with diffuse supratentorial white matter changes (Farina et al., 2002; Valanne et al., 1998). Symmetric involvement of deep gray structures in the absence of hypoxia, ischemia, or infection is highly suspicious for mitochondrial defect. Added justification for further work-up would be lactate peaks in the area of MRI abnormality on 1H-MRS.
In a small percentage of patients with Leigh syndrome, MRI displays a diffuse supratentorial leukodystrophy involving the deep lobar white matter. There is initial swelling that is followed by cystic degeneration (Lerman-Sagie et al., 2005). The progression is posterior to anterior and involves the posterior part of the centrum semiovale and of the corpus callosum (Moroni et al., 2002).
3.2. Mitochondrial myopathy, encephalopathy, lactic acidosis, and stroke-like episodes
Mitochondrial myopathy, encephalopathy, lactic acidosis and stroke-like episodes (MELAS) is a progressive neurodegenerative disorder associated with headache, treatment resistant partial seizures, short stature, muscle weakness, exercise intolerance, deafness, diabetes, and slow progressive dementia (Paviakis et al., 1984; Hirano et al., 1994). Approximately 80% of patients have a mutation, Adenine to Guanine transition at the tRNA for Leucine at position 3243 in the mtDNA (Goto et al., 1990). There are other genotypic etiologies of MELAS involving other mitochondrial DNA mutations as well as nuclear DNA mutations (Malfatti et al., 2007; Janssen et al., 2006). Age of onset varies but most all patients present before 40 years of age. Migraine with nausea and vomiting is common and often precedes stroke-like events. Partial seizures and uncommonly epilepsia partialis continua also often accompany these events (Ribacoba et al., 2006). On the MRI, the stroke-like lesions are often transient and lesions predominantly affect gray matter and not confined to vascular territories are the imaging landmarks of MELAS (Figure 2) (Matthews et al., 1991; Hirano et al., 1992; Barkovich et al., 1993).
Figure 2.
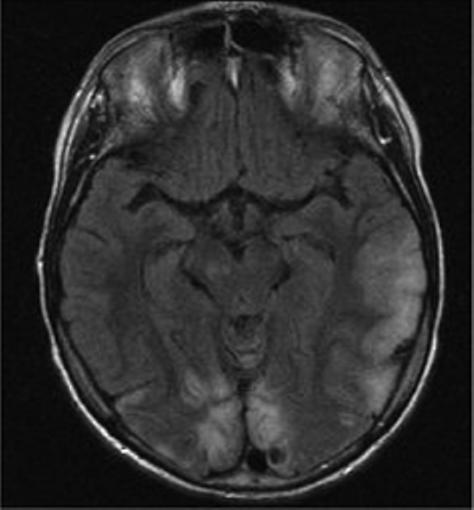
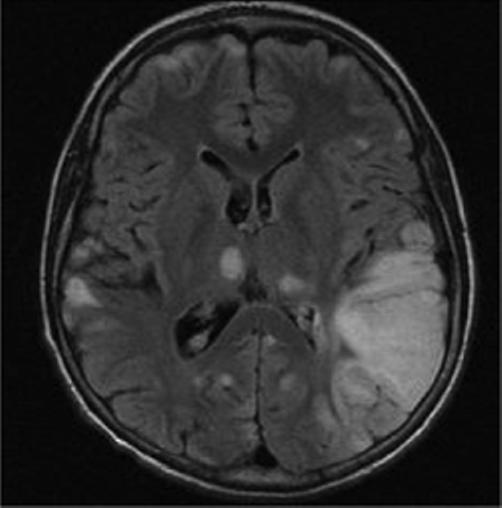
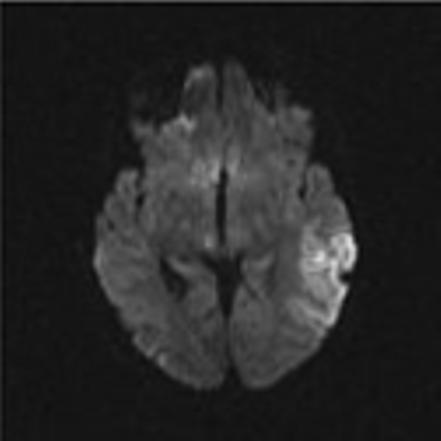
Axial MR images in a child with MELAS lesions. Patient is a 10 year old boy with a complex I and III defect without the mitochondrial DNA mutation at position 3243. Although he has phenotypic MELAS, he has another unknown genotypic etiology of MELAS. Axial FLAIR imaging through the level of the midbrain (Figure 2A) and basal ganglia (Figure 2B) demonstrates hyperintense lesions bilaterally in the thalami and occipital cortex as well as an extensive area of abnormality involving the left posterior temporal- parietal lobe and a small area in the right parietal operculum. Corresponding diffusion weighted images (Figure 2C and Figure 2D) demonstrate restricted diffusion in the right thalamic, right opercular and left temporal-parietal lesions consistent with acute ischemia, but not in occiptial and left thalamic area abnormal on the FLAIR imaging, suggesting these are likely older lesions. Note also that the diffusion abnormality in the temporal-parietal lesion is concentrated in the gray matter.
Diffuse white matter lesions have occasionally been observed in MELAS usually involving periventicular white matter and centrum semiovale though involvement of the corpus callosum has also been observed (Apostolova et al., 2005; Castillo et al., 1995). Chronic lesions display T2 and FLAIR signal hyperintensities with a normal to slightly increased apparent diffusion coefficient (Yonemura et al., 2001; Oppenheim et al., 2000). Acute ischemic stroke episodes show hyperintense T2 and FLAIR signal however, there is a significant reduction in apparent diffusion coefficient (Schlaug et al., 1997). Therefore DWI sequences during the acute event can differentiate these two types of events revealing chronic and acute nature of different lesions providing a critical component to the diagnostic work-up. While these MRI lesions are characteristically fluctuating, as the lesions are not secondary to ischemia. MR angiography will be normal. In isolated cases, the basal ganglia may be solely involved (Kim et al., 1996) and other electron transport chain defects may show stroke-like brain lesions that do not meet the criteria for the full MELAS. Therefore, multiple diagnostic modalities beyond imaging alone are needed to properly diagnose MELAS from other mitochondrial disorders.
3.3 Kearns-Sayre syndrome/Pearson syndrome
Kearns and Sayre first describe the syndrome named after them as a progressive external ophthalmoplegia associated with atypical retinal pigmentary degeneration and heart block (Kearns and Sayre, 1958). Kearns-Sayre syndrome (KSS) is a sporadic neurodegenerative disorder that present before 20 years of age with progressive external ophthalmoplegia and ptosis as well as other organ involvement including pigmentary retinopathy, complete heart block, myopathy, cardiomyopathy, sensorineural hearing loss, mental retardation, and endocrine problems. Muscle tissue contains ragged red fibers. Southern blot analysis of mtDNA demonstrates multiple DNA deletions that are typically heteroplasmic for the rearrangement (Zeviani et al., 1988).
Pearson syndrome was first described in 4 patients with refractory sideroblastic anemia with vacuolization of marrow precursors and exocrine pancreatic dysfunction (Pearson et al., 1979). Since the initial report, small deletions, mostly between 4,799 and 5,500 base pairs of mitochondrial DNA have been shown responsible for Pearson syndrome (Rotig et al., 1989; McShane et al., 1991). Interestingly, there are some patients surviving with spontaneous remission of infantile sideroblastic anemia, only to subsequently develop the features of KSS (Larsson et al., 1990; Rotig et al., 1990).
The typical histopathological finding is status spongious involving both gray and white matter. Most often the brainstem tegmentum, basal ganglia and white matter of the cerebrum and cerebellum are involved. The most common brain MRI findings are cerebral and cerebellar atrophy often with T2/FLAIR hyperintense bilateral lesions observed in subcortical white matter, thalamus, basal ganglia (substantia nigra and globus pallidus) and brainstem (Wray et al. 1995; Leutner et al., 1994). Subcortical cerebral white matter often is abnormal (Lerman-Sagie et al., 2005). However, basal ganglia involvement has not been shown in all studies (Barragan-Campos et al., 2005). Thus, subcortical white matter lesions and the involvement of one or more of the brainstem nuclei, basal ganglia and thalami lesions affected might best characterize KSS (Chu et al., 1999; Lerman-Sagie et al., 2005). The involvement of the subcortical U fibers with sparing of the periventricular white matter differentiates it from most lysosomal and peroxisomal disorders where subcortical regions are only affected late in the disease (Valanne et al., 1998).
3.4 Alpers Syndrome
Alpers syndrome is a severe hepatocerebral disease associated with mtDNA depletion that presents at various ages depending of the type of mutation within the polymerase gamma 1 gene (POLG). Those patients harboring compound heterozygote mutations, usually one of which within the linker region, have a more severe disease phenotype with onset before 2 years of age. Patients having homozygous mutations within the linker region usually have a later onset and milder form of Alpers syndrome. Mutations in the mitochondrial replicative helicase Twinkle have also been shown to elicit a phenotype reminiscent of Alpers syndrome (Hakonen et al., 2006). Thus, suggesting that there may be other etiologies as well.
Typically patients with Alpers syndrome have refractory seizures, psychomotor regression, and a characteristic liver disease (Naviaux and Nguyen, 2004). Valproic acid can trigger liver failure (Tzoulis et al., 2006). However, there is a wide variety of phenotypic expression involving multisystemic symptoms and signs varying in onset from infancy to adulthood and in severity from infantile Alpers syndrome to slowly progressive external ophthalmoplegia and ataxia, depending on where in the POLG gene mutations occur (Tzoulis et al. 2006; Horvath et al., 2006).
Neuropathological findings show extensive gliosis and neuronal loss predominantly in the occipital cortices and cerebellar cortex (Purkinje cells) and necrosis of subcortical deep nuclei, hippocampi, lateral geniculate body of the thalamus, and amygala (Harding, 1990). The MRI demonstrates T2/FLAIR hyperintensities in the majority of patients within the occipital regions, deep cerebellar nuclei, thalamus and basal ganglia (Tzoulis et al., 2006). MRI changes seem to follow disease course with compound heterozygotes having more involvement and homogygotes showing lesions that can reverse during quiescent periods.
In one of our patients with compound heterozygous mutations in polymerase gamma 1 (p.Q67X and p.A467T), MRI lesions evolved initially form the cerebellum to the occipital regions and premotor cortex (Figure 3). Clinically the patient presented with focal seizures, and nygstamoid eye movement and visual hallucinations. At the end of the rapid course of decline, the patient was blind and developed liver failure after valproic acid exposure. A second patient with a homogyous mutation in the linker region of polymerase gamma 1 (p.A467T), developed mild sensorineural hearing loss, ataxia, and clumsiness at age 5-years. This patient developed partial status epilepticus at age 15 years and then went into a stable quiescent state for 6 − 7 years before an early death at the age of 23 years from liver failure after valproic acid exposure. Her MRI findings were initially normal. However, at the time of partial status epilepticus demonstrated occipital T2/FLAIR hyperintensities. The latter resolved over time and she had virtually a normal MRI study just before her death (Figure 4). Our patients demonstrate that MRI may help in the diagnosis severe Alpers syndrome versus the more indolent form. The reverse may also be true, the MRI may be normal at first but as the disease progresses the MRI may show progressive abnormalities. The care provider should be aware of the possible changes and never assume that a normal MRI scan will remain unchanged or visa versa. However, more studies are needed to correlate phenotype and genotype with MRI imaging.
Figure 3.
Axial MR images of a young girl with Alpers syndrome. Genetic testing showed she had heterozygous mutations in the polymerase gamma 1 gene (p.Q67X and p.A467T). She presented with epilepticus partialis continua (EPC) arising from the right occipital region as well as hallucinations. Axial FLAIR imaging at this time demonstrated left cerebellar hyperintensity (Figure 3A). Status was stopped but unfortunately seizures continued. Psychomotor deterioration, ataxia and cortical blindness developed over 4 months. She developed fulminate liver failure when Valproic acid was given 3 months after EPC. Axial FLAIR imaging shows newly developed bilateral occipital lobe hyperintensities near the time of death; within 2 months after Valproic acid was initially given (Figure 3B).
Figure 4.
Axial MR images of an adolescent/young adult woman with Alpers syndrome. Genetic testing revealed that she was homozygous for the p.A467T mutation in the polymerase gamma 1 gene. She presented with episodic ataxia at age 5 with mild sensorineural hearing loss. MR imaging at that time was normal. At age 15 years she developed epilepsia partialis continua (EPC). Axial FLAIR imaging done at this time showed a right occipital lobe hyperintensity (Figure 4A). Seizures were controlled and she remained seizure free for 8 years. She subsequently developed segmental myoclonus and was treated with Valproic acid and developed fulminate liver failure. Axial FLAIR imaging just prior to death showed resolution of right occipital lobe hyperintensity and virtually normal MRI (Figure 4B).
3.5 . Mitochondrial neuro-gastro-intestinal encephalomyopathy
Mitochondrial neuro-gastro-intestinal encephalomyopathy (MNGIE) arises from mutations within the thymidine phosphorylase gene and produces mtDNA depletion from DNA deletions and point mutations within mtDNA (Nishino et al., 2000; Marti et al., 2003). The majority of patients present before 20 years of age and younger patients typically have more severe symptoms. Approximately 50% of patients die by 35 years of age. Gastrointestinal dysmobility manifesting as intestinal pseudo-obstruction, recurrent diarrhea, nausea and vomiting are the most dominant symptoms. Other core symptoms are ophthalmoparesis, ptosis, and peripheral neuropathy. Central nervous system abnormality is usually mild.
The MRI demonstrates a prominent leukoencephalopathy in almost all patients. The changes in white matter are diffuse but the corpus callosum is usually spared. Wide spread supratentorial cortical atrophy was also pronounced in one study (Barragan-Campos et al., 2005). Postmortem studies have shown mild white matter edema or mild demyelination (Bardosi et al., 1987; Simon et al., 1990).
3.6. Isolated electron transport chain disorders
The majority of pediatric cases of mitochondrial disease are the result of nuclear genetic defects involved directly in oxidative phosphorylation (OXPHOS) and non-OXPHOS proteins involved in the assembly or maintenance of the electron transport chain (ETC) (Shoubridge, 2001; DiMauro, 2004). These disorders are clinically heterogeneous creating further diagnostic challenge. Although some “classic” phenotypes may be found in these disorders, most represent the interplay of mtDNA and nuclear DNA expression and having a wide range of clinical presentation. A common thread of non-specific diffuse white matter changes have been found in some patients expressing ETC defects (Lerman-Sagie et al., 2005).
Non-specific white matter lesions have been found in ETC defects involving individual and combinations of complexes I-IV. Four patients with complex I defects have been described with a progressive macrocystic leukodystrophy or diffuse white matter disease including cerebellar white matter loss (Schuelke et al., 1196; Maroni et al., 2002). Two patients reported by Burgeois et al. (1992) had a degenerative neurological disorder with leukodystrophy and isolated complex II defect. Five other patients have been demonstrated with a diffuse leukodystrophy and complex II defect (Brockman et al., 2002; Moroni et al., 2002). Two patients have been described with complex III defects, one had a mutation in cytochrome b subunit of complex III and the other was without a recognized mutation but a defect in enzyme activity (Majoie et al., 2002; Seijo-Martinez et al., 2003). At least 5 patients with defects in complex IV have demonstrated white matter changes (Zafeiriou et al., 1995; Rahman et al., 2001; Jaksch et al., 2001). One patient with multiple ETC defects with leukodystrophy has been reported (Moroni et al., 2002).
Most all of patients with leukodystrophy are young, usually infants, with multisystem disorders and often displaying a neurodegenerative course. The MRI finding of a diffuse leukodystrophy within the clinical context of multisystem involvement may provide evidence for pursuing the work-up for a mitochondrial disorder.
4. Magnetic resonance spectroscopy
There have been a number of magnetic resonance techniques developed that complement conventional MRI and enhance sensitivity to pathological conditions within tissues. Magnetic spectroscopy (MRS) can provide valuable in vivo metabolic information to measure metabolites possessing resonating nuclei (hydrogen-1; 1H: phosphorous-31; 31P: carbon-13; 13C) in the mM range. Typically 1H-MRS will involve suppression (within the acquisition sequence) of the water signal, which otherwise overwhelms the signal from other molecules in the mM range. One of the advantages of 1H-MRS is that it shares the same radiofrequency range with routine MRI and can be performed in the same examination and coil with the addition of 5 − 15 minutes. Other nuclei, such as phosphorous-31 (31P) and carbon-13 (13C) can provide further specific information (e.g. phosphocreatine and metabolite production degradation rates, respectively). These latter studies have been less well utilized to study mitochondrial disorders owing to the need of specialized hardware for measurement, lower signal-to-noise per unit time, and the requirement of very expensive labeled substrate (13C glucose or acetate) in the case of 13C MRS.
With specialized 1H acquisition approaches, approximately 30 or more brain metabolites can be distinguished, although only about 5 − 10 brain metabolites are reliably measured with routine clinical 1H-MRS (Ross, 2000). Acquisitions can sample one region (single-voxel) or grid (multi-voxel also referred to as chemical shift imaging: [CSI or MRSI]) using a number of spatial acquisition techniques, most commonly Point RESolved Spectroscopy (PRESS), volume selected stimulated stimulated echoes (STEAM), or image selected in-vivo spectroscopy (ISIS) (Keevil, 2006). To obtain sufficient signal-to-noise, CSI acquisitions require longer acquisition times.
The resonance frequency of each chemical in MRS is commonly referred to as the “chemical shift” and is expressed as a magnetic field-independent unit, the ppm (parts per million magnetic field). The chemical shift of a particular nucleus in ppm is the difference between its Larmour frequency and that of nucleus on a reference compound divided by magnetic field. Apart from brain water and scalp/skull lipids, which are generally of less interest and often suppressed in brain at common clinical field strengths (1.5Telsa or 3Telsa), the most evident signals are N-acetyl-L-aspartate (NAA), synthesized within mitochondria in an energy dependent fashion and putative marker for neurons/axons (Clark, 1998); creatine compounds (Creatine: creatine + phosphocreatine),a marker for generalized energy state; choline-containing compounds (Choline: fee choline, membrane precursors; phosphorylcholine + phosphorylethanolamine, and catabolytes: glycerophosphorylcholine + glycerophosphorylethaolamine), elevated in situations of increased cellular turnover; myo-inositol, considered an osmotic marker; and lactate the end-product of glycolysis (Table 1).
Table 1.
Chemical shift of the major metabolites observed in typical clinical 1H-MRS spectra.
| Parts Per Million Magnetic Field (ppm) | Metabolite | Properties |
|---|---|---|
| 0.9 − 1.2 | Lipids* | Membrane constitutents |
| 1.33 | Lactate (doublet) | Product of anerobic glycolysis^ |
| 2.02 | N-acetyl-L-aspartate | Neuro-axonal marker |
| 2.1 − 2.4 | Glutamate/GABA/Glutamine*+ | Neurotransmittor |
| 2.4 | Succinate | Krebs cycle intermediate |
| 3.03 | Creatine/phosphocreatine | Energy metabolism |
| 3.22 | Choline compounds | Cell membrane marker |
| 3.56 | Myo-inositol* | Glial cell marker, osmolyte |
Best observed at short echo times (TE)
Best delineated with editing techniques or specialized acquisition (TE-80 ms at 3T for Glutamate/GABA/Glutamine).
Also may be seen in mitochondrial disease states.
MRS signals are displayed as spectra with peaks corresponding to specific chemical entities. Figure 5 shows a 1H-MR spectrum acquired with TE-averaging to minimize baseline and j-coupled components in normal human brain (discussed below).
Figure 5.
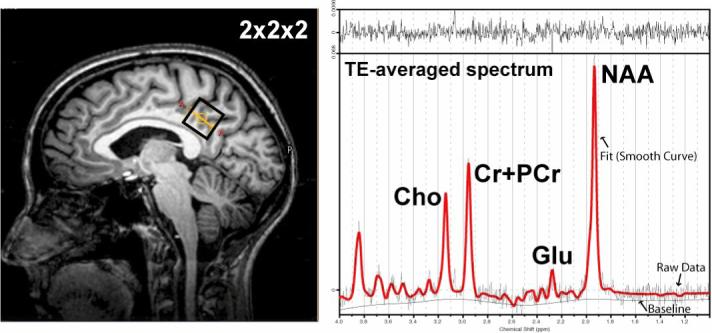
Example 1H TE-averaged data-set collected from a 2×2×2 voxel in the posterior-cingulate cortex at 3T. The commonly observed resonances in the 1H spectrum. Choline containing compounds (Cho), Creatine + Phoshocreatine (Cr+PCr), glutamate (Glu), and N-acetylaspartate (NAA) are shown.
The position of each resonance peak in the spectrum is determined by the precise magnetic field strength felt by that nucleus. This is the result of the influence on the magnetic field produced by nearby electrons that modulate the applied magnetic field of the scanner. A higher density of electrons “shields” (subtracts) more strongly and the signal is shifted to a lower frequency. Conversely, a lower electron density shifts the signal to higher frequency.
One important further concept to mention is j-coupling which refers to the interaction of electrons on close neighboring protons within a molecule. The result of this j-coupling can alter the peak of a particular metabolite depending on the acquisition delay (TE or echo times). This phenomenon can be used to a detection advantage. The most common example of this in clinical 1H MRS, is the lactate peak at 1.33 ppm (reflecting the OH - H pair) where the two protons interact with the observed magnetic field creating a characteristic doublet (See Figure 6). Specific echo times are often utilized for unambiguous measurement of lactate (with the doublet pointing up or down depending on echo time) in contrast to the overlapping peaks from lipid/macromolecule signal in brain.
Figure 6.

Simulated lactate spectrum using the PRESS pulse sequence (point-resolved spectroscopy) pulse sequence (TE1=18 ms, incrementing TE2). The most common echo times employed for measuring lactate are shown with asterisks. No relaxation estimation has been added to the simulation, thus, lactate at 343 ms has not been properly damped in amplitude as would occur in vivo. Furthermore, the lactate commonly reported in the 1Hspectrum is only the doublet at 1.33 ppm because the residual water signal dwarfs the 4.15 multiplet.
The field strength of most clinical scanners is 1.5 Tesla (T), however with recent FDA approval; there are increasing the number of clinical scanners using 3T magnets. The MRI imaging differences between 1.5 and 3T are for the most part incremental, with some adjustment of pulse sequences required to account for differences in T1 and T2 relaxation. There are significant differences in MRS measurement of some metabolites. For example, reduced bandwidth of excitation at 3T can render lactate very challenging to measure at certain echo times, a problem not encountered at 1.5T (Lange, 2006).
4.1. MRS in Mitochondrial Diseases: Lactate and NAA changes
Mitochondrial disease represents a particularly prominent set of diseases that show MRS changes due to the consequences of impaired OXPHOS. The disruption of the ETC and consequent depletion of NAD+ and NADP+ shifts metabolism from the tricarboxylic acid cycle to glycolysis. The glycolytic by-product lactate is the primary abnormality detected in mitochondrial disease. This can then be measured along with numerous markers of cellular integrity and energetics (e.g. myo-inositol, choline, creatine, and NAA). In mitochondrial diseases, lactate elevations are suggested to range from 3−11 mM (Wilchowski et al., 1999) with other studies reporting average levels of approximately 6 mM (Saitoh et al., 1998; Isobe et al., 2007). The most consistent MRS change accompanying increased lactate in mitochondrial disease is decreased NAA, suggestive of cellular compromise. While elevations in lactate and decreases in NAA occur in other diseases, for example stroke and seizures (Kingsley et al., 2006), such diseases are typically distinct in clinical work-up and MRI abnormalities. In the following summary, owing to the preponderance of lactate and NAA changes in mitochondrial disease, these metabolites are summarized first, followed by a detailed discussion of myo-inositol, choline, and creatine, with a brief discussion of future studies increasing specificity of measurement. Next, a very specific MRS biomarker in complex II disease, succinate, is described, followed by a summary of how MRS-visible biomarkers may be used to monitor therapeutic interventions in these heterogeneous diseases.
The phenotypic heterogeneity of mitochondrial patients can result in some patients not demonstrating marked lactate elevations (Lin et al., 2003; Bianchi et al., 2003), due to variability in disease state and regional sampling. There is the possibility that variability in regional sampling limits detection in some subjects. In some cases, propan-1,2-diol, localized at 1.1 ppm, can be mistaken for lactate (Figure 7; Cady et al., 1994).
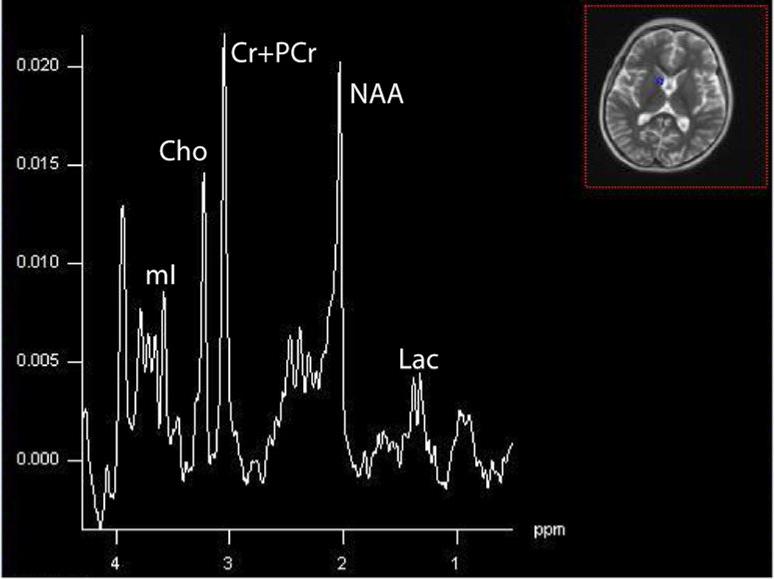
Figure 7.
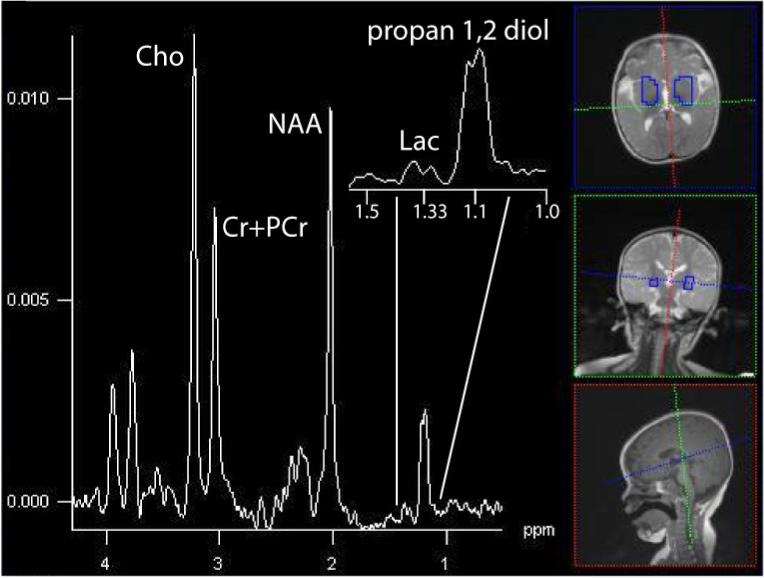
The summed spectrum from central gray nuclei shows in a 12-month old patient with a markedly elevated resonance at 1.1 ppm, propan-1,2-diol, that can be mistaken for Lac without careful examination (3T, TE=288 ms, TR=1700 ms, 16×16 acquistion, interpolated to 32×32, 16cm).
The issue of regional sampling is worthy of a bit more discussion. While single-voxel (one region, typically 2−10 cc's) techniques for spatial localization are advantageous for spatial localization in regions near air/brain interfaces (e.g. cerebellum) and optimal signal-to-noise per unit time, they limit spatial coverage. Alternatively, acquisition of many voxels simultaneously (typically in a single plane) is now commonly performed at many centers using chemical shift imaging techniques. These grids of data, often in matrices of 16×16, 24×24, or 32×32 having individual voxels of approximately 1−2 cc after reconstruction filtering, afford an opportunity to survey many brain regions simultaneously. While advantageous to detect regions having highly variable patterns of lactate elevations (as shown in the figures below), individual voxels typically have to be summed to provide sufficient signal-to-noise for measuring lactate with high confidence. Moreover, as described in more detail below, the different visibility of lactate in different compartments (e.g. CSF) can complicate measurement in voxels having CSF partial volume. In total, while it is certain that probing regions abnormal on MRI with MRS is useful to characterize underlying biochemical changes, the optimal protocol for comparing “normal” and “abnormal” brain has yet to be clearly defined either by single-voxel or MRSI techniques.
Studies commonly find elevated lactate in lesions (Bianchi et al. (2003), but normally appearing brain on MRI can also demonstrate elevated lactate. Lactate peaks likely change in intensity when a patient is undergoing exacerbation of their disease (Bianchi et al., 2003) and across the developmental course of lesions (Lin et al., 2003). We have found it best to acquire the MRS using multvoxel acquisition and then reformat the study to identify regions of interest. This allows the investigator to look at multiple brain sites as well as compare contralateral regions. As described below, lack of lactate increases may also be due to differences in type of mitochondrial disease, temporal course, or location brain sampled.
Where elevated lactate is present, it is almost universally indicative of neuronal/axonal compromise and decreases in NAA. In a survey of mitochondrial patients, 93% showed NAA/Creatine ratio reductions in cerebellum, 87% in cortical gray matter regions, though few changes were observed in white matter (Bianchi et al., 2003). In another series, 16 patients with definitive mitochondrial disease consisting of known syndromes and respiratory chain deficiencies, 69% had decreased NAA/Creatine ratio in both gray and white matter (Dinopoulos et al., 2005). Decreased NAA/Creatine ratio was only seen in one study for patients with lactate peaks (Dinopoulos et al., 2005). In patients with cerebellar involvement, one study demonstrated lactate peaks in 9 out of 11 patients when voxels were placed over the cerebellum while only 3 out of 11 showed lactate voxels over the putamen (Boddaert et al., 2008). This latter study suggests that voxel placement may determine the detection of abnormal lactate and may be missed if the voxel is placed over the wrong brain region. As will be described below, the concordance between lactate and NAA can be highly variable with respect to disease progression and presentation.
4.2. MRS Findings in Specific Syndromes
4.2.1. Leigh Syndrome
In 5/5 patients with Leigh syndrome and ETC abnormalities demonstrated lactate peaks (Dinopoulou et al., 2005). Persistent lactate peaks were noted in a patient in our cohort with Leigh syndrome as a result of the 8993 mutation (Figure 8) and Leigh-like syndrome from ETC defect of complex III (Figure 9).
Figure 8.
Bilateral putaminal nuclei in a 19-month old patient with Leigh syndrome due to the 8993T>G mutation in the mtDNA. An elevated inverted Lac is found at this echo time (135 ms) acquired on a 1.5T Avanto scanner (Siemens Medical System, TE=135, TR=1.5s, 16×16 matrix, interpolated to 32×32, 16cm).
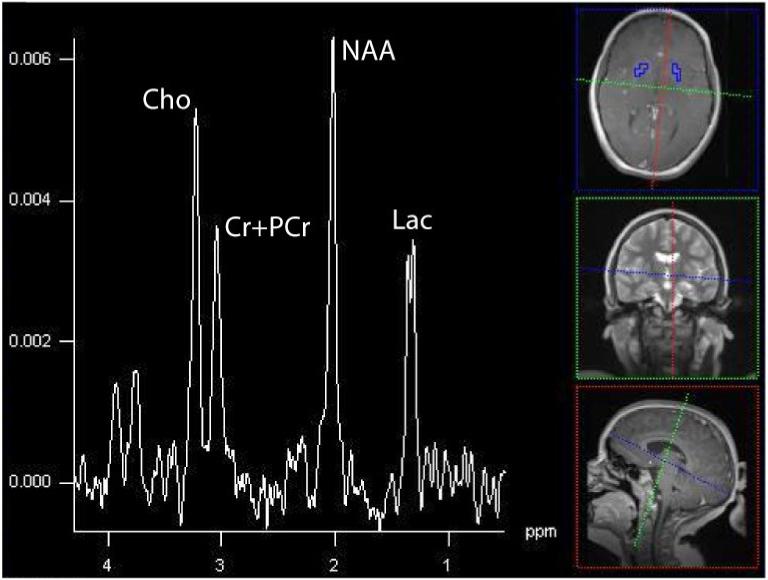
Figure 9.
Summed spectra acquired at 3T (Siemens Trio, TE=288, TR=1700, 16×16 matrix, interpolated to 32×32, 16cm) showing dramatically elevated Lac. This patient was 6-year old male who developed respiratory distress, severe muscle weakness, and systemic lactate acidemia and found to have a complex III defect within muscle biopsy.
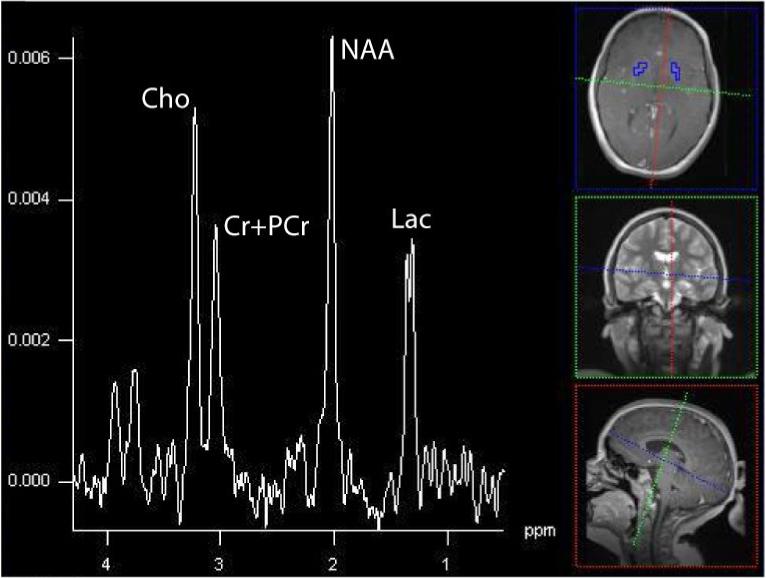
There were 18 out of 21 patients with various ETC defects demonstrated lactate peaks in another study (Saneto et al., 2001). Lactate peaks were noted in 7 patients without systemic lactic acidosis in another study, suggesting the lactate measured with MRS may be a better marker than serum Lac levels (Dinopoulous et al., 2005). Studies comparing the concordance between brain and CSF lactate however, are mixed, with some finding lactate more often present in CSF (Lin et al., 2003), though the reverse has also been found (Feng et al.,, 2006}. A recent subject scanned at our center illustrates this point, with minimally appreciable lactate in brain but high levels in voxels (regions) containing greater fraction of CSF (Figure 11). Though differences in MR visibility (e.g. lactate in CSF is nearly 100% visible), relaxation times (e.g. brain T2=∼80ms at 1.5T, CSF∼800ms), and clearance between compartments complicate a direct comparison of brain and CSF lactate levels, such variable presentations are intriguing.
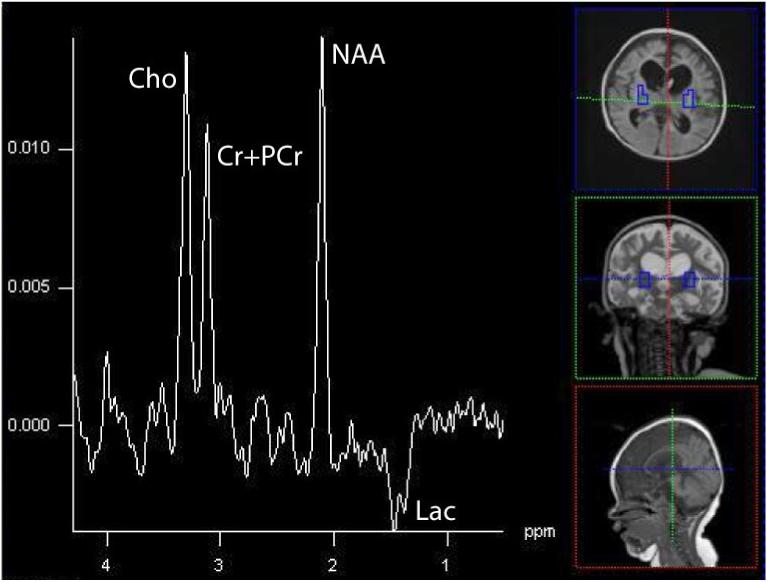
Figure 11a and 11b.
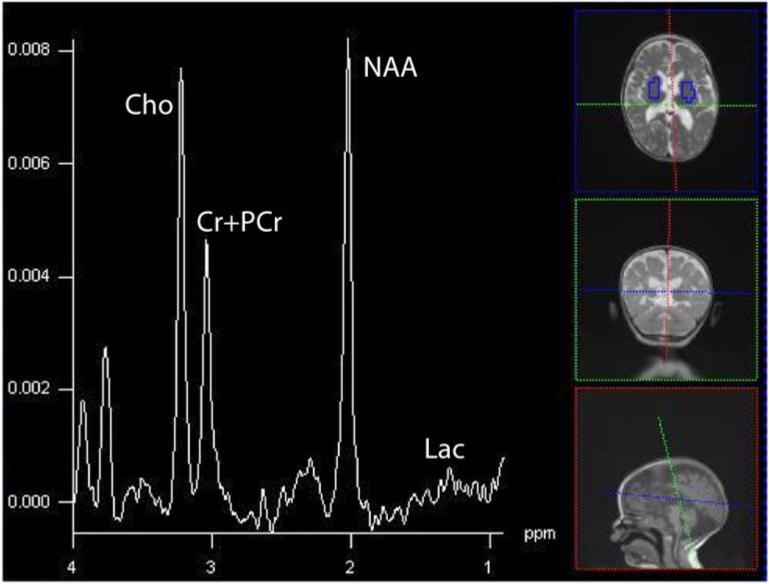
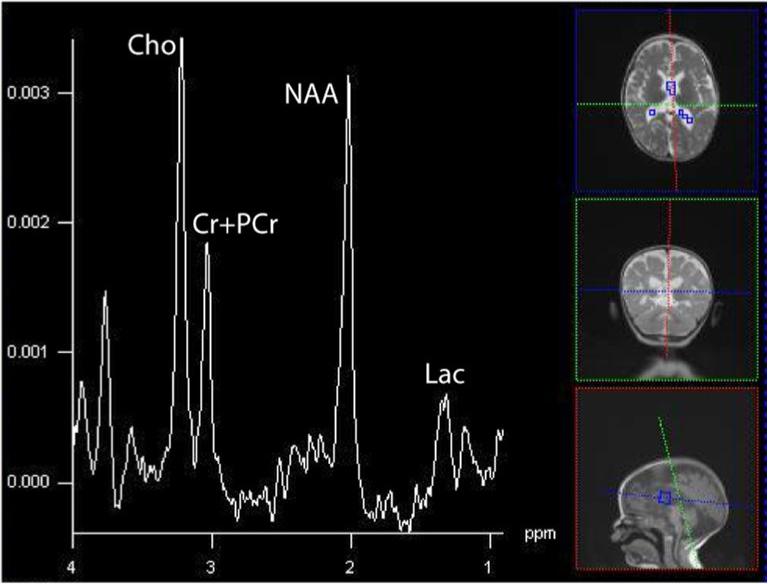
Summed spectra in brain and CSF for the 19-month old with a complex IV defect. Clinically, she demonstrated sensorineural hearing loss, seizures, cortical vision impairment, and axial hypotonia.(16×16 acquisition interpolated to 32×32, TE=288, TR=1700, FOV=16cm). Through the spectra are not corrected for the number of voxels, hence the magnitudes are larger in the upper than lower spectrum, it is appreciable by eye that greater Lac is in CSF, whereas little lactate can be seen in brain. The persistent neurochemicals in CSF (Cho, Cr+PCr, and NAA) reflect the partial tissue volume of the ventricular voxels in the axial plane, combined with the applied point-spread-function hamming filter that smoothes data spatially prior to analyses. CSF has few MRS-visible metabolites except for Lac.
4.22. Mitochondrial myopathy, encephalopathy, lactic acidosis, and stroke-like episodes
In three MELAS studies, a total of 14 out of 14 patients with MELAS were found to have substantial lactate peaks, including both lesion and normal regions of brain (Barkovich et al., 1993; Castillo et al., 1995; Wilichowski et al., 1999). Other MELAS studies of individual cases parallel these results (Kuwabara, 1994; Clark, 1996; Jeppesen, 2003; Nakamura, 2000). High lactate signal may precede abnormalities on diffusion-weighted images (Abe, 2004) and is commonly accompanied by decreased NAA. Dramatically, a patient with MELAS demonstrated high lactate and no NAA in an acute lesion with reappearance of NAA paralleling recovery (Kamada, 2001). At later stages, lactate may disappear in regions that showed T2 abnormalities (Barkovich, 1993). Some studies suggest that decreased NAA may be more highly correlated to lesions visible on MRI (Kim, 2001). Higher lactate, at least measured in CSF, may relate to the severity of neurological impairment (Abu-Amero, 2005), though lactate quantification and the variable presentation along the disease course provides certain qualification of this conclusion.
4.23. Kearns-Sayre syndrome/Pearson syndrome
In KSS, areas of brain injury similarly demonstrate elevated lactate (Kapeller, 1996; Furuya, 1997). Brain tissue that appears normal may also show elevated lactate levels at rest (Kuwabara, 1994; Furuya, 1997), and demonstrate less of a normal increase in lactate that is normally shown with sustained visual stimulation (Kuwabara, 1994).
4.24. Alpers Syndrome
A single case of Alpers reported in the literature demonstrated elevated lactate and reduced NAA (Ulmer, 2002). In Alpers expressing complex III defects, regions of increased apparent diffusion coefficient owing to increased water mobility (injury) show the characteristic pattern of high lactate and low NAA (Majoie, 2002). In one of our patients with Alpers syndrome due to a heterozygous mutation at positions p.Q67X and p.A467T within the polymerase gamma 1 gene, elevated lactate and decreased NAA were observed (Figure 12).
4.25 Leukoencephalopathy with Brainstem and Spinal Cord Involvement with Lactate Elevation
Originally described in eight patients with MRI inhomogeneous cerebral white matter abnormalities and selective involvement of brainstem and spinal cord and 1H-MRS detection of lactate, this novel pattern of MRI and MRS changes was found to be the result of mitochondrial aspartyl-tRNA synthetase deficiency (van der Knaap et al., 2003; Scheper et al., 2007). Clinically, patients are characterized by slow progressive pyramidal, cerebellar, and dorsal column dysfunction usually starting in childhood or adolescence. The MRI pattern is distinct and shows T2/FLAIR changes over the entire length of selective tracts. Cerebellar tracts are also involved with spotty abnormalities within the periventricular and deep cerebral white matter. 1H-MRS demonstrates elevation of lactate with decreases in NAA within the abnormal white matter. Interestingly, although the aspartyl-tRNA synthetase is abnormal and in expression systems results in low electron transport chain activities, activities in patient lymphocytes and fibroblasts were normal (Scheper et al., 2007). The exact mechanism of white matter changes remains to be explained fully.
4.26 Other Brain Metabolites (Myo-Inositol, Choline, Creatine, Succinate)
Where injurious or mitochondrial defects are present, it might be expected that osmotic or membrane changes, (e.g. myo-inositol or choline alterations), would routinely be expected. Myo-inositol changes have not been routinely investigated because measurement necessitates a short TE after excitation, a parameter that can impair unambiguous detection of lactate from lipid.
Though choline can be reliably measured in spectra acquired primarily for the measurement of lactate, changes have not been consistently reported. Only two studies have demonstrated reductions in the Choline/Creatine ratio in mitochondrial patients (Bianchi et al., 2003; De Stefano, 1995). The limited data may reflect that choline in the 1H spectrum represents the sum of both membrane precursors and catabolytes; since these components may not change in opposite directions; the sum may provide a negligible index of change. Acquisition of 31P MRS combined with 1H decoupling provides the ability to separate choline resonances (PE, PC, GPE, GPC) but has not been performed in any study investigating mitochondrial disease to date.
Similar to choline, creatine in the proton spectrum (1H MRS) reflects the sum of phosphocreatine and creatine, in exchange via the creatine kinase equilibrium. Since phosphocreatine and creatube often change reciprocally, any specific changes in high-energy phosphocreatine is obscured. phosphocreatine changes have been shown to be decreased in two studies measuring this component unambiguously using 31P-MRS (Barbioli et al., 1993; Lodi 1994). Moreover, since creatine + phosphocreatine is often used as the denominator for evaluating changes in other metabolites (e.g. NAA/Creatine) this too limits a description of what changes are commonly observed in mitochondrial disorders. Future studies employing other standards (e.g. internal water) may overcome this latter difficulty for interpretation.
One disease biomarker that appears highly specific to complex II disease is a large elevation in succinate in white matter. Specifically, complex II (succinate:ubiquinone oxidoreductase E.C. 1.2.5.1) catalyzes the oxidation of succinate to fumarate in the Krebs cycle and carries electrons to the ubiquinone pool of the ETC (Ackrell et al., 1992). Notably, although reductions in NAA/Creatine and increased lactate signal were observed in these regions (Brockmann et al., 2002) gray matter tissues did not demonstrate any succinate elevations.
4.26. MRS as a Therapeutic Biomarker
Once diagnosis has been confirmed, a further application of MRS is the evaluation of therapeutic intervention. For example, in seven of 11 mitochondrial patients treatment with dichloroacetate (DCA) demonstrated reduced brain levels lactate/creatine, increased choline/Creatine and increased NAA/creatine following one week of treatment (De Stefano, 1995). In contrast, muscle measures of high-energy phosphate metabolism, measured by 31P MRS, were unchanged (De Stefano, 1995). A further study examining two subjects one with Leigh syndrome and one having multi-ETC deficiency demonstrated similar changes in brain lactate reduction with DCA, in parallel to blood and CSF measurements (Kimura, 1997). However, though DCA treatment is well tolerated over long-duration (Kimura, 1997), and reduces the magnitude of lactate abnormalities, it may not impact the progressive cognitive decline associated with the disease (Takanashi, 1997; Takahashi, 1999).
As alternative therapeutic approach Coenzyme Q10 (CoQ10), has been utilized in several studies. In a patient with KSS, CoQ10 administered over 10 months demonstrated initial reduction in lactate that returned to baseline levels at 10 months (Choi, 2000). Another study investigating CoQ10 supplementation in 6 patients with mixed etiology demonstrated reversal of high-energy phosphate abnormalities (Barbiroli, 1997). In another study, creatine, given to a patient with MELAS in another study did not appreciably change 1H MRS-visible brain abnormalities or 31P MRS findings in muscle (Moller, 2002). By contrast, in disorders of creatine biosynthesis, with intact mitochondrial function, large reversal of brain phospocreatine depletions are observed (Bianchi, 2007).
A recent report has demonstrated that the ketogenic diet may be helpful in controlling seizures in patients with mitochondrial disease (Kang et al., 2008). Although the utility of following treatment and treatment outcome using 1H-MRS is intriguing, no study to date has demonstrated alterations in mitochondrial function, i.e. decreases in brain lactate occur.
5. Conclusions
Magnetic resonance imaging of mitochondrial disease demonstrates a variety of findings that can vary during the course of the clinical disease. Some well-described syndromes have MRI findings that can provide sensitivity for diagnosis. However, most mitochondrial diseases present with either non-specific findings or MRI images that can be completely normal. Many times however, when the combination of biochemical and clinical findings are compatible with a mitochondrial disorder, the non-specific findings revealed by neuroimaging techniques may give added evidence for diagnosis and a rationale for further testing. This is particularly true in diseases caused by ETC disorders that occur in infancy and childhood. Further work remains to elucidate why some disorders have no measurable MRI or MRS abnormalities, even when the patient has neurological involvement. As reflected in the literature, the regional nature of involvement and evolving pattern of change makes the risk of Type II error substantial. Longitudinal anatomical imaging and quantification of measurement will be valuable in characterizing mitochondrial diseases. Many more patients need to be studied by multiple techniques so that particular neuroimaging findings can be cataloged. As genetic etiologies are defined, the phenotype-genotype grouping of patients may be effectively understood. With such information, it may ultimately be possible to better utilize neuroimaging to make a diagnosis, more accurately understand and follow clinical history, and effectively monitor therapeutic efficacy over time.
Figure 10.
Summed spectra in CSF within the same 6-year old patient with Leigh-like syndrome as shown above (Figure 9). The inverted Lac is of greater magnitude than in brain, illustrating the potential difference in concentration between compartments.
Acknowledgements
RPS has received support from the Mitochondrial Research Guild at Children's Hospital and Regional Medical Center, Seattle, WA. SDF is supported in part by NIMH-1K01MH069848.
Footnotes
Publisher's Disclaimer: This is a PDF file of an unedited manuscript that has been accepted for publication. As a service to our customers we are providing this early version of the manuscript. The manuscript will undergo copyediting, typesetting, and review of the resulting proof before it is published in its final citable form. Please note that during the production process errors may be discovered which could affect the content, and all legal disclaimers that apply to the journal pertain.
References
- Abe K. Cerebral lactic acidosis correlates with neurological impairment in MELAS. Neurology. 2004;53:2458. doi: 10.1212/wnl.63.12.2458. [DOI] [PubMed] [Google Scholar]
- Abu-Amero KK, Bosley TM, Bohlega S, Hansen E. Mitochondrial T9957C mutation in association with NAION and seizures but not MELAS. Ophthalmic Genet. 2005;26:31–36. doi: 10.1080/13816810590918235. [DOI] [PubMed] [Google Scholar]
- Ackrell BAC, Johnson MK, Gunsalus RP, Cecchini G. Structure and function of succinate dehydrogenase and fumarate reductase. In: Muller F, editor. Biochemistry of flavoenzymes. CRC; Boca Raton, FL: 1992. pp. 229–297. [Google Scholar]
- Apostolova LG, White M, Moore SA, Davis PH. Deep white matter pathologic features in watershed regions: a novel pattern of central nervous system involvement in MELAS. Arch. Neurol. 2005;62:1154–1156. doi: 10.1001/archneur.62.7.1154. [DOI] [PubMed] [Google Scholar]
- Barbiroli B, Frassineti C, Martinelli P, Lotti S, Lodi R, Cortelli P, Montagna P. Coenzyme Q10 improves mitochondrial respiration in patients with mitochondrial cytopathies. An in vivo study on brain and skeletal muscle by phosphorous magnetic resonance spectroscopy. Cell Mol. Biol. (Noisy-le-grand) 1997;43:741–749. [PubMed] [Google Scholar]
- Barbiroli B, Montagna P, Martinelli P, Lodi R, Iotti S, Cortelli P, Funicello R, Zaniol P. Detective brain energy metabolism shown by in vivo 31 P MR spectroscopy in 28 patients with mitochondrial cytopathies. J. Cereb. Blood Flow Metab. 1993;13:469–474. doi: 10.1038/jcbfm.1993.61. [DOI] [PubMed] [Google Scholar]
- Bardosi A, Creutzfeldt W, DiMauro S, Filgenhauer K, Friede FI, Goebel HH, Kohlschutter A, Mayer G, Rahlf G, Servidei S, Van Lessen G, Wetterling T. Myo-neuro-, gastrointestinal encephalopathy (MNGIE syndrome) due to partial deficiency of cytochrome c-oxidase. A new mitochondrial multisystem disorder. Acta Neuropathol. 1987;74:248–258. doi: 10.1007/BF00688189. [DOI] [PubMed] [Google Scholar]
- Barkovich AJ, Good WV, Koch TK, Berg BO. Mitochondrial disorders: analysis of their clinical and imaging characteristics. AJNR Am J Neuroradiol. 1993;14:1119–1137. [PMC free article] [PubMed] [Google Scholar]
- Barragan-Campos HM, Valee J-N, Lo D, Barrera-Ramirez F, Argote-Greene M, Sanchez-Guerrero J, Estanol B, Guillevin R, Chiras J. Brain magnetic resonance imaging findings in patients with mitochondrial cytopathies. Arch. Neurol. 2005;62:737–742. doi: 10.1001/archneur.62.5.737. [DOI] [PubMed] [Google Scholar]
- Bernier FP, Boneh A, Dennett X, Chow CW, Cleary MA, Thornburn DR. Diagnostic crieteria for respiratory chain disorders in adult and children. Neurology. 2002;59:1406–1411. doi: 10.1212/01.wnl.0000033795.17156.00. [DOI] [PubMed] [Google Scholar]
- Bhatti MT, Newman JN. A multiple sclerosis-like illness in a man harboring the mtDNA 14,484 mutation. J. Neuroophthalmol. 1999;19:28–33. [PubMed] [Google Scholar]
- Bianchi MC, Tosetti M, Battini R, Leuzzi V, Alessandri MG, Carducci C, Antonozzi I, Cioni G. Treatment monitoring of brain creatine deficiency syndromes: a 1H and 31P-MR spectroscopy study. AJNR Am. J. Neuroradiol. 2007;28:548–554. [PMC free article] [PubMed] [Google Scholar]
- Bianchi MC, Tosetti M, Battini R, Manca ML, Mancuso M, Cioni G, Canapicchi R, Sicilliano G. Proton MR spectroscopy of mitochondrial diseases: analysis of brain metabolic abnormalities and their possible diagnostic relevance. AJNR Am. J. Neuroradiol. 2003;24:1958–1966. [PMC free article] [PubMed] [Google Scholar]
- Bluml S, Moreno A, Hwang JH, Ross BD. 1-(13)C glucose magnetic resonance spectroscopy of pediatric and adult brain disorders. NMR Biomed. 2001;14:19–32. doi: 10.1002/nbm.679. [DOI] [PubMed] [Google Scholar]
- Boddaert N, Romano S, Funalot B, Rio M, Sarzi E, Lebre AS, Bahi-Buisson N, Valayannopoulos V, Desguerre I, Seidenwurm D, Brunelle F, Brami-Zylberberg F, Rotig A, Munnich A, de Lonlay P. 1H MRS spectroscopy evidence of cerebellar high lactate in mitochondrial respiratory chain deficiency. Mol. Genet. Metabol. 2008;93:85–88. doi: 10.1016/j.ymgme.2007.09.003. [DOI] [PubMed] [Google Scholar]
- Brockman K, Bjornstad A, Dechent P, Korenke CG, Smeitink J, Trijbels JM, Athanassopoulou S, Villagran R, Skjildal OH, Wilichowski E, Frahm J, Hanefeld F. Succinate in dystrophic white matter a proton magnetic resonance spectroscopy finding characteristic for complex II deficiency. Ann. Neurol. 2002;52:38–46. doi: 10.1002/ana.10232. [DOI] [PubMed] [Google Scholar]
- Burgeois M, Goutieres F, Chretien D, Rustin P, Munnich A, Aicardi J. Deficiency in complex II of the respiratory chain, presenting as a leukodystrophy in two sisters with Leigh syndrome. Brain Dev. 1992;14:404–408. doi: 10.1016/s0387-7604(12)80349-4. [DOI] [PubMed] [Google Scholar]
- Cady EB, Lorek A, Penrice J, Reynolds EO, Iles RA, Burns SP, Coutts GA, Cowan FM. Detection of propan-1,2-diol in neonatal brain by in vivo proton magnetic resonance spectroscopy. Magn. Reson. Med. 1994;32:764–767. doi: 10.1002/mrm.1910320611. [DOI] [PubMed] [Google Scholar]
- Cananagh JB, Harding BN. Pathological factors underlying the lesions in Leigh's disease, tissue responses to cellular energy deprivation and their clinco-pathological consequences. Brain. 1994;117:1357–1376. doi: 10.1093/brain/117.6.1357. [DOI] [PubMed] [Google Scholar]
- Castillo M, Kwock L, Green C. MELAS syndrome: imaging and proton MR spectroscopic findings. AJNR Am. J. Neuroradiol. 1995;16:233–239. [PMC free article] [PubMed] [Google Scholar]
- Choi C, Sunwoo IN, Kim HS, Kim DI. Transient improvement of pyruvate metabolism after coenzyme Q therapy in Kearns-Sayre syndrome: MRS study. Yonsei Med. J. 2000;41:676–679. doi: 10.3349/ymj.2000.41.5.676. [DOI] [PubMed] [Google Scholar]
- Chu BC, Terae S, Takahashi C, Kikuchi Y, Miyasaka K, Abe S, Minowa K, Sawamura T. MRI of the brain in the Kearns-Sayre syndrome: report of four cases and a review. Neuroradiology. 1999;41:759–764. doi: 10.1007/s002340050838. [DOI] [PubMed] [Google Scholar]
- Clark JB. N-acetyl aspartate: a marker for neuronal loss or mitochondrial dysfunction. Dev. Neurosci. 1998;20:271–276. doi: 10.1159/000017321. [DOI] [PubMed] [Google Scholar]
- Clark JM, Marks MP, Adalsteinsson E, Spielman DM, Shuster D, Horouplan D, Albers GW. MELAS: Clinical and pathologic correlations with MRI, xenon/CT, and MR spectroscopy. Neurology. 1996;46:223–227. doi: 10.1212/wnl.46.1.223. [DOI] [PubMed] [Google Scholar]
- De Stefano N, Matthews PM, Ford B, Genge A, Karpati G, Arnold DL. Short-term dichloroacetate treatment improves indices of cerebral metabolism in patients with mitochondrial disorders. Neurology. 1995;45:1193–1198. doi: 10.1212/wnl.45.6.1193. [DOI] [PubMed] [Google Scholar]
- DiMauro S. Mitochondrial diseases. Biochim. Biophys. Acta. 2004;1658:80–88. doi: 10.1016/j.bbabio.2004.03.014. [DOI] [PubMed] [Google Scholar]
- Dinopoulos A, Cecil KM, Schapiro MB, Papadimitriou A, Hadjigeorglou GM, Wong B, de Grauw T, Egelhoff JC. Brain MRI and proton MRS findings in infants and children with respiratory chain defects. Neuropediatrics. 2005;36:290–301. doi: 10.1055/s-2005-872807. [DOI] [PubMed] [Google Scholar]
- Erecianska M, Silver IA. ATP and brain function. J. Cereb. Blood Flow Metab. 1989;9:2–19. doi: 10.1038/jcbfm.1989.2. [DOI] [PubMed] [Google Scholar]
- Farina L, Chiapparine L, Uziel G, Bugiani M, Zeviani M, Savoiardo M. MR findings in Leigh syndrome with COX deficiency and SURF-1 mutations. AJNR Am. J. Neuroradiol. 2002;23:1095–1100. [PMC free article] [PubMed] [Google Scholar]
- Feng F, You H, Gao J, Li XZ, Meng CL, Sun HY, Jin ZY, Gao YP. Evaluation of mitochondrial encephalomyopathy with lactic acidosis and stroke-like episodes with magnetic resonance imaging and proton magnetic resonance spectroscopy. Chin. Med. Sci. J. 2006;21:234–238. [PubMed] [Google Scholar]
- Flanigan KM, Johns DR. Association of the 11,778 mitochondrial DNA and demyelinating disease. Neurology. 1993;43:2720–2722. doi: 10.1212/wnl.43.12.2720. [DOI] [PubMed] [Google Scholar]
- Furuya H, Sugimura T, Yamada T, Hayashi K, Kobayashi T. A case of incomplete Kearns-Sayre syndrome with a stroke like episode. Rinsho Shinkeigaku. 1997;37:680–684. [PubMed] [Google Scholar]
- Garroway A, Grannell P, Mansfield P. Image formation in NMR by selective irradiative process. J. Phys. C: Solid State Phys. 1974;7:457–462. [Google Scholar]
- Goto Y, Nonaka I, Horai S. A mutation in the tRNA leu (UUR) gene associated with the MELAS subgroup of mitochondrial encephalomyopathies. Nature. 1990;348:651–653. doi: 10.1038/348651a0. [DOI] [PubMed] [Google Scholar]
- Gruetter R. In vivo 13C NMR studies of compartmentalized cerebral carbohydrate metabolism. Neurochem. Int. 2002;41:143–154. doi: 10.1016/s0197-0186(02)00034-7. [DOI] [PubMed] [Google Scholar]
- Hakonen AH, Isohanni P, Paetau A, Herva R, Suomalainen A, Lonnqvist T. Recessive Twinkle mutations in early onset encephalopathy with mtDNA depletion. Brain. 2006;130:3032–3040. doi: 10.1093/brain/awm242. [DOI] [PubMed] [Google Scholar]
- Hass RH, Parikh S, Falk MJ, Saneto RP, Wolf NI, Darin N, Cohen BH. Guidelines for the generalist on the diagnosis of mitochondrial disease. Pediatrics. 2007;120:1326–1333. doi: 10.1542/peds.2007-0391. [DOI] [PubMed] [Google Scholar]
- Harding BN. Progressive neuronal degeneration of childhood with liver diseases (Alpers-Huttenlocher syndrome): a personal review. J. Child. Neurol. 1990;5:273–287. doi: 10.1177/088307389000500402. [DOI] [PubMed] [Google Scholar]
- Hirano M, Pavlakis S,G. Mitochondrial myopthay, encephalopathy, lactic acidosis, and strokelike episodes (MELAS): current concepts. J. Child Neurol. 1994;9:4–13. doi: 10.1177/088307389400900102. [DOI] [PubMed] [Google Scholar]
- Horvath R, Gudson G, Ferrari G, Futterer N, Ahola S, Lamantea E, Prokisch H, Lochmuller H, McFarland R, Ramesh V, Klopstock T, Freisinger P, Salvi F, Mayr JA, Santer R, Tesarova M, Zeman J, Udd B, Taylor RW, Turnbull D, Hanna M, Fialho D, Suomalainen A, Zeviani M, Chinnery PF. Phenotypic spectrum associated with mutations of the mitochondrial polymerase γ gene. Brain. 2006;129:1674–1684. doi: 10.1093/brain/awl088. [DOI] [PubMed] [Google Scholar]
- Isobe T, Matsumura A, Anno I, Kawamura H, Shibata Y, Muraishi H, Minami M. Lactate quantification by proton magnetic resonance spectroscopy using a clinical MRI machine: a basic study. Australas Radiol. 2007;51:330–333. doi: 10.1111/j.1440-1673.2007.01745.x. [DOI] [PubMed] [Google Scholar]
- Jaksch M, Horvath R, Horn N, Auer DP, Macmillan C, Peters J, Gerbitz KD, Kraegeloh-Mann I, Muntau A, Karcagi V, Kalmanchey R, Lochmuller H, Shoubridge EA, Freisinger P. Homozygosity (E140K) in SCO2 causes delayed infantile onset of cardiomyopathy and neuropahty. Neurology. 2001;57:1440–1446. doi: 10.1212/wnl.57.8.1440. [DOI] [PubMed] [Google Scholar]
- Jansen PH, van der Knaap MS, de Coo IF. Leber's hereditary optic neuropathy with the 11,778 mtDNA mutation and white matter disease resembling multiple sclerosis: clinical, MRI and MRS findings. J .Neurol. Sci. 1996;135:176–180. doi: 10.1016/0022-510x(95)00287-c. [DOI] [PubMed] [Google Scholar]
- Janssen RJRJ, Nijtmans IG, van den Heuvel LP, Smeitink JAM. Mitochondrial complex I: structure, function and pathology. J. Inherit. Metab. Dis. 2006;29:499–515. doi: 10.1007/s10545-006-0362-4. [DOI] [PubMed] [Google Scholar]
- Jeppesen TD, Schwartz M, Hansen K, Danielsen EG, Wibrand F, Vissing J. Late onset of stroke-like episode associated with a 3256C->T point mutation of mitochondrial DNA. J. Neurol. Sci. 2003;214:17–20. doi: 10.1016/s0022-510x(03)00168-0. [DOI] [PubMed] [Google Scholar]
- Kalman B, Alder H. Is the mitochondrial DNA involved in determining susceptibility to multiple sclerosis? Acta Neurol. Scand. 1998;98:232–237. doi: 10.1111/j.1600-0404.1998.tb07301.x. [DOI] [PubMed] [Google Scholar]
- Kang H-C, Lee Y-M, Kim HD, Lee JS, Slama A. Safe and effective use of the ketogenic diet in children with epilepsy and mitochondrial respiratory chain complex defects. Epilepsia. 2008;48:82–88. doi: 10.1111/j.1528-1167.2006.00906.x. [DOI] [PubMed] [Google Scholar]
- Kapeller P, Fazekas F, Offenbacher H, Stollberger R, Schmidt R, Bergloff J, Radner H, Fazekas G, Schafhalter-Zoppoth I. Magnetic resonance imaging and spectroscopy of progressive cerebral involvement in Kearns Sayre Syndrome. J. Neurol. Sci. 1996;135:126–130. doi: 10.1016/0022-510x(95)00290-i. [DOI] [PubMed] [Google Scholar]
- Keevil SF. Spatial localization in nuclear magnetic resonance spectroscopy. Phys. Med. Biol. 2006;51:579–636. doi: 10.1088/0031-9155/51/16/R01. [DOI] [PubMed] [Google Scholar]
- Kearns TP, Sayre GP. Retinitis pigmentosa, external ophthalmoplegia and complete heart block. Arch Ophthalmol. 1958;60:280–289. [PubMed] [Google Scholar]
- Kim HS, Kim DI, Lee BI, Jeong EK, Choi C, Lee JD, Yoon PH, Kim EJ, Kim SH, Yoon YK. Diffusion-weighted image and MR spectroscopic analysis of a case of MELAS with repeated attacks. Yonsei Med. J. 2001;42:128–133. doi: 10.3349/ymj.2001.42.1.128. [DOI] [PubMed] [Google Scholar]
- Kimura S, Ohtuki N, Nezu A, Tanaka M, Takeshita S. Clinical and radiologic improvements in mitochondrial encephalomyopathy following sodium dichloroacetate therapy. Brain Dev. 1997;19:535–540. doi: 10.1016/s0387-7604(97)00074-0. [DOI] [PubMed] [Google Scholar]
- Kingsley PB, Shah TC, Woldenberg R. Identification of diffuse and focal brain lesions by clinical magnetic resonance spectroscopy. NMR Biomed. 2006;19:435–462. doi: 10.1002/nbm.1039. [DOI] [PubMed] [Google Scholar]
- Kuwabara T, Watanabe H, Tanaka K, Tsuji S, Ohkubo M, Ito T, Sakai K, Yuasa T. Mitochondrial encephalomyopathy: elevated visual cortex lactate unresponsive to Photic stimulation-a localized 1H-MRS study. Neurology. 1994;44:557–559. doi: 10.1212/wnl.44.3_part_1.557. [DOI] [PubMed] [Google Scholar]
- Lange T, Dydak U, Roberts TP, Rowley HA, Bjeljac M, Boesiger P. Pitfalls in lactate measurements at 3T. AJNR Am. J. Neuroradiol. 2006;27:895–901. [PMC free article] [PubMed] [Google Scholar]
- Larsson N-G, Holme E, Kristiansson B, Oldfors A, Tulinius M. Progressive increase of the mutated mitochondrial DNA fraction in Kearns-Sayre syndrome. Pediatr. Res. 1990;28:131–136. doi: 10.1203/00006450-199008000-00011. [DOI] [PubMed] [Google Scholar]
- Lauterbur PC. Image formation by induced local interactions: examples of employing nuclear magnetic resonance. Nature. 1973;242:190–191. [PubMed] [Google Scholar]
- Leigh D. Subacute necrotizing encephalomyelopathy in an infant. J. Neurol. Neurosurg. Psychiatry. 1951;14:216–221. doi: 10.1136/jnnp.14.3.216. [DOI] [PMC free article] [PubMed] [Google Scholar]
- Lerman-Sagie T, Leshinsky-Silver E, Watemberg N, Luckman Y, Lev D. White matter involvement in mitochondrial diseases. Mol. Genet. Metab. 2005;84:127–136. doi: 10.1016/j.ymgme.2004.09.008. [DOI] [PubMed] [Google Scholar]
- Leutner C, Layer G, Zierz S, Solymosi L, Dewes W, Reiser M. Cerebral MR in ophthalmoplegia plus. AJNR Am. J. Neuroradiol. 1994;15:681–687. [PMC free article] [PubMed] [Google Scholar]
- Lin DD, Crawford TO, Baker PB. Proton MR spectroscopy in the diagnostic evaluation of suspected mitochondrial disease. AJNR Am. J. Neuroradiol. 2003;24:33–41. [PMC free article] [PubMed] [Google Scholar]
- Lodi R, Montagna P, Iotti S, Zaniol P, Barboni P, Puddu P, Barbiroli B. Brain and muscle energy metabolism studied in vivo by 31P-magnetic resonance spectroscopy in NARP syndrome. J. Neurol. Neurosurg. Psychiatry. 1994;57:1492–1496. doi: 10.1136/jnnp.57.12.1492. [DOI] [PMC free article] [PubMed] [Google Scholar]
- Majoie CB, Akkerman EM, Blank C, Barth PG, Poll-The BT, den Heeten GJ. Mitochondrial encephalomyopathy comparison of convention MR imaging with diffusion-weighted and diffusion tensor imaging case report. AJNR Am. J. Neuroradiol. 2002;23:813–816. [PMC free article] [PubMed] [Google Scholar]
- Malfatti E, Bugiani M, Ivernizzi F, Fischinger-Moura de Souza C, Farina L, Carrara F, Lamantea E, Antozzi C, Confalonieri P, Sanseverino MT, Glugliani R, Uziel G, Zeviani M. Novel mutations of ND genes in complex I deficiency associated with mitochondrial encephalopathy. Brain. 2007;130:1894–1904. doi: 10.1093/brain/awm114. [DOI] [PubMed] [Google Scholar]
- Maricich SM, Azizi P, Jones JY, Morriss MC, Hunter JV, Smith EO, Miller G. Myelination as assessed by conventional MR imaging is normal in young children with idiopathic developmental delay. AJNR Am. J. Neruoradiol. 2007;28:1602–1605. doi: 10.3174/ajnr.A0602. [DOI] [PMC free article] [PubMed] [Google Scholar]
- Marti R, Nishigaki Y, Vila MR, Hirano M. Alteration of nucleotide metabolism: a new mechanism for mitochondrial disorders. Clin. Chem. Lab. Med. 2003;41:845–851. doi: 10.1515/CCLM.2003.128. [DOI] [PubMed] [Google Scholar]
- Matthews P, Tampieri D, Barkovich S, Andermann F, Silver K, Chityat D, Arnold DL. Magnetic resonance imaging shows specific abnormalities in the MELAS syndrome. Neurology. 1991;41:1043–1046. doi: 10.1212/wnl.41.7.1043. [DOI] [PubMed] [Google Scholar]
- McShane MA, Hammans SR, Sweeney M, Holt IJ, Beattie TJ, Brett EM, Harding AE. Pearson syndrome and mitochondrial encephalomyopathy in a patient with a deletion of mtDNA. Am. J. Hum. Genet. 1991;48:39–42. [PMC free article] [PubMed] [Google Scholar]
- Moller HE, Wiedermann D, Jurlemann G, Hilbih T, Schuierer G. Application of NMR spectroscopy to monitoring MELAS treatment: a case report. Muscle Nerve. 2002;25:593–600. doi: 10.1002/mus.10084. [DOI] [PubMed] [Google Scholar]
- Morava E, va den Heuvel L, Hol F, de Bries MC, Hogeveen M, Rodenburg RJ, Smeitink JAM. Mitochondrial disease criteria; diagnostic applications in children. Neurology. 2006;67:1823–1826. doi: 10.1212/01.wnl.0000244435.27645.54. [DOI] [PubMed] [Google Scholar]
- Moroni I, Bugiani M, Bizzi A, Castelli G, Lamantea E, Uziel G. Cerebral white matter involvement in children with mitochondrial encephalopathies. Neuropediatrics. 2002;33:79–85. doi: 10.1055/s-2002-32372. [DOI] [PubMed] [Google Scholar]
- Munoz A, Mateos F, Simou R, Garcia-Silva MT, Cabello S, Arenas J. Mitochondrial diseases in children: neuroradiological and clinical features in 17 patients. Neuroradiol. 1999;41:920–928. doi: 10.1007/s002340050868. [DOI] [PubMed] [Google Scholar]
- Naviaux RK, Nguyen KV. POLG mutations associated with Alpers’ syndrome and mitochondrial DNA depletion. Ann, Neurol. 2004;55:706–712. doi: 10.1002/ana.20079. [DOI] [PubMed] [Google Scholar]
- Nakamura S, Yoshinari M, Wakisaka M, Kodera H, Doi Y, Yoshizumi H, Asano T, Iwase M, Mihara F, Fujishima M. Ketoacidosis accompanied by epileptic seizures in a patient with diabetes mellitus and mitochondrial myopathy, encephalopathy lactic acidosis and stroke-like episodes (MELAS). Diabetes Metab. 2000;26:407–410. [PubMed] [Google Scholar]
- Nikoskelainen EK, Martila RJ, Huoponen K, Juvonen V, Lamminen T, Sonninen P, Savontaus ML. Leber's “plus” neurological abnormalities in patients with Leber's hereditary optic neuropathy. J. Neurol. Neurosurg. Psychiatry. 1995;59:160–164. doi: 10.1136/jnnp.59.2.160. [DOI] [PMC free article] [PubMed] [Google Scholar]
- Nisho I, Spinazzola A, Papadimitriou A, Hammans S, Steiner I, Hahn CD, Connolly AM, Verloes A, Guimares J, Maillard I, Hamano H, Donati MA, Semrad CE, Russell JA, Andreu AL, Hadjigeorgiou GM, Vu TH, Tadesse S, Nygaard TG, Nonaka I, Hirano I, Bonilla E, Rowland LP, DiMauro S, Hirano M. Mitochondrial neurogastroinstestinal encephalomyopathy: an autosomal recessive disorder due to thymidine phosphorylase mutations. Ann. Neurol. 2000;47:792–800. [PubMed] [Google Scholar]
- Nissenkorn A, Zeharia A, Lev D, Watemberg N, Fattal-Valevski A, Barash V, Gutman A, Harel S, Lerman-Sagie T. Neurologic presentations of mitochondrial disorders. J. Child. Neurol. 2000;15:44–48. doi: 10.1177/088307380001500110. [DOI] [PubMed] [Google Scholar]
- Nonaka I. Approach for a final diagnosis of mitochondrial disease. Nippon Rinsho. 2002;60(Suppl 4):224–228. [PubMed] [Google Scholar]
- Oppenheim C, Galanaud D, Samson Y, Sahel M, Dormont D, Wechsler B, Marsault C. Can diffusion weighted magnetic resonance imaging help differentiate stroke from stroke-like events in MELAS? J. Neurol. Neurosurg. Psychiatry. 2000;69:248–250. doi: 10.1136/jnnp.69.2.248. [DOI] [PMC free article] [PubMed] [Google Scholar]
- Paviakis SG, Phillips PC, DiMauro S, De Vivo DC, Rowland LP. Mitochondrial myopathy, encephalopathy, lactic acidosis, and stroke-like episodes (MELAS): a distinctive clinical syndrome. Ann. Neurol. 1984;16:481–488. doi: 10.1002/ana.410160409. [DOI] [PubMed] [Google Scholar]
- Pearson HA, Lobel JS, Kocoshis SA, Naiman JL, Windmiller J, Lammi AT, Hoffman R, Marsh JC. A new syndreom of refractory sideroblastic anemia with vacuolization of marrow precursors and exocrine pancreatic dysfunction. J. Pediat. 1979;95:976–984. doi: 10.1016/s0022-3476(79)80286-3. [DOI] [PubMed] [Google Scholar]
- Pouwels PJ, Frahm J. Regional metabolic concentrations in human brain as determined by quantitative localized proton MRS. Magn. Reson. Med. 1998;39:53–60. doi: 10.1002/mrm.1910390110. [DOI] [PubMed] [Google Scholar]
- Rahman S, Brown RM, Chong WK, Wilson GK, Brown GK. A SURF1 gene mutation presenting as isolated leukodystrophy. Ann. Neurol. 2001;49:797–800. doi: 10.1002/ana.1060. [DOI] [PubMed] [Google Scholar]
- Ribacoba R, Salas-Puig J, Gonzalez C, Astudillo A. Characteristics of status epilepticus in MELAS. Analysis of four cases. Neurologia. 2006;21:1–11. [PubMed] [Google Scholar]
- Ross BD. Real or imaginary? Human metabolism through nuclear magnetism. IUBMB Life. 2000;50:177–187. doi: 10.1080/152165400300001499. [DOI] [PubMed] [Google Scholar]
- Ross B, Bluml S. Magnetic resonance spectroscopy of the human brain. Anat. Rec. 2001;265:54–84. doi: 10.1002/ar.1058. [DOI] [PubMed] [Google Scholar]
- Rotig A, Colonna V, Bonnefont JP, Blanch S, Fischer A, Saudubray JM, Munnich A. Mitochondrial DNA deletion in Pearson's marrow/pancrease syndrome. Lancet. 1989;1:902–903. doi: 10.1016/s0140-6736(89)92897-3. [DOI] [PubMed] [Google Scholar]
- Rotig A, Cormier V, Blanche S, Bonnefont JP, Ledeist F, Romero N, Schmitz J, Rustin P, Fischer A, Saudubray JM, Munnich A. Pearson's marrow-pancreas syndrome: a multisystem mitochondrial disorder in infancy. J. Clin. Invest. 1990;86:1601–1608. doi: 10.1172/JCI114881. [DOI] [PMC free article] [PubMed] [Google Scholar]
- Saitoh S, Momoi MY, Yamagata T, Mori Y, Imai M. Effects of dichloroacetate in three patients with MELAS. Neurology. 1998;50:531–534. doi: 10.1212/wnl.50.2.531. [DOI] [PubMed] [Google Scholar]
- Sanderson S, Green A, Preece MA, Burton H. The incidence of inherited metabolic disorders in the West Midlands, UK. Arch. Dis. Child. 2006;9111:896–899. doi: 10.1136/adc.2005.091637. [DOI] [PMC free article] [PubMed] [Google Scholar]
- Saneto RP, Cohen BH, Ruggieri P, Hoppel CL. MRS detection of CNS lactate peaks in primary mitochondrial cytopathies. Neurology. 2001;56(Suppl 3):A42. [Google Scholar]
- Saunders DE, Howe FA, van den Boogaart A, Griffiths JR, Brown MM. In vivo quantitation of metabolite content with proton magnetic resonance spectroscopy. J. Magn. Reson. Imaging. 1999;9:711–716. doi: 10.1002/(sici)1522-2586(199905)9:5<711::aid-jmri14>3.0.co;2-3. [DOI] [PubMed] [Google Scholar]
- Scheper GC, van der Klok T, van Andel RJ, van Berkel CGM, Sissler M, Smet J, Muravina TI, Serkov SV, Uziel G, Bugiani M, Schiffmann R, Krageloh-Mann I, Smeitink JAM, Florentz C, Van Coster R, Pronk JC, van der Knaap MS. Mitochondrial aspartyl-tRNA synthetase deficiency causes leukoencephalopathy with brain stem and spinal cord involvement and lactate elevation. Nat. Genet. 2007;39:534–539. doi: 10.1038/ng2013. [DOI] [PubMed] [Google Scholar]
- Schuelke M, Smeitink J, Mariman J, Loeffen J, Plecko B, Trijbels F, Stockler-Ipsiroghu S, von den Heuvel L. Mutant NDUUFV1 subunit of mitochondrial complex I causes leukodystrophy and myoclonic epilepsy. Nat. Genet. 1999;21:260–261. doi: 10.1038/6772. [DOI] [PubMed] [Google Scholar]
- Seijo-Martinex M, Casstro del Rio M, Campos Y, Palau F, Arenas J, Teijeira S, Fernandez Hojas R, Navarro C. Unusual clinical findings and complex III deficiency was reported in a family with myoclonic dystrophy. J. Neurol. Sci. 2003;208:87–91. doi: 10.1016/s0022-510x(02)00442-2. [DOI] [PubMed] [Google Scholar]
- Shoubridge EA. Nuclear genetic defects of oxidative phosphorylation. Hum. Mol. Genet. 2001;10:2277–2284. doi: 10.1093/hmg/10.20.2277. [DOI] [PubMed] [Google Scholar]
- Simon L, Horoupian D, Dorfman L, Markds M, Herrick MK, Wasserstein P, Smith ME. Polyneuropathy, ophthalmoplegia, leukoencephalopathy and intestinal pseudo-obstruction: POLIP syndrome. Ann. Neurol. 1990;28:349–360. doi: 10.1002/ana.410280308. [DOI] [PubMed] [Google Scholar]
- Skladal D, Halliday J, Thorburn DR. Minimum birth prevalence of mitochondrial respiratory chain disorders in children. Brain. 2003;126:1905–1912. doi: 10.1093/brain/awg170. [DOI] [PubMed] [Google Scholar]
- Sparaco M, Bonilla E, DiMauro S, Powers J. Neuropathology of mitochondrial encephalopathies due to mitochondrial DNA defects. J. Neuropathol. Ex. Neurol. 1993;52:1–10. doi: 10.1097/00005072-199301000-00001. [DOI] [PubMed] [Google Scholar]
- Stockler S, Hanefeld F, Frahm J. Creatine replacement therapy in guanidinoacetate methyltransferase deficiency: a novel inborn error of metabolism. Lancet. 1996;348:789–790. doi: 10.1016/s0140-6736(96)04116-5. [DOI] [PubMed] [Google Scholar]
- Stockler S, Holzbach U, Hanefeld F, Marquardt I, Helms G, Requart M, Hanicke W, Frahm J. Creatine deficiency in the brain: a new, treatable inborn error of metabolism. Pediatr. Res. 1994;36:409–413. doi: 10.1203/00006450-199409000-00023. [DOI] [PubMed] [Google Scholar]
- Takanashi J, Sugita K, Tanabe Y, Maemoto T, Niimi H. Dichloroacetate treatment in Leigh syndrome caused by mitochondrial DNA mutation. J. Neurol. Sci. 1997;145:83–86. doi: 10.1016/s0022-510x(96)00248-1. [DOI] [PubMed] [Google Scholar]
- Thorburn DR, Sugiana C, Salemi R, Kirby DM, Worgan L, Ohtake A, Ryan MT. Biochemical and molecular diagnosis of mitochondrial respiratory chain disorders. Bichim. et Biophys. Acta. 2004;1659:121–128. doi: 10.1016/j.bbabio.2004.08.006. [DOI] [PubMed] [Google Scholar]
- Tzoulis C, Engelsen BA, Tehstad W, Aasly J, Zeviana M, Winterthun S, Ferrari G, Aarseth JH, Bindoff LA. The spectrum of clinical disease caused by the A467T and W748S POLG mutations: a study of 26 cases. Brain. 2006;129:1685–1692. doi: 10.1093/brain/awl097. [DOI] [PubMed] [Google Scholar]
- Ulmer S, Flemming K, Hahn A, Stephani U, Jansen O. Detection of acute cytotoxic changes in progressive neuronal degeneration of childhood with liver disease (Alpers-Huttenlocher syndrome) using diffusion-weighted MRI and MR spectroscopy. J. Comput. Assist. Tomogr. 2002;26:641–646. doi: 10.1097/00004728-200207000-00030. [DOI] [PubMed] [Google Scholar]
- Valanne L, Ketonen L, Majander A, Suomalainen A, Pihko H. Neuroradiologic findings in children with mitochondrial disorders. AJNR Am. J. Neuroradiol. 1998;19:369–377. [PMC free article] [PubMed] [Google Scholar]
- Van der Knaap MS, van der Voorn P, Barkhof F, Van Coster R, Krageloh-Mann I, Feigenbaum A, Blaser S, Vies JSH, Rieckmann P, Pouwels PJW. A new leukoencephalopathy with brainstem and spinal cord involvement and high lactate. Ann. Neurol. 2003;53:252–258. doi: 10.1002/ana.10456. [DOI] [PubMed] [Google Scholar]
- van der Knaapp MS, Jakobs C, Valk J. Magnetic resonance imaging in lactic acidosis. J. Inherit. Metab. Dis. 1996;19:535–547. doi: 10.1007/BF01799114. [DOI] [PubMed] [Google Scholar]
- Walker UA, Collins S, Byrne E. Respiratory chain encephalomyopathies: a diagnostic classification. Eur. Neurol. 1996;36:260–267. doi: 10.1159/000117269. [DOI] [PubMed] [Google Scholar]
- Wallace DC, Singh G, Lott MT, Hodge JA, Schurr TG, Lezza A, Elsas LJ, Nikoskelainen EK. Mitochondrial DNA mutation associated with Leber's hereditary optic neuropathy. Science. 1988;242:1427–1430. doi: 10.1126/science.3201231. [DOI] [PubMed] [Google Scholar]
- Wang Y, Li SJ. Differentiation of metabolic concentrations between gray matter and white matter of human brain by in vivo 1H magnetic resonance spectroscopy. Magn. Reson. Med. 1998;39:28–33. doi: 10.1002/mrm.1910390107. [DOI] [PubMed] [Google Scholar]
- Wilichowski E, Pouwels PJ, Frahm J, Hanefeld F. Quantitative proton magntic resonance spectgroscopy of cerebral metabolic disturbances in patients with MELAS. Neuropediatrics. 1999;30:256–263. doi: 10.1055/s-2007-973500. [DOI] [PubMed] [Google Scholar]
- Wolf NI, Smeitnink JA. Mitochondrial disorders: a proposal for consensus diagnostic criteria in infants and children. Neurology. 2002;59:1402–1405. doi: 10.1212/01.wnl.0000031795.91814.d8. [DOI] [PubMed] [Google Scholar]
- Wray SH, Provenzale JM, Johns DR, Thulborn KR. MR of the brain in mitochondrial myopathy. AJNR Am, J, Neuroradiol. 1995;16:1167–1173. [PMC free article] [PubMed] [Google Scholar]
- Yonenura K, Hasegawa Y, Kimura K, Minematsu K, Yamaguchi T. Diffusion-weighted MR imaging in a case of mitochondrial myoptahy, encephalopathy, lactic acidosis, and stroke-like episodes. AJNR Am. J. Neuroradiol. 2001;22:269–272. [PMC free article] [PubMed] [Google Scholar]
- Zafeirou DI, Koletzko B, Mueller-Felber W, Paetzke I, Kueffer G, Jensen M. Deficiency in complex IV (cytochrome c oxidase) of the respiratory chain, presenting as leukodystrophy in two siblings with Leigh syndrome. Brain Dev. 1995;17:117–121. doi: 10.1016/0387-7604(94)00098-i. [DOI] [PubMed] [Google Scholar]
- Zeviani M, Di Donato S. Mitochondrial Disorders. Brain. 2004;127:2153–2172. doi: 10.1093/brain/awh259. [DOI] [PubMed] [Google Scholar]
- Zeviani M, Moraes CT, DiMauaro S, Nakase H, Bonilla E, Schon EA, Rowland LP. Deletions of mitochondrial DNA in Kearns-Sayre syndrome. Neurology. 1988;38:1339–1346. doi: 10.1212/wnl.38.9.1339. [DOI] [PubMed] [Google Scholar]