Abstract
β-Secretase, a.k.a. β-APP cleaving enzyme (BACE), is an aspartyl protease that has been implicated as a key target in the pathogenesis of Alzheimer’s disease (AD). The identification of the protonation states of the key aspartates in β-secretase is of great interest both in understanding the reaction mechanism and in guiding the design of drugs against AD. However, the resolutions of currently available crystal structures for BACE are not sufficient to determine the hydrogen atom locations. We have assigned the protonation states of the key aspartates using a novel method, QM/MM X-ray refinement. In our approach, an energy function is introduced to the refinement where the atoms in the active site are modeled by quantum mechanics (QM) and the other atoms are represented by molecular mechanics (MM). The gradients derived from the QM/MM energy function are combined with those from the X-ray target to refine the crystal structure of a complex containing BACE and an inhibitor. A total number of 8 protonation configurations of the aspartyl dyad were considered and QM/MM X-ray refinements were performed for all of them. The relative stability of the refined structures was scored by constructing the thermodynamic cycle using the energetics calculated by fully quantum mechanical self-consistent reaction field (QM/SCRF) calculations. While all 8 refined structures fit the observed electron density about equally well, we find the mono-protonated configurations to be strongly favored energetically, especially the configuration with the inner oxygen of Asp32 protonated and the hydroxyl of the inhibitor pointing towards Asp228. It was also found that these results depend on the constraints imposed by the X-ray data. We suggest that one of the strengths of this approach is that the resulting structures are a consensus of theoretical and experimental data and remark on the significance of our results in structure based drug design and mechanistic studies.
Keywords: β-secretase, aspartyl protease, protonation state, quantum mechanics, QM/MM, X-ray structure refinement, self-consistent reaction field, Poisson-Boltzmann
Introduction
Amyloid plaques are extracellular deposits of β-amyloid proteins (Aβ) which accumulate outside the brain’s nerve cells. The presence of amyloid plaques in the brain is a characteristic feature of Alzheimer’s disease (AD).1 Aβ is derived in vivo from proteolytic cleavage of the membrane-anchored amyloid precursor protein (APP) by β- andβ-secretases.2-5 Therefore, designing small molecule drugs that can inhibit Aβ production constitutes a promising strategy for treating AD, especially for patients who are still in early clinical phases of the disease with minimal cognitive impairment.
One of the therapeutic targets in these drug design efforts, β-secretase or β-APP cleaving enzyme (BACE), belongs to the family of aspartyl proteases. A number of crystal structures have been solved which provide direct structural information on this important enzyme. The first X-ray structure of β-Secretase in complex with an inhibitor OM99-2 (1FKN) was solved by Hong et al. at a resolution of 1.9 Å6. Hong and coworkers later determined the crystal structure of BACE bound with a more potent inhibitor OM00-3 (1M4H) at a resolution of 2.1 Å7 and the crystal structure of apo BACE (1SGZ) at a resolution of 2.0 Å8. Patel and colleagues solved the structure of apo-BACE (1W50) at 1.75 Å and the inhibitor bound BACE (1W51) at 2.55 Å9. Figure 1 shows the 1FKN structure solved by Hong et al.6 A common structural feature among aspartyl proteases is the presence of two aspartates near the active sites,10,11 which, in the case of β-secretase, are Asp32 and Asp228.
Figure 1.
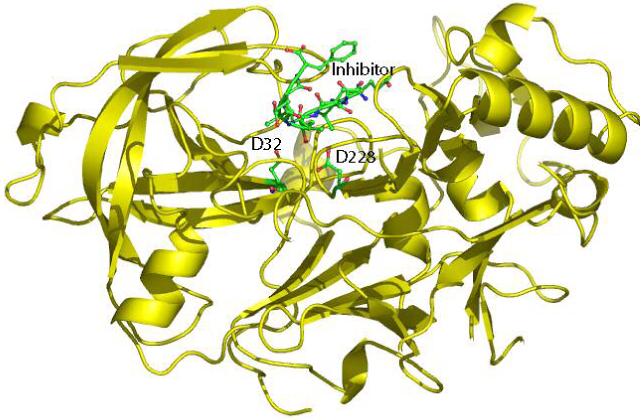
The 1FKN structure6 where the protein is rendered with ribbon representation and the catalytic aspartates and the inhibitor are rendered with ball and stick models.
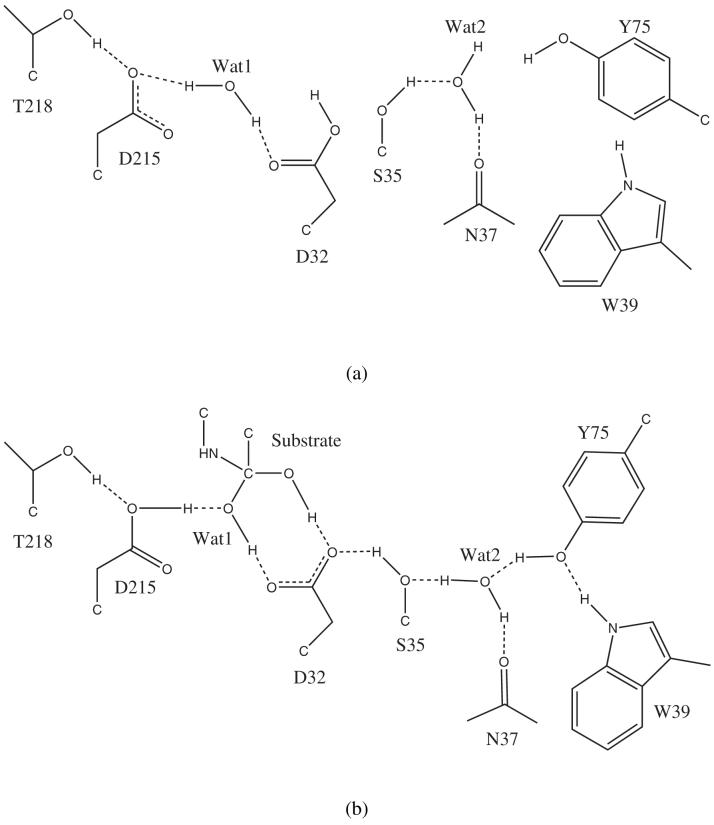
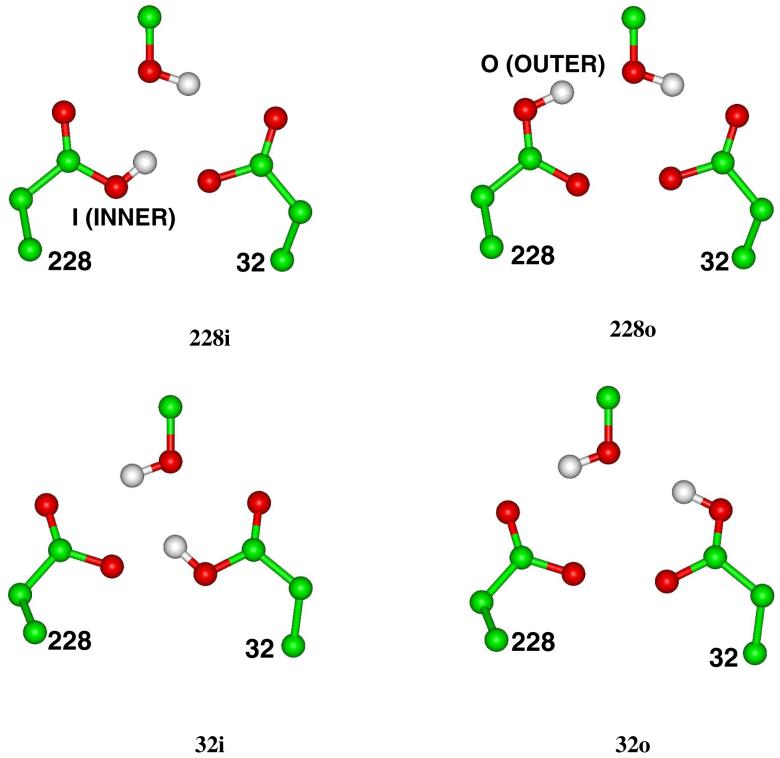
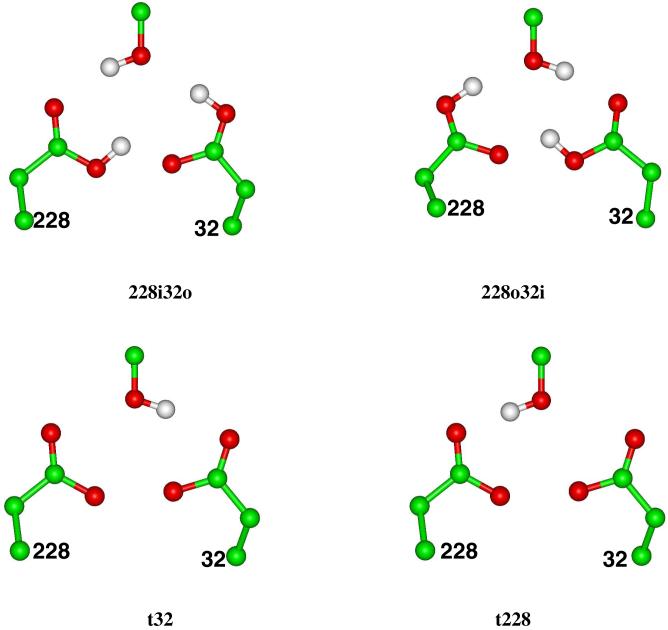
The reaction mechanism shown in Figure 2 was proposed by Andreeva et al.10, which involves a base-catalyzed attack of a water molecule on the scissile amide carbonyl to form a tetrahedral intermediate. The reaction then proceeds via C-N bond cleavage, yielding the products of proteolysis. This mechanism implies a mono-protonated arrangement of the catalytic aspartates12-16 and a complex network of hydrogen bonds at the active site. Figure 3 displays the definitions of the possible protonation states as well as the inner and outer oxygen atoms of Asp32 and Asp228 that will be considered in this work. This mechanism also suggests that if β-secretase starts a reaction cycle with Asp32 protonated and Asp228 ionized, the key aspartates will be in the opposite protonation states after formation of the tetrahedral intermediate, namely Asp228 will be protonated as a result of abstraction of a proton from the attacking water molecule and Asp32 will in turn be de-protonated after delivering its proton to the carbonyl of the substrate. The fact that one of the aspartates is believed to be protonated suggests a highly hydrophobic active site environment, which causes a large pKa shift on one or both of the side chains of the key aspartates. On the other hand, if the mono-protonated configuration is assumed by β-secretase under physiological conditions, a further question arises regarding the respective protonation states of Asp32 and Asp228 at each step in the enzyme’s catalytic cycle.
Figure 2.
Schematic representation of the proposed acid-base mechanism proposed by Andreeva et al. 10 for the proteolysis reactions catalyzed by aspartyl proteases. (a) The initial step before substrate binding. (b) The tetrahedral intermediate and its interactions with the key residues. The numbering scheme is for pepsins.
Figure 3.
Definitions of the mono-protonated, di-protonated, and di-deprotonated states considered in this work and the inner and outer oxygen atoms of the key aspartates.
The issue of the protonation patterns of the key aspartyl groups in β-secretase has spurred widespread interests from both the experimental and theoretical perspectives. In principle, the protonation states of buried ionizable residues can be directly probed by locating the coordinates of hydrogen atoms in diffraction experiments. However at the resolutions that the β-secretase crystal structures were solved,6-9 hydrogen atom coordinates cannot be determined. Neutron scattering is another diffraction technique and can locate hydrogen atoms directly. It has been applied in a study by Coates et al. to determine the protonation state of the critical residues in endothiapepsin.17 Nevertheless, the resolutions and R values of neutron structures are often much poorer than those of similar X-ray structures and currently the difficulties associated with this technique has limited its application to a broader range of systems. Despite the lack of unequivocal structural evidence, much of the experimental work on this subject has based their analyses on the assumption of a mono-protonated configuration. For example, Toulokhonova et al.18 employed peptide inhibition data, solvent kinetic isotope effects and proton NMR spectroscopy to study the steady-state kinetics mechanism of the proteolysis reaction of BACE in the presence of its substrates and inhibitors and pointed to the steps following the collapse of the tetrahedral intermediate as rate limiting. On the theoretical side, Park and Lee utilized molecular dynamics (MD) simulations and computational docking experiments to assess the relative stability of the protonation states when the enzyme was bound to an 8-residue peptidomimetic inhibitor (OM99-2)19, where the scissile amide carbonyl was replaced by a hydroxyethylene fragment. Two mono-protonated configurations were considered in this study, one of them being the state where Asp32 was protonated and the hydroxyl of the hydroxyethylene pointed towards Asp228 (32i in Figure 3) and vice versa (228i in Figure 3). Although the simulations suggested the former to be the favored arrangement, the possibilities of di-protonated and di-deprotonated configurations and alternative mono-protonated states were not addressed. Rajamani and Reynolds employed a quantum mechanical description of the same OM99-2 bound enzyme and studied all the protonation states in Figure 3.20 They performed energy minimization on the coordinates of the atoms in the key region in the presence of the protein environment approximated by a truncated system, and concluded that the energetically favored configuration was the mono-protonated 228i state. Polgar and Keseru performed pKa calculations also on the 1FKN structure, and the titration curves they computed suggested that the 32i state was most probable when the inhibitor was bound to the enzyme21.
Studies of the protonation states on a related system in the aspartyl protease family, HIV-1 protease, have not generated a consistent answer either. Yamazaki and coworkers showed NMR and X-ray evidence that the aspartyl dyad adopted a di-protonated configuration in a complex of the enzyme bound to a non-peptide cyclic urea-based inhibitor22. Hyland et al. investigated the kinetic mechanism of the reaction for 4 oligopeptide substrates and 2 competitive inhibitors 23 and proposed that substrates should only bind to HIV-1 protease in the mono-protonated state24. Piana and colleagues carried out a series of MD simulations using the Car-Parrinello (CP) method 25,26 and QM/MM approach 27 to assign the protonation state and to characterize the free energy profile of the catalytic reaction. The CPMD results on the free enzyme suggested that the mono-protonated state was most likely25, which was used as the basis to compute the reaction free energies27. In the complex formed by HIV-1 protease bound to pepstatin A, however, the di-protonated configurations were calculated to be more stable, and the 13C NMR chemical shifts and isotopic shifts for the di-protonated configurations simulated in the CPMD calculations were shown to be consistent with experiments26. A rationalization was provided which pointed to the polarity of the ligand as an important determinant of the protonation state of the receptor26.
In this paper, we apply a new technique, quantum mechanical/molecular mechanical (QM/MM) X-ray structure refinement, to assign the protonation states of the key aspartates in a BACE crystal. This approach constrains the QM/MM calculations to be consistent with the X-ray diffraction data. We have chosen the 1FKN structure as the basis for our calculations because it is a relatively high-resolution crystal structure and has been studied very extensively in previous theoretical investigations19-21. Under the constraint of the X-ray diffraction data, we will construct a set of all-atom models containing the coordinates for hydrogen atoms in the 8 protonation states defined in Figure 3, and use an accurate energy function to identify the most probable one. Indeed, while much of the previous modeling on aspartyl proteases has involved energy minimization of X-ray coordinates, we are carrying out modeling constrained by experiment and are asking specifically what the protonation pattern of the observed X-ray experiment is. Energy minimization of protein structures starting from X-ray coordinates could introduce computational artifacts (e.g., local groups undergoing significant conformational changes, alternate protonation patterns for local groups, etc.), which could alter the prediction of the preferred protonation state of the crystal structure and ultimately affect the outcome of calculations on mode of action and inhibition. It is also possible that the crystal structure imposes constraints on the structure that will not be considered in unconstrained models. The 1FKN structure was crystallized in 0.2 M ammonium sulfate and 22.5% PEG 8000 buffered with 0.1 M Na-cacodylate at a pH of 7.4 and a temperature of 20°C.6 While these conditions may be quite different from those under which the experimental mechanistic studies and binding assays are performed, it is generally expected that the physiologically relevant conformations of proteins are not substantially altered by their incorporation into crystal lattice. Furthermore, considering the solvent content of the 1FKN structure is 56%,6 we thus hypothesize that the structure dictated by the X-ray diffraction signals is a valid model for studying the protonation state of the present system.
Theoretical Background
In protein crystallography, a model describing the electron density distribution within the unit cell is constructed with atomic coordinate parameters and vibrational parameters. These parameters are adjusted so that the predicted structure factors computed from the model electron density by Fourier transform best fit the experimental signals. In practice, refining the coordinate and vibrational parameters for all the atoms in a protein is often an underdetermined process since the amount of diffraction data is usually not sufficient to fully determine all the parameters. Consequently, the energy refinement formalism (EREF)28 was introduced to remedy this problem, giving rise to the following equation:
| (1) |
where Etotal is the function to be minimized in structure refinement, Echem is a stereochemical energy function, Ex-ray is an X-ray target function describing the discrepancy between the observed and predicted structure factors, and wx-ray is the weight at which the dimensionless quantity, Ex-ray, is factored into Etotal. The purpose of EREF is to overcome the problem of poor data-to-parameter ratio by supplementing the observations, Ex-ray, with a restraining energy function, Echem.28-30 Due to various difficulties discussed in earlier papers on this subject, in routine crystal structure refinement Echem has evolved into an incomplete molecular mechanics energy function without the electrostatics and attractive van der Waals terms.31,32 Moreover, the bond-length and bond-angle parameters employed in commonly used refinement programs such as Crystallography and NMR System (CNS) were derived from a statistical analysis of high-resolution crystal structures of small molecules by Engh and Huber.33 Utilization of an incomplete energy function, despite its necessities, has a few important limitations: 1) it makes orienting hydrogen atoms very difficult if their coordinates are desired; 2) the value computed with Echem does not provide an estimate of the true energy of the system because of the omission of some of the key contributions. Hence, the motivation for the present work is obvious: we wish to see whether replacing the incomplete energy function with a physical potential will lead to final structures that both satisfy the experimental signals and provide a basis for an analysis of the energetics of the system. The use of QM for the active site not only provides a description with enhanced accuracy but also allows possible electronic structure changes to take place. In a recent contribution, we presented a study where we combined X-ray reflection data with linear-scaling QM calculations to refine the crystal structure of bovine pancreatic trypsin inhibitor (BPTI).34 Through comparisons with the structures refined with the MM potential in CNS, we demonstrated that the QM energy restraints were capable of maintaining reasonable stereochemistry to the extent that the R and Rfree values of the QM refined structures are comparable to those of the CNS ones.
Our method is similar to the one pioneered by Ryde et al., who utilized the energy restraints derived from QM/MM calculations to refine the crystal structures of several protein-ligand co-crystals.35-41 Major differences include: 1) we only apply the QM/MM X-ray refinement to construct a set of structures that satisfy the X-ray data equally well and score their relative stability with a more accurate energy function with a continuum description of the bulk solvent; 2) our implementation is different, which will be discussed in more detail in the following section.
It is also important to highlight the differences between this approach and the calculations used to estimate the pKa shifts of ionizable residues42-45: since our structures are refined within the context of X-ray data, which is largely dominated by the configurations that are accessible energetically, the computed energy differences between the favored and disfavored states are inevitably larger than the true values as the structures of the disfavored states are also constrained to fit the X-ray data. This is necessarily so because when the X-ray data is used to constrain the structure it forces a state to occupy a region of geometric space that could be highly destabilizing to its specific protonation pattern. In other words, by using experimental constraints we are disallowing unstable structures to relax into geometries that while lower in energy represent structures that poorly reproduce the observed experimental data. In a way this exaggeration may be regarded as an amplification of the signal of interest, which can be helpful in cases where the energy differences between states are close to the expected margin of error of the energy function.
Finally, it should be noted that one of the greatest advantages of our method is that it provides an escape from the vagaries of energy minimization. Because the structures that we perform calculations on satisfy the constraints imposed by experimental signals, they should be in principle physically realistic and free of the artifacts that may be present when the structures are solely determined by approximate models of protein structure. On the other hand, this method can overcome the potential biases caused by systematic and random errors in crystal structures. As Ryde et al. pointed out,41 the QM/MM refinement approach allows all the atoms in the system to relax as the structure of the active site is refined, subject to the constraint imposed by the diffraction data, which is important in preventing errors in the coordinates of the atoms outside the active site from propagating into the structure of the region in question.
Computational Procedures
All refinements were performed with the AMBER 846 and CNS47 software packages via an interface that coupled the two programs together. The SANDER module is the main energy minimization/molecular dynamics driver in the AMBER package. The component that handles the QM calculations in SANDER is our linear-scaling semiempirical electronic structure program DivCon.48-51 We modified the routines in SANDER that compute forces to make an additional call to the interface, where the atomic coordinates were output to a scratch file. CNS is then invoked via a system call to calculate the X-ray target function and its Cartesian-space gradient based on the coordinates in the scratch file. In practice, this was accomplished by modifying the CNS input script, minimize.inp, in the same manner as Ryde et al.41. Next the X-ray target function and the gradient deposited in the scratch files were read into SANDER and added to the physical energy and gradient according to Equation (1). SANDER X-ray structure refinement proceeds by minimizing the total target function using either the steepest descent or the conjugate gradient method.
The structure and X-ray data were taken from the crystal structure of OM99-2 bound β-secretase6 available in the protein data bank (PDB ID: 1FKN). All the atoms in the crystallographic model were retained in our simulations in order to ensure full reproduction of the observed electron density. Because of the intrinsic symmetry in the crystallographic model, only one of the two protein chains, one of the two inhibitor chains, and the waters were refined. Initially, when adding hydrogen atoms to the crystal structure with the LEaP program in AMBER46, we assumed that all the titratable groups adopted their most common protonation states at pH=7.0. The all-atom model constructed in this way contains 13915 atoms with a net charge of -24. This starting structure was subject to 1000-1500 steps of refinement using a MM potential and restraints derived from the X-ray data. In all the refinements discussed in this work, the atomic B factors were held fixed at their values in the crystal structure, and hydrogen atoms were neglected in the calculation of the structure factors. The reflection data file that we obtained from the PDB contains 69056 reflections between the resolution limits of 1.90 to 24.90 Å, in which 6748 reflections were marked with the free R flag. The experimental paper reports an R value of 0.180 and a Rfree value of 0.228, which were reproduced successfully with our version of CNS.
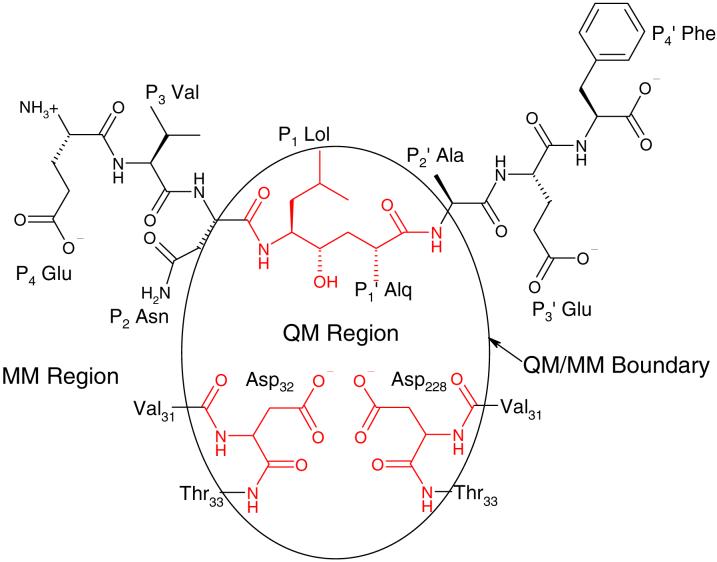
After preprocessing, the structure refined with wx-ray=0.4, which had an R value of 0.186 and a Rfree value of 0.222, was selected for further processing. The initial structures for the 8 protonation configurations as defined in Figure 3 were constructed in the same manner as in Rajamani et al. These 8 initial structures were refined with our QM/MM X-ray refinement method for another 700 to 1000 steps. Figure 4 shows the chemical structure of the inhibitor as well as the partitioning scheme in the QM/MM calculations. The QM region consists of the two key aspartates and the nonstandard residues Lol and Alq of the inhibitor, making the total number of QM atoms between 68 and 70. The decision to adopt such a partitioning scheme was not only motivated by computational efficiency but also by necessity to avoid computational artifacts as a result of our present inability to model bulk solvent in QM/MM calculations. In fact, we have found that minimization of a structure with charged surface groups in gas phase QM calculations can lead to spurious proton transfers and bond breaking.52 Since the boundary between the QM and MM regions bisects some chemical bonds, we introduced hydrogen link atoms to cap the open valences of the QM region. It should be noted that there are several versions of the link atom approach which differ in their handling of the QM/MM boundary by either making link atoms interact with MM atoms (the HQ scheme) or making them unaware of the MM atoms (the QQ scheme)53,54. Because the standard AMBER 8 release only supports the QQ scheme, it was modified to implement HQ as well. Through extensive computational experiments, we found that the HQ scheme yielded much better geometries at the linkage region for our system. Thus in all the calculations presented here, the HQ link atom scheme was employed to treat the QM/MM boundary.
Figure 4.
Chemical structure of OM99-2 and the partitioning of QM and MM regions. Atoms colored in red are in the QM region, whereas atoms colored in black are in the MM region.
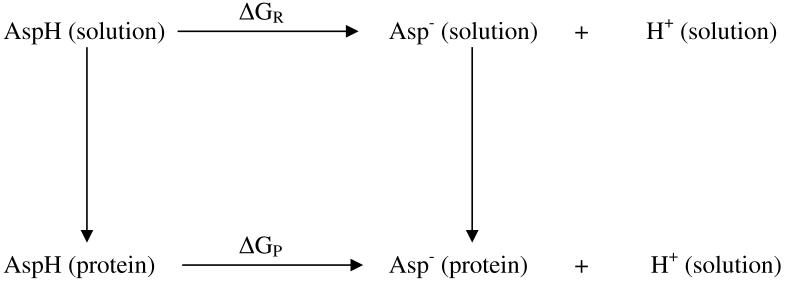
Upon completion of these refinements, the unrefined protein and inhibitor chains and the crystallographic water surrounding them were stripped off using the SORTWATER utility in the Collaborative Computational Project, Number 4 (CCP4) software suite.55 We then performed single-point divide-and-conquer (DivCon) self-consistent reaction field (SCRF) calculations on the remaining structures with 6926 - 6928 atoms, where the reaction field generated by the bulk solvent was accounted for by solving the Possion-Boltzmann (PB) equation using our own finite-difference PB solver56. Our analysis of the relative stability of the various protonation states was adapted from the theory initially pioneered by Warshel and co-workers42 and extended by Bashford and Karplus43 among others44,45. Figure 5 shows the thermodynamic cycle used to analyze the relative stability among the various protonation states, where capped aspartic acid in solution is used as the reference point. In this scheme, the free energy difference between the AspH and Asp- states of either aspartate in the protein environment is computed by the following expression:
| (2) |
where we approximate the differences in free energy between protonation states as differences in potential energy as in previous theoretical work43. Likewise, this approach is equivalent to the homodesmic reaction formalism employed by Rajamani et al.20, with the main difference being their use of propionic acid as the reference compound.
Figure 5.
Schematic representation of the thermodynamic cycle used to evaluate the relative stability between protonated and ionized Asp in the protein environment. The reference compound AspH(solution)/Asp-(solution) may be substituted with other ionizable groups.
All the calculations were performed on our local Linux PC clusters. Each preprocessing run took 3 to 5 hours, and the wall clock time for each QM/MM refinement was 7 to 9 hours. The DivCon QM/SCRF calculations were carried out with the default dielectric constants of 1 and 80 for the interior and exterior of the protein. The grid box used in our finite difference PB solver was set up in such a way that the solute spanned at most 60% of the box length in each dimension with a grid resolution of 3 points per Å. Since these calculations allow the solute to be polarized by the solvent through perturbations on the Hamiltonian, they are computationally much more demanding than classical Possion-Boltzmann solvers: on average, 17 hours were required to reach SCF convergence for each single-point DivCon QM/SCRF calculation.
Results
Preprocessing of the crystal structure
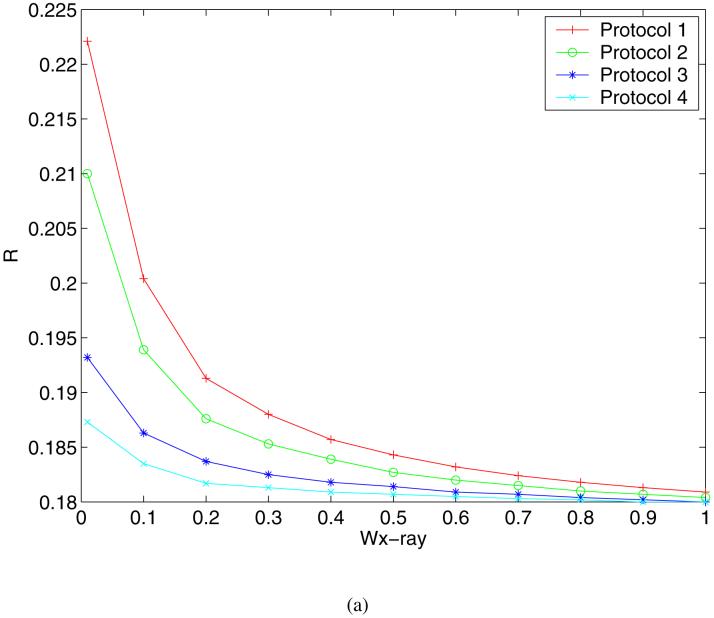
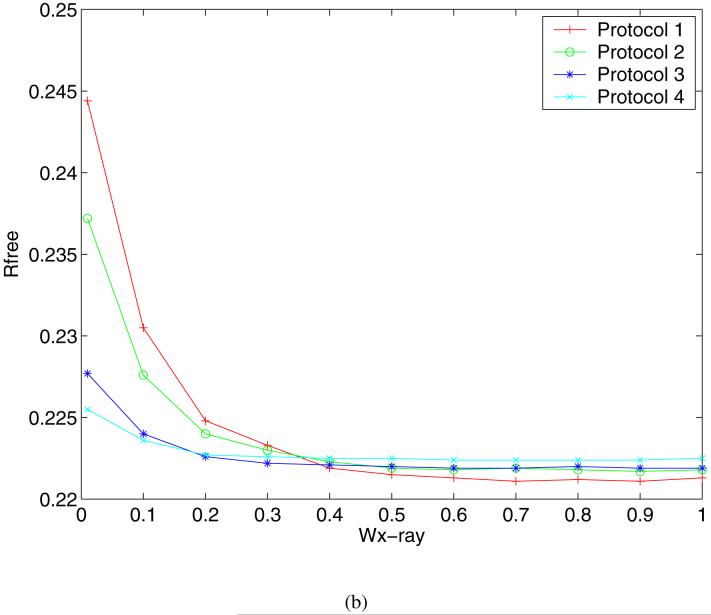
Since the crystal structure was solved with CNS using an incomplete energy function with parameters determined by Engh and Huber, it is expected that the stereochemical details of the structures refined with our method will change slightly. Thus, we minimized the initial structure with an MM energy function at several weights (denoted wx-ray in Equation (1)) ranging from 0.01 to 10. It should be noted that a more efficient method exists which obtains a quick estimate of the ideal weight by matching the average energy gradient with the average X-ray gradient in a short molecular dynamics (MD) simulation. Nevertheless this was not undertaken because we are employing an energy function that is different from the one typically used in Equation (1) and we wish to understand thoroughly how the weight influences the refinements. As a control, this step of preprocessing was carried out in 4 different protocols: in Protocol 1, the whole protein, the inhibitor and the solvent molecules were refined; in Protocol 2, only the protein and the inhibitor, but not the solvent, were refined; in Protocol 3 and 4, only the atoms that were within a distance of 20 and 15 Å respectively from the center of the active site were refined. In all these Protocols, the coordinates of the hydrogen atoms were allowed to relax.
The R values and Rfree values of the refined structures are plotted as functions of the weight in Figure 6. Clearly, as wx-ray decreases the R values of the structures refined using all 4 Protocols increase to between 0.187 and 0.223 as shown in Figure 6(a). In addition, the order of the final R values at the lowest weight suggests that freezing the coordinates of the atoms at a distance away from the active site helps maintain the compatibility of the structure with the observed X-ray signals. Fixing the coordinates of the solvent molecules had similar effects, which was evident from the results of Protocol 2. The explanation for this observation is that when the weight of the X-ray restraint is reduced, the parts of protein structures that are mostly affected are the regions with less well-resolved electron densities, e.g. surface residues and discrete solvent molecules. In these regions, minimizing the structure on a potential energy function containing electrostatic interactions without modeling the solvent can cause significant errors in the structure. In fact, a visual inspection of the refined structures resulting from Protocol 1 at the lowest X-ray weight showed that many water molecules were pulled out of their densities and drawn towards charged groups. In examining the plot of the Rfree values against the weight shown in Figure 6(b), more insight into the effects of the weight can be made. The corresponding Rfree values at lower weights show a similar trend, but in the intermediate range between 0.4 and 0.9 we observe that the order of agreement is almost reversed from that for the R values at the lowest weight. Here Protocol 1 gives the best Rfree values among the 4 Protocols. Since the Rfree value is an unbiased indicator of the agreement with experimental data, the implication is that the complete energy function improves the structure in the all-atom refinement protocol only at intermediate weights. What is particularly encouraging is that all of the Rfree values for the all-atom refinement protocol in this region are lower than the literature Rfree value of 0.224, suggesting the potential usefulness of our method in further enhancing the accuracy of X-ray structure refinements. The crossover of the curves between the weights of 0.1 and 0.4 defines these weights as the borderline between the regions where the refinement is dominated by different determinants. Figure 7 displays the preprocessed structures of a fragment consisting of residues Thr314 through Asp318 with the electron density map, where the structures refined with Protocol 1 at 3 different weights, 10 (cyan), 0.4 (green) and 0.01 (magenta), are shown. This example demonstrates how the structure in a relatively flexible loop region is influenced by the weight. The cyan structure stays closest to the crystal structure due to the heavy X-ray constraint, whereas the magenta structure shows significant deviations. The green structure is somewhere in the middle: in regions where the electron density is strong, for example Asp318, it stays close to the crystal structure; in regions where the electron density is weak, for example Thr314, it is more similar to the structure dominated by the energy function.
Figure 6.
R (a) and Rfree (b) values as functions of the weight of the X-ray target for 4 preprocessing protocols (see text for definitions).
Figure 7.
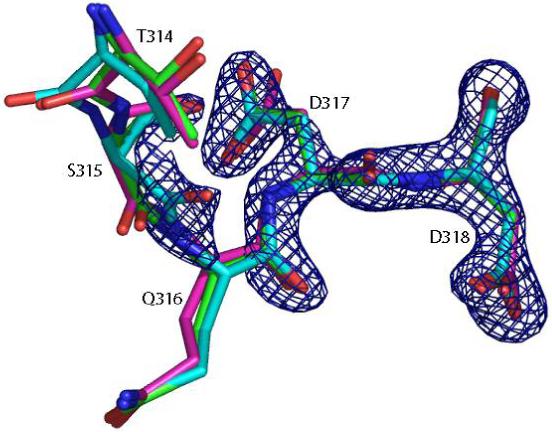
Snapshot of the loop containing residues from Thr314 to Asp318 after preprocessing with Protocol 1 at 3 weights, 10 (cyan), 0.4 (green) and 0.01 (magenta), together with the σA-weighted 2Fo-Fc electron density map contoured at 1.8σ level.
At this point, we selected the structure refined with Protocol 1 at the weight of 0.4 as the template to construct the various protonation states. It was expected that this structure had undergone substantial adjustments in response to the new energy function and yet still fit the experimental signals well. It is also worth noting that the artifacts caused by treating the system in the gas phase may be reduced if the energy function contains a description of solvent in an implicit manner using, for example, the Generalized Born (GB) model, as Moulinier et al. demonstrated in their recent work.57 Nonetheless, in our own refinement studies our observation was that introducing the GB/SA terms only resulted in significant differences at very low weights, providing a justification for the choice of the structure refined in the gas phase at wx-ray=0.4 for further processing.
Relative Stability
Using the thermodynamic cycle shown in Figure 5 we analyzed the relative stability of the 8 possible protonation states. First, we calculated the free energy change, ΔGR, for the reference reaction using QM/SCRF calculations on the AM1-minimized structures of the reference compounds. Initially we considered both capped aspartic acid and propionic acid. From the results shown in Table 1, it can be seen that the difference between the two reference reactions was very small and within the margin of error of the AM1 level of theory.
Table 1. Calculated gas phase QM energies Eqm, free energies of solvation ΔGsolv, and free energy changes for the reference reaction ΔGR for capped Asp and propionic acid.
| Reference Compound | Eqm (kcal/mol) | ΔGsolv (kcal/mol) | ΔGR (kcal/mol) |
|---|---|---|---|
| AspH | -163.4 | -20.9 | -84.8 |
| Asp- | -180.0 | -89.1 | |
| EtCOOH | -108.5 | -5.7 | -83.5 |
| EtCOO- | -122.0 | -75.7 | |
The differences in the free energy changes, G, were then calculated and are collected in Table 2. As discussed above, these quantities represent the differences in free energy changes of ionizing Asp32 or Asp228 in the protein environment relative to the reference reactions in solution. In Table 2, we compare the results for 3 different refinement protocols: in Protocol I, we refined only the atoms within 10 Å away from the center of the active site; in Protocol II, we refined the coordinates of all-atoms. In both Protocol I and II, the refinements were restrained by the X-ray data with a weight of 0.4, whereas in Protocol III all the atomic coordinates were minimized on the QM/MM potential without X-ray constraint. A glance at Table 2 shows that the quantum mechanical energies, Eqm, of the 8 protonation states separate into 3 groups: the mono-protonated states, the di-protonated states, and the di-deprotonated states. The average gap in Eqm between the mono-protonated states and the di-protonated states is about 60 to 70 kcal/mol; the same gap between the di-deprotonated states and the mono-protonated states is about 110 to 130 kcal/mol. These gaps indicate that the di-protonated states, with a net charge closest to neutral, are most stable in the gas phase. The gaps in Eqm are offset by the solvation free energy, ΔGsolv, which gives the most heavily charged di-deprotonated states the largest stabilization. Due to cancellations in Eqm and ΔGsolv, the resulting ΔΔG between the least stable t228 and the most stable configuration 32i is less than 43 kcal/mol. The differences in the results between Protocol I and II suggest that allowing the all-atom coordinates to be refined produces lower gas phase energies and larger gaps between the groups of states. The results from Protocol III show that in the absence of the X-ray constraint, the gas phase energies of the di-protonated and the di-deprotonated states, with the exception of 228i32o where the minimization was probably trapped in a local minimum, relax further by varying degrees. However, the lowering in the gas phase energies are more than offset by the unfavorable free energies of solvation. Overall, these states have higher solution phase energies but the gaps between them are reduced.
Table 2. Calculated gas phase QM energies Eqm, free energies of solvation ΔGsolv, and differences in free energy change ΔΔG for ionizing the Asp’s in the 8 protonation configurations using capped Asp as the reference compound. All the ΔΔG values are relative to the minimum among the 8 configurations. All the values are in the unit of kcal/mol.
| Protocol I | Protocol II | Protocol III | |||||||
|---|---|---|---|---|---|---|---|---|---|
| State | Eqm | ΔGsolv | ΔΔG | Eqm | ΔGsolv | ΔΔG | Eqm | ΔGsolv | ΔΔG |
| 32i | -34763.3 | -3593.4 | 0.0 | -34783.2 | -3587.5 | 0.0 | -34786.7 | -3237.3 | 6.2 |
| 228i | -34757.0 | -3597.3 | 2.4 | -34766.8 | -3595.5 | 8.3 | -34787.3 | -3242.9 | 0.0 |
| 32o | -34761.0 | -3592.8 | 2.9 | -34768.9 | -3594.3 | 7.4 | -34780.7 | -3240.0 | 9.5 |
| 228o | -34753.5 | -3597.4 | 5.8 | -34768.4 | -3589.1 | 13.1 | -34783.0 | -3243.2 | 4.0 |
| 228i32o | -34825.6 | -3440.2 | 6.1 | -34845.8 | -3426.9 | 13.1 | -34836.9 | -3094.7 | 13.8 |
| 228o32i | -34821.2 | -3439.8 | 10.9 | -34830.1 | -3435.0 | 20.7 | -34839.6 | -3101.7 | 4.2 |
| t32 | -34640.3 | -3766.7 | 34.5 | -34658.1 | -3756.7 | 40.6 | -34679.8 | -3402.3 | 32.8 |
| t228 | -34637.3 | -3766.5 | 37.7 | -34657.2 | -3755.7 | 42.6 | -34676.1 | -3401.6 | 37.3 |
Final Structures
Since protons are excluded from calculation of structure factors, the initial structures of the 8 protonation configurations have an identical R value of 0.186 and an identical Rfree value of 0.222. The QM/MM refinements yielded final structures with R and Rfree values very close to the starting ones, with variations in the R and Rfree values in the statistically insignificant 4th decimal place. Figure 8 shows a cross-eye stereo picture of the refined active site and the corresponding electron density map in the most favored 32i state, where the inner oxygen atom of Asp32 donates a hydrogen bond to the hydroxyl oxygen of the inhibitor. The good agreement between the observed and calculated structure factors, as the R and Rfree values suggest, is reflected by the excellent fit of the structure to the electron density map.
Figure 8.
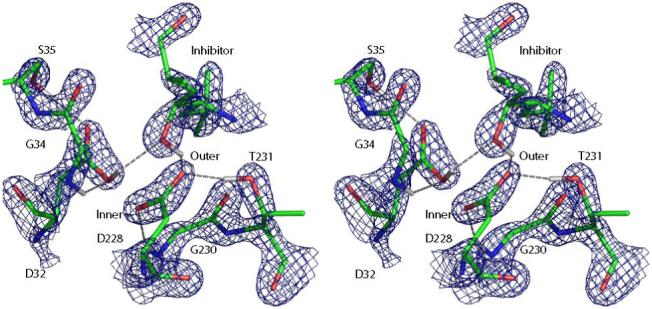
Cross-eye stereo view of the key residues of BACE at the end of the 32i refinement, together with the σA-weighted 2Fo-Fc electron density maps contoured at 2.7σ level.
It can also be seen that the structure of the active site is somewhat symmetric about the hydroxyl of the inhibitor as noted in previous studies10: both of the inner oxygen atoms of Asp32 and Asp228 are stabilized by main-chain N-H hydrogen bonds from Gly34 and Gly230, while the outer oxygen atoms accept hydrogen bonds from Ser35 and Thr231. The γ oxygen atoms of Ser35 and Thr231 both accept a hydrogen bond from water molecules Wat2 and Wat101 respectively. Given this symmetry, it is surprising to see a reversal of the order of ΔΔGs for the mono-protonated states in Table 2: when refined with Protocol II, the 32i and 32o states are more stable than their “images,” 228i and 228o, whereas when refined with Protocol III they are destabilized relative to their images by 14.5 and 11.2 kcal/mol respectively. In order to rationalize this result, we superimpose the 32i and 228i structures refined with Protocol II and III in Figure 9 together with the electron density map. Both structures minimized with the QM/MM energy function in the absence of the X-ray constraint show significant deviations from the electron density, especially for Wat2 and Wat101. Upon closer examination, it appears that Asp32 refined using Protocol III shifts to the same position relative to Protocol II in both the 32i and 228i states, while Asp228 does not. In fact, the Asp228 structure for Protocol III stays close to the one for Protocol II in the 32i state, whereas it moves away considerably when protonated. This observation is reinforced by the key hydrogen bond lengths shown in Table 3, where the distances are measured between the heavy atoms of donors and acceptors in order to facilitate comparison with the original 1FKN structure. It appears from Table 3 that the distance between the inner oxygen of Asp32 and main-chain nitrogen of Gly34 in the 228i state for Protocol III is much shorter than that in the 1FKN structure, while the distance between the inner oxygen of Asp228 and the main-chain nitrogen of Gly230 is much longer, and these deviations are larger than those found in the 32i state. Altogether, these results suggest that the 32i state is the most consistent with the X-ray diffraction data, while the structural and energy differences between Protocol II and III could be due to a number of factors including crystal packing forces, the errors introduced by the QM/MM method or the partitioning scheme, and the inherent errors in the semiempirical electronic structure method.
Figure 9.
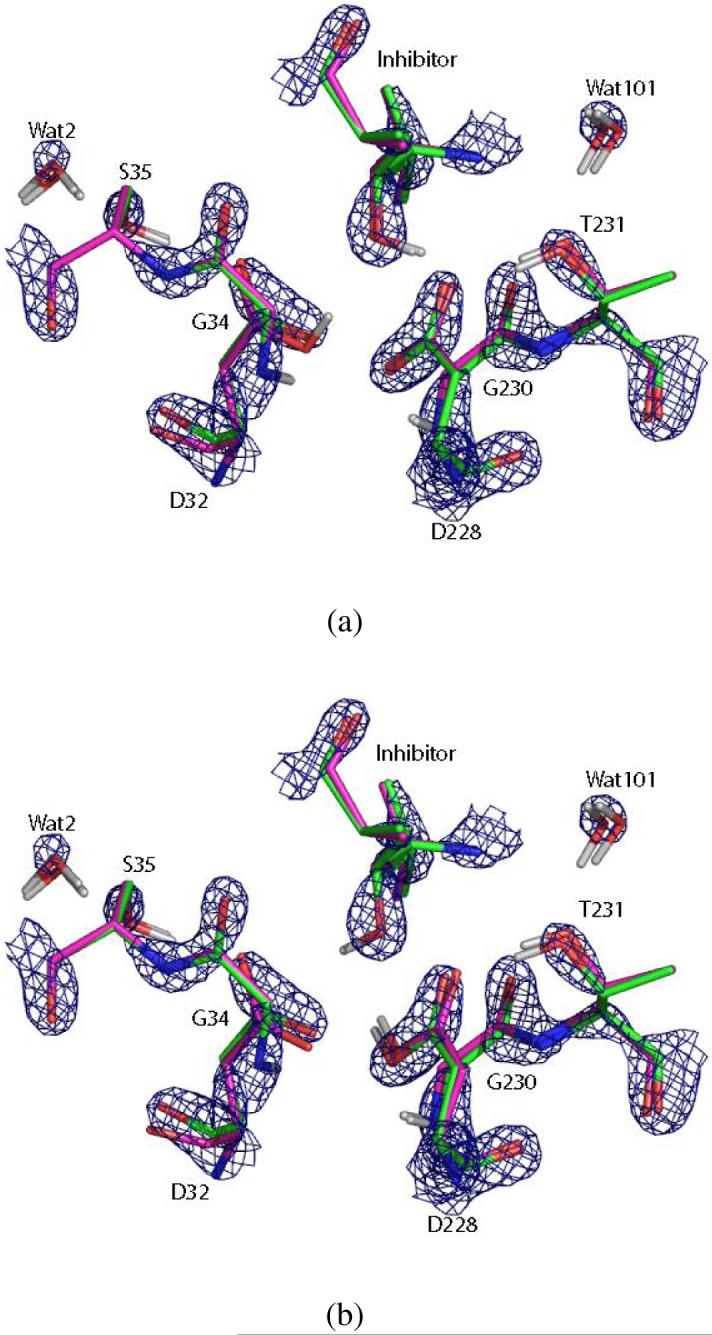
Key residues in the 32i (a) and 228i (b) states at the end of the refinements by Protocol II (green) and Protocol III (magenta), together with the σA-weighted 2Fo-Fc electron density map contoured at 3.5σ level. The waters that deviate more from the densities were refined with Protocol III.
Table 3. Key hydrogen bond lengths in the structures of the 32i and 228i states refined by Protocol II and Protocol III and in the 1FKN structure.
| Hydrogen Bond | Protocol II | Protocol III | 1FKN Structure | |||
|---|---|---|---|---|---|---|
| Acceptor | Donor | 32i | 228i | 32i | 228i | |
| Oouter(Asp32) | Oγ(Ser35) | 2.66 | 2.65 | 2.63 | 2.61 | 2.64 |
| Oouter(Asp32) | O(Inhibitor) | 3.12 | 3.17 | 3.00 | 3.06 | 3.26 |
| Oγ (Ser35) | O(Wat2) | 2.70 | 2.69 | 2.74 | 2.75 | 2.67 |
| Oinner(Asp32) | N(Gly34) | 3.39 | 3.35 | 3.02 | 2.82 | 3.56 |
| Oinner(Asp32) | O(Inhibitor) | 2.65 | 2.66 | 2.77 | 2.89 | 2.51 |
| Oouter(Asp228) | Oγ (Thr230) | 2.60 | 2.63 | 2.61 | 2.67 | 2.53 |
| Oouter(Asp228) | O(Inhibitor) | 2.64 | 2.58 | 2.84 | 2.97 | 2.54 |
| Oγ (Thr230) | O(Wat101) | 2.76 | 2.73 | 2.76 | 2.77 | 2.80 |
| Oinner(Asp228) | N(Gly230) | 2.81 | 2.87 | 2.84 | 2.99 | 2.66 |
| Oinner(Asp228) | O(Inhibitor) | 3.15 | 3.10 | 3.20 | 3.05 | 3.10 |
| Oinner(Asp228) | Oinner(Asp32) | 2.75 | 2.75 | 2.49 | 2.58 | 2.89 |
Discussion
Comparisons with Previous Theoretical Work
It is interesting to compare the results of this work to previous theoretical work. Here we will focus on the comparison between the relative energies for the 8 protonation configurations in this work and those calculated by Rajamani et al.20 The relative gas phase QM energies, solution phase QM energies, and differences in free energy changes computed by Rajamani et al. are reproduced in Table 4. Qualitatively both their study and this work find the mono-protonated states to be most stable, followed by the di-protonated states. Nevertheless, a few important differences can be observed: first, the ordering of relative solution phase energies within each group of states (i.e., monoprotonated, diprotonated, and di-deprotonated) is different especially among the mono-protonated configurations, for which Rajamani et al. consistently favor the states in which Asp228 is protonated; second, their most stable di-protonated state, 228i32o, is only 3.5 kcal/mol in energy above their most stable mono-protonated state, 32i. Noting the similarity between the ΔΔGs for Protocol III in Table 2 and those in column 3 of Table 4, the second observation may be explained by the fact that Rajamani et al. did not restrain the structure with X-ray data and thus the structures of the di-protonated and di-deprotonated states relaxed, resulting in the observed smaller energy gaps. However, the first observation is more subtle and warrants further discussion.
Table 4. Calculated relative gas phase QM energies Eqm, solution phase QM energies, and differences in free energy changes ΔΔG for ionizing the Asp’s in the 8 protonation configurations using propionic acid as the reference compound reproduced from Rajamani et al20.
| State | Eqm | Eaq | ΔΔG |
|---|---|---|---|
| 32i | 23.4 | 30.5 | 30.5 |
| 228i | 0 | 0 | 0 |
| 32o | 31.7 | 40.7 | 40.7 |
| 228o | 16.7 | 13.9 | 13.9 |
| 228i32o | 0 | 0 | 3.5 |
| 228o32i | 18.5 | 16.9 | 20.4 |
| t32 | 7.5 | 0.5 | 31.2 |
| t228 | 0 | 0 | 30.7 |
In Rajamani et al. the relative stability of the 8 protonation states were evaluated at the same level of theory as this work, and thus the energy function is unlikely to be responsible for this discrepancy. Nonetheless, in order to make full QM structure optimization of a very large system feasible in Rajamani et al., the crystal structure had to be truncated. Specifically, the crystallographic waters were selectively retained and the atoms outside a 15 Å cutoff of any atom of the ligand were removed, resulting in a simplified system of about 1477 atoms including 4 waters20. The extensive truncation of the system could have introduced some asymmetry in the protein structure even though the net charge is close to 0, which would artificially favor one arrangement over the other. In addition, the omission of some of the water molecules that are part of the active-site electrostatic network10 is another major source of difference. Figure 10 shows the active site structure of the 32i configuration computed by Rajamani et al. Comparing Figure 10 to Figure 8 and Figure 9, it appears that the structure of the simplified model fits the density fairly well, if not as well as our refined structure. In spite of this, in the binding pocket there are electron densities for a few discrete water molcules, which are in the crystal structure Wat2 and Wat42 on the side of Asp32 and Wat61, Wat101, Wat162, Wat204 on the side of Asp228. Most of these waters are absent in Rajamani et al. except for Wat2. It is likely that the omission of these solvent molecules might have tilted the balance between the symmetric configurations because Asp32 accepts a hydrogen bond from Ser35 which in turn accepts a hydrogen bond from Wat2, while on the other side of the active site Wat101, which hydrogen bonds with Thr231, is missing. We suggest that these structural differences provide an explanation to the observed discrepancy, although it is still unclear how much of the gap they would account for. Comparing the 1FKN structure to other crystal structures of BACE such as 1M4H7 and 1SGZ8, it appears Wat2 is a conserved site whereas Wat101 is not. However, since our results are based on structures that are compatible with experimental data, they are thought to be on a firmer ground than those by Rajamani et al.
Figure 10.
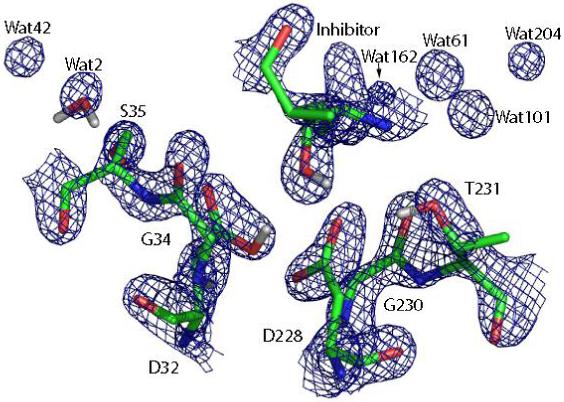
Key residues in the 32i state in the simplified model constructed by Rajamani et al.20, together with the σA-weighted 2Fo-Fc electron density map contoured at 2.7σ level.
Relevance to Structure-Based Design of BACE Inhibitors
The availability of the apo and ligand bound BACE crystal structures 6,7,9 has provided the basis for structure-based drug design efforts worldwide.58-60 Recently, Polgar and Keseru carried out virtual screening of BACE inhibitors and scored their binding affinities.21 Their study explored the effects of two factors on the results of docking: 1) by imposing pharmacophore constraints on the docked poses and 2) by taking into account the protonation states of the key aspartates in the docking procedures. The pharmacophore constraints applied by Polgar and Keseru were derived by Miyamoto et al.61 Two possibilities for the protonation state were considered: the default configuration where both aspartates were ionized and a hypothesized one where Asp32 was protonated and Asp228 ionized. This hypothesis was based on the results of pKa calculations on the 1FKN structure21. In these calculations all the solvent molecules were removed, and yet the most likely protonation configuration found by Polgar et al. is the same as the one favored by us. Polgar et al. showed that when the hypothesized protonation state was used in the docking experiments, the improvement in the enrichment factor over the results of the default protonation state was very similar to when the pharmacophore constraints were applied. Based on this observation, Polgar et al. proposed that the pharmacophore constraints implicitly encoded information about the protonation state of the receptor. The significance of our results is thus two-fold: 1) they suggest the mono-protonated 32i configuration as the appropriate protonation state in docking calculations and de novo inhibitor design; 2) our calculations imply that if the incorrect protonation state were used, the error in the predicted binding affinity would be substantial.
Relevance to the Reaction Mechanism
The relevance of these results to the understanding of the catalytic mechanism of BACE needs to be assessed with the consideration of the extent to which the crystal structure of the protein-ligand complex resembles the transition-state structure in the reaction. It may be argued that since the hydroethylene inhibitor in the current study does not completely mimic the tetrahedral intermediate in the proposed mechanism, the protonation state of the aspartates may not be the same as that in the reaction. Nevertheless, it is our expectation that if crystal structures of BACE bound to inhibitors containing diol fragments or those of isolated reaction intermediates become available, structure refinements and energetics analysis using our method will be able to provide further insights.
Conclusions
We have presented a novel method, QM/MM X-ray structure refinement, and have applied it to refine atomic-level structures of OM99-2 bound β-secretase including the coordinates for protons. In essence, this method amounts to applying more accurate energy restraints to key regions while retaining the computational efficiency of conventional refinements. The QM treatment is expected to be more accurate than MM for the active site region because it allows an accurate account of various interactions in a very unusual environment. The divide-and-conquer SCRF calculations provide a means to perform accurate energy evaluations of the structures consisting of BACE, its inhibitor and ordered water molecules with a continuum representation of the bulk solvent environment. The results of these calculations suggest that the mono-protonated 32i configuration should be favored under the conditions in which the crystallographic experiment was conducted. Indeed, a comprehensive study of all the crystal structures of BACE along the lines of this work would be an interesting future direction and will prove beneficial to a complete understanding of the mechanistic details of the catalytic reaction and to provide better guidance to the structure-based design of BACE inhibitors.
It should be emphasized that QM/MM X-ray refinement is not expected to lower crystallographic R values appreciably, since minute changes in local structures do not affect on a larger scale the fit of structures to observed electron densities. Instead, it is an analysis tool that is useful for generating realistic all-atom models from crystal structures.
The advent of ultrahigh resolution protein X-ray structures has created a unique challenge as well as opportunity for this method.62,63 The observation-to-parameter ratios at these resolutions come close to the typical values for small molecule crystals, and the errors in atomic coordinates are also significantly suppressed. Ultrahigh resolution X-ray crystallography will serve as a tool with tremendous power in defining protonation states and calibrating the QM/MM X-ray refinement method. That said, QM calculations will still be valuable to atomic-resolution protein crystallography, as even at resolutions higher than 0.85 Å the scattering from hydrogen atoms is still too weak to allow complete determination of the coordinates of all the protons. In a recent paper, Schiffer et al. reviewed the newest advances in simulation techniques that would impact the field of protein crystallography, and the utilization of QM methods was recognized as one of the 3 major forefronts64. Future development of QM-based refinement methodologies that allow first-principles calculations to complement experiments, while challenging, will likely be very rewarding.
Acknowledgment
N. Yu thanks Dr. Martha S. Head at GlaxoSmithKline for critical reading of the manuscript and for helpful suggestions. This research was generously supported by the NSF (MCB-0211639) and the NIH (GM44974).
References
- (1).Selkoe DJ. Physiology Reviews. 2001;81:741. doi: 10.1152/physrev.2001.81.2.741. [DOI] [PubMed] [Google Scholar]
- (2).Wolfe MS, Xia WM, Ostaszewski BL, Diehl TS, Kimberly WT, Selkoe DJ. Nature. 1999;398:513. doi: 10.1038/19077. [DOI] [PubMed] [Google Scholar]
- (3).Lin XL, Koelsch C, Wu SL, Downs D, Dashti A, Tang J. P Natl Acad Sci USA. 2000;97:1456. doi: 10.1073/pnas.97.4.1456. [DOI] [PMC free article] [PubMed] [Google Scholar]
- (4).Yan RQ, Bienkowski MJ, Shuck ME, Miao HY, Tory MC, Pauley AM, Brashler JR, Stratman NC, Mathews WR, Buhl AE, Carter DB, Tomasselli AG, Parodi LA, Heinrikson RL, Gurney ME. Nature. 1999;402:533. doi: 10.1038/990107. [DOI] [PubMed] [Google Scholar]
- (5).Vassar R, Bennett BD, Babu-Khan S, Kahn S, Mendiaz EA, Denis P, Teplow DB, Ross S, Amarante P, Loeloff R, Luo Y, Fisher S, Fuller L, Edenson S, Lile J, Jarosinski MA, Biere AL, Curran E, Burgess T, Louis JC, Collins F, Treanor J, Rogers G, Citron M. Science. 1999;286:735. doi: 10.1126/science.286.5440.735. [DOI] [PubMed] [Google Scholar]
- (6).Hong L, Koelsch G, Lin XL, Wu SL, Terzyan S, Ghosh AK, Zhang XC, Tang J. Science. 2000;290:150. doi: 10.1126/science.290.5489.150. [DOI] [PubMed] [Google Scholar]
- (7).Hong L, Turner RT, Koelsch G, Shin DG, Ghosh AK, Tang J. Biochemistry-Us. 2002;41:10963. doi: 10.1021/bi026232n. [DOI] [PubMed] [Google Scholar]
- (8).Hong L, Tang J. Biochemistry-Us. 2004;43:4689. doi: 10.1021/bi0498252. [DOI] [PubMed] [Google Scholar]
- (9).Patel S, Vuillard L, Cleasby A, Murray CW, Yon J. Journal of Molecular Biology. 2004;343:407. doi: 10.1016/j.jmb.2004.08.018. [DOI] [PubMed] [Google Scholar]
- (10).Andreeva NS, Rumsh LD. Protein Science. 2001;10:2439. doi: 10.1110/ps.25801. [DOI] [PMC free article] [PubMed] [Google Scholar]
- (11).Dunn BM. Chemical Reviews. 2002;102:4431. doi: 10.1021/cr010167q. [DOI] [PubMed] [Google Scholar]
- (12).Suguna K, Padlan EA, Smith KW, Carlson WD, Davies DR. P Natl Acad Sci USA. 1987;84:7009. doi: 10.1073/pnas.84.20.7009. [DOI] [PMC free article] [PubMed] [Google Scholar]
- (13).Davies DR. Annual Review of Biophysical Chemistry. 1990;19:189. doi: 10.1146/annurev.bb.19.060190.001201. [DOI] [PubMed] [Google Scholar]
- (14).James MNG, Sielecki AR, Hayakawa K, Gelb MH. Biochemistry-Us. 1992;31:3872. doi: 10.1021/bi00130a019. [DOI] [PubMed] [Google Scholar]
- (15).Parris KD, Hoover DJ, Damon DB, Davies DR. Biochemistry-Us. 1992;31:8125. doi: 10.1021/bi00150a004. [DOI] [PubMed] [Google Scholar]
- (16).Veerapandian B, Cooper JB, Sali A, Blundell TL, Rosati RL, Dominy BW, Damon DB, Hoover DJ. Protein Science. 1992;1:322. doi: 10.1002/pro.5560010303. [DOI] [PMC free article] [PubMed] [Google Scholar]
- (17).Coates L, Erskine PT, Wood SP, Myles DAA, Cooper JB. Biochemistry-Us. 2001;40:13149. doi: 10.1021/bi010626h. [DOI] [PubMed] [Google Scholar]
- (18).Toulokhonova L, Metzler WJ, Witmer MR, Copeland RA, Marcinkeviciene J. Journal of Biological Chemistry. 2003;278:4582. doi: 10.1074/jbc.M210471200. [DOI] [PubMed] [Google Scholar]
- (19).Park H, Lee S. Journal of the American Chemical Society. 2003;125:16416. doi: 10.1021/ja0304493. [DOI] [PubMed] [Google Scholar]
- (20).Rajamani R, Reynolds CH. J Med Chem. 2004;47:5159. doi: 10.1021/jm049817j. [DOI] [PubMed] [Google Scholar]
- (21).Polgar T, Keseru GM. J Med Chem. 2005;48:3749. doi: 10.1021/jm049133b. [DOI] [PubMed] [Google Scholar]
- (22).Yamazaki T, Nicholson L, Torchia D, Wingfield P, Stahl S, Kaufman J, Eyermann C, Hodge C, Lam P, Ru Y, Jadhav P, Chang C, Weber P. Journal of the American Chemical Society. 1994;116:10791. [Google Scholar]
- (23).Hyland L, Tomaszek T, Roberts G, Carr S, Magaard V, Bryan H, Fakhoury S, Moore M, Mimmich M, Culp J, Desjarlais R, Meek T. Biochemistry-Us. 1991;30:8441. doi: 10.1021/bi00098a023. [DOI] [PubMed] [Google Scholar]
- (24).Hyland L, Tomaszek T, Meek T. Biochemistry-Us. 1991;30:8454. doi: 10.1021/bi00098a024. [DOI] [PubMed] [Google Scholar]
- (25).Piana S, Carloni P. Proteins: Structure, Function and Genetics. 2000;39:26. doi: 10.1002/(sici)1097-0134(20000401)39:1<26::aid-prot3>3.0.co;2-n. [DOI] [PubMed] [Google Scholar]
- (26).Piana S, Sebastiani D, Carloni P, Parrinello M. Journal of the American Chemical Society. 2001;123:8730. doi: 10.1021/ja003145e. [DOI] [PubMed] [Google Scholar]
- (27).Piana S, Bucher D, Carloni P, Rothlisberger U. Journal of Physical Chemistry B. 2004;108:11139. [Google Scholar]
- (28).Jack A, Levitt M. Acta Crystallogr A. 1978;34:931. [Google Scholar]
- (29).Hendrickson WA. Methods in Enzymology. 1985;115:252. doi: 10.1016/0076-6879(85)15021-4. [DOI] [PubMed] [Google Scholar]
- (30).Tronrud DE, Teneyck LF, Matthews BW. Acta Crystallogr A. 1987;43:489. [Google Scholar]
- (31).Brunger AT, Adams PD. Accounts Chem Res. 2002;35:404. doi: 10.1021/ar010034r. [DOI] [PubMed] [Google Scholar]
- (32).Brunger AT, Krukowski A, Erickson JW. Acta Crystallogr A. 1990;46:585. doi: 10.1107/s0108767390002355. [DOI] [PubMed] [Google Scholar]
- (33).Engh RA, Huber R. Acta Crystallogr A. 1991;47:392. [Google Scholar]
- (34).Yu N, Yennawar HP, Merz KM. Acta Crystallogr D. 2005;61:322. doi: 10.1107/S0907444904033669. [DOI] [PubMed] [Google Scholar]
- (35).Nilsson K, Hersleth HP, Rod TH, Andersson KK, Ryde U. Biophys J. 2004;87:3437. doi: 10.1529/biophysj.104.041590. [DOI] [PMC free article] [PubMed] [Google Scholar]
- (36).Nilsson K, Lecerof D, Sigfridsson E, Ryde U. Acta Crystallogr D. 2003;59:274. doi: 10.1107/s0907444902021431. [DOI] [PubMed] [Google Scholar]
- (37).Nilsson K, Ryde U. J Inorg Biochem. 2004;98:1539. doi: 10.1016/j.jinorgbio.2004.06.006. [DOI] [PubMed] [Google Scholar]
- (38).Ryde U, Nilsson K. J Am Chem Soc. 2003;125:14232. doi: 10.1021/ja0365328. [DOI] [PubMed] [Google Scholar]
- (39).Ryde U, Nilsson K. J Inorg Biochem. 2003;96:39. doi: 10.1016/j.jinorgbio.2004.06.006. [DOI] [PubMed] [Google Scholar]
- (40).Ryde U, Nilsson K. J Mol Struc-Theochem. 2003;632:259. [Google Scholar]
- (41).Ryde U, Olsen L, Nilsson K. J Comput Chem. 2002;23:1058. doi: 10.1002/jcc.10093. [DOI] [PubMed] [Google Scholar]
- (42).Warshel A, Sussman F. Proceedings of the National Academy of Sciences of the United States of America. 1986;83:3806. doi: 10.1073/pnas.83.11.3806. [DOI] [PMC free article] [PubMed] [Google Scholar]
- (43).Bashford D, Karplus M. Biochemistry. 1990;29:10219. doi: 10.1021/bi00496a010. [DOI] [PubMed] [Google Scholar]
- (44).Warwicker J. Protein Science. 1999;8:418. doi: 10.1110/ps.8.2.418. [DOI] [PMC free article] [PubMed] [Google Scholar]
- (45).Antosiewicz J, Miller MD, Krause KL, McCammon JA. Biopolymers. 1997;41:443. doi: 10.1002/(SICI)1097-0282(19970405)41:4<443::AID-BIP8>3.0.CO;2-M. [DOI] [PubMed] [Google Scholar]
- (46).Case DA, Darden TA, T.E. Cheatham I, Simmerling CL, Wang J, Duke RE, Luo R, Merz KM, Wang B, Pearlman DA, Crowley M, Brozell S, Tsui V, Gohlke H, Mongan J, Hornak V, Cui G, Beroza P, Schafmeister C, Caldwell JW, Ross WS, Kollman PA. AMBER. 8 ed. University of California; San Francisco: 2004. [Google Scholar]
- (47).Brunger AT, Adams PD, Clore GM, DeLano WL, Gros P, Grosse-Kunstleve RW, Jiang JS, Kuszewski J, Nilges M, Pannu NS, Read RJ, Rice LM, Simonson T, Warren GL. Acta Crystallogr D. 1998;54:905. doi: 10.1107/s0907444998003254. [DOI] [PubMed] [Google Scholar]
- (48).Lee T, York D, Yang W. J Chem Phys. 1996;105:2744. [Google Scholar]
- (49).Dixon SL, Merz KM. J Chem Phys. 1996;104:6643. [Google Scholar]
- (50).Dixon SL, Merz KM. J Chem Phys. 1997;107:879. [Google Scholar]
- (51).van der Vaart A, Suarez D, Merz KM. J Chem Phys. 2000;113:10512. [Google Scholar]
- (52).Wallocot AW, Merz KM. in preparation [Google Scholar]
- (53).Eurenius K, Chatfield D, Brooks B, Hodoscek M. International Journal of Quantum Chemistry. 1996;60:1189. [Google Scholar]
- (54).Reuter N, Dejaegere A, Maigret B, Karplus M. Journal of Physical Chemistry A. 2000;104:1720. [Google Scholar]
- (55).Collaborative Computational Project, Number 4 Acta Cryst. 1994;D50:760. [Google Scholar]
- (56).Gogonea V, Merz KM. Journal of Physical Chemistry. 1999;103:5171. [Google Scholar]
- (57).Moulinier L, Case DA, Simonson T. Acta Crystallogr D. 2003;59:2094. doi: 10.1107/s090744490301833x. [DOI] [PubMed] [Google Scholar]
- (58).Tounge B, Reynolds C. J Med Chem. 2003;46:2074. doi: 10.1021/jm020513b. [DOI] [PubMed] [Google Scholar]
- (59).Rajamani R, Reynolds C. Bioorg Med Chem Lett. 2004;14:4843. doi: 10.1016/j.bmcl.2004.07.044. [DOI] [PubMed] [Google Scholar]
- (60).Coburn C, Stachel S, Li Y, Rush D, Steele T, Chen-Dodson E, Holloway M, Xu M, Huang Q, Lai M, DiMuzio J, Crouthamel M, Shi X, Sardana V, Chen Z, Munshi S, Kuo L, Makara G, Annis D, Tadikonda P, Nash H, Vacca J, Wang T. J Med Chem. 2004;47:6117. doi: 10.1021/jm049388p. [DOI] [PubMed] [Google Scholar]
- (61).Miyamoto M, Matsui J, Fukumoto H, Tarui N. 01/187293. Patent WO. 2001
- (62).Jelsch C, Teeter MM, Lamzin V, Pichon-Pesme V, Blessing RH, Lecomte C. P Natl Acad Sci USA. 2000;97:3171. doi: 10.1073/pnas.97.7.3171. [DOI] [PMC free article] [PubMed] [Google Scholar]
- (63).Ko T-P, Robinson H, Gao Y-G, Cheng C-HC, Devries AL, Wang AH-J. Biophys J. 2003;84:1228. doi: 10.1016/S0006-3495(03)74938-8. [DOI] [PMC free article] [PubMed] [Google Scholar]
- (64).Schiffer C, Hermans J. Methods in Enzymology. 2003;374:412. doi: 10.1016/S0076-6879(03)74019-1. [DOI] [PubMed] [Google Scholar]


