Abstract
The isolation of single units in extracellular recordings involves filtering. Removing lower frequencies allows a constant threshold to be applied in order to identify and extract action potential events. However, standard methods such as Butterworth bandpass filtering perform this frequency excision at a cost of grossly distorting waveform shapes. Here we apply wavelet decomposition and reconstruction as a filter for electrophysiology data and demonstrate its ability to better preserve spike shape. For the majority of cells, this approach also improves spike signal-to-noise ratio (SNR) and increases cluster discrimination. Additionally, the described technique is fast enough to be applied real-time.
Keywords: Wavelets, Filtering, Spike Detection, Spike Sorting, Clustering, Extracellular Recording
Introduction
The removal of unwanted frequencies and artifacts is essential in the analysis of electrophysiological data, especially where the data of interest are the time stamps of neuron action potentials, also called “spikes.” In addition to high amplitude spikes, typical electrode signals include local field potentials (LFPs), instrument noise, and spikes from neurons too distant from the recording site to be effectively discriminated. An ideal filtering technique would preserve only discriminable spikes without distorting their waveforms, since differences in waveform shape are useful in clustering and also provide an important source of information about neuronal phenotypes (e.g. Csicsvari et al., 1998; Barthó et al., 2004; Berke et al., 2004). Filters commonly used in electrophysiology, such as the Butterworth filter, can be fast to compute and possess a maximally flat frequency response (Butterworth, 1930). However, they possess the undesirable side-effect of distorting the time-domain, e.g. the shape of action potentials.
After the data are filtered, they are usually thresholded to locate spike events, and then certain features of the extracted spikes are used in a manual or semi-automated clustering procedure (Lewicki, 1998). The features to be used in clustering can include spike amplitude, valley width, principal components or wavelet decomposition coefficients. Wavelets have recently gained notice as a powerful tool for signal analysis in the neurosciences and have been applied in a myriad of ways, including spike detection (Hulata et al., 2002; Nenadic and Burdick, 2005), cell classification (Cesar and Costa, 1998; Letelier and Weber, 2000; Quiroga et al., 2004) and EEG/LFP analysis (Clarençon et al., 1996; Adeli et al., 2003; Markazi et al., 2006; Berke et al., 2008). Here, we apply wavelet filtering to “raw” (wide-band) electrode signals as a preprocessing stage before spike detection and sorting. This approach accurately maintains waveform shape while removing low frequency field potentials and noise artifacts. We demonstrate benefits for the later stages of spike discrimination, compared to the standard Butterworth bandpass filter.
Methods
Algorithms were implemented in the Python language (van Rossum, 1995) using the modules NumPy (Oliphant, 2006), SciPy (for Butterworth filter, as implemented by Jones et al., 2001), Modular toolkit for Data Processing (for principal components analysis (PCA), as implemented by Berkes and Zito, 2007), and PyWavelets (for wavelet transforms, as implemented by Wasilewski, 2006). Algorithms were duplicated when necessary in Matlab for speed comparisions, using the Wavelet and Signal Processing toolboxes (Misiti et al., 2000). All computations were performed on an AMD Athlon 2.2 GHz Windows XP machine with 4 GB of RAM. Electrophysiological data were obtained from tetrodes implanted in two awake freely-moving animals (one rat, one mouse). For the rat, 46 cells across 5 tetrodes from two separate recording sessions were isolated in the striatum, including 30 presumed medium-spiny projection cells (Berke et al., 2004). For the mouse, 20 cells were isolated from 2 tetrodes in a single session from dorsal hippocampus area CA1, including 17 presumed pyramidal cells. In both cases signals were recorded continuously at 31250Hz/channel with hardware filtering with a passband of 1Hz to 9000Hz. Spikes (shown with negative voltage up) were sorted manually using Offline Sorter (Plexon Inc). For comparison of filter performance we used a 4th order Butterworth bandpass filter, with a passband from 300 Hz to 6000 Hz, typical settings for neurophysiology filters. For analyses and visualization, spikes were interpolated by a factor of four then realigned at their peaks. They were then downsampled to their original sampling frequency of 31250Hz.
The Wavelet Filter
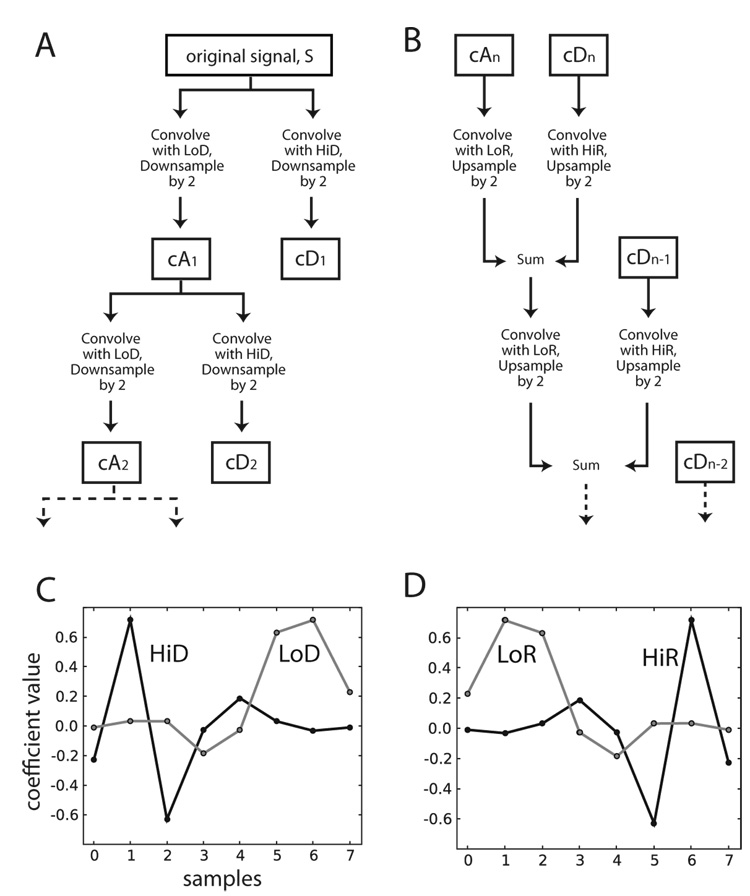
We used wavelet multi-level decomposition and reconstruction (WMLDR) as the core of our filter. There are many different names for this procedure, including fast wavelet transform, fast orthogonal wavelet transform, multiresolution algorithm, and pyramid algorithm (Addison, 2002). The algorithm is represented visually in Figure 1 (for further information, see Daubechies, 1992 or Addison, 2002). First, the signal is decomposed into frequency sub-bands (Fig. 1A; Hu et al. 2006) by separate iterative convolution with high-and low-pass wavelet decomposition filters (Fig. 1C). For our application, we used pre-computed values of the Daubechies 4 wavelet (Daubechies, 1988), as provided by the Matlab wavelet toolbox and the Py Wavelets Python module. The coefficients containing the higher frequencies of the signal are saved at each iteration i as detail coefficients, labeled as cDi. The coefficients containing the lowest frequencies, the approximation coefficients, are labeled cAn. Table 1 shows the frequency content of each coefficient set at levels 1–6. The signal is subsequently reconstructed by iteratively convolving the approximation coefficients with the low-pass reconstruction filter, convolving the detail coefficients with the high-pass reconstruction filter and summing the results (Fig. 1B). The reconstruction filters are the time-inverses of the decomposition filters (Fig. 1D), and therefore provide a zero-phase-lag reconstruction (for discussion of this point, see Hu et al., 2006). In this application, we removed all information about the lowest frequencies in the signal by setting all values in cAn to zeros. This has the effect of a high-pass filter after reconstructing the signal. This dampening or zeroing of approximation coefficients is sometimes referred to as “wavelet de-noising” in the signal processing literature.
Figure 1.
Schematic description of the wavelet-filtering algorithm. cAi denotes approximation coefficients at level i, cDi denotes detail coefficients at level i. A. Block-diagram representation of the decomposition stage of the wavelet filtering algorithm (see Methods). B. Representation of the reconstruction phase. C. The decomposition wavelet filters. The high-pass filter is in black labeled as HiD, the low-pass filter is in grey labeled as LoD, and each has 8 coefficients. The y-axis represents coefficient values. D. The reconstruction wavelet filters. The high-pass filter is in black labeled as HiR, and the low-pass filter is in grey labeled as LoR.
Table 1.
Frequency content of detail and approximation coefficients at wavelet decomposition levels 1–6, for a signal sampled at 31250Hz.
| Coefficients | Frequency content |
|---|---|
| cD1 | 7812 – 15625 Hz |
| cD2 | 3906 – 7812 Hz |
| cD3 | 1953 – 3906 Hz |
| cD4 | 976 – 1953 Hz |
| cD5 | 488 – 976 Hz |
| cD6 | 244 – 488 Hz |
| cA6 | 0 – 244 Hz |
One cannot directly specify the cutoff frequency for the wavelet filter. Instead, one chooses a level of decomposition n which implicitly defines a high-pass bound. The approximation coefficients always contain the lowest frequencies in the signal, up to some frequency fc. The cutoff frequency of the wavelet filter is then fc, since it is the highest frequency not to be contained in the final reconstructed signal. The cutoff frequency is found to be
where n is the level of decomposition and the Nyquist frequency is equal to half the data sampling rate. Although we did not do this, in practice one could resample the signal before WMLDR to yield a specified cutoff frequency.
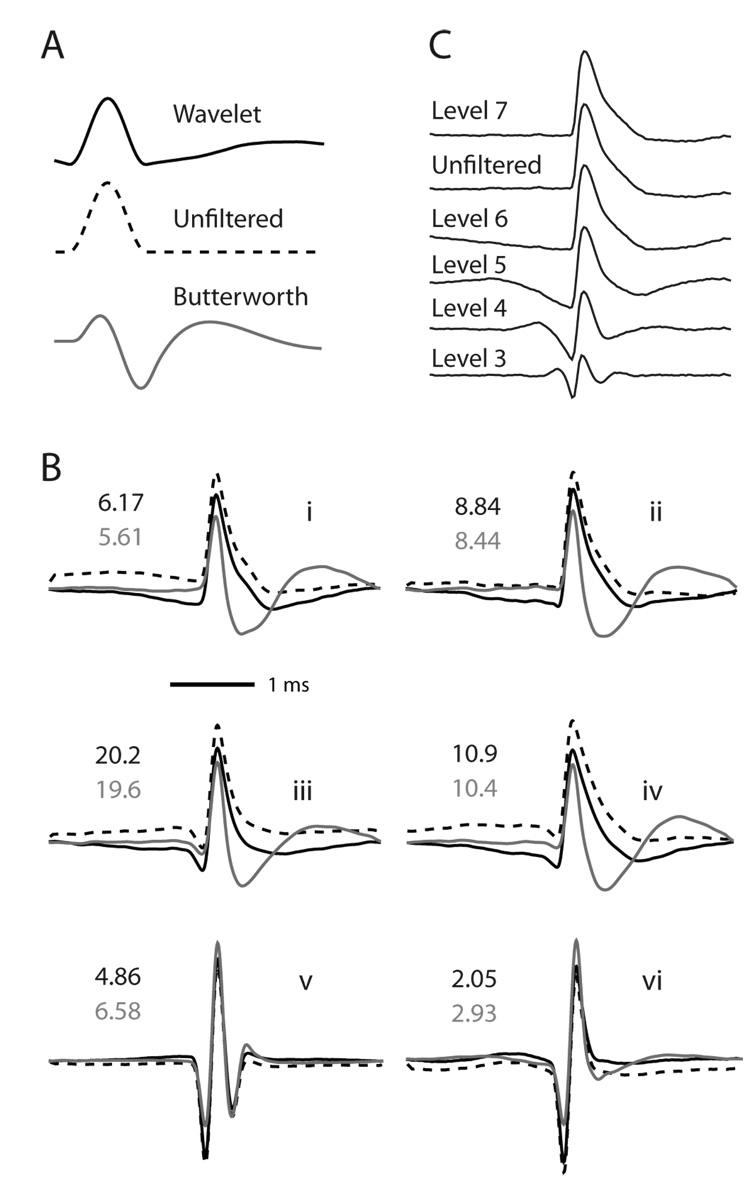
Using the Daubechies 4 wavelet, we performed an n = 6 level decomposition, which passes frequencies above 244 Hz given a sampling rate of 31250 Hz. We chose this level after comparison of the signal-to-noise ratio (SNR) of spikes and reconstruction quality across various levels (Fig. 3B). Although an n = 7 level decomposition provides better clustering quality and less waveform distortion, using an n = 6 wavelet filter grants a much higher SNR with small losses in clustering ability (Fig. 4). We chose to compare our wavelet filter to a 4-pole Butterworth filter with a passband of 300–6000 Hz, since this is one of the most common settings of hardware filters, and one of the highest performing, with respect to waveform distortion, SNR, and clustering quality (Fig. 4). Using 244 Hz as the Butterworth high-pass cutoff marginally decreases signal distortion by minimally smearing the artificial “hump” across time (Fig. 3A, B), but at the cost of further decreasing the SNR (not shown). Overall, the difference between 244Hz and 300Hz is not large enough to be relevant here.
Figure 3.
Demonstration of the distortions caused by wavelet and Butterworth filtering. A. Filtering of a 1 ms Hanning window, to illustrate the general type of distortion caused by each filtering method. B. Average spike waveforms for 6 representative cells. Solid black traces are wavelet filtered (level 6 decomposition), solid grey traces are Butterworth filtered (300–6000 Hz 4th order bandpass), and dotted black are unfiltered. Each set of spikes is normalized such that the largest spike has height 1 for the purpose of comparing relative shapes. The SNR is indicated by black text on top for wavelet-filtered cells, and grey text on bottom for Butterworth-filtered cells. Fast, sharp waveforms generally benefit in SNR from wavelet-filtering, however, the more common, “wider” waveform shapes have consistently higher SNR when wavelet-filtered. C. Average waveform shape of one cell, wavelet filtered with different levels of decomposition. Note that level 7 gives a near-perfect reconstruction of the unfiltered spike shape, but passes frequencies above 122 Hz, which reduces SNR during spike extraction. In our analysis, we used level 6, which has a cutoff frequency of 244 Hz and a much improved SNR over level 7, while better preserving spike shape than level 5 (Fig. 6).
Figure 4.
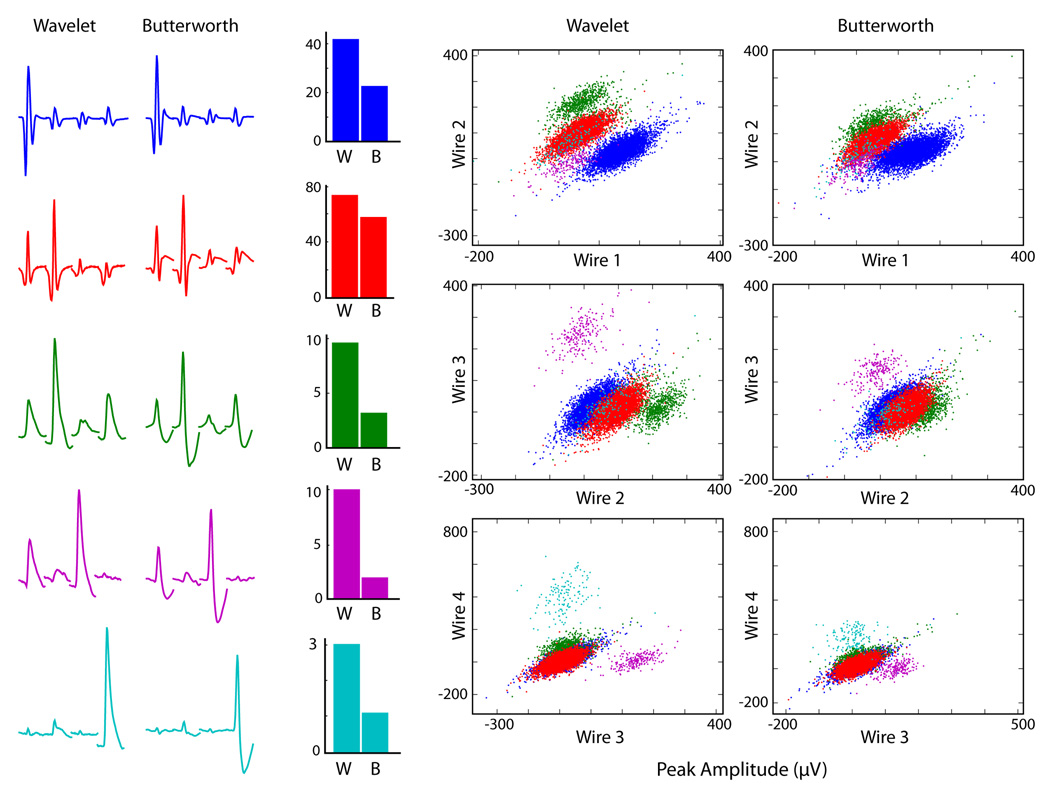
Comparison of cluster separation for wavelet- and Butterworth-filtered spikes. In this example, five cells were recorded simultaneously from a striatal tetrode. Left: The average waveform for each cell on each wire of the tetrode (1 ms per wire). Blue and red traces are presumed fast-spiking interneurons, while others are medium spiny neurons (MSNs). Middle: Isolation Distance of wavelet (W) and Butterworth (B) filtered spikes, calculated using only the peak heights on each tetrode wire. Right: plot of peak heights for each cluster, showing visibly improved separation using wavelet filtering.
The Wavelet Filter Algorithm
Pick a maximum decomposition level, n. Pick a wavelet and its associated decomposition and reconstruction filters (Fig. 1C & D). High-pass and low-pass decomposition filters are abbreviated as HiD and LoD, respectively. The corresponding reconstruction filters (which are the time inverses of the decomposition filters) are labeled as HiR and LoR. Then, for a signal S,
-
Decomposition of the signal.
Repeat for each i = {1, 2, …, n}
Convolve S with HiD. Keep only the even-indexed elements. Call this cDi and save.
Convolve S with LoD. Keep only the even-indexed elements. Call this cAi, but do not save unless i = n. Set this to be S.
-
Reconstruction of the signal.
Set all coefficients in cAn to 0.
Initialize Sf = cAn.
Repeat for each i = {n, n - 1, …, 1},
Upsample (Add zeros as even-indexed elements into Sf and cDi).
Convolve Sf with LoR. Call this cA*.
Convolve cDi and HiR. Call this cD*.
Sf = cA* + cD*
Cluster Quality
To quantify clustering quality, we used two measures as described by Schmitzer-Torbert et al. (2005). Isolation Distance is a measure of how well-separated a cluster is from the rest of a data set and LRatio indicates the distribution of non-cluster spikes around a cluster.
The Isolation Distance for cluster c, containing nc spikes, is defined as the squared Mahalanobis distance of the ncth closest non-c spike to the center of c. The squared Mahalanobis distance is calculated as
where xi is the vector containing features for spike i (3 PCA coefficients per tetrode wire), and µc is the mean feature vector for cluster c. ∑c is the covariance matrix of spikes in cluster c. The Isolation Distance is not defined when nc is greater than the number of non-cluster spikes. A higher value indicates that non-cluster spikes are located farther away. The Mahalanobis distance (Mahalanobis, 1936) is used because it helps compensate for ellipse-shaped distributions of spikes, i.e. a point at any edge of an ellipse is equidistant from the center of the ellipse using Mahalanobis distance. Note that Isolation Distance is not normalized against cluster size, so that clusters with a large number of spikes will tend to have a higher Isolation Distance.
LRatio is calculated as follows for cluster c:
where Di,c2 is the squared Mahalanobis distance between non-c spike i and the center of c and is the chi-squared cumulative distribution function describing the distribution of spikes in cluster c. The number of degrees of freedom is equal to the number of features used in the cluster space (here we use 3 principal components for each wire in a tetrode, df = 12). Then,
A low LRatio indicates that there is a relatively empty space between the cluster and other spikes in the data set. LRatio positively correlates with Type II errors (false omissions) and Isolation Distance negatively correlates with Type I errors (false positives; Schmitzer-Torbert et al., 2005). Therefore, a lower LRatio and a higher Isolation Distance together indicate better cluster quality. We tested for a significant difference between the clustering performance for the wavelet-and Butterworth-filtered spikes using the paired Student’s t-test. The number of points on which PCA was performed was varied as a window size, centered on the spike peak. To assess a possible improvement in spike detection, we calculated the SNR for each neuron. We defined the SNR as the peak amplitude of a neuron’s average filtered waveform divided by the standard deviation of the entire filtered recording session from which the spikes were extracted. The standard deviation was calculated using 60 1-second evenly distributed samples of the filtered data.
Results
As found in non-neural applications, WMLDR is an effective means of removing the lower frequencies from an electrophysiological signal (Fig. 2), as a preprocessing step before spike detection and sorting. To assess the distortion of waveforms produced by different filtering techniques, we first assigned spikes to single-units using standard Butterworth bandpass filtering (4-pole, 300–6000Hz passband), detection via constant threshold, and manual clustering. From these time-stamps, we then re-extracted spike waveforms from continuous data – either the original wideband signal (i.e. we took a spike-triggered average of the “raw” voltages) the wavelet-filtered, or the Butterworth-filtered signal. For neurons with the most common waveform shapes , typical of projection neurons in striatum (Fig. 3Bi, ii; Berke et al 2004) and hippocampus (Fig. 3Biii, iv), Butterworth filtering produces a highly distorted “valley” shape, while wavelet-filtered signals retain higher fidelity to the original wide-band signal. For briefer waveforms that represent likely interneurons, (e.g. Fig. 3Bv, vi) the distortion produced by Butterworth filtering was less marked but still typically more pronounced than with wavelet filtering. In no case did we observe marked distortion produced by wavelet filtering, although there was a slight tendency to produce a lowering of the signal around the spike peak; the extent of this effect varied with choice of wavelet decomposition level (Fig. 3C).
Figure 2.
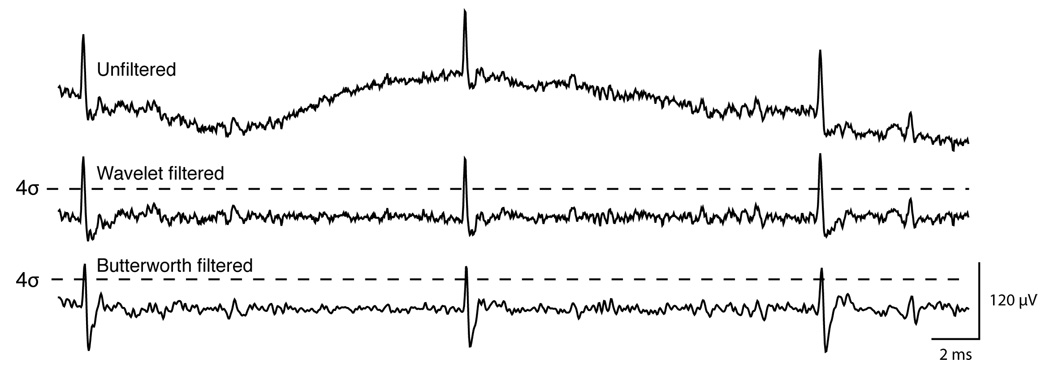
Comparison of unfiltered (top), wavelet filtered (middle, level 6 decomposition) and Butterworth filtered (bottom, 300–6000 Hz bandpass) traces from the same section of continuously recorded striatal tetrode data. Dotted black lines represent a threshold of 4 times the standard deviation calculated across the whole recording session.
We noticed that part of the distorting effect of Butterworth filtering was to reduce the peak height of striatal and hippocampal projection neuron spikes (e.g. Fig. 2). We compared the signal-to-noise ratio (SNR) for presumed rat and mouse projection neurons (n=47), and found that wavelet filtering produced a significant increase in SNR over Butterworth filtering (p < 0.05, paired t-test). For cells with briefer waveforms (including presumed striatal and hippocampal fast-spiking interneurons), the overall difference in SNR was not significant n=19; p = 0.486, paired t-test), and a few cases even had higher SNR with Butterworth filtering. This is because Butterworth filtering generally shifts the spike signal towards zero mean, which brings the signal closer to an upper threshold for cells with large downward deflections (Fig 3v,vi). Applying both a positive-and negative-threshold would remove this advantage over wavelet filtering.
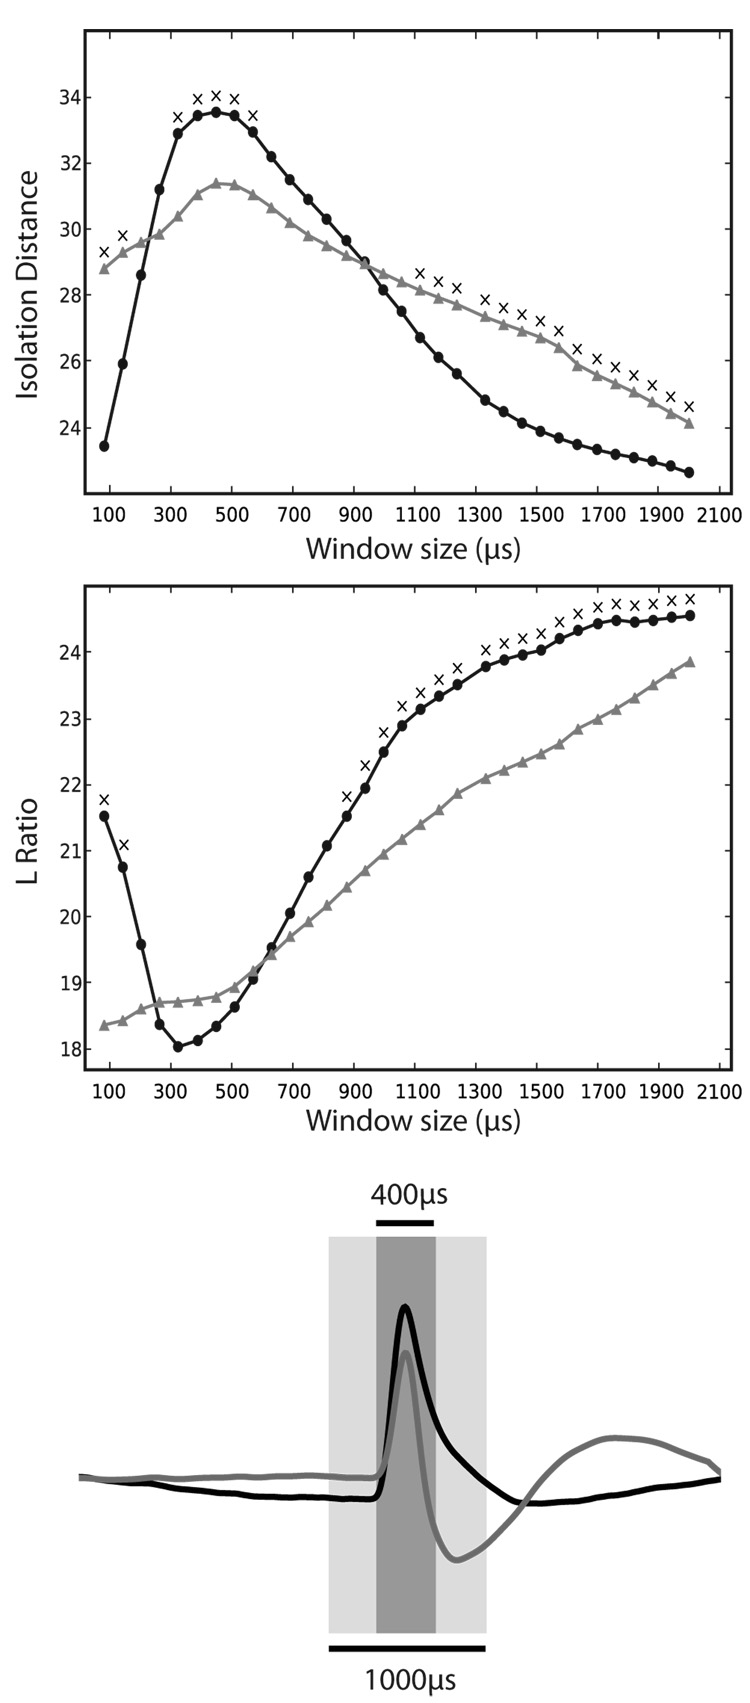
The increased SNR observed for striatal and hippocampal projection neurons with wavelet filtering noticeably enhanced cluster separation, when plotting peak height on each wire (for example, see Fig. 4). To quantitatively assess this difference between filtering methods on spike discriminability, we performed principal components analysis (PCA) on spike waveforms, using varying sizes of time window centered on the spike peak. We then measured the extent of cluster separation using Isolation Distance and Lratio in principal components space as a function of window size (Fig. 5). The best results were obtained using narrow windows around the peak (~350–400µs), with wavelet filtering. This is a useful result for spike sorting, because it indicates that only a narrow window around the spike peak need be extracted for effective cluster discrimination in PCA space.
Figure 5.
Wavelet filtering allows superior cluster separation with fewer data points. To determine how much of the spike waveform contributes to clustering performance, PCA was performed with varying window sizes (see Methods). Top: Plot of Isolation Distance versus window size used to perform PCA. Larger values of Isolation Distance are better. Circles are data from wavelet filtered clusters, and triangles are Butterworth filtered. A total of 47 presumed projection cells (30 from rat striatum, 17 from mouse hippocampus) across 7 tetrodes over 2 sessions each were used to compute cluster quality. Crosses above the data points indicate that there was a significant difference between the two filtering methods (p < 0.05, paired t-test, without correction for multiple comparisons). Middle: Plot of LRatio versus the window size. Lower values of LRatio are better. For both measures, the best performance was obtained using wavelet filtering using a ~350–400 µs window, corresponding to approximately 11–13 samples at 31250Hz. Bottom: a visual representation of the time window used for PCA superimposed of an example mean cell waveform (wavelet-filtered in black, Butterworth-filtered in grey).
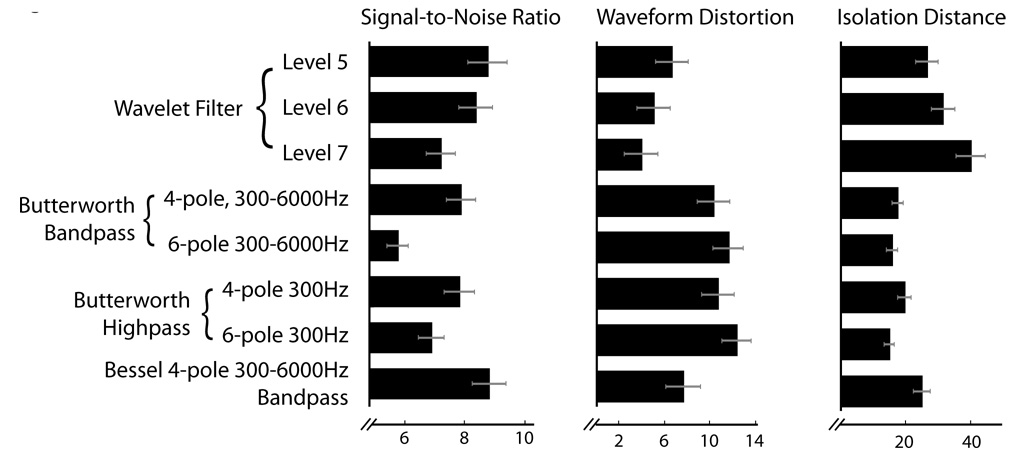
We quantified filter performance for a variety of filter types and parameters (Fig. 6), including both high- and band-pass Butterworth filters, higher-order versions of each, and an alternative IIR filter (Bessel bandpass). SNR determines the detectability of a spike using a constant threshold. An n=6 level wavelet filter outperforms all Butterworth filter types here, although the Bessel filter performs equivalently. The wavelet filter demonstrates markedly lower waveform distortion than any non-wavelet filter examined. The clustering performance of the wavelet filter, measured by Isolation Distance, was also significantly higher than the alternatives. In choosing a wavelet order, there is a tradeoff between SNR for initial detection and subsequent clustering performance. Although a level 6 wavelet filter has the most balanced performance, at some computational cost one could obtain even better results by using a level 5 wavelet-filter to detect spikes, then clustering them using either unfiltered waveforms or those obtained with a level 7 wavelet-filter. Our results also show among IIR filters, using a Bessel filter is a far better option than regular Butterworth filtering.
Figure 6.
Quantitative comparison of different filtering methods. Left: The SNR (see Methods) determines spike detectability. Middle: Waveform distortion is calculated as the mean squared Euclidean distance between each cell’s mean unfiltered waveform and mean filtered waveform (n=47 projection cells). The waveforms are normalized such that the unfiltered waveform has peak height 1. The Isolation Distance (see Methods) is calculated using 3 PCA coefficients per wire (on 4 wires) performed on a 400µs window of the spike, centered on the peak.
WMLDR is an established algorithm that is computationally efficient (Mallat, 1989). For a signal of length N and a high and low-pass filter set each of length K, the total decomposition and reconstruction of the signal requires at most 2KN multiplications and additions (Mallat, 1999), resulting in an operation that scales linearly with signal length. In our experience, using regular desktop computers, the execution time is comparable to Butterworth filtering and much less than the duration of the signal being processed even for recordings with >80 simultaneously processed channels. Thus,wavelet filtering is clearly fast enough to be used online for those laboratories that either do not wish to save the full high-speed wide-band signal, or that perform real-time spike sorting (e.g. for brain-machine interfaces).
Discussion
We have shown several advantages for using wavelet filtering with electrophysiological data, compared to current standard methods. WMLDR can faithfully preserve spike shape, which is a useful partial indicator of neuronal phenotype. For striatal and hippocampal projection neurons, which make up the great majority of neurons in those regions, wavelet filtered spikes exhibit a significantly higher SNR, allowing for easier spike detection and enhanced spike discrimination through cluster analysis. The technique is based on relatively simple operations, and so is fast enough to be applied online. It is thus reasonable to use it as a pre-processing filter before standard threshold-based spike detection methods, which require a signal with the low frequencies removed. Alternatively, methods that use wavelet coefficients for spike detection (e.g. Nenadic and Burdick, 2005, Hulata et al. 2002) could modify this approach to avoid redundant computation, by performing wavelet decomposition once for both removal of low frequencies and spike detection.
There is room for further refinements of the technique to increase the flexibility of the passband. First, a more subtle wavelet denoising technique might be used. In this paper we destroyed all the approximation coefficients, and, by not computing higher-level, lower-frequency detail coefficients, we effectively destroyed them as well. Second, we might employ a more complex wavelet algorithm called wavelet packet decomposition, along the lines of Hu et al., 2006. This is a more computationally intensive alteration of WMLDR can split both the high-and low-frequency components of a signal into equally-spaced frequency bands. WMLDR, by contrast, only splits the low-frequency components of a signal. This would enable the construction of a wavelet band-pass filter with arbitrarily precise control over the passband, although with a higher computational cost than our current approach.
Supplementary Material
Acknowledgements
We thank Vaughn Hetrick and Michael Churchill for skilled technical assistance, and Loren Frank for suggesting and help implementing the Bessel filter. Support for this work came from the Tourette Syndrome Association, the Whitehall Foundation, and the National Institute on Drug Abuse.
Footnotes
Publisher's Disclaimer: This is a PDF file of an unedited manuscript that has been accepted for publication. As a service to our customers we are providing this early version of the manuscript. The manuscript will undergo copyediting, typesetting, and review of the resulting proof before it is published in its final citable form. Please note that during the production process errors may be discovered which could affect the content, and all legal disclaimers that apply to the journal pertain.
References
- Addison P. The Illustrated Wavelet Transform Handbook: Introductory Theory and Applications in Science, Engineering, Medicine. London: Institute of Physics Publishing; 2002. [Google Scholar]
- Adeli H, Zhou Z, Dadmehr N. Analysis of EEG records in an epileptic patient using wavelet transform. J. Neurosci. Methods. 2003;123:69–87. doi: 10.1016/s0165-0270(02)00340-0. [DOI] [PubMed] [Google Scholar]
- Barthó P, HIrase H, Monconduit L, Zugaro M, Harris K, Buzsáki G. Characterization of Neocortical Principal Cells and Interneurons by Network Interactions and Extracellular Features. J. Neurophysiol. 2004;92:600–608. doi: 10.1152/jn.01170.2003. [DOI] [PubMed] [Google Scholar]
- Berke J, Okatan M, Skurski J, Eichenbaum H. Oscillatory Entrainment of Striatal Neurons in Freely Moving Rats. Neuron. 2004;43(6):883–896. doi: 10.1016/j.neuron.2004.08.035. [DOI] [PubMed] [Google Scholar]
- Berke J, Hetrick V, Breck J, Greene R. Transient 23–30Hz oscillations in mouse hippocampus during exploration of novel environments. Hippocampus. doi: 10.1002/hipo.20435. in press. [DOI] [PubMed] [Google Scholar]
- Berkes P, Wilbert N, Zito T. Modular toolkit for data processing (version 2.2) doi: 10.3389/neuro.11.008.2008. http://mdp-toolkit.sourceforge.net. [DOI] [PMC free article] [PubMed]
- Butterworth S. On the Theory of Filter Amplifiers. Wireless Engineer. 1930;7:536–541. [Google Scholar]
- Cesar RM, Jr, Costa LF. Neural cell classification by Wavelets and multiscale curvature. Biol. Cybern. 1998;79:347–360. doi: 10.1007/s004220050484. [DOI] [PubMed] [Google Scholar]
- Clarençon D, Renaudin M, Gourmelon P, Kerckhoeve A, Catérini R, Bolvin E, Ellis P, Hille B, Fatôme M. Real-time spike detection in EEG signals using the wavelet transform and a dedicated digital signal processor card. J. Neurosci. Methods. 1996;70(1):5–14. doi: 10.1016/S0165-0270(96)00073-8. [DOI] [PubMed] [Google Scholar]
- Csicsvari J, Hirase H, Czurko A, Buzsáki G. Reliability and State Dependence of Pyramidal Cell–Interneuron Synapses in the Hippocampus: an Ensemble Approach in the Behaving Rat. Neuron. 1998;21:179–189. doi: 10.1016/s0896-6273(00)80525-5. [DOI] [PubMed] [Google Scholar]
- Daubechies I. Orthonormal Bases of Compactly Supported Wavelets. Comm. Pure Appl. Math. 1988;41:909–996. [Google Scholar]
- Daubechies I. Ten Lectures on Wavelets. Philadelphia: SIAM; 1992. [Google Scholar]
- Hu X-G, Liu L-T, Hinderer J, Hsu HT, Sun H-P. Wavelet filter analysis of atmospheric pressure effects in the long-period seismic mode band. Phys. Earth Planet. Int. 2006;154:70–84. [Google Scholar]
- Hulata E, Segev R, Ben-Jacob E. A method for spike sorting and detection based on wavelet packets and Shannon’s mutual information. J. Neurosci. Methods. 2002;117:1–12. doi: 10.1016/s0165-0270(02)00032-8. [DOI] [PubMed] [Google Scholar]
- Letelier JC, Weber PP. Spike sorting based on discrete wavelet transform coefficients. J. Neurosci. Methods. 2000;101:93–106. doi: 10.1016/s0165-0270(00)00250-8. [DOI] [PubMed] [Google Scholar]
- Lewicki M. A review of methods for spike sorting: the detection and classification of neural action potentials. Network: Computation in Neural Systems. 1998;9:R53–R78. [PubMed] [Google Scholar]
- Mahalanobis P. On the generalized distance in statistics. Proc. Natl. Institute of Science of India. 1936;12:49–55. [Google Scholar]
- Mallat S. Multifrequency channel decompositions of images and wavelet models. IEEE Trans. Acoust. Speech Signal Processing. 1989;37:2091–2110. [Google Scholar]
- Mallat S. A Wavelet Tour of Signal Processing. 2nd edition. Academic Press; 1999. [Google Scholar]
- Markazi SA, Qazi S, Stergioulas LS, Ramchurn A, Bunce D. Wavelet Filtering of the P300 Component in Event-Related Potentials. Engineering in Medicine and Biology Society, EMBS '06. 28th Annual International Conference of the IEEE; 2006. pp. 1719–1722. [DOI] [PubMed] [Google Scholar]
- Misiti M, Misiti Y, Oppenheim G, Poggi JM. Wavelet Toolbox for Use with Matlab. Mathworks. 2000 [Google Scholar]
- Nenadic Z, Burdick JW. Spike detection using the continuous wavelet transform. IEEE Trans. Biomed. Engin. 2005;52:74–87. doi: 10.1109/TBME.2004.839800. [DOI] [PubMed] [Google Scholar]
- Oliphant T. NumPy: Numerical Python. 2006 http://numpy.scipy.org.
- Plexon Inc. Offline Sorter. Dallas, TX: 2003. [Google Scholar]
- Quiroga RQ, Nadasdy Z, Ben-Shaul Y. Unsupervised Spike Detection and Sorting with Wavelets and Superparamagnetic Clustering. Neural Computation. 2004;16:1661–1687. doi: 10.1162/089976604774201631. [DOI] [PubMed] [Google Scholar]
- Schmitzer-Torbert N, Jackson J, Henze D, Harris K, Redish AD. Quantitative Measures of Cluster Quality For Use in Extracellular Recordings. Neuroscience. 2005;131:1–11. doi: 10.1016/j.neuroscience.2004.09.066. [DOI] [PubMed] [Google Scholar]
- van Rossum G. Python Library Reference. CWI Report CS-R9524. 1995 [Google Scholar]
- Valens C. A Really Friendly Guide to Wavelets. http://pagesperso-orange.fr/polyvalens/clemens/wavelets/wavelets.html.
- Vetterli M, Herley C. Wavelets and filter banks: theory and design. IEEE Transactions on Signal Processing. 1992;40:2207–2232. [Google Scholar]
- Wasilewski F. PyWavelets. Discrete Wavelet Transform in Python. 2006 http://www.pybytes.com/pywavelets.
Associated Data
This section collects any data citations, data availability statements, or supplementary materials included in this article.


