Abstract
Spikes were evoked in rat olfactory sensory neuron (OSN) populations by electrical stimulation of the olfactory bulb nerve layer in pentobarbital anesthetized rats. The latencies and recording positions for these compound spikes showed that they originated in olfactory epithelium. Dual simultaneous recordings indicated conduction velocities in the C-fiber range, around 0.5 m/s. These spikes are concluded to arise from antidromically activated olfactory sensory neurons. Electrical stimulation at 5 Hz was used to track changes in the size and latency of the antidromic compound population spike during the odor response. Strong odorant stimuli suppressed the spike size and prolonged its latency. The latency was prolonged throughout long odor stimuli, indicating continued activation of olfactory receptor neuron axons. The amounts of spike suppression and latency change were strongly correlated with the electroolfactogram (EOG) peak size evoked at the same site across odorants and across stimulus intensities. We conclude that the curve of antidromic spike suppression gives a reasonable representation of spiking activity in olfactory sensory neurons driven by odorants and that the correlation of peak spike suppression with the peak EOG shows the accuracy of the EOG as an estimate of intracellular potential in the population of olfactory sensory neurons. In addition, these results have important implications about traffic in olfactory nerve bundles. We did not observe multiple peaks corresponding to stimulated and unstimulated receptor neurons. This suggests synchronization of spikes in olfactory nerve, perhaps by ephaptic interactions. The long-lasting effect on spike latency shows that action potentials continue in the nerve throughout the duration of an odor stimulus in spite of many reports of depolarization block in olfactory receptor neuron cell bodies. Finally, strong odor stimulation caused almost complete block of antidromic spikes. This indicates that a very large proportion of olfactory axons was activated by single strong odor stimuli.
INTRODUCTION
Several powerful techniques have been developed for observing the odorant responses of single neurons (OSNs). However, given the large variety of olfactory receptors and their various specificities, it is sometimes useful to use population measures to determine the overall response from a part of olfactory epithelium or to determine the global effect of manipulations. In addition, population recordings from OSNs are important because they can be performed in an intact epithelium where perireceptor mechanisms such as distributions of extracellular ions and proteins are maintained in their normal state. Because whole nerve recording from olfactory nerve has not been routinely successful in mammals, the electroolfactogram (EOG) has been a common tool for electrophysiological measurement of odor response. The EOG is an extracellular slow potential that has been interpreted as a summed generator potential in olfactory sensory neurons since its extensive description by Ottoson (1956). The major evidence for this interpretation was the observations that the EOG was not blocked by cocaine treatment that blocked responses in the olfactory nerve and olfactory bulb and that the EOG was not evoked by antidromic stimulation of olfactory nerve.
The EOG has been a useful tool in assessing expression of olfactory receptors (Zhao et al. 1998), testing of knockouts for general function genes not specific to particular olfactory receptors (Belluscio et al. 1998; Brunet et al. 1996; Buiakova et al. 1996; Munger et al. 2001), pharmacological manipulations (Nickell et al. 2006, 2007), human investigation (Knecht and Hummel 2004), and mapping differential odorant sensitivity in the olfactory epithelium (Scott and Brierley 1999). Despite this usefulness, there has been little exploration into the nature of the EOG since Ottoson's work. We have discussed some of the reservations about the EOG technique (Scott and Scott-Johnson 2002). For example, Mozell (1962) had observed that with certain electrodes odorants produced electrical potentials even in contact with nonbiological materials. Another issue that has sometimes raised concern is the fact that EOGs can be often recorded from animals several hours after death (Scott and Brierley 1999). For these reasons, we felt it useful to test other physiological correlates of the EOG.
Another concern about OSN recordings has been the relationship between potentials in the soma and the spike trains in axons. Intracellular recordings in salamander OSNs showed extensive action potential block of the soma spike during stimulation that produced strong depolarizations and large EOGs (Trotier and MacLeod 1983), although those authors presented evidence that action potentials continued in the axons. Whole cell patch recordings from OSNs also show depolarization block (Nguyen et al. 2007; Reisert and Matthews 2001a,b; Tomaru and Kurahasi 2005). Axon spikes could not be observed in these explanted cells. Extracellular recordings from rodent OSNs typically show rapidly decreasing spike sizes and shorter bursts of spikes at higher concentrations (Duchamp-Viret et al. 2000; Rospars et al. 2000). Thus the initial frequency of spike burst responses was correlated with stimulus concentration, but the burst duration (and therefore the overall numbers) of spikes declined with increased concentration. Verhagen et al. (2007) have calculated on the basis of glomerular optical imaging that OSN firing ceases rapidly after inhalation. Because the EOG reflects intracellular potential, it cannot be used to measure the spike train without further evidence. Correlations between the EOG and summated activity in the olfactory nerve have been studied in catfish (Caprio 1978), but similar recordings from mammalian olfactory nerve have not been reported. Although there are some bulb recordings that show sustained activity during long odor pulses (Scott et al. 2007), it is difficult to prove from those records that the nerve input was sustained.
Therefore we sought a method to compare population responses in OSNs simultaneously with EOG recording. We took advantage of our previous observation (Ezeh et al. 1995) that antidromic spikes could be evoked in OSN populations by stimulation on the olfactory bulb surface and that these spikes could be suppressed by strong odor stimulation. Here we have used trains of electrical stimulation of the olfactory bulb nerve layer to study this antidromic response during the course of the EOG. By varying the recording position, the odorants, the concentrations, and the flow rates, we studied how the size and time course of the suppression of these antidromic OSN population spikes compares to the EOG. In the course of this study, we found evidence for sustained action potentials in the olfactory nerve during sustained stimulation. We also found that odor stimulation slows and synchronizes action potentials in local regions of the olfactory nerve, a finding that is consistent with suggestions of ephaptic interaction among the small axons within an olfactory nerve fascicle.
METHODS
These recordings were performed in a manner similar to our previous EOG recordings (Scott et al. 2006, 2007); with the exceptions that the rats were maintained alive under anesthesia and that electrodes were placed on the surface of the olfactory bulb to antidromically stimulate the olfactory nerve. All procedures are in accordance with our protocols approved by the institutional animal care and use committee.
Surgery, electrode placement, and recordings
Male Sprague-Dawley rats (225–400 g) were pretreated with atropine (0.4 mg/kg) and anesthetized with sodium pentobarbital (50 mg/kg). The bone over the olfactory bulb was thinned with a dental burr until it could be picked off gently without damage to the bulb. The dura was removed with fine forceps to expose the dorsal and lateral surfaces. Stimulating electrodes had bipolar silver contacts 0.25 mm wide and ∼1.5 mm in length separated by ∼0.5 mm. The DC resistances were on the order of 10–100 KΩ. One bipolar pair was placed on the dorsal surface of the bulb as far forward as possible. The other pair was placed at the rostral extreme of the mid-lateral surface of the bulb. In each case, the long axis of the electrodes was oriented at right angles to the course of olfactory axons.
The bone overlying the dorsomedial recess of the nasal cavity was similarly thinned to make a small hole a least 2 mm in diameter. In some cases, two holes or one long exposure were made to allow placement of two electrodes in the dorsal epithelium. A similar exposure was made to expose ventrolateral olfactory epithelium between the bases of endoturbinate II and ectoturbinate II. Particular care was taken to avoid removing the lachrymal bone or tearing the soft tissue at the rostral part of the orbit, which would allow a leak into the airway and prevent adequate olfactory stimulation. Glass micropipettes filled with Ringer solution and having a resistance of ∼10 MΩ were inserted through the epithelium until a large negative deflection was observed in response to a strong isoamyl acetate odor.
The ground was a silver wire placed on the skull surface or wrapped around a cotton ball soaked with Ringer solution and placed in the mouth. This latter position helped to reduce the electrical artifact associated with olfactory bulb stimulation close to the recording electrodes. Activation of a sufficient number of olfactory axons to evoke maximal population spikes usually required stimulus durations of 2–4 ms with 100 V. Presumably this high-threshold results from the difficulty driving current into the small C-fibers of the olfactory nerve. It is noteworthy that Ottoson (1956), in his extensive study of the EOG, reported that it was not possible to see antidromic activation of the frog OSNs. It is not clear from that paper whether he explored these long duration stimuli. Our previous report (Ezeh et al. 1995) erroneously indicated the use of 0.1-ms stimulus durations. In these cases, we were not able to detect these population spikes with stimuli of that duration.
Recordings were made with DC amplifiers with a high-frequency cut-off at 3 kHz. Data were digitized at 1–10 kHz and stored as computer files. All conduction velocity measurements were made with 5- to 10-kHz digitization. Spike records in the figures are averaged to show smoother records, but in all cases, the spikes showed very little variation (<0.25 ms) in latency for any particular stimulus in a sequence.
Odor stimulation
Odorants were introduced with an 8-mm glass tube with multiple ports connected by Teflon tubing to bottles containing test stimuli. Odorants were used full strength or were diluted in mineral oil at ratios between 0.1 and 0.001 and kept in glass bottles with gas-tight Teflon fittings and tubing leading to the stimulus tube. These dilutions were tested with a gas chromatograph equipped with a flame ionization detector when they were made up, and these were confirmed after several days of use. These bottles had a volume of 100 ml. The mineral oil/odorant mixture covered the bottom of the odor sample bottle for a depth of ∼0.5 cm and had a surface area of ∼6 cm2. Air flowed through the odor sample at a rate of 100 ml/min. The sample was further diluted by injection into an air stream that constantly flowed over the preparation at a rate of 1000 ml/min so that the final odorant dilutions were 1/10th that in the stimulus bottles. Reported dilutions in figures are based on the gas chromatic results. Odorant flowed in the system for 9 s to allow the odorant concentration to stabilize in the system before the vacuum was turned on to initiate the 1.5-s sniff. This provided a temporally sharp odor onset. Flow rates varied as described in the results. In a few cases described in the text, longer stimulus durations were used.
RESULTS
Antidromic spikes
As we reported previously (Ezeh et al. 1995), electrical stimulation of the surface of the olfactory bulb evoked compound action potentials in the olfactory epithelium. Figure 1A shows an experiment in which spikes were recorded from the dorsal and lateral olfactory epithelium, depending on the site of stimulation on the olfactory bulb nerve layer. In seven cases, stimulation at either of the two bulb sites produced a population spike ranging from 0.5 to 2.5 mV in the corresponding part of the epithelium, but no detectable response at the other site. The spikes were easier to obtain in the dorsal epithelium (success in almost all preparations as compared with success in 7/12 preparations for the lateral site), possibly because of differences in the thickness of the epithelium, but also possibly because of problems placing the electrode in the lateral recess. Although the latencies for the lateral sites tended to be shorter, this was not systematic and depended on electrode placement. These results indicate that the antidromic responses are local and that the OSNs at the recorded positions in the epithelium project to the dorsal and lateral surfaces of the bulb as expected from published anatomical studies (Astic et al. 1987; Miyamichi et al. 2005; Ressler et al. 1994; Schoenfeld et al. 1994; Vassar et al. 1994). In agreement with Ottoson (1956), there was no long EOG-like slow potential associated with the antidromic spike alone.
FIG. 1.
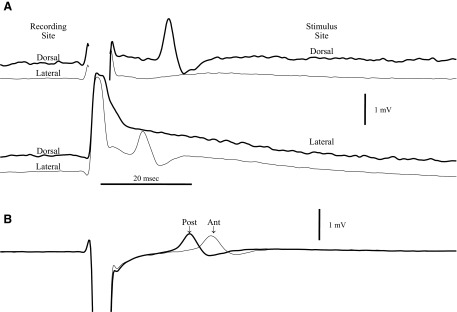
A: the averages of 6 sweeps for antidromic spikes recorded simultaneously from sites in the dorsal and lateral parts of olfactory epithelium during stimulation with electrodes at dorsal and lateral sites on the olfactory bulb surface. With dorsal bulb stimulation (100 V for 3 ms), the spike response was only detectable in the dorsal epithelium, whereas lateral bulb stimulation (100 V for 2 ms) evoked a response only in the lateral epithelium. The shock artifact is removed for the dorsal recordings to avoid overlap of the records. All records are from the same animal. B: simultaneous recordings from 2 dorsal sites in a different animal (average of 8 sweeps). The latencies from the beginning of the stimulus pulse for the 2 spike peaks are 22.5 ± 0.03 and 26.6 ± 0.10 (SE) ms. The recording electrodes were 3.1 mm apart, giving a conduction velocity of 0.67 M/s.
Because of greater access to the dorsal epithelium, it was possible to record simultaneous population spikes from two electrodes at different distances from the bulb (Fig. 1B). In this case with electrodes separated by 3 mm, spikes occurred at latencies 4.1 ms apart (peak-to-peak), consistent with a conduction velocity of 0.67 M/s. These spikes with distinct latencies indicate that the response was generated locally in the epithelium rather than being volume conducted from the olfactory bulb. In similar recordings from 17 animals, we estimated conduction velocities of 0.38−1.3 M/s (median = 0.53 M/s). These conduction velocities are consistent with C fiber recordings and with the report of Phillips and Griff (2002) for olfactory nerve and support an origin of the spikes in OSNs. The spikes also inverted polarity as the electrode was driven through the epithelium as described by Ezeh et al. (1995), which further supports their local origin in the olfactory epithelium. The spikes disappeared completely very soon after sacrifice by drug overdose, indicating a high metabolic requirement, in contrast to EOG recordings that can be observed for hours after the heart has stopped (Ezeh et al. 1995; Scott and Brierley 1999).
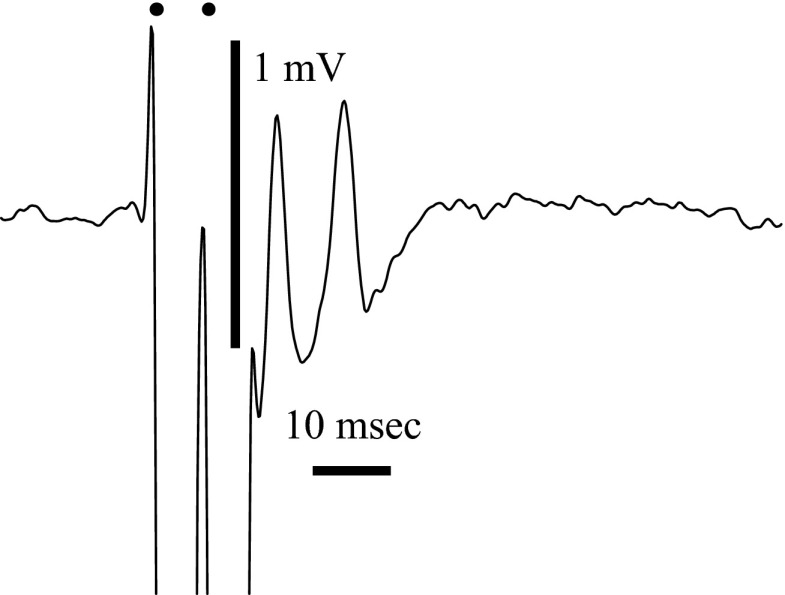
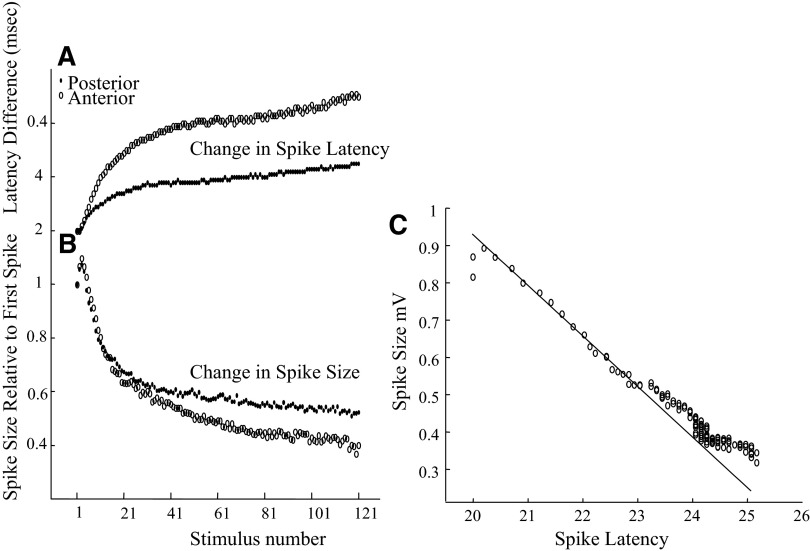
The interpretation of these spikes as antidromic responses is supported by the response to high-frequency electrical pulses (Fig. 2). The spikes followed pulse pairs at frequencies as high as 200/s. With sustained trains at lower frequencies, there was an increase in spike latency (measured to the spike peak) and a decrease in spike size (Fig. 3). We were limited in the testable frequencies because of overlap with the following pulses, but frequencies ∼25 Hz led to frequency shifts of ∼3 ms or more for some preparations. We rarely observed initial decreases in latency in contrast to the reports of supranormal of latencies observed in turtle and tortoise olfactory nerve (Bliss and Rosenberg 1979; Waldow et al. 1981). However, we did observe increases in response size for the first few responses (Fig. 3B) over a wide range of frequencies consistent with the observations of Waldow et al. (1981). When the spike size was plotted against spike latency for these records (Fig. 3C), there was usually a small twist at the left extreme of the curve because of initial supranormality of the spike size, whereas the rest of the curve was slightly concave upward.
FIG. 2.
The response of a spike recorded in the dorsal epithelium after paired pulses with a 6.6-ms interval (150 Hz). The 2 spikes show that the response follows high frequencies. Average of 8 sweeps. The onset of the 2 stimulus pulses is shown by the 2 dots above the records.
FIG. 3.
A: change in antidromic spike latency with repetitive stimulation at 30 Hz for 2 recording sites in the dorsal epithelium. The change is represented as differences from the 1st response (based on averages of 10 sweeps). The circles represent the more anterior site, and the dots represent the more posterior site. The difference is greater for the site more distance from the stimulus. B: change in spike size with repetition. Note that the spike size increased for the 2nd through the 4th pulses and decreased sharply. The anterior site is slightly more affected by prolonged repetition. The measurements are based on the average of 10 sweeps. C: spike size decreased in a nearly linear fashion after the 1st few stimuli of the train, although after prolonged stimulation, the spike size changed more slowly than the spike latency. The form of this curve was similar for the 2 sites.
Effects of odor response
All of the odor response data presented here are from dorsal sites in the epithelium because of difficulties obtaining simultaneous EOG responses and spike responses from the lateral sites in anesthetized animals. We only achieved three cases of large lateral EOG in this series. This low success rate seems to arise from fluid that accumulates in the lateral spaces under pentobarbital sodium anesthesia, despite the atropine pretreatment. Our EOG recordings in freshly killed animals (Scott et al. 2006, 2007) usually avoided this problem, because death was too fast for large amounts of fluid to accumulate. This fluid accumulation, combined with the greater difficulty getting spike responses in the lateral epithelium, prevented successful experiments with the lateral epithelium.
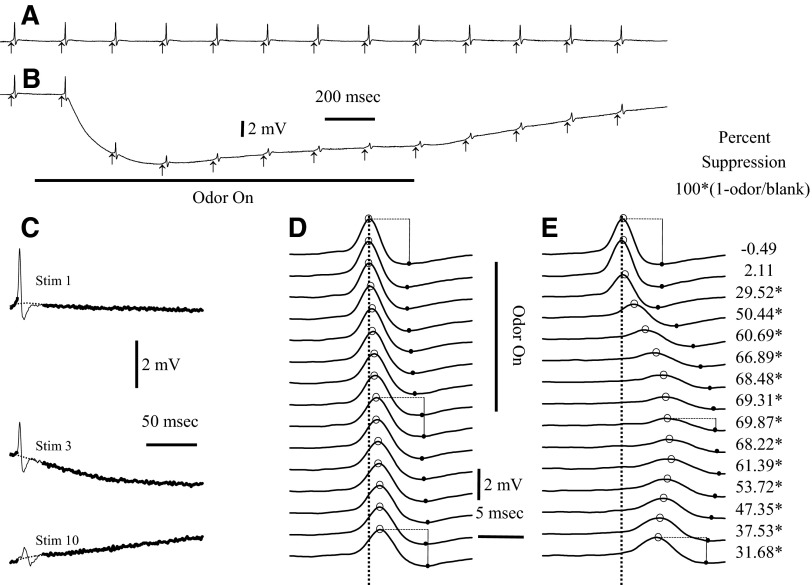
These antidromic spikes recorded from dorsal sites were suppressed if the electrical pulses were applied during an odor stimulus that produced a large EOG at the recording site. For the example of Fig. 4, responses to a train of pulses at 5 Hz without odor (blank) were compared with response during a 1.5-s presentation of methyl benzoate (Fig. 4, A and B). Because the spike size changes during a pulse train, we compared each spike during an odor response to the corresponding spike during a blank. Figure 4C shows how shock artifact and EOG were removed from the records to facilitate a pulse-by-pulse comparison of the spike amplitude.
FIG. 4.
The antidromic spikes at the dorsal sites were suppressed if the stimuli were applied during strong odor stimulation. Responses to a train of electrical stimulation without odor are compared with response during odor presentation. Electrical stimuli to the bulb surface were presented at a rate of 5/s. A: average responses to the electrical stimulus for a blank (n = 5). Arrows indicate the time of the electrical stimuli (stimulus artifacts removed). B: a 1.5-s presentation of methyl benzoate (10−1 of saturation) depressed the size of the averaged antidromic spikes (n = 5 odor stimuli). The traces in A and B are truncated before the end of the recording. Both the electroolfactogram (EOG) and the spike height returned to baseline by the end of the 4-s recording. C: spikes 1, 3, and 10 from B. Because the EOG and the decay after the shock could distort measurements of the peak, the peak measurements were made from a baseline estimate (dotted line) based on a fit to the points before and after the spike (heavy line). D: control spikes of A with the estimated baseline subtracted. With repeated shocks in a train, the peak latency (indicated by circles) shifts slightly relative to the peak latency of the 1st spike (dotted vertical line). The spikes also broaden during repeated stimuli as shown by the increased latency of the minimum voltage after the peak (filled circles). E: the spikes during the odor response with the estimated baseline subtracted (as in B). The peaks and minimums of the spikes are indicated with open and filled circles as in D. The amplitudes of spikes in the blank and odor trials were calculated as the difference in voltage between the peak and the minimum, as shown for trials 1, 9, and 15. The percent spike suppression was calculated from the ratio of the amplitudes in the odor/blank trails, as shown to the right of E. The statistical significance of differences in spike amplitude was assessed with t-test. In this example, there were 5 blank and 5 odor trials. *Times at which the spike suppression was significant at the P < 0.01 level.
Repeated stimulation in the blank trials usually produced a small shift in spike latency and a small decrease in spike size (Fig. 4D), even though pulse rate was relatively slow compared with Fig. 3. This latency shift and change in spike size increased slowly throughout the pulse train. The changes in latency and spike size were much greater for the odor trials (Fig. 4E), and both measures began to recover after the odor was turned off. The latency often recovered more slowly than the spike amplitude. Although the change in amplitude and latency was qualitatively similar to that in Fig. 3, the effect of odor was stronger. Prolonged stimulation at high frequencies with no odor produced a decrement in spike site response size to ∼40% of the initial response, whereas it was common for strong odor stimuli to depress the spike to <10% of the corresponding spike during a blank.
Figure 4E also shows the calculation of spike suppression. This calculation compared each mean spike during odor stimulation to the corresponding mean spike of a blank presentation. A Matlab routine found the peak voltage in a time window from 2 to 50 ms after each stimulus pulse and found the trough (minimum voltage) following that peak in the same window. For the responses during odor stimulation, the sampling interval began at the latency of the corresponding blank peak. This was necessary for those cases where the spike became so small that it was sometimes buried in the noise. If the peak was found outside the specified window, the amplitude and the latency were considered missing values. Spike size was the voltage difference calculated at the time of the mean peak and trough. There was almost no variation in latency across trials for a particular spike in the series, except when the spikes were small enough to be lost in the background noise. Thus we could calculate mean values at the peak and trough times without calculating the latency for each individual trace. This was helpful because the latency calculations for individual spikes became difficult when the spikes were strongly suppressed by a large odor response. Statistical comparisons at each point could be made by comparing the amplitudes for each sweep at the times of the mean peak and trough of the average sweep. Our spike suppression ratio measurements were not influenced by the increased latency during odor responses, because we compared the amplitudes for corresponding peaks during blanks and odor responses. Had we measured the amplitudes in Fig. 4E at the time of the initial peak in Fig. 4D, the apparent suppression would have been even greater and would have recovered much more slowly. The 5-Hz electrical stimulus rate shown here was used for all experiments unless specifically stated because it allowed reasonable temporal resolution and did not itself produce very strong effects on spike latency or size.
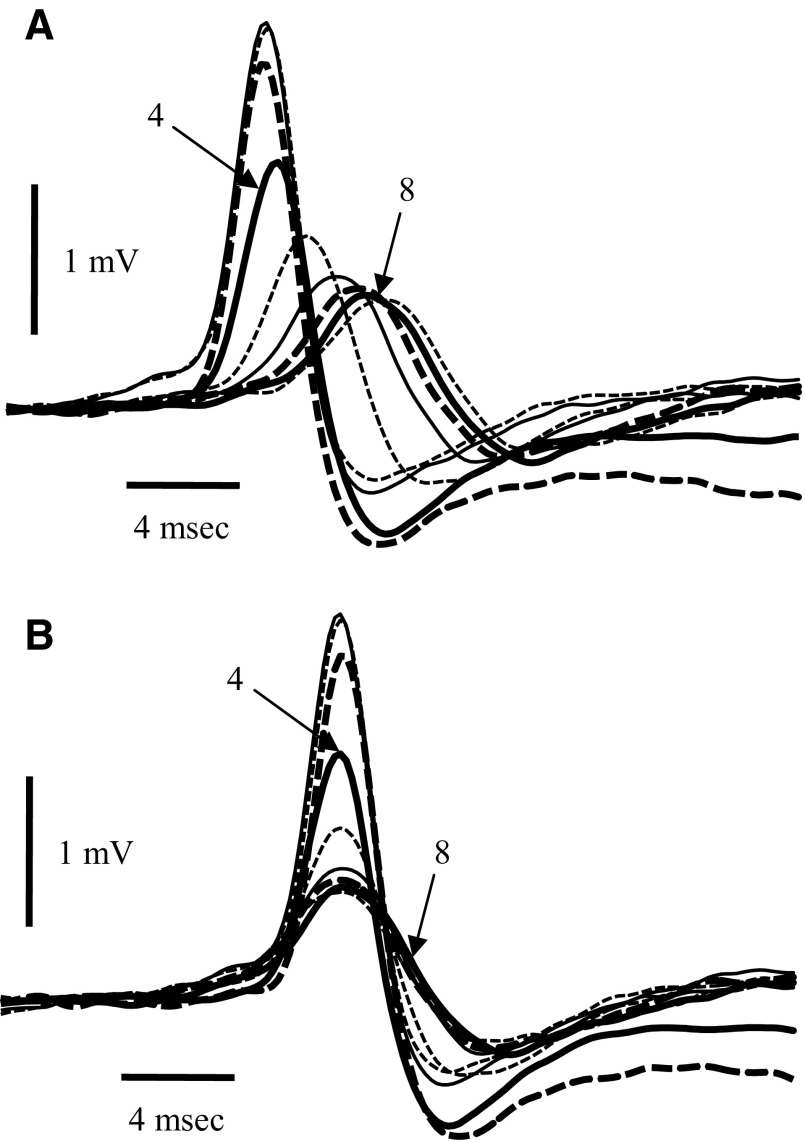
Analysis of the spike latencies is important in understanding these results. Figure 5 shows overlapped spikes from the data of Fig. 4 to show that the action potential slowing occurs for a large proportion of axons at the same rate. One might expect two peaks in the response. The majority of axons should be associated with receptors not responsive to the test odor. Therefore their latency should not change. Another group of axons associated with the responsive receptors should fatigue and have longer latencies. However, we always observed only a single peak. Figure 5 plots a set of responses during one odor stimulus to show that although the antidromic spikes are delayed and broadened during the odor stimulus, there was a single peak. This suggests that axons are being synchronized by some mechanism, perhaps the ephaptic interactions suggested by Bokil et al. (2001). We never saw multiple peaks in these responses. This allowed us to characterize the latency of each peak with a single value.
FIG. 5.
Antidromic spikes during the odor responses have a single peak. A: overlapped spikes similar to those of Fig. 4E aligned on the electrical stimulus. Each successive spike after the 1st 2 had a smaller size and a longer latency. The arrows indicate spikes 4 and 8 of the sequence (heavy solid lines). The absence of a short latency peak for later spikes in the sequence indicates that there were not 2 modal spike latencies. B: the same data aligned on the spike peaks and indicates that there was some broadening of the spike at longer latencies, which could represent either slight asynchrony of the spikes or slowing of the action potentials.
The suppression of antidromic spikes was not due to fatigue of spike mechanisms in axons or somata. Figure 6 replots the data of Fig. 4 to show the relationship between latency and spike size during odor responses. Whereas Fig. 6A shows the size of the spike suppression at each time during the response, Fig. 6B shows the average spike size plotted as a function of spike latency. When we analyzed data like that of Fig. 3 where changes in latency and spike size were induced by high-frequency stimulation, the spike size decreased in a nearly linear manner as latency increased. The size of the blank responses in Fig. 6 also decreased as a result of the 5-Hz stimulus. The dots in Fig. 6B show the sizes of the spikes during the blank plotted as a function of latency. The solid line in Fig. 6B was extrapolated by testing the spikes with a higher frequency stimulus to find the approximate relationship between spike latency and size that would occur from axon fatigue. In contrast, the spike size during the odor response is represented by the numbers that show the correspondence between the spike timing in A and the latency-size plot in B. During the odor response, the spike size was depressed far below that expected from axonal fatigue and remained depressed until the EOG began to recover. At that point, the spike size recovered to or above the projected curve for axonal fatigue. This suppression below that projected for the fatigue effect occurred in all preparations, although the effect was small in the responses to very-low-intensity stimuli.
FIG. 6.
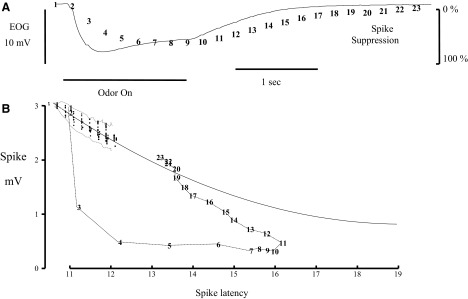
Spike suppression during odor responses is greater than would be expected from the antidromic latency. A: EOG record from Fig. 4 (solid line) and plots the spike suppression computed for each successive antidromic spike in the sequence (numbers). The key for spike suppression is at the right. B: antidromic spikes during the blank and odor stimulus against the corresponding spike latency as in Fig. 3C. For the blank, the individual responses for the 5 repetitions are plotted as filled circles bordered by a dotted line indicating the SD. The solid line extended from those points is an estimate of the latency-size relationship based on a higher frequency test at the same recording site. The spikes during the odor response are marked with the same numbers as in A and are connected by lines to help clarify the sequence.
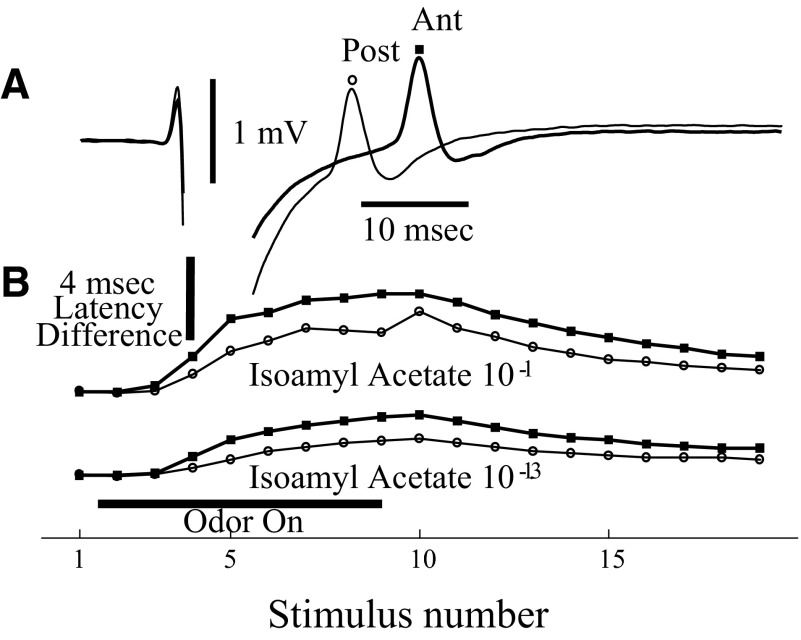
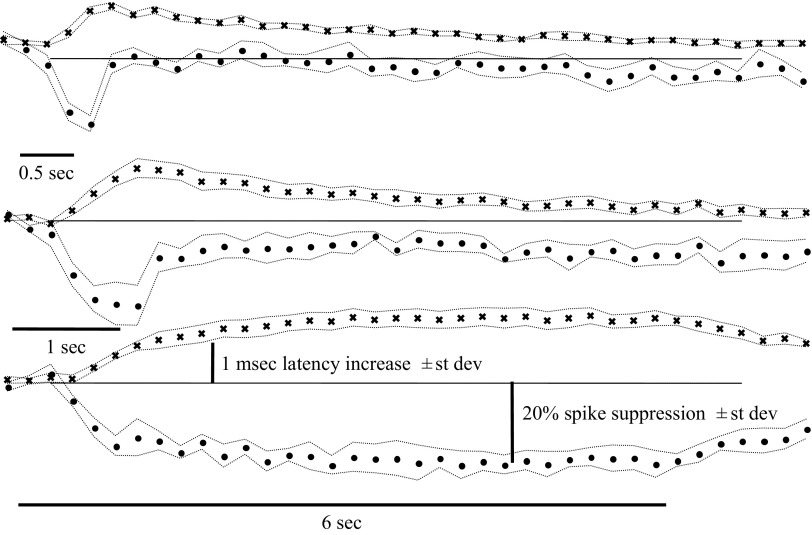
Evidence that the latency changes took place in the axon rather than in the cell body is presented in Fig. 7. This shows that, as in the responses to high-frequency stimulation shown in Fig. 3, the latency changes during odor responses are greater for longer axons. Both anterior and posterior electrode had increased spike latencies during the odor response. However, the latency difference for the anterior electrode was greater throughout the course of the stimulus. The only exceptions were when the spike suppression was so strong that latency could not be measured accurately. Furthermore, the lengthening of latency was proportional to the latency at each time period. In this figure, the anterior-to-posterior latency difference became proportionally longer as the latency for the posterior site increased (r = 0.74 for the higher concentration and r = 0.92 for the lower concentration, P < 0.01 in both cases). This suggests that the process producing the longer latencies is fatigue in the axons rather than a depolarization block in the somata. The prolonged latency during odor stimulation is maintained even for very long duration stimuli. Figure 8 shows the antidromic latency and spike size across three very different odor stimulus durations. If action potentials occur in the nerve during the entire period of odor presentation, there should be spike increased latency during that period. While the spike suppression might possibly be explained by depolarization block in the OSN somata, the greater latencies in longer axons indicates that the prolongation of latency is because of changes in axons.
FIG. 7.
The latency of spikes is increased during odor response in proportion to axon length. A: latencies of simultaneously recorded spikes in the dorsal epithelium. The more anterior site (squares) had a longer latency. B: latency changes during responses to 2 concentrations of isoamyl acetate odorant presentation. The spike with the longer latency showed a consistently greater increase in latency during the odor response. Measurements based on the average of 5 sweeps.
FIG. 8.
The effect of odor stimulation on antidromic spike latency (x) lasts as long as the odor stimulus and the spike suppression (filled circles). This implies that the odor stimulus continues to evoke action potentials in the nerve.
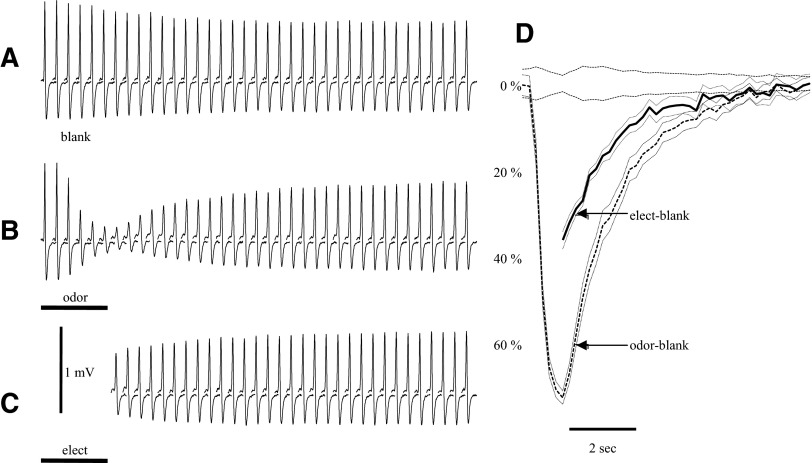
The spike size and latency usually did not return to baseline as rapidly as the EOG did after odor stimulus termination. This cannot be taken as direct evidence of continued firing after stimulus offset. More likely it represents slow recovery of conduction in axons. Figure 9 shows the comparison of response to an odor stimulus and a high-frequency antidromic shock train. In both cases, the spike size recovers slowly after stimulus cessation, consistent with the fatigue hypothesis.
FIG. 9.
The slow decay of response suppression does not necessarily represent continued activity in olfactory nerve. On the left are overlapped insets of average antidromic spikes recorded in different conditions. A: responses during a blank (25 sweeps). B: response from the same site during odor stimulation with isoamyl acetate (25 sweeps). C: recovery after a train of high-frequency antidromic shocks (37 Hz) that depressed the spike size (22 sweeps). Measurements during the high-frequency train were not possible because the shocks overlapped the spike. All test stimuli are at 200-ms intervals. D: mean and SE for the spike suppression curves vs. the SE around the 0 line for the blanks. The values of the suppression ratio are indicated by the scale at the left. Both odor and electrical responses decay very slowly.
Relation of EOG magnitude and spike suppression
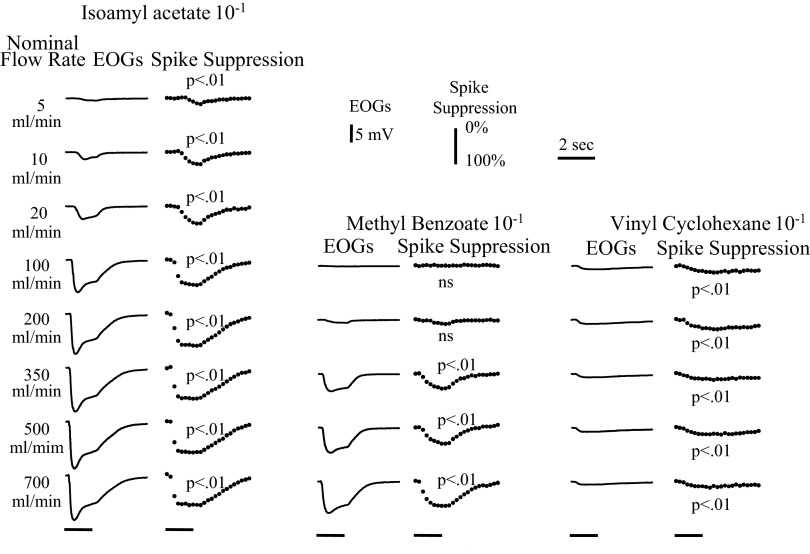
We studied the relation between the EOG size and amount of spike suppression by varying the flow rate for three odorants of different physiochemical properties. Methyl benzoate is very polar and evokes large EOGs in the dorsal epithelium but only does so at high flow rates. Vinyl cyclohexane is very nonpolar and evokes much smaller dorsal EOG responses, but those responses change very little with flow rate. Isoamyl acetate evokes large dorsal EOG responses, and its flow dependency is intermediate between that of methyl benzoate and vinyl cyclohexane. Figure 10 shows examples of mean EOG and spike suppression responses to these odorants for one animal. Note that the spike suppression is detectable over much the same range as the EOG. The shape of the spike suppression waveform is not the same as the waveform of the EOG. The spike suppression waveform lags as though it is related to the EOG by at least one decay process. As noted above, the recovery of spike size is also slower than the EOG, probably because of axon fatigue.
FIG. 10.
The average EOGs and corresponding spike suppression records are plotted for 3 odorants at a series flow rates from a single animal. All records have the same time base. All responses were all evoked by 1.5-s odor stimuli, indicated by the bars at the bottom of the figure. The calibration for the EOGs and spike suppression plots are shown in the top right. Significance tests for the spike suppression records were one-tailed t-tests with a criterion of P < 0.01 for the sums of the degree of suppression against the corresponding blank records.
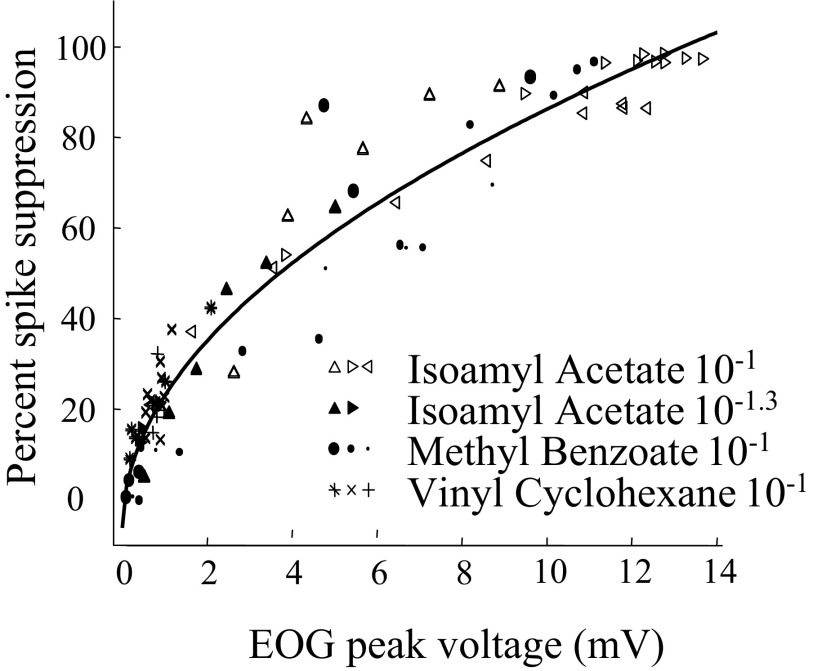
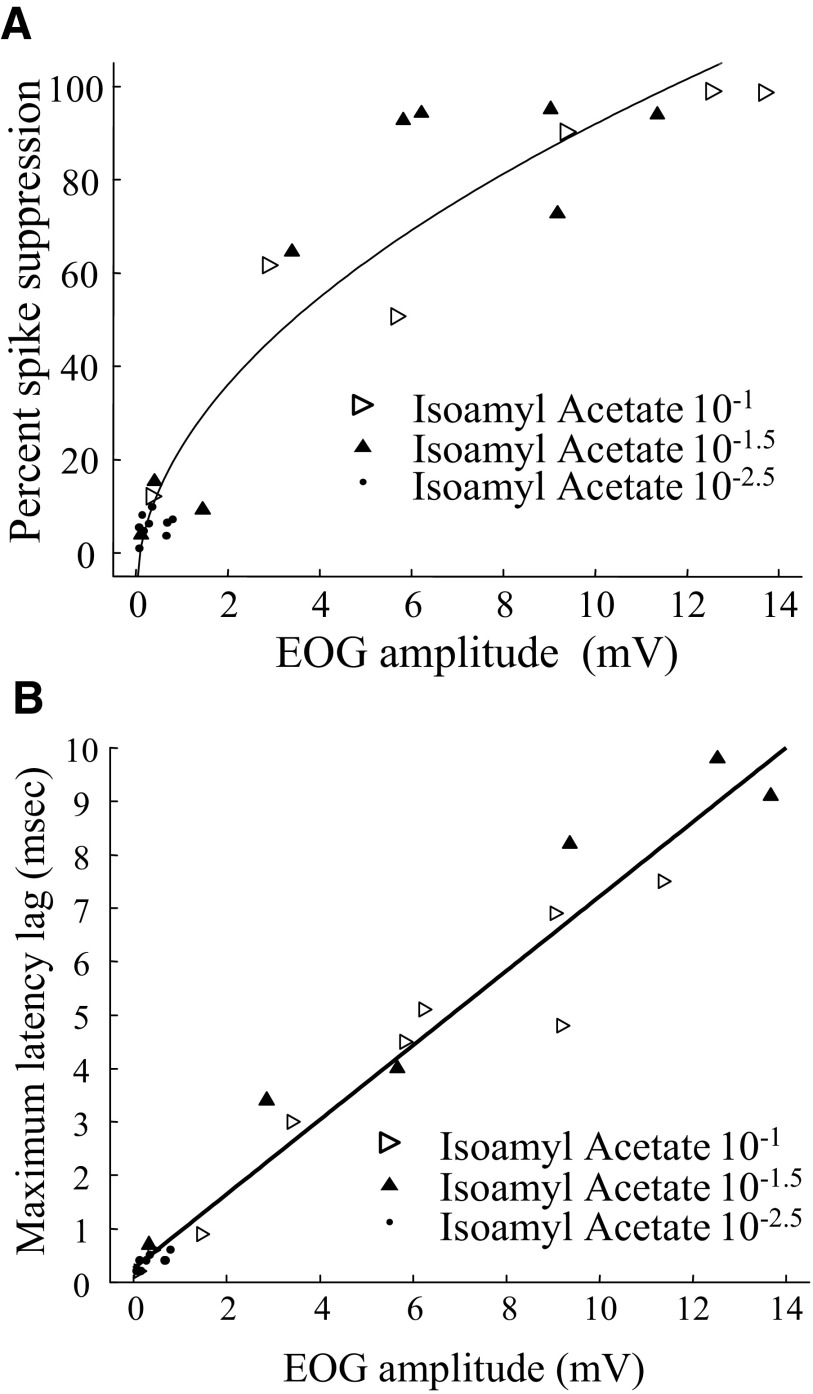
The size of the peak EOG and spike suppression responses are compared in Fig. 11 from three experiments in which we varied the flow rates over a nominal range of 5 to 1,000 ml/min. These were three experiments for which there were strong EOG responses with a peak for isoamyl acetate at 10−1 of 10 mV or more at a high flow rate. There is a high correlation between the EOG size and the degree of spike suppression. Because the minimum spike size is limited, the relation between the EOG peak and peak spike suppression seems to be better fit by a function of the square root of the EOG. However, both linear and curvilinear fits give correlation coefficients above 0.94 for the plot in Fig. 11, and it would take much more data to establish whether the relationship is significantly nonlinear. Because Fig. 11 is based primarily on variations in flow rate, we included some experiments where we manipulated odor concentration by altering the concentration in the odor stimulus bottles in addition to manipulating flow rate. One of these experiments is shown in Fig. 12A. Very similar curves were seen if we compared the area under the curves for EOG and spike suppression for the experiments of Figs. 11 and 12 (data not shown). In contrast to the apparent nonlinear shape of the relation between the EOG and the degree of spike suppression, the relation between the EOG peak and antidromic spike latency appears linear. One example is shown in Fig. 12B. Although the greater linearity would seem to make peak latency a better measure, latency is difficult to measure with strong stimuli because the spikes are strongly suppressed.
FIG. 11.
Peak EOG and peak spike suppression from 3 experiments. The fitted line is −0.06 + 0.3 × sqrt (EOG). The correlation with the fitted line is 0.97 and the linear correlation is 0.94. The relationship seems independent of the odor.
FIG. 12.
A: results from an experiment in which response size was manipulated by varying both flow rate and isoamyl acetate concentration. The result is very similar to that of Fig. 9. The fitted line is −0.09 + 0.32 × sqrt(EOG). The correlation for the fitted line is 0.95 and the linear correlation is 0.92. The nonlinearity occurs because the spike suppression ratio cannot go beyond 100%. However, some of the response did approach 100% spike suppressio. B: spike latency data from the same experiment as Fig. 10 showing that the spike latencies are also very sensitive to odor stimulation. In this case the relationship is clearly linear.
Air flow
Recently, Grosmaitre et al. (2007) reported mechanical sensitivity in OSNs of the septal organ of the olfactory epithelium when tested in an explanted preparation. Although the region that we recorded is one of high air flow, its cells do not necessarily have the same properties as those of the septal organ. We considered it important to ask whether the airflow itself could alter antidromic spike size for this intact condition. This is an important question because it is common to note small EOG deflections when nonodorized air flows in the nose at high rates. This was reported even in Ottoson's early paper (1956) and attributed by him to an artifact of humidity differences. We have not been able to find a single cause, but have noted it more often as tissue begins to dry.
Most of our experiments were designed to compare odor stimuli to blanks at the same flow rate. However, we could test the effect of airflow by comparing blanks at different flow rates. We compared the spike size changes for eight animals in which the air flow was varied over rates from 20 to 500 ml/min in different runs. In only one of these was there a correlation between spike size and flow rate. For this animal, the one shown in Fig. 10, the suppression at the highest flow rate of the blank was still less than that produced by the weakest isoamyl acetate stimulus. We studied a single rat in which a strong odor stimulus produced a large EOG (18 mV) and 90% suppression of the spike. In this case, we compared clean air flow rates of 10, 200, and 500 ml/min with interleafed trials in single runs. There was no detectable spike suppression or change in latency for these records (data not shown). Therefore we could not detect any contribution of the mechanical effect of air flow on antidromic spikes in these experiments, even where there were small deflections in the EOG record.
Summary
Overall, these data show that population antidromic spikes evoked in the dorsal olfactory epithelium by stimulation of the nerve layer of the olfactory bulb can be affected by odor stimulation. Odor stimulation shifts the latency of the antidromic spike with a single peak. The size and latency of that peak is monotonically reduced as the size of the EOG increases. Although high-frequency electrical stimulation can reduce the size of the antidromic peak, the reduction during odor stimuli is much greater than would be expected from the corresponding latency. The increased latency and decreased size of the antidromic peak are maintained throughout the odor stimulus, even for very long stimuli.
DISCUSSION
Nature of the responses
Several observations argue that the spikes observed after stimulation of the olfactory bulb nerve are antidromic spikes in olfactory OSNs. The spikes change size and polarity as the electrode is advanced through the epithelium, and the inversion in polarity roughly coincides with the inversion of polarity of the EOG (Ezeh et al. 1995). We showed here that spikes in the dorsal epithelium cannot be activated by stimulation in the lateral bulb and vice versa. The latency of the spike is dependent on the distance from the stimulation site, and the simultaneous recording of two spikes at different latencies shows that they are not artifacts volume conducted from the olfactory bulb. The conduction velocity is consistent with other estimates of conduction velocity in the olfactory nerve (Phillips and Griff 2002). In our case, the estimates of conduction velocity rest on the assumption that all the axons have the same range of conduction velocity, because we recorded from different receptors at each position. The conduction velocity changes with repeated stimulation as is common with short interstimulus intervals and those changes are proportional to the length of axon as has been observed in other axons (Kocsis et al. 1979). The responses show a period of super-normality as was previously reported for olfactory nerve (Bliss and Rosenberg 1979; Waldow et al. 1981).
We cannot state for sure whether the decrease in spike size is produced by axonal collision or by depolarization block in OSNs. Perhaps both contribute. Although a strongly depolarized soma would likely have a smaller antidromic spike, the significant spike suppression seen with weak stimuli favors the collision hypothesis. The spike size decrease is not produced by axonal fatigue because the size of the spike declines more during the odor stimulus than would be expected from the change in latency. The spike size and latency remain altered throughout the time course of the EOG. Depolarization block in OSN somata could be advanced as a cause of the decreased spike size, but it could not explain the latency changes. If depolarization block were preventing orthodromic action potentials in olfactory axons, the antidromic latency would recover quickly. Comparison of the short and long duration odor stimuli shows that the latency does not recover during long stimuli, implying continued orthodromic axonal spikes.
The spike suppression is delayed from the EOG record. Comparison with intracellular records from intact epithelium (Trotier and MacLeod 1983) for from isolated cells (Firestein et al. 1990; Reisert and Matthews 1999; Tomaru and Kurahashi 2005) show similar delays. Additional delay results from the time required to reach sufficient density of firing to block antidromic spikes or to reach a potential sufficient to block antidromic invasion. Although we made some attempt to quantitatively relate the time course of the EOG and spike suppression curves, there has been too much variation in EOG waveform for this to be successful in all experiments. Nevertheless, data like that of Fig. 10 were commonly fit by two decay constants. One probably represents the delay between the receptor cell voltage and spiking, whereas the second might represent the slow recovery of axons seen in Fig. 9. Further experiments and analysis would be necessary to determine whether this would always apply if a strong criterion were developed to assure equivalence of the EOG records. The spike suppression and latency effects differ in time course from the EOG. This may not be of consequence in recordings of short-duration stimuli, but with longer durations the EOG often shows a prominent transient and later sustained voltage. Similar records were reported in whole cell patch recording from amphibian olfactory sensory neurons (Firestein et al. 1990; Kurahashi and Shibuya 1990; Reisert and Matthews 1999). That transient is not usually present in the antidromic spike records (see Figs. 7 and 9). Any experiment that attempts to quantify the input to the bulb with stimuli of different durations may need to consider this issue.
What this tells us about population measurements of OSNs
The strong correlation between the odorant suppression of antidromic spiking suppression and the EOG recordings provides strong support for interpretation of the EOG as a generator potential. The data also support a strong monotonic relationship between the EOG and a measure of spiking activity in olfactory nerve axons. The relationship between EOG and spike suppression does not look perfectly linear in Figs. 11 and 12, in part because the spike size cannot go below zero. The relation between EOG and antidromic spike latency may be more linear, although it is hard to measure the latency with strong stimuli where the spikes become very small.
There are situations for which the measurement of antidromic spike suppression could be very useful for distinguishing true receptor activity from spurious signals. For example, in our recent study of the response to flow rate in the intact epithelium (Scott et al. 2006) we found significant volume conduction effects in some EOG recordings because of the complex geometry of the rat nose. We were able to dissect these effects to some degree by depressing the response in part of the epithelium. It would have been much more satisfactory to be able to study responses that were clearly generated locally. The present results show that population spikes can be resolved even if the electrodes are quite close. This should help resolve such volume conduction issues in the future. Conversely we were not able to establish effects on antidromic spikes resulting from mechanical stimuli produced by high air flow rates in the nose. This is consistent with calculations that the mechanical effects of high air flow should not be great enough in this part of the nasal cavity to activate OSNs (Jiang and Zhao 2008).
There are several situations where it is not possible or convenient to use live, anesthetized animals. The EOG will persist for several hours after death if the tissue is properly humidified (Scott and Brierley 1999). The EOG has been a useful rapid assay for knockouts (Belluscio et al. 1998; Brunet et al. 1996; Buiakova et al. 1996; Nickell et al. 2007), as well as viral insertion of receptor genes into the epithelium (Zhao et al. 1998). We found it possible to record EOGs in the lateral spaces of the rat epithelium after rapid death, whereas it has been very difficult to get reliable recordings there in anesthetized animals because the spaces fill with fluid. These results provide strong support that the EOG is a meaningful estimate OSN response and should continue to be a useful tool.
Functional considerations
There are three observations of significance beyond the evaluation of the EOG as a measurement of epithelial response. These are evidence of sustained response in the olfactory nerve, synchronization of action potentials in the olfactory nerve, and the recruitment of a large proportion of axons by strong stimuli.
Because of the difficulties of recording from mammalian olfactory nerve, there is no evidence in the literature about the time course of action potentials entering the olfactory bulb during an odor stimulus. Dramatic changes in intracellular spike size during strong odor responses were observed by Trotier and MacLeod (1983) in recordings from salamander. These have been observed intracellularly in several species (Firestein and Werblin 1987; Reisert and Matthews 2001a,b; Tomaru and Kurahashi 2005). Extracellular recordings in mice and rats (Duchamp-Viret et al. 2000; Sicard 1986) have also shown signs of this effect. Trotier and MacLeod (1983) observed that very small spikes continued throughout these responses and concluded that only soma spikes were blocked, leaving spike activity in the axons. This conclusion was consistent with their observation of inflections in the spike that they interpreted as separate spike components in the soma and axonal trigger zone. This interpretation is consistent with our observation that antidromic latencies in OSN axons continue to be longer throughout an odor stimulus. If OSNs do continue to conduct axon potentials throughout the period of depolarization, they would conduct a rather different signal than if they responded only during the initial period as suggested by the extracellular recordings of Duchamp-Viret et al. (2000). A sustained response by OSNs is consistent with our recordings from olfactory bulb superficial layers, which showed sustained activity with long odor pulse trains (Scott et al. 2007). It is clear that there are sustained spike trains in the nerves of several nonmammalian species. For example, Kurtz and Mozell (1985) used the frog olfactory nerve to measure response while manipulating the numbers of molecules in a stimulus by varying concentration, volume, and time. This measurement depended on observing the integral of responses in the nerve. The current evidence suggests that the duration as well as the magnitude of a sniff will be important in determining the input in to the olfactory bulb.
The observation of synchronization of olfactory nerve axons is also new. There have been models and speculations about ephaptic interactions in the past (Bokil et al. 2001), but we know of no direct tests of the idea. Our data indicate that, even at rather low stimulus intensity, there is some interaction between axons leading to a general slowing of conduction. Because this occurs with a single peak, it seems that many axons are influenced. It is possible that this influence serves to synchronize input into the bulb. If the stimuli are sufficiently strong, activity may spread from the axons of activated OSNs to neighboring axons. In addition, these effects decay slowly, presumably reflecting the duration of the relative refractory period in the axons.
Finally, the data show significant nonspecificity in the response. With strong odor stimuli it was common to see the antidromic spike decrease to <10% of control. This might occur for several reasons, among them very nonspecific responses of OSNs to strong stimuli or ephaptic cross-talk among their axons. In either case, this likely represents activation of the large majority of the axons entering the bulb from a local region of the olfactory epithelium. These large suppressions were seen with two odorants: isoamyl acetate and methyl benzoate. These odorants have evoke different (although overlapping) patterns of activation on the olfactory bulb surface (Johnson et al. 1998, 2005). These patterns imply that the odorants activate somewhat different populations of OSNs. Even at lower stimulus intensities the nonspecificity of OSNs and/or axonal cross-talk probably contributes to a certain degree of spread in those activation patterns.
GRANTS
This work was supported by National Institute of Deafness and Other Communication Disorders Grants DC-008648 and DC-00113 to J. W. Scott.
The costs of publication of this article were defrayed in part by the payment of page charges. The article must therefore be hereby marked “advertisement” in accordance with 18 U.S.C. Section 1734 solely to indicate this fact.
REFERENCES
- Astic et al. 1987.Astic L, Saucier D, Holley A. Topographical relationships between olfactory receptor cells and glomerular foci in the rat olfactory bulb. Brain Res 424: 144–152, 1987. [DOI] [PubMed] [Google Scholar]
- Belluscio et al. 1998.Belluscio L, Gold GH, Nemes A, Axel R. Mice deficient in G(olf) are anosmic. Neuron 20: 69–81, 1998. [DOI] [PubMed] [Google Scholar]
- Bliss and Rosenberg 1979.Bliss TV, Rosenberg ME. Activity-dependent changes in conduction velocity in the olfactory nerve of the tortoise. Pfluegers 381: 209–216, 1979. [DOI] [PubMed] [Google Scholar]
- Bokil et al. 2001.Bokil H, Laaris N, Blinder K, Ennis M, Keller A. Ephaptic interactions in the mammalian olfactory system. J Neurosci 21: RC173, 2001. [DOI] [PMC free article] [PubMed] [Google Scholar]
- Brunet et al. 1996.Brunet LJ, Gold GH, Ngai J. General anosmia caused by a targeted disruption of the mouse olfactory cyclic nucleotide-gated cation channel. Neuron 17: 681–693, 1996. [DOI] [PubMed] [Google Scholar]
- Buiakova et al. 1996.Buiakova OI, Baker H, Scott JW, Farbman A, Kream R, Grillo M, Franzen L, Richman M, Davis LM, Abbondanzo S, Stewart CL, Margolis FL. Olfactory marker protein (OMP) gene deletion causes altered physiological activity of olfactory sensory neurons. Proc Natl Acad Sci USA 93: 9858–9863, 1996. [DOI] [PMC free article] [PubMed] [Google Scholar]
- Caprio 1978.Caprio J Olfaction and taste in channel catfish-electrophysiological study of responses to amino-acids and derivatives. J Comp Physiol 123: 357–371, 1978. [Google Scholar]
- Duchamp-Viret et al. 2000.Duchamp-Viret P, Duchamp A, Chaput MA. Peripheral odor coding in the rat and frog: quality and intensity specification. J Neurosci 20: 2383–2390, 2000. [DOI] [PMC free article] [PubMed] [Google Scholar]
- Ezeh et al. 1995.Ezeh PI, Davis LM, Scott JW. Regional distribution of rat electroolfactogram. J Neurophysiol 73: 2207–2220, 1995. [DOI] [PubMed] [Google Scholar]
- Firestein et al. 1990.Firestein S, Shepherd GM, Werblin FS. Time course of the membrane current underlying sensory transduction in salamander olfactory receptor neurones. J Physiol 430: 135–158, 1990. [DOI] [PMC free article] [PubMed] [Google Scholar]
- Firestein and Werblin 1987.Firestein S, Werblin FS. Gated currents in isolated olfactory receptor neurons of the larval tiger salamander. Proc Natl Acad Sci USA 84: 6292–6296, 1987. [DOI] [PMC free article] [PubMed] [Google Scholar]
- Grosmaitre et al. 2007.Grosmaitre X, Santarelli LC, Tan J, Luo M, Ma M. Dual functions of mammalian olfactory sensory neurons as odor detectors and mechanical sensors. Nat Neurosci 10: 348–354, 2007. [DOI] [PMC free article] [PubMed] [Google Scholar]
- Jiang and Zhao 2008.Jiang J, Zhao K. Quantifying mechanical stimuli in rat and human nose models during breathing. International Symposium on Olfaction and Taste, San Franscisco, CA, 2008.
- Johnson et al. 2005.Johnson BA, Farahbod H, Leon M. Interactions between odorant functional group and hydrocarbon structure influence activity in glomerular response modules in the rat olfactory bulb. J Comp Neurol 483: 205–216, 2005. [DOI] [PMC free article] [PubMed] [Google Scholar]
- Johnson et al. 1998.Johnson BA, Woo CC, Leon M. Spatial coding of odorant features in the glomerular layer of the rat olfactory bulb. J Comp Neurol 393: 457–471, 1998. [DOI] [PubMed] [Google Scholar]
- Knecht and Hummel 2004.Knecht M, Hummel T. Recording of the human electro-olfactogram. Physiol Behav 83: 13–19, 2004. [DOI] [PubMed] [Google Scholar]
- Kocsis et al. 1979.Kocsis JD, Swadlow HA, Waxman SG, Brill MH. Variation in conduction velocity during the relative refractory and supernormal periods: a mechanism for impulse entrainment in central axons. Exp Neurol 65: 230–236, 1979. [DOI] [PubMed] [Google Scholar]
- Kurahashi and Shibuya 1990.Kurahashi T, Shibuya T. Ca2(+)-dependent adaptive properties in the solitary olfactory receptor cell of the newt. Brain Res 515: 261–268, 1990. [DOI] [PubMed] [Google Scholar]
- Kurtz and Mozell 1985.Kurtz DB, Mozell MM. Olfactory stimulation variables. Which model best predicts the olfactory nerve response? J Gen Physiol 86: 329–352, 1985. [DOI] [PMC free article] [PubMed] [Google Scholar]
- Miyamichi et al. 2005.Miyamichi K, Serizawa S, Kimura HM, Sakano H. Continuous and overlapping expression domains of odorant receptor genes in the olfactory epithelium determine the dorsal/ventral positioning of glomeruli in the olfactory bulb. J Neurosci 25: 3586–3592, 2005. [DOI] [PMC free article] [PubMed] [Google Scholar]
- Mozell 1962.Mozell MM Olfactory mucosal and neural responses in the frog. Am J Physiol 203: 353–358, 1962. [DOI] [PubMed] [Google Scholar]
- Munger et al. 2001.Munger SD, Lane AP, Zhong H, Leinders-Zufall T, Yau KW, Zufall F, Reed RR. Central role of the CNGA4 channel subunit in Ca2+-calmodulin-dependent odor adaptation. Science 294: 2172–2175, 2001. [DOI] [PMC free article] [PubMed] [Google Scholar]
- Nguyen et al. 2007.Nguyen MQ, Zhou Z, Marks CA, Ryba NJ, Belluscio L. Prominent roles for odorant receptor coding sequences in allelic exclusion. Cell 131: 1009–1017, 2007. [DOI] [PMC free article] [PubMed] [Google Scholar]
- Nickell et al. 2006.Nickell WT, Kleene NK, Gesteland RC, Kleene SJ. Neuronal chloride accumulation in olfactory epithelium of mice lacking NKCCl. J Neurophysiol 95: 2003–2006, 2006. [DOI] [PMC free article] [PubMed] [Google Scholar]
- Nickell et al. 2007.Nickell WT, Kleene NK, Kleene SJ. Mechanisms of neuronal chloride accumulation in intact mouse olfactory epithelium. J Physiol 583: 1005–1020, 2007. [DOI] [PMC free article] [PubMed] [Google Scholar]
- Ottoson 1956.Ottoson D Analysis of the electrical activity of the olfactory epithelium. Acta Physiol Scand 35: 7–83, 1956. [PubMed] [Google Scholar]
- Phillips and Griff 2002.Phillips S, Griff ER. Impulse conduction of olfactory receptor neuron axons. Microsc Res Tech 58: 161–167, 2002. [DOI] [PubMed] [Google Scholar]
- Reisert and Matthews 1999.Reisert J, Matthews HR. Adaptation of the odour-induced response in frog olfactory receptor cells. J Physiol 519: 801–813, 1999. [DOI] [PMC free article] [PubMed] [Google Scholar]
- Reisert and Matthews 2001a.Reisert J, Matthews HR. Response properties of isolated mouse olfactory receptor cells. J Physiol 530: 113–122, 2001a. [DOI] [PMC free article] [PubMed] [Google Scholar]
- Reisert and Matthews 2001b.Reisert J, Matthews HR. Responses to prolonged odour stimulation in frog olfactory receptor cells. J Physiol 534: 179–191, 2001b. [DOI] [PMC free article] [PubMed] [Google Scholar]
- Ressler et al. 1994.Ressler KJ, Sullivan SL, Buck LB. Information coding in the olfactory system: evidence for a stereotyped and highly organized epitope map in the olfactory bulb. Cell 79: 1245–1255, 1994. [DOI] [PubMed] [Google Scholar]
- Rospars et al. 2000.Rospars JP, Lansky P, Duchamp-Viret P, Duchamp A. Spiking frequency versus odorant concentration in olfactory receptor neurons. Biosystems 58: 133–141, 2000. [DOI] [PubMed] [Google Scholar]
- Schoenfeld et al. 1994.Schoenfeld TA, Clancy AN, Forbes WB, Macrides F. The spatial organization of the peripheral olfactory system of the hamster. Part I. Receptor neuron projections to the main olfactory bulb. Brain Res Bull 34: 183–210, 1994. [DOI] [PubMed] [Google Scholar]
- Scott et al. 2006.Scott JW, Acevedo HP, Sherrill L. Effects of concentration and sniff flow rate on the rat electroolfactogram. Chem Senses 31: 581–593, 2006. [DOI] [PMC free article] [PubMed] [Google Scholar]
- Scott et al. 2007.Scott JW, Acevedo HP, Sherrill L, Phan M. Responses of the rat olfactory epithelium to retronasal air flow. J Neurophysiol 97: 1941–1950, 2007. [DOI] [PMC free article] [PubMed] [Google Scholar]
- Scott and Brierley 1999.Scott JW, Brierley T. A functional map in rat olfactory epithelium. Chem Senses 24: 679–690, 1999. [DOI] [PubMed] [Google Scholar]
- Scott and Scott-Johnson 2002.Scott JW, Scott-Johnson PE. The electroolfactogram: a review of its history and uses. Microsc Res Tech 58: 152–160, 2002. [DOI] [PubMed] [Google Scholar]
- Sicard 1986.Sicard G Electrophysiological recordings from olfactory receptor cells in adult mice. Brain Res 397: 405–408, 1986. [DOI] [PubMed] [Google Scholar]
- Tomaru and Kurahashi 2005.Tomaru A, Kurahashi T. Mechanisms determining the dynamic range of the bullfrog olfactory receptor cell. J Neurophysiol 93: 1880–1888, 2005. [DOI] [PubMed] [Google Scholar]
- Trotier and MacLeod 1983.Trotier D, MacLeod P. Intracellular recordings from salamander olfactory receptor cells. Brain Res 268: 225–237, 1983. [DOI] [PubMed] [Google Scholar]
- Vassar et al. 1994.Vassar R, Chao SK, Sitcheran R, Nunez JM, Vosshall LB, Axel R. Topographic organization of sensory projections to the olfactory bulb. Cell 79: 981–991, 1994. [DOI] [PubMed] [Google Scholar]
- Verhagen et al. 2007.Verhagen JV, Wesson DW, Netoff TI, White JA, Wachowiak M. Sniffing controls an adaptive filter of sensory input to the olfactory bulb. Nat Neurosci 10: 631–639, 2007. [DOI] [PubMed] [Google Scholar]
- Waldow et al. 1981.Waldow U, Nowycky MC, Shepherd GM. Evoked potential and single unit responses to olfactory nerve volleys in the isolated turtle olfactory bulb. Brain Res 211: 267–283, 1981. [DOI] [PubMed] [Google Scholar]
- Zhao et al. 1998.Zhao H, Ivic L, Otaki JM, Hashimoto M, Mikoshiba K, Firestein S. Functional expression of a mammalian odorant receptor. Science 279: 237–242, 1998. [DOI] [PubMed] [Google Scholar]


