

Abstract
High-throughput data collection using gene microarrays has great potential as a method for addressing the pharmacogenomics of complex biological systems. Similarly, mechanism-based pharmacokinetic/pharmacodynamic modeling provides a tool for formulating quantitative testable hypotheses concerning the responses of complex biological systems. As the response of such systems to drugs generally entails cascades of molecular events in time, a time series design provides the best approach to capturing the full scope of drug effects. A major problem in using microarrays for high-throughput data collection is sorting through the massive amount of data in order to identify probe sets and genes of interest. Due to its inherent redundancy, a rich time series containing many time points and multiple samples per time point allows for the use of less stringent criteria of expression, expression change and data quality for initial filtering of unwanted probe sets. The remaining probe sets can then become the focus of more intense scrutiny by other methods, including temporal clustering, functional clustering and pharmacokinetic/pharmacodynamic modeling, which provide additional ways of identifying the probes and genes of pharmacological interest.
Keywords: corticosteroids, data mining, expression profiling, gene chips, methylprednisolone, microarrays, modeling, pharmacodynamics, skeletal muscle, time series
Introduction
Synthetic glucocorticoids, corticosteroids, are widely used to suppress inflammatory and immune responses. However, this class of drugs has a low therapeutic index due to a multiplicity of adverse effects on many tissues, including skeletal muscle [1-9]. The adverse effects on skeletal muscle derive from the role of this tissue in glucose homeostasis. One aspect of the broad systemic function of glucocorticoids is to increase gluconeogenesis in the liver and kidney [4,5,10,11]. A primary substrate for gluconeogenesis is amino acid carbon derived from the net degradation of muscle protein. Glucocorticoids also cause muscle to become insulin resistant, thereby preventing the large bulk of the musculature from taking up the glucose produced by the liver and kidney [4,5,12]. When corticosteroids are used therapeutically, their effects on the musculature are accentuated, which results in muscle wasting and insulin-resistant diabetes.
Corticosteroids produce their effects on skeletal muscle by altering the transcription of specific genes. These transcriptional effects take two fundamental forms, a direct and indirect method. Many regulated genes contain glucocorticoid responsive elements (GREs) in their regulatory sequences and their transcription is influenced directly [2,3,10,13-17]. However, there are a large number of genes whose transcription is altered indirectly by glucocorticoids. In these cases, glucocorticoids alter the expression or function of other transcription factors, which in turn alter the transcription of other genes [13,18-22]. Although still not entirely understood, the phenomena of muscle wasting and insulin resistance clearly involve temporal cascades of changes in the expression of a multiplicity of genes [2-5,19,23-26]. Many genes involved in the phenomena of muscle wasting and insulin resistance have been identified in a piecemeal fashion using diverse in vitro and in vivo experimental systems. However, understanding such phenomena requires that the temporal cascade of gene expression events be viewed as a whole.
Previously we have used pharmacokinetic/pharmacodynamic (PK/PD) modeling in studies to describe the relationship between bolus dosing with methylprednisolone (MPL) and the change in the expression of a few genes in liver and skeletal muscle [3,10,15-17]. For those experiments, a single bolus dose of MPL was given intravenously to groups of adrenalectomized animals. Animals were sacrificed at 16 time points over a 72-h period. The PK/PD models describe the deviations from and return to baseline (defined by vehicle-treated controls) of gene expression responses. The livers and muscles used for both of these studies were derived from the same animals. Data were analyzed as if samples were taken from a single animal. The data for the change in the expression of mRNA for the PK/PD models was generated using quantitative northern hybridization. Although, more recently, we have converted such measurements to quantitative real-time reverse transcriptase polymerase chain reaction (RT-PCR), even this method does not allow the scope of data collection necessary for developing models for the type of polygenic phenomena initiated by corticosteroids. We previously described the availability of data sets developed by using the Affymetrix GeneChips® Rat Genome (R_U34A) (Affymetrix, Inc., Santa Clara, CA, USA) microarray chip available online, which allows for single gene queries [27]. Those data sets were developed using the same rich time series employed in our earlier studies. The intent was to use gene arrays as a method of high-throughput data collection in order to obtain the scope of data necessary for applying PK/PD modeling to describe broad polygenic phenomena, such as insulin resistance caused by corticosteroids.
Mining such data sets presents uniquely different problems from those encountered when microarrays are used to distinguish one group from another (e.g., cancerous versus non-cancerous tissues). For those applications, one attempts to define a pattern or fingerprint that distinguishes, with very high probability, one group from another [28-33]. In many cases it is the pattern of gene expression rather than the relationship between the genes that is the important focus. In the present application of microarrays, the difficulty lies with sorting through the vast amount of data to identify probe sets with temporal patterns of change in expression, which indicate that the gene is regulated in response to the drug. In this case, the causal relationship between the genes whose expression is changing in response to the drug is of paramount importance. For example, the drug may change the expression of a particular transcription factor, which in turn alters the expression of downstream genes. For this reason the most important aspect of the mining approach is to avoid discarding valuable data. This is of particular importance because each differentially expressed gene becomes the subject of extensive literature searches in order that it can be placed into a temporal context of all other transcriptionally altered genes. The purpose of the endeavor is to use PK/PD modeling to develop a ‘motion picture’ of the polygenic response to the drug.
In the present report we describe a filtering approach to mining the skeletal muscle data set, which is designed to eliminate probe sets that do not meet criteria expected of transcriptionally altered genes. These criteria are based on our extensive prior knowledge of data for individual genes and their use in PK/PD modeling. This report, therefore, details the small percentage of probe sets in the skeletal muscle data set that meet a specific criteria for further and more intense scrutiny. That same skeletal muscle data set was initially described and its online availability has been detailed in a previous report [27].
Methods and results
Experimental design
Muscle samples (gastrocnemius) were obtained from a previously performed animal study in our laboratory [2,3,10]. Male adrenalectomized (ADX) Wistar rats (Rattus rattus) weighing 225–250 g were obtained from Harlan Sprague-Dawley (Indianapolis, IN, USA). Animals were allowed free access to rat chow (Agway, RMH 1000) and 0.9% NaCl drinking water. They were housed in a room with a 12 h light/12 h dark cycle, a constant temperature of 22°C, and were allowed to acclimatize to this environment for at least 1 week. All rats were subjected to right external jugular vein cannulation under light ether anesthesia 1 day prior to the study. Cannula patency was maintained with sterile 0.9% NaCl solution. Four animals were designated as controls (i.e., zero time samples) and received vehicle only. All remaining animals received a single 50 mg/kg dose of MPL sodium succinate (Pharmacia-Upjohn Company, Kalamazoo, MI, USA) via the cannula over 30 s. Rats (3) were sacrificed by exsanguinations under anesthesia at 0.25, 0.5, 0.75, 1, 2, 4, 5, 5.5, 6, 7, 8, 12, 18, 30, 48 and 72 h after dosing. The sampling time points were selected based on previous studies describing glucocorticoid response dynamics and enzyme induction in skeletal muscle and liver. Four cannulated vehicle-treated rats were sacrificed as controls. Gastrocnemius muscles were rapidly excised, flash frozen in liquid nitrogen, and stored at -80°C. Frozen muscle tissues were ground into powder using a liquid-nitrogen-chilled mortar and pestle.
Microarrays
Muscle powder (100 mg) from each individual animal was added to 1 ml of prechilled Trizol® reagent (Invitrogen, Carlsbad, CA, USA) and total RNA extractions were carried out according to the manufacturer's directions. Extracted RNAs were further purified by passage through RNAeasy™ mini-columns (QIAGEN, Valencia, CA, USA) according to the manufacturer's protocols for RNA clean up. Final RNA preparations were resuspended in RNase-free water and stored at -80°C. The RNAs were quantified spectrophotometrically, and purity and integrity were assessed by agarose gel electrophoresis.
Isolated RNA from each individual muscle was used to prepare the target according to the manufacturer's protocols. The biotinylated cRNAs were hybridized to 51 individual R_U34A, which contained 8799 probe sets (in one case, at 30 h, only two samples were available). The Affymetrix arrays used have the advantage of having multiple measurements per gene (≥ 11 probe pairs per transcript). However, this same redundancy leads to many different interpretations of probe sets to determine a signal for each gene (probe set algorithms), and controversy regarding the sensitivity and specificity of resulting signals, as well as appropriate normalization methods [34]. We have used the Affymetrix Microarray Suite (MAS) 5.0® (Affymetrix, Inc., Santa Clara, CA, USA) algorithm, and this places a relatively high penalty for mismatch hybridization, favoring specificity over sensitivity [35]. This entire data set has been submitted to the National Center for Biotechnology Information (NCBI) Gene Expression Omnibus database (GSE490) and is also available online [27,101].
Data analysis
The approach to data mining was developed based on our use of gene arrays as a technique for high-throughput data collection within the context of a rigidly controlled time series paradigm. The Affymetrix oligonucleotide microarrays use sequence information and photolithography-directed combinatorial chemical synthesis to develop probe sets for the genes of interest. Each probe set consisted of a series of short oligonucleotide sequences and an identical partner sequence, except for a single base mismatch in the center. The mismatch sequence provided a unique background for each sequence in the series. MAS 5.0 was used for initial data acquisition and basic analysis. In this first step, a ‘call’ of present (P), absent (A) or marginal (M) was determined for each probe set on each chip based on the comparison of the matched and mismatched pairs for the gene sequence. The results were normalized for each chip using a distribution of all genes around the 50th percentile. The results from the first step were entered into the program GeneSpring 6.1® (Silicon Genetics, Redwood City, CA, USA). This robust software provides a number of tools for visualization and analysis of time series data. One such tool for both hierarchical clustering and visualization is the gene tree approach described by Eisen [36] as modified by the Gene-Spring software. This algorithm can be used to construct a dendrogram of genes with similar patterns. A negative aspect of this tool, and most time series data-mining tools, is the assumption that the points in the time series are equally spaced. However, to design our 72 h time series in this manner would have ignored the richness of biological information during the early period following dosing of the drug. Notwithstanding this drawback, gene trees provide an excellent method of visualizing the progression of the data analysis. In order for this and other tools to be used it was also necessary to transform the data so that the values for all probe sets were within the same range. To accomplish this, values for each individual probe set on each chip were expressed as a ratio of the mean of the four control values for that gene, which we refer to as ‘normalized intensity’. Thus, the average of each probe set has a value of 1 at zero time and either increases, decreases or remains unchanged relative to controls over the time series.
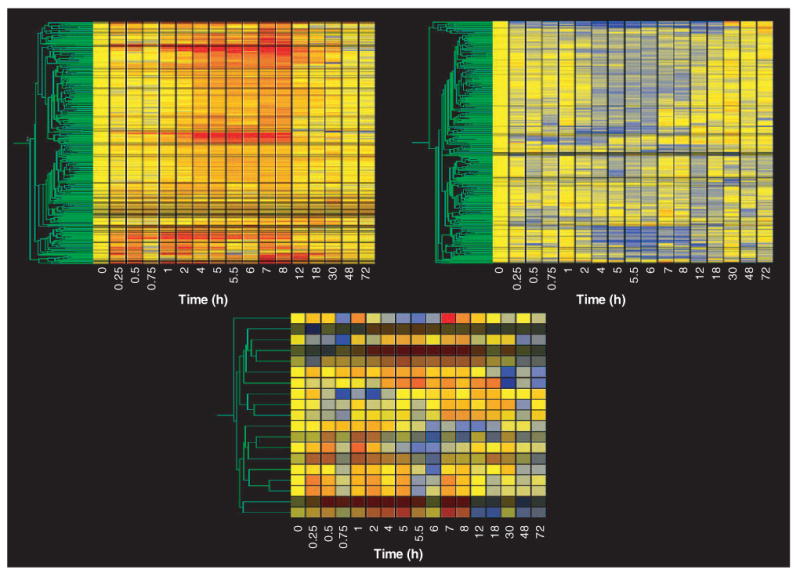
Figure 1 (top left) shows the gene tree derived from the Genespring program for the entire data set (8799 probe sets at 17 time points). This tree was constructed with the program's default method, which uses Pearson correlation around zero. The x-axis presents the 17 time points studied in rank order from left to right. Vehicle controls are nominally referred to as time zero. As pointed out above, each time point is equally spaced and, therefore, does not represent the true temporal relationship between points. The y-axis presents the mean of the normalized value at each time point for each of the individual probe sets, represented by color and clustered by similarity. In this view, the color yellow represents a value of ‘1’, progression toward red represents values that exceed ‘1’, and progression toward blue represents values that decline toward 0. The intensity of the color reflects the intensity of the original signal. To the immediate left of the gene tree is a schematic tree of the relationship of all probe sets to each other based on expression pattern similarity (represented in green). On the left side of the gene tree, but spatially separated, is what is referred to as a ‘marquee view’ in the GeneSpring software. This marquee view can be used to navigate the view of the main gene tree. Although the gene tree representation of the entire data set is of limited value for examining individual gene patterns of regulation, it does illustrate two points. First, within the entire data set there are a vast number of genes represented by black (no expression in skeletal muscle regardless of treatment) or by the color yellow across the entire time frame studied. This latter group of genes exhibits no temporal regulation by the drug (i.e., their expression does not deviate from control value following drug dosing) and represents the probe sets that we wish to filter from the data set. This gene tree does reflect segregation of similarly regulated genes and demonstrates that similar patterns of regulation do exist. For example, groups of intense red or blue represent clusters of genes with similar up- or downregulation, respectively. Figure 1 (top right) provides a magnified view of one such clustering of upregulated probe sets. The location of this group of probe sets on the entire gene tree is indicated by the white bracket. Figure 1 (bottom) shows an even closer zoom in on five probe sets in this grouping with similar patterns. In this case, two probe sets for the gene regenerating liver inhibitory factor-1 (RL/IF-1) (X63594) segregate next to each other, which demonstrates the optimal function of gene tree clustering. The location of these probe sets in the top right panel is indicated by the white rectangle.
Figure 1. Gene tree representation of an entire data set of mRNA expression in skeletal muscle as a function of time following methylprednisolone treatment.
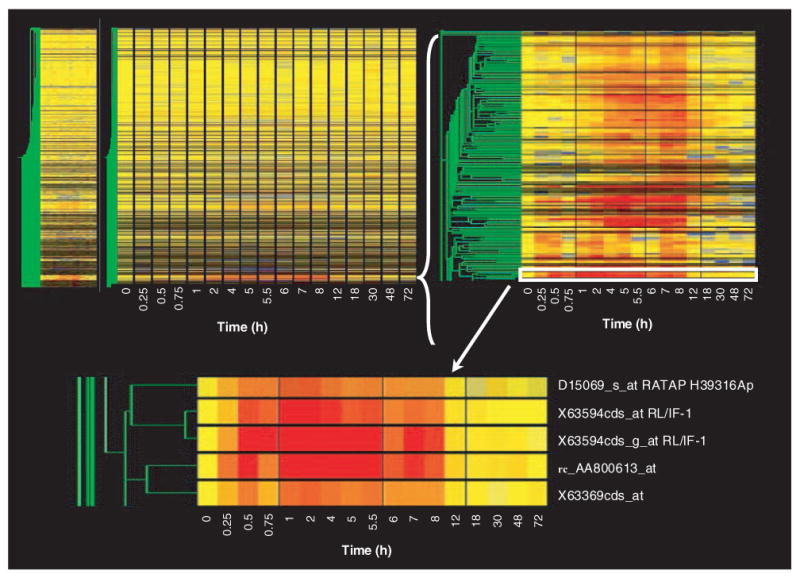
The gene tree represents the averaged normalized values of each of 8799 probe sets at 17 different time points following methylprednisolone treatment, grouped by pattern similarities. The y-axis represents individual probe sets, with color representing relative intensities (yellow represents no change from control, progression toward red indicates increased expression, and progression toward blue represents decreased expression versus control values). The x-axis ranks the samples in sequence of time following methylprednisolone treatment. The top left panel represents the entire data set, while the top right and bottom panels present successively magnified views of the areas highlighted.
A series of ‘filtering’ steps were applied to the data in an attempt to identify genes and eliminate probe sets that either are not expressed in skeletal muscle or are not responsive to MPL treatment. The first level of filtering was designed to eliminate probe sets not expressed in skeletal muscle regardless of drug treatment (represented by a very low intensity on the gene tree), and utilized the Affymetrix ‘call’ feature. For this step we explored two different levels of stringency. The first approach that we employed required the probe set for the gene to have a call of P on at least 25 of the 51 chips. This filter reduced the number of remaining probe sets from the original 8799 to 3785. We compared this result with a less stringent filter that only required a call of P on 4 of the 51 chips. This filter reduced the number of remaining probe sets from the original 8799 to 4636. This endeavor identified two types of probe sets that would be lost by greater stringency at this step. The first was a group of probe sets that started below the sensitivity of the chip (background) then appeared on a contiguous sets of chips in which the call was P that then returned to a series of A chip calls. The second was a group of probe sets that initially had calls of P but, following dosing, dropped to A for a period of time before returning to a call of P. We chose not to exclude these probe sets with this initial filter because it appeared that the drug treatment was influencing the quality call of the probe set by the software, thus suggesting possible regulation. A final observation concerning the background is that there is considerable variation in the probe set backgrounds on the R_U34A chip. Some probe sets can obtain a call of P with a signal as low as 10 units while others require a signal > 350 units. As our major concern was to prevent discarding valuable data, we chose the less stringent 4P filter for this initial filtering step. Figure 2 provides a gene tree of the 4636 probe sets not eliminated by this filter. Thus, requiring that a signal be present on only four chips eliminated > 4000 probe sets.
Figure 2. Gene tree of the 4636 probe sets remaining after filtering to remove probe sets not expressed in skeletal muscle regardless of drug treatment.
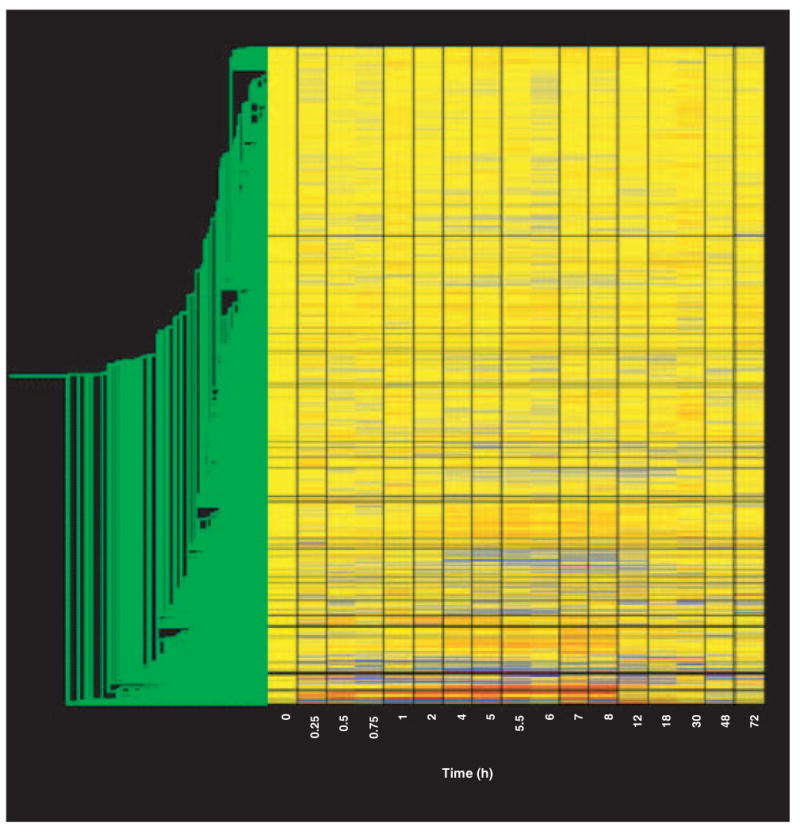
Gene tree of probe sets remaining after filtering as described in the text. The gene tree is as described in Figure 1.
The second level of filtering was designed to eliminate probe sets that could not meet the basic criteria of a regulated probe. Specifically, this filter was designed to eliminate probe sets whose average did not deviate from baseline by a certain value for a reasonable number of time points. After exploring a variety of filtering values and number of conditions using gene trees in the manner described in the previous paragraph, we developed two filters that were designed to eliminate probe sets that were neither down- nor upregulated. The first filter eliminated probe sets that could not meet a minimal criteria for down-regulation. Starting with the 4P filtered list we eliminated all probe sets that did not have average values < 0.65 in at least four conditions (time points). Figure 3 (top left) shows a gene tree of the 354 probe sets that were not eliminated by this filter. Most of these probe sets clearly contain a sustained run of time points represented by the color blue, as expected of downregulated probe sets. The next filter was designed to eliminate probe sets that could not meet a minimal criterion for upregulation. Starting with the 4P filtered list, we eliminated all probe sets that did not have average values > 1.5 in at least four conditions (time points). Figure 3 (top right) shows a gene tree of the 349 probe sets that were not eliminated by this filter. Most of these probe sets clearly contain a sustained run of red time points as expected of upregulated probe sets. There were a small number of probe sets that were not eliminated by either filter indicating both up- and downregulation. These probe sets (which were present on both lists) suggest biphasic regulation, a phenomenon we have previously described [13]. Figure 3 (bottom) shows a gene tree of the 690 probe sets that were not eliminated by any of the filters applied. Thus, using four straightforward filters, we were able to eliminate all but 8% of the probe sets present in the original data set.
Figure 3. Gene tree of probe sets remaining following filtering for non-drug-regulated probe sets.
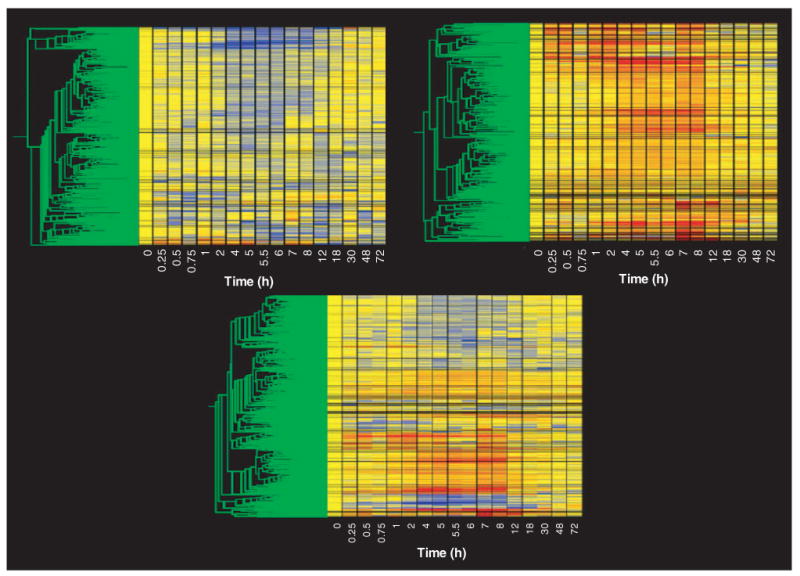
The top left panel presents the 354 probe sets remaining after filtering out probe sets not exhibiting repressed expression, as described in the text. The top right panel presents the 349 probe sets remaining after filtering out probe sets not exhibiting enhanced expression, as described in the text. The bottom panel presents all probe sets not eliminated by either filtering step recombined into a single gene tree. A description of the gene tree is provided in Figure 1.
The last non-statistical filter we applied addressed the quality of the data. For this ‘quality control’ filter we eliminated probe sets that did not meet one of two conditions. The first condition focused on the control chips. As indicated above, our initial operation was to divide the value of each individual probe set on each chip by the mean of the values for that probe set on the four control chips. Therefore, the quality of the control data for each particular probe set is of paramount importance in defining regulation by the drug. The second condition focused on the remaining 16 time points. Using the standard deviation of the mean, this filter excluded all probe sets whose coefficient of variation (CV) for the control chips exceeded 50% or whose CV for > 8 of the remaining 16 time points exceeded 50%. For the one time point in which only two samples were available (30 h), a quasi-CV was calculated by dividing the difference between the two values by the average. This ‘quality control’ filter eliminated an additional 37 probe sets. Figure 4 (left) provides a gene tree of the 653 probe sets that were not eliminated by the entire series of filters. Figure 4 (right) shows the 8146 probe sets that were filtered out by the entire set of filters. Comparing Figure 1 (top left) with Figure 4 (right) demonstrates that probes with apparent regulation are no longer present in the total data set. The 653 probe sets remaining after filtering the total data set (Figure 4, left) are the product of this approach to data mining and, thus, become the focus of temporal clustering, functional clustering, and PK/PD modeling.
Figure 4. Gene trees of the remaining probe sets after completion of all filtering steps and of the eliminated probe sets.
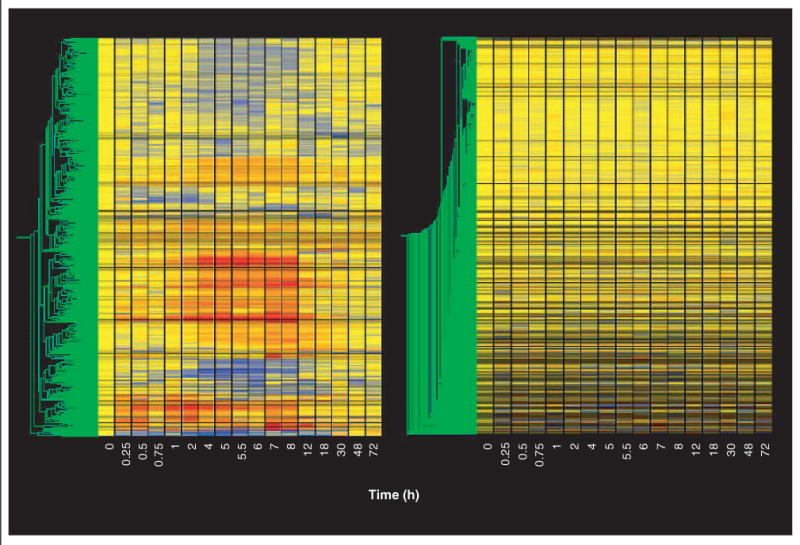
Gene trees of the 653 probe sets remaining after completion of all filtering steps described in the text (left panel), and of the 8146 eliminated probe sets (right panel). Gene trees are as described in Figure 1.
Our previous work demonstrated that three basic temporal signatures of regulation can be expected following single bolus dosing by MPL of a population of ADX rats that have a stable baseline. These three signatures indicate upregulation, downregulation, and biphasic regulation. Figure 5 top left (313 probe sets), top right (321 probe sets), and bottom (19 probe sets) provide gene trees for probe sets that fall into these three categories respectively. As a final evaluation of the results we performed a 1-way analysis of variance (ANOVA) with a Tukey post-hoc test (p < 0.05) on each of the three groups. Tables 1, 2 and 3 list the probe sets in these three groups, respectively. The ANOVA identified for exclusion 62 of 313 probe sets from Table 1, 95 of 321 probe sets from Table 2 and 2 of 19 probe sets from Table 3. Those probe sets identified for exclusion by the ANOVA are highlighted in the tables.
Figure 5. Gene trees of probe sets representing upregulation, downregulation and biphasic regulation in skeletal muscle as a function of time following methylprednisolone administration.
Gene trees of probe sets representing upregulation (top left), downregulation (top right) and biphasic regulation (bottom) in skeletal muscle as a function of time following methylprednisolone administration. Gene trees are as described in Figure 1.
Table 1. Upregulated probe sets.
| Probe set ID | Gene name |
|---|---|
| D45920_at | 130-kDa-Ins(1,4,5)P3-binding protein |
| rc_AI072447_s_at | 130-kDa-Ins(1,4,5)P3-binding protein |
| M33648_g_at | 3-Hydroxy-3-methylglutaryl-coenzyme A synthase 2 |
| Y15748_at | 3-Phosphoinositide-dependent protein kinase-1 |
| D87240_at* | 6-Phosphofructo-2-kinase/fructose-2,6-biphosphatase 3 |
| M64797_at | 6-Phosphofructo-2-kinase/fructose-2,6-biphosphatase 4 |
| AF038388_at | Actin-filament-binding protein frabin |
| S47609_s_at | Adenosine A2A receptor |
| M91466_at* | Adenosine A2B receptor |
| U90888_at | Adenosine monophosphate deaminase 3 |
| X77235_at | ADP-ribosylation-like 4 |
| D15069_s_at | Adrenomedullin |
| rc_AA866237_s_at* | Albumin |
| M27434_s_at | α-2u globulin PGCL1 |
| AF030378_at | Angiopoietin-2 |
| L36664_s_at | Angiotensin-1-converting enzyme 1 |
| U03734_at | Angiotensin-1-converting enzyme 1 |
| rc_AA963682_at | Ankyrin 3 (G) |
| X52196cds_at | Arachidonate 5-lipoxygenase-activating protein |
| U08986_s_at* | Aryl hydrocarbon receptor nuclear translocator |
| U61184_at | Aryl hydrocarbon receptor nuclear translocator |
| AB012600_s_at | Aryl hydrocarbon receptor nuclear translocator |
| M60921_g_at* | B-cell translocation gene 2, antiproliferative |
| U34963_s_at | Bcl2-like 1 |
| U72350_at | Bcl2-like 1 |
| Z22607_at | Bone morphogenetic protein 4 |
| U35774_at | Branched chain aminotransferase 1, cytosolic |
| rc_AA894004_at | CAPG protein |
| L03201_at | Cathepsin S |
| S77528cds_s_at | CCAAT/enhancer binding protein (C/EBP), β |
| X60769mRNA_at | CCAAT/enhancer binding protein (C/EBP), β |
| M65149_at | CCAAT/enhancer binding, protein (C/EBP), δ |
| rc_AI045030_s_at | CCAAT/enhancer binding, protein (C/EBP), δ |
| U92803_at | CC-chemokine-binding receptor JAB61 |
| AF087943_s_at | CD14 antigen |
| D29646_at | CD38 antigen |
| rc_AA800243_at | Cell death activator CIDEA |
| L33869_at | Ceruloplasmin |
| U17035_s_at | Chemokine (CXC motif) ligand 10 |
| U45965_at* | Chemokine (CXC motif) ligand 2 |
| AF004953_a*t | Chondroadherin |
| X71127_g_at* | Complement component 1 |
|
| |
| M29866_s_at | Complement component 3 |
| D17370_g_at | CTL target antigen |
| U44948_at | Cysteine-rich protein 2 |
| rc_AA800784_at* | Cysteine-rich protein 61 |
| U39207_at | Cytochrome P450 4F5 |
| M38566mRNA_s_at | Cytochrome P450, family 27, subfamily a, polypeptide 1 |
| rc_AI176856_at | Cytochrome P450, subfamily 1B, polypeptide 1 |
| U09540_g_at | Cytochrome P450, subfamily 1B, polypeptide 1 |
| AF017393_at | Cytochrome P450, subfamily 2F, polypeptide 1 |
| M29853_at | Cytochrome P450, subfamily 4B, polypeptide 1 |
| AF065161_at | Cytokine-inducible SH2-containing protein |
| rc_AA942685_at | Cytosolic cysteine dioxygenase 1 |
| AF075383_at | Cytokine-nducible SH2-containing protein 3 |
| rc_AI639000_at* | DEAD/H box polypeptide 36 protein |
| U32681_g_at | Deleted in malignant brain tumors 1 |
| M64711_at | Endothelin 1 |
| D29683_at | Endothelin-converting enzyme 1 |
| U53184_at | Estrogen-responsive uterine mRNA, partial sequence |
| U05014_at | Eukaryotic translation initiation factor 4E-binding protein 1 |
| U05014_g_at | Eukaryotic translation initiation factor 4E-binding protein 1 |
| rc_AI639246_at | Extracellular link domain-containing 1 |
| rc_AI136396_at | Farnesyltransferase β subunit |
| rc_AI230914_at | Farnesyltransferase β subunit |
| M32062_at | Fc receptor, IgG, low-affinity III |
| M32062_g_at | Fc receptor, IgG, low-affinity III |
| M35601_at | Fibrinogen, α polypeptide |
| M84719_at | Flavin-containing monooxygenase 1 |
| U18982_s_at | fos-Like antigen 2 |
| M88469_at | f-Spondin |
| M77694_at* | Fumarylacetoacetate hydrolase |
| AF061443_at | G-protein-coupled receptor 48 |
| rc_AI029183_s_at | Gap junction membrane channel protein α1 |
| rc_AA800786_at | GATA-binding protein 6 |
| D13963_at | Glutamate receptor, metabotropic 6 |
| M91652complete_seq_at | Glutamine synthetase 1 |
| M91652complete_seq_g_at | Glutamine synthetase 1 |
| rc_AA852004_s_at | Glutamine synthetase 1 |
| rc_AI232783_s_at | Glutamine synthetase 1 |
| D00680_at* | Glutathione peroxidase 3 |
| X06150cds_g_at | Glycine methyltransferase |
| rc_AA963857_at | Glypican 3 |
|
| |
| U49099_at* | Golgi SNARE protein (golgi SNAP receptor complex member 1) |
| M12450_at* | Group-specific component |
| L32591mRNA_at* | Growth arrest and DNA-damage-inducible 45α |
| L32591mRNA_g_at* | Growth arrest and DNA-damage-inducible 45α |
| rc_AI070295_g_at | Growth arrest and DNA-damage-inducible 45α |
| AF019624_at | Growth differentiation factor 8 |
| L13619_g_at | Growth response protein (CL-6) |
| M58364_at | GTP cyclohydrolase 1 |
| rc_AA859837_at | Guanine deaminase |
| K01933_at | Haptoglobin |
| rc_AI176658_s_at | Heat-shock 27-kDa protein 1 |
| rc_AA944397_at | Heat-shock protein 86 |
| rc_AA891542_at | Heat-shock protein 40-3 |
| rc_AI179610_at | Heme oxygenase 1 |
| M62642_at* | Hemopexin |
| rc_AA799893_g_at | Heterogeneous nuclear ribonucleoprotein A1 |
| rc_AA800738_at | HIV-1 Tat interactive protein, 60 kD |
| AB020879_at | Homer, neuronal immediate–early gene, 3 |
| rc_AA893172_at* | Hypothetical protein |
| rc_AA799537_at* | Hypothetical protein D2Ertd391e |
| rc_AA892306_at* | Hypothetical protein FLJ12660 |
| U17254_at | Immediate–early gene transcription factor NGFI-B |
| U17254_g_at | Immediate–early gene transcription factor NGFI-B |
| M31837_at | Insulin-like growth factor-binding protein 3 |
| rc_AI009405_s_at | Insulin-like growth factor-binding protein 3 |
| D00913_at | Intercellular adhesion molecule 1 |
| D00913_g_at | Intercellular adhesion molecule 1 |
| U68272_at | IFN-γ receptor |
| M34253_g_at | IFN regulatory factor 1 |
| M34253_at | IFN regulatory factor 1 |
| rc_AA799861_g_at* | IFN regulatory factor 7 |
| rc_AI014163_at | IFN-related developmental regulator 1 |
| M98820_at | IL-1β |
| M95578_g_at* | IL-1 receptor, type I |
| AF015719_s_at | IL-15 |
| X69903_at | IL-4 receptor |
| M58587_at | IL-6 receptor |
| AJ000557cds_s_at | Janus kinase 2 |
| U13396_at* | Janus kinase 2 |
| U13396_g_at | Janus kinase 2 |
| rc_AA891041_at | Jun-B oncogene |
|
| |
| M75148_at* | Kinesin light chain 1 |
| D12769_at | Kruppel-like factor 9 |
| D12769_g_at | Kruppel-like factor 9 |
| rc_AA859581_at | Late gestation lung protein 1 |
| J02962_at | Lectin, galactose-binding, soluble 3 |
| rc_AA943555_s_at | Linker of T-cell receptor pathways |
| U24652_at | Linker of T-cell receptor pathways |
| rc_AA946503_at | Lipocalin 2 |
| rc_AA875620_at | LOC361797 |
| X73371_at | Low-affinity immunoglobulin γ Fc region receptor II precursor |
| rc_AA892775_at | Lysozyme |
| rc_AI234060_s_at | Lysyl oxidase |
| J05495_at | Macrophage galactose N-acetyl-galactosamine-specific lectin |
| M64862_at* | Matrin F/G 1 |
| rc_AI012030_at | Matrix Gla protein |
| X98517_at* | Matrix metalloproteinase 12 |
| L24374_at | Matrix metalloproteinase 7 |
| U65007_g_at | Met proto-oncogene |
| Z46374cds_s_at | Met proto-oncogene |
| rc_AI102562_at | Metallothionein |
| rc_AI176456_at | Metallothionein 1E (MT-1E) |
| rc_AA955983_at | Microsomal glutathione S-transferase 2 |
| rc_AA799508_at | Microtubule-associated proteins 1A/1B light chain 3 |
| U05784_s_at | Microtubule-associated proteins 1A/1B light chain 3 |
| rc_AA924542_s_at | Mitogen-activated protein kinase 14 |
| rc_AI137862_s_at | Mitogen-activated protein kinase 14 |
| rc_AI171630_s_at | Mitogen-activated protein kinase 14 |
| U73142_at | Mitogen-activated protein kinase 14 |
| U73142_g_at | Mitogen-activated protein kinase 14 |
| U91847_s_at | Mitogen-activated protein kinase 14 |
| M94454_at | Mitogen-activated protein kinase kinase kinase 8 |
| rc_AI169756_s_at | Mitogen-inducible gene 6 protein homolog (Mig-6) (gene 33 polypeptide) |
| M23572_at | Mitogen-inducible gene 6 protein homolog (Mig-6) (gene 33 polypeptide) |
| rc_AA943677_at | Munc13-3 |
| AF020618_at* | Myeloid differentiation primary response gene 116 |
| M27151_at | Myogenic factor 6 |
| X52711_at | Myxovirus (influenza virus) resistance |
| D82074_at | Neurogenic differentiation 1 |
| rc_AI072943_at | Neurotensin receptor 2 |
| X63594cds_at | Nuclear factor of κ light chain |
|
| |
| X63594cds_g_at | Nuclear factor of κ light chain |
| AF014503_at | Nuclear protein 1 |
| AF000899_at* | Nucleoporin p58 |
| rc_AA892598_at | Nucleostemin |
| rc_AI230294_at | Fanconi anemia, complementation group E |
| AF104362_at | Osteomodulin (osteoadherin) |
| V01216_at* | Orosomucoid 1 |
| AB005900_at* | Oxidized low-density lipoprotein receptor 1 |
| rc_AA799744_at | β-Galactosidase |
| rc_AA859593_at | PDB:1lbg |
| AB016532_at | Period homolog 2 |
| U40064_at | Peroxisome proliferator-activated receptor δ |
| rc_AA893267_at | PEST phosphatase-interacting protein |
| D88666_at | Phosphatidylserine-specific phospholipase A1 |
| L27059_s_at | Phosphodiesterase 4D |
| L27060_at | Phosphodiesterase 4D |
| X51529_at | Phospholipase A2, group IIA (platelets, synovial fluid) |
| rc_AA891751_at* | Sodium channel α-chain HBA |
| rc_AA800808_at* | Hypothetical protein (B2 element) |
| rc_AA892446_at* | Hypothetical protein (B2 element) |
| rc_AA799497_at | Hypothetical protein DKFZp434G162.1 |
| rc_AA799497_g_at | Hypothetical protein DKFZp434G162.1 |
| L40030_at | Placental growth factor |
| U77697_at | Platelet/endothelial cell adhesion molecule |
| U83895_at | Pleckstrin homology, Sec7 and coiled/coil domains 1 |
| rc_AA891314_at | Poly(rC)-binding protein 4 |
| X78461_at | Potassium inwardly-rectifying channel, subfamily J, member 12 |
| X53231_at | Preoptic regulatory factor-1 |
| U05989_at | PRKC, apoptosis, WT1, regulator |
| X59993_at | Probable zinc-finger protein |
| U03388_s_at | Prostaglandin-endoperoxide synthase 1 |
| rc_AI639113_at | Multimerin, endothelial cell, precursor |
| rc_AA893664_at | TEMO |
| M33962_at | Protein tyrosine phosphatase, non-receptor type 1 |
| M33962_g_at | Protein tyrosine phosphatase, non-receptor type 1 |
| rc_AI113289_s_at | Protein tyrosine phosphatase, non-receptor type 1 |
| rc_AI180145_s_at | Protein tyrosine phosphatase, non-receptor type 1 |
| L19180_g_at | Protein tyrosine phosphatase, receptor type, D |
| L19933_s_at* | Protein tyrosine phosphatase, receptor type, D |
| M60103_at | Protein tyrosine phosphatase, receptor type, F |
| D10757_g_at* | Proteosome subunit, β type 9 |
|
| |
| AF034577_at | Pyruvate dehydrogenate kinase 4 |
| U12187_at | Ras-related associated with diabetes |
| AF036548_g_at | Rgc32 protein |
| rc_AA900505_at | Rhob |
| rc_AI639465_f_at | Ring finger protein 28 |
| rc_AI639465_r_at | Ring finger protein 28 |
| rc_AA800245_at | RING finger protein MURF |
| rc_AA957003_at | S100 calcium-binding protein A8 (calgranulin A) |
| L18948_at | S100 calcium-binding protein A9 (calgranulin B) |
| rc_AI008131_s_at | S-Adenosylmethionine decarboxylase 1 |
| M14656_at | Secreted phosphoprotein 1 |
| L23088_at* | Selectin, platelet |
| rc_AI010453_at* | Serine (or cysteine) protease inhibitor, clade A, member 1 |
| M24067_at | Serine (or cysteine) protease inhibitor, member 1 |
| D00753_at | Serine protease inhibitor |
| AF086624_s_at | Serine threonine kinase pim3 |
| rc_H31623_s_at | Serine/threonine kinase 2 |
| L01624_at | Serum/glucocorticoid-regulated kinase |
| U25281_at | SH3 domain-binding protein CR16 |
| U31159_s_at | SH3 domain-binding protein CR16 |
| AF053312_s_at | Small inducible cytokine subfamily A20 |
| D63772_at | Solute carrier family 1, member 1 |
| S59158_at | Solute carrier family 1, member 3 |
| L35558_s_at* | Solute carrier family 1, member 1 |
| D82883_at* | Solute carrier family 26 (sulfate transporter), member 2 |
| U66723_s_at | Solute carrier family 28, member 2 |
| AB015433_s_at | Solute carrier family 3, member 2 |
| AJ001290cds_at* | Solute carrier family 5 (inositol transporters), member 3 |
| rc_AA860049_at | BGAL_ECOLI β-galactosidase (lactase) |
| rc_AA891944_at | BGAL_ECOLI β-galactosidase (lactase) |
| L19998_at | Sulfotransferase family 1A, phenol-preferring, member 1 |
| L19998_g_at | Sulfotransferase family 1A, phenol-preferring, member 1 |
| rc_AI011498_at | SWI/SNF-related, matrix-associated, actin-dependent regulator of chromatin d2 |
| U90312_at* | Synaptojanin 2 |
| S61868_at | Syndecan 4 |
| S61868_g_at | Syndecan 4 |
| rc_AI169327_at* | Tissue inhibitor of metalloproteinase 1 |
| rc_AI169327_g_at | Tissue inhibitor of metalloproteinase 1 |
| K02814_at* | T-kininogen |
| K02814_g_at | T-kininogen |
|
| |
| L25785_at | Transforming growth factor β1-induced transcript 4 |
| M77809_at | Transforming growth factor, β receptor 3 |
| M80784_s_at* | Transforming growth factor, β receptor 3 |
| X57523_g_at | Transporter 1, ATP-binding cassette, subfamily B (MDR/TAP) |
| rc_AI639401_at | Trichohyalin |
| rc_AA892333_at | Tubulin, α6; tubulin α6 |
| rc_AA859722_at | Ubiquitin-conjugating enzyme E2G 2; ubiquitin-conjugating enzyme 7 |
| AF047707_at | UDP-glucose ceramide glycosyltransferase |
| AF047707_g_at* | UDP-glucose ceramide glycosyltransferase |
| AF035943_at | Uncoupling protein 3 |
| L20913_s_at | Vascular endothelial growth factor |
| rc_AI172247_at | Xanthine dehydrogenase |
| rc_AA800613_at | Zinc-finger protein 36 |
| X63369cds_at | Zinc-finger protein 36 |
| rc_AA800840_g_at* | EST |
| rc_AA866383_at | EST |
| rc_AA875288_at | EST |
| rc_AA892257_at | EST |
| rc_AI638994_at | EST |
| rc_AI639136_at* | EST |
| rc_AI639146_at* | EST |
| rc_AI639417_at | EST |
| rc_AI639507_at | EST |
| AF053988_at* | EST |
| AF058787_at* | EST |
| AF069775_at* | EST |
| AF069782_at | EST |
| AF087944mRNA_s_at | EST |
| D11445exon#1-4_s_at | EST |
| D26393exon_s_at | EST |
| E01789cds_s_at* | EST |
| E03229cds_s_at | EST |
| E04239cds_s_at | EST |
| E12159cds_s_at | EST |
| J02722cds_at | EST |
| M11794cds#2_f_at | EST |
| M13100cds#1_g_at | EST |
| M24239cds#2_f_at | EST |
| M64793_at | EST |
| M86912exon_at* | EST |
| rc_AA859902_at | EST |
|
| |
| M86912exon_g_at | EST |
| rc_AA866240_i_at* | EST |
| rc_AA875032_at | EST |
| rc_AA893693_at* | EST |
| rc_AA893994_at | EST |
| rc_AI638955_at* | EST |
| rc_AI639348_at | EST |
| rc_AI639405_at | EST |
| S66184_s_at | EST |
| S68135_s_at | EST |
| S74265_s_at* | EST |
| S77494_s_at | EST |
| S78284_s_at | EST |
| S85184_at | EST |
| S85184_g_at | EST |
| U31160mRNA_s_at | EST |
| X05861exon#1-6_s_at* | EST |
| X07266cds_s_at | EST |
| X07285cds_s_at | EST |
| X17053cds_s_at | EST |
| X54686cds_at | EST |
| X62951mRNA_s_at | EST |
| X89225cds_s_at | EST |
| Y00396mRNA_g_at | EST |
| Y07534cds_s_at | EST |
| Z15123exon#5_s_at | EST |
Probe sets were excluded by the final ANOVA with a Tukey post-hoc test.
Bcl: B-Cell leukemia/lymphoma; BGAL: β-Galactosidase; CAPG: Capping protein (actin filament), gelsolin-like; CIDEA: Cell death-inducing DNA fragmentation factor-like effector A; CTL: Cytotoxic T lymphocyte; ECOLI: Escherichia coli; EST: Expressed sequence tag; GATP: Guanosine triphosphate; HBA: Hemoglobin α; MURF: Muscle-specific RING finger; NGFI: Nerve growth factor-induced protein I; PRKC: Protein kinase C; SNAP: Synaptosomal-associated protein; SNARE: Soluble N-ethylmaleimide-sensitive factor-attached protein receptor; UDP: Uridine diphosphate; WT: Wilms' tumor.
Table 2. Downregulated probe sets.
| Probe set ID | Gene name |
|---|---|
| rc_AI103874_at | 25-kDa FK506-binding protein |
| D32209_at* | Acidic nuclear phosphoprotein 32 family, member A |
| M63282_at | Activating transcription factor 3 |
| L10640_s_at | Activin receptor IIB |
| L19341_at | Activin type I receptor |
| AF030089UTR#1_at | Activity and neurotransmitter-induced early gene protein 4 (ania-4) |
| M80633_at | Adenylyl cyclase 4 |
| U60063_at | Aldehyde dehydrogenase family 1, subfamily A2 |
| U10894_s_at | Allograft inflammatory factor 1 |
| rc_AI178971_at | α-Globin |
| rc_AI169370_at* | α-Tubulin |
| V01227_s_at | α-Tubulin |
| D87515_at | Aminopeptidase B |
| rc_AI112173_at | ATPase Na+/K+ transporting β1 polypeptide |
| rc_AI230614_s_at | ATPase Na+/K+ transporting β1 polypeptide |
| rc_AA799448_g_at | B48013 proline-rich proteoglycan 2 precursor |
| AF009329_at | Basic helix-loop-helix domain containing, class B3 |
| rc_AI639493_at | β-Galactosidase (lactase) |
| X03369_s_at | β-Tubulin T β15 |
| D88890_at* | Brain acyl-coenzyme A hydrolase |
| rc_AI228025_s_at | Calcitonin receptor-like |
| rc_AI010725_g_at* | Calnexin |
| rc_AI171796_at | Calpain 6 |
| D89069_f_at* | Carbonyl reductase 1 |
| L46791_at* | Carboxylesterase 3 |
| J00713mRNA_at | Carboxypeptidase A1 |
| U77933_at* | Caspase 2 |
| U84410_s_at* | Caspase 3 |
| rc_AA926149_g_at | Catalase |
| rc_AA900476_g_at | Cbp/p300-interacting transactivator, with Glu/Asp-rich carboxy-terminal domain, 2 |
| rc_AI014091_at | Cbp/p300-interacting transactivator, with Glu/Asp-rich carboxy-terminal domain, 2 |
| rc_AI171462_s_at | CD24 antigen |
| U49062_at | CD24 antigen |
| U49062_g_at | CD24 antigen |
| M57276_at* | CD53 antigen |
| rc_AA799538_at* | cDNA clone MGC:73009 IMAGE:6889746 |
| X60767mRNA_s_at | Cell division cycle 2 homolog A (Schizosaccharomyces pombe) |
| rc_AA925473_g_at* | Cell division cycle 42 homolog (Saccharomyces cerevisiae) |
| rc_AI227887_at* | Cell division cycle 42 homolog (S. cerevisiae) |
| X06769cds_at* | c-fos oncogene |
| Y12009_at* | Chemokine (CC motif) receptor 5 |
| X62894_at | Chloride channel 1 |
|
| |
| X74832cds_at* | Cholinergic receptor, nicotinic, α polypeptide 1 |
| U33553_at | Chondroitin sulfate proteoglycan 5 |
| M57664_g_at | Creatine kinase, brain |
| rc_AA859543_at* | C-Terminal-binding protein 2 |
| L16532_at | Cyclic nucleotide phosphodiesterase 1 |
| D14014_at | Cyclin D1 |
| D14014_g_at | Cyclin D1 |
| X75207_s_at | Cyclin D1 |
| rc_AA899106_at | Cyclin D2 |
| D16309_at* | Cyclin D3 |
| rc_AI234146_at | Cysteine and glycine-rich protein 1 |
| rc_AA819708_s_at* | Cytochrome c oxidase, subunit 7a 3 |
| J03179_at | D site albumin promoter binding protein |
| J03179_g_at | D site albumin promoter binding protein |
| rc_AA875577_at | Dapper2 |
| rc_AA892388_at | Death-associated kinase 2 |
| D78588_at | Diacylglycerol kinase ζ |
| D00636Poly_A_Site#1_s_at | Diaphorase 1 |
| rc_AA963839_s_at | Diaphorase 1 |
| L05489_at* | Diphtheria toxin receptor |
| J02776_s_at | DNA polymerase β |
| U30186_at | DNA-damage inducible transcript 3 |
| rc_AI235707_at* | Dynactin 4 |
| rc_AI235707_g_at* | Dynactin 4 |
| X54531mRNA_at | Dynamin 1 |
| rc_AI009806_at | Dynein, cytoplasmic, light chain 1 |
| L24051_at | Early B-cell factor (olfactory neuronal transcription factor 1) |
| AF023087_s_at | Early growth response 1 |
| M18416_at | Early growth response 1 |
| rc_AI176662_s_at* | Early growth response 1 |
| U78102_at | Early growth response 2 |
| AJ009698_g_at* | Embigin |
| U36482_at* | Endoplasmic reticulum protein 29 |
| rc_AI233219_at | Endothelial cell-specific molecule 1 |
| K03249_at* | Enoyl-coenzyme A, hydratase/3-hydroxyacyl coenzyme A dehydrogenase |
| D38056_at | Ephrin A1 |
| rc_AA892417_at | Ephrin A1 |
| Z54212_at | Epithelial membrane protein 1 |
| rc_AA819500_g_at | Expressed sequence AU040575 |
| D30666_at | Fatty acid coenzyme A ligase, long chain 3 |
| L02529_at | Frizzled 1; frizzled |
| L02530_at | Frizzled homolog 2 (Drosophila) |
| rc_AA800912_g_at | General transcription factor II I repeat domain-containing 1 |
|
| |
| U36771_g_at | Glycerol-3-phosphate acyltransferase, mitochondrial |
| X78593_g_at | Glycerol-3-phosphate dehydrogenase 2 |
| U07971_at | Glycine amidinotransferase (L-arginine:glycine amidinotransferase) |
| rc_AA892799_s_at | Glyoxylate reductase/hydroxypyruvate reductase |
| rc_AA875084_at | Groucho protein GRG1-L; Grg1-L |
| rc_AI070295_at* | Growth arrest and DNA-damage-inducible 45α |
| AJ131902_g_at | Growth arrest specific 7 |
| rc_AI232374_g_at | H1 histone family, member 0 |
| rc_AA818604_s_at | Heat-shock 70-kDa protein 1A |
| J05405mRNA_s_at | Heme oxygenase 2 |
| D84418_s_at* | High mobility group box 2 |
| rc_AI008836_s_at* | High mobility group box 2 |
| AB017140_g_at | Homer, neuronal immediate–early gene, 1 |
| AF093267_s_at | Homer, neuronal immediate–early gene, 1 |
| AF093268_s_at | Homer, neuronal immediate–early gene, 1 |
| X06827_at | Hydroxymethylbilane synthase |
| rc_H31802_at | Hypothetical protein (B2 element) |
| rc_AA800218_at* | Hypothetical protein FLJ14466 |
| rc_AA894282_at* | Hypothetical protein FLJ20312 |
| rc_AI639060_at | Hypothetical protein FLJ20559 |
| rc_AI639088_s_at | Hypothetical protein KIAA0670 |
| rc_H31665_at | Hypoxia-induced gene 1 |
| L23148_g_at | Inhibitor of DNA binding 1, helix-loop-helix protein (splice variation) |
| AF000942_at | Inhibitor of DNA binding 3, dominant negative helix-loop-helix protein |
| rc_AI171268_at | Inhibitor of DNA binding 3, dominant negative helix-loop-helix protein |
| X58375_at | Insulin receptor substrate 1 |
| M62781_at | Insulin-like growth factor-binding protein 5 |
| rc_AI029920_s_at | Insulin-like growth factor-binding protein 5 |
| X74293_s_at | Integrin α7 |
| AF020046_s_at | Integrin αE1, epithelial-associated |
| rc_AA892314_at* | Isocitrate dehydrogenase 1 |
| L38483_at | Jagged 1 |
| rc_AA900503_at | Jagged 1 |
| M19647_i_at | Kallikrein |
| rc_AA866404_at* | KE6a |
| U93306_at | Kinase insert domain protein receptor |
| AF071204_g_at | Kit ligand |
| U72353_at | Lamin B1 |
| rc_AA946108_at | Laminin 5 α3 |
| X76985_at | Latexin |
| rc_AA800844_s_at | Loxl protein |
| X84039_at | Lumican |
| AB010960_s_at* | Matrix metalloproteinase 23 |
|
| |
| D14447_at | Max |
| Z17223_at | Mesenchyme homeo box 2 |
| X53054_g_at | MHC RT1 class II E-β chain mRNA, 3′ end |
| J03752_at | Microsomal glutathione S-transferase 1 |
| rc_AI227608_s_at | Microtubule-associated protein tau |
| rc_AI639082_s_at* | Mini chromosome maintenance deficient 6 |
| rc_AA874919_at* | Mismatch repair protein |
| D49785_at | Mitogen-activated protein kinase kinase kinase 12 |
| M64301_at | Mitogen-activated protein kinase 6 |
| M64301_g_at | Mitogen-activated protein kinase 6 |
| rc_AI176689_at | Mitogen-activated protein kinase kinase 6 |
| rc_AA891054_at | Mucin 2 precursor |
| AJ006295_at | Myeloid/lymphoid or mixed-lineage leukemia |
| rc_AA866276_at | Myeloid-associated differentiation marker |
| M84176_at | Myogenic differentiation 1 |
| M24393_at* | Myogenin |
| rc_AI175935_at | Myosin IE |
| X52840_r_at* | Myosin regulatory light chain |
| K03468_s_at* | Myosin, heavy polypeptide 3 |
| X04267_at | Myosin, heavy polypeptide 3 |
| rc_AI171542_at* | NADH dehydrogenase (ubiquinone) 1β subcomplex |
| rc_AA799499_at* | NADH dehydrogenase (ubiquinone) 1β subcomplex 3 |
| AA686870_f_at | NADH ubiquinone oxidoreductase |
| AA799336_at* | NADH ubiquinone oxidoreductase 9.6-kDa subunit |
| rc_AI171959_at | Neuraminidase 2 |
| AF016296_at | Neuropilin |
| AF077338_at* | Norvegicus myosin-binding protein H |
| rc_AI102839_at | Notch 3 |
| rc_AI102839_g_at | Notch 3 |
| AB012230_at | Nuclear factor I/B |
| M25804_at | Nuclear receptor subfamily 1, group D, member 1 |
| M25804_g_at | Nuclear receptor subfamily 1, group D, member 1 |
| rc_AI012183_at* | Nuclear receptor subfamily 2, group F, member 2 |
| M36074_g_at | Nuclear receptor subfamily 3, group C, member 2 |
| rc_AI176710_at | Nuclear receptor subfamily 4, group A, member 3 |
| rc_AA894092_at | Osteoblast-specific factor 2 precursor |
| rc_AI009098_at | Oxygen-regulated protein (150 kDa) |
| AF039832_g_at* | Paired-like homeodomain transcription factor 2 |
| rc_AA891438_at | Pantothenate kinase 2 (PANK2) |
| M31603_at | Parathyroid hormone-like peptide |
| M19533mRNA_i_at | Peptidylprolyl isomerase A |
| rc_AA818858_s_at | Peptidylprolyl isomerase A |
| U38376_s_at | Phospholipase A2, group IVA (cytosolic, calcium-dependent) |
|
| |
| rc_AA894345_at | Phosphoprotein enriched in astrocytes 15 |
| D10853_at | Phosphoribosyl pyrophosphate amidotransferase |
| rc_AI169104_at | Platelet factor 4 precursor (PF-4) (CXCL4) |
| rc_AI102795_at | Pleiotropin |
| AB020504_at | PMF32 protein |
| AB020504_g_at | PMF32 protein |
| D42145_at | Potassium inwardly-rectifying channel, subfamily J, member 8 |
| rc_AA799691_at | Potassium-chloride cotransporter KCC4 |
| M24604_at* | Proliferating cell nuclear antigen |
| X78949_at* | Prolyl 4-hydroxylase α subunit |
| L02615_at | Protein kinase inhibitor, α |
| D14568_at* | Protein phospatase 3, regulatory subunit B, α isoform, type 1 |
| U57499_g_at* | Protein tyrosine phosphatase, non-receptor type 11 |
| U28938_at | Protein tyrosine phosphatase, receptor type, O |
| rc_AA799812_g_at | Protein-tyrosine-phosphatase (EC 3.1.3.48), non-receptor type 3 |
| U56839_at | Purinergic receptor P2Y, G-protein-coupled 2 |
| U82591_at | Putative c-Myc-responsive |
| X06889cds_at | RAB3A, member RAS oncogene family |
| rc_AI230406_at* | Ras-related protein Rab10 |
| rc_AA899253_at | Rat mRNA |
| M81639_at | Rattus norvegicus stannin mRNA |
| U27767_at | Regulator of G protein signaling 4 |
| rc_AI639318_at | ret proto-oncogene |
| AJ223083_at | Retinoid X receptor γ |
| M10934_s_at | Retinol-binding protein 4 |
| X67504_at | RT1 class Ib gene(Aw2) |
| X06916_at | S100 calcium-binding protein A4 |
| rc_AI228548_at | S100 protein, α chain |
| AF071495_s_at | Scavenger receptor class B, member 1 |
| D89655_at | Scavenger receptor class B, member 1 |
| rc_AA875172_at | SH3-domain kinase-binding protein 1 |
| U81186_g_at* | Smooth muscle-specific 17β-hydroxysteroid dehydrogenase type 3 |
| M22253_at | Sodium channel, voltage-gated, type 1, α polypeptide |
| AF051561_s_at | Solute carrier family 12, member 2 |
| D63834_at | Solute carrier family 16, member 1 |
| U17133_at | Solute carrier family 30, member 1 |
| U76714_at | Solute carrier family 39 (iron-regulated transporter), member 1 |
| U76714_g_at | Solute carrier family 39 (iron-regulated transporter), member 1 |
| rc_AA875037_at | SPI6 |
| rc_AA851749_s_at | Splicing factor, arginine/serine-rich |
| rc_AI231821_at | Stathmin 1 |
| J02585_at* | Stearoyl-coenzyme A desaturase 1 |
| rc_AI175764_s_at* | Stearoyl-coenzyme A desaturase 1 |
|
| |
| M15114_g_at | Stearoyl-coenzyme A desaturase 2 |
| rc_AA875269_at | Stearoyl-coenzyme A desaturase 2 |
| U67995_s_at | Stearoyl-coenzyme A desaturase 2 |
| L27112_s_at | Stress-activated protein kinase α II |
| Y00497_s_at* | Superoxide dismutase 2 |
| M81687_at | Syndecan 2 |
| U40188_at | TAF9-like RNA polymerase II, TATA box-binding protein (TBP)-associated factor, 31 kDa |
| U15550_at* | Tenascin C |
| rc_AI071299_at | TGFB-inducible early growth response |
| K01934mRNA#2_at | Thyroid hormone responsive protein |
| rc_AA899854_at* | Topoisomerase (DNA) 2α |
| X62323_at | Transcription factor E2a |
| M61725_s_at | Transcription factor UBF |
| U03491_at* | Transforming growth factor, β3 |
| M83107_at | Transgelin |
| rc_AI059508_s_at* | Transketolase |
| rc_AA891880_g_at | Tricarboxylate carrier-like protein |
| M60666_s_at | Tropomyosin 1, α |
| rc_AA875132_at | Tropomyosin 1, α |
| rc_AA800948_at | Tubulin α-4 chain |
| AB011679_at | Tubulin, β5 |
| rc_AA800298_at | Type XV collagen |
| rc_AI175900_g_at | v-ets erythroblastosis virus E26 oncogene homolog 1 (avian) |
| rc_AA945867_at* | v-jun sarcoma virus 17 oncogene homolog (avian) |
| rc_AI175959_at* | v-jun sarcoma virus 17 oncogene homolog (avian) |
| rc_AI180108_at* | Wbscr1 |
| rc_AI136891_at* | Zinc-finger protein 36, C3H type-like 1 |
| rc_AA799396_at | EST |
| rc_AA799396_g_at | EST |
| rc_AA799889_at* | EST |
| rc_AA800768_at | EST |
| rc_AA800770_at* | EST |
| rc_AA800908_at* | EST |
| rc_AA859663_at | EST |
| rc_AA859896_at | EST |
| rc_AA859922_at* | EST |
| rc_AA866443_at | EST |
| rc_AA874873_g_at | EST |
| rc_AA891288_at | EST |
| rc_AA891288_g_at | EST |
| rc_AA891447_at* | EST |
| rc_AA891797_at | EST |
| rc_AA892294_at* | EST |
|
| |
| rc_AA892362_at | EST |
| rc_AA892538_at | EST |
| rc_AA892986_at | EST |
| rc_AA893082_at | EST |
| rc_AA893663_at | EST |
| rc_AA894199_at* | EST |
| rc_AA894292_at | EST |
| rc_AA925717_at* | EST |
| rc_AA925762_at | EST |
| rc_AA955167_s_at | EST |
| rc_AI102620_at* | EST |
| rc_AI177256_at | EST |
| rc_AI231778_at* | EST |
| rc_AI638960_at | EST |
| rc_AI639149_s_at | EST |
| rc_AI639410_i_at* | EST |
| rc_H31418_at | EST |
| rc_H33001_at | EST |
| rc_H33426_g_at | EST |
| rc_H33636_at | EST |
| AF087839mRNA#1_s_at* | EST |
| AFFX-BioDn-5_at* | EST |
| AFFX-CreX-3_at* | EST |
| AFFX-CreX-5_at* | EST |
| D10587_at* | EST |
| D42137exon_s_at | EST |
| E06822cds_s_at | EST |
| J00797cds_s_at | EST |
| K00750exon#2-3_at* | EST |
| K03039mRNA_s_at* | EST |
| L00370cds_s_at | EST |
| L16995_at | EST |
| M15358cds_at* | EST |
| M34112_s_at | EST |
| M36151cds_s_at* | EST |
| M81183Exon_UTR_g_at | EST |
| M94918mRNA_f_at | EST |
| M94919mRNA_f_at | EST |
| rc_AA800639_at* | EST |
| rc_AA800701_at* | EST |
| rc_AA858640_s_at* | EST |
| rc_AA860039_s_at | EST |
| rc_AA874848_s_at | EST |
|
| |
| rc_AA891962_at | EST |
| rc_AI010292_s_at* | EST |
| rc_AI639307_at | EST |
| rc_AI639515_at | EST |
| S69206_s_at | EST |
| S77900_g_at | EST |
| S82233_s_at | EST |
| U23146cds_s_at | EST |
| U75397UTR#1_s_at | EST |
| X03347cds_g_at* | EST |
| X06801cds_i_at | EST |
| X07551cds_s_at | EST |
| X12748cds_s_at | EST |
| X14254cds_at | EST |
| X14254cds_g_at | EST |
| X51531cds_at* | EST |
| X51531cds_g_at | EST |
| X80130cds_i_a*t | EST |
| Z27118cds_s_at* | EST |
Probe sets were excluded by the final ANOVA with a Tukey post-hoc test.
CXCL: CXC chemokine ligand; EST: Expressed sequence tag; KE: K region expressed; MHC: Major histocompatibility complex; NADH: Nicotinamide adenine dinucleotide; UBF: Upstream binding factor.
Table 3. Biphasic probe sets.
| Probe set ID | Gene name |
|---|---|
| J03024_at | Adrenergic receptor, β2 |
| M73714_at | Aldehyde dehydrogenase family 3, subfamily A2 |
| U50736_s_at | Ankyrin-like repeat protein |
| AF015953_at | Aryl hydrocarbon receptor nuclear translocator-like |
| rc_AA817854_s_at | Ceruloplasmin |
| AF030358_g_at | Chemokine (CX3C motif) ligand 1 |
| D10262_at | Choline kinase |
| U36992_at | Cytochrome P450, subfamily 7B, polypeptide 1 |
| M80367_at* | Guanylate-binding protein 2, IFN-inducible |
| M25350_s_at | Phosphodiesterase 4B |
| rc_AA799729_g_at* | Phosphodiesterase 4B |
| rc_AA892750_at | Regulator of G protein signaling 1 |
| rc_AI172476_at | TGF-β-inducible early growth response |
| L12025_at | Tumor-associated antigen 1 |
| AF030163_s_at | Uncoupling protein 3 |
| M84488_at | Vascular cell adhesion molecule 1 |
| rc_AI639056_at | EST |
| M64795_f_at* | EST |
| X17053mRNA_s_at | EST |
Probe sets excluded by the final ANOVA with a Tukey post-hoc test.
EST: Expressed sequence tag; TGF: Transforming growth factor.
Discussion
A population of ADX male Wistar rats was injected with a single bolus dose of MPL, groups of three animals were sacrificed at 16 time points over a 72-h period, and MPL-treated samples were compared with vehicle-treated controls. ADX animals were used to eliminate the circadian oscillation of corticosterone and provide a stable baseline [2,3,10,15-17]. This allowed us to identify gene transcripts that deviate from the baseline in response to MPL, and determine the duration of time it takes to return to that baseline. The times of sacrifice over the 72-h period were chosen based on previous experiments, which indicated that the effect of the drug was most significant soon after dosing but, in some cases, full recovery required as long as 72 h.
R_U34A chips were used to examine the temporal profile of changes in global gene expression in skeletal muscle in response to this single bolus dose of MPL. RNA samples from each individual animal were applied to a separate chip to preserve inter-animal variation. As this chip contains 8799 probe sets, the major problem was identifying the small percentage of the probe sets that are regulated by corticosteroids. In previous work, we have used cluster analysis tools to concurrently address the problems of data mining and temporal clustering with a similar data set developed using the livers from these animals [13]. Those tools did identify several subgroups of regulated probe sets. However, while examining genes in the pathways we were prompted to visually inspect the results for genes that ‘should’ have been regulated based on the literature. The results of the visual inspection of individual genes demonstrated to us that the initial very stringent approach that we employed eliminated probe sets that were clearly regulated. There are two reasons for this deficit. First, we approached data mining (identifying regulated probe sets) and clustering as a single process using clustering algorithms based on Euclidian distance and correlation coefficients. Neither Euclidian distance nor correlation coefficients incorporate time interval. In our time series design, 9 of the 16 points are within the first 6 h and 12 of the 16 points are within the first 12 h. The interval between time domains ranged from 0.25 h in the beginning to 24 h at the end. Our previous use of Self Organizing Maps (SOM) and K-means, which are based on Euclidian distance, did not consider varying time interval in the analysis. Our subsequent application of correlation coefficients did not rectify the problem. We, therefore, developed a new approach to data mining that is based on a series of filters designed to eliminate probe sets that do not meet certain explicit criteria. This series of filters produces a small percentage of the total probe sets, which can then become the focus of temporal and functional clustering. The latter will then provide an additional filter prior to applying the ultimate objective, mechanism-based PK/PD modeling. Since we have previously published data on expression changes of small groups of genes measured individually by other methods in conjunction with PK/PD modeling of that data, the drug kinetics and receptor dynamics for this data set have been published [3,10]. When such models are developed, one aspect is to evaluate the goodness of fit of the data to the model.
The basis of this new approach is to filter the database based on specific characteristics of the probe sets that we wished to be eliminated. The first filter we applied was designed to eliminate all probe sets that were not expressed in skeletal muscle. This filter reduced the number of probe sets under consideration from 8799 to 4636. The second filter we applied was designed to identify and eliminate a group of probe sets that do not meet the criteria of downregulation. This filter eliminated all but 354 probe sets. Similarly, we filtered the remaining 4282 probe sets for those that did not meet a minimum criteria for upregulation. This filter eliminated all but 349 probe sets.
HIghlights.
Microarrays provide a method for the type of high-throughput data collection necessary for mechanism-based PK/PD modeling of complex biological systems.
A time series is able to capture the cascades of molecular events commonly initiated by drug dosing.
Data mining a drug response microarray time series involves sorting through a massive amount of data. A rational approach to this problem is to eliminate, by using defined and relevant filters, those probe sets that do not meet minimum criteria for expression in the tissue, regulation by the drug, and data quality.
Those probe sets that are not eliminated by these filters can then become the subject of temporal clustering, functional clustering, and PK/PD modeling.
We then combined the two lists of probe sets that had not been eliminated and filtered that list of 690 probe sets on data quality. The results of the entire set of filters is that 8146 probe sets of the original 8799 probe sets were eliminated from further consideration. This left a remainder of 653 probe sets for further consideration with respect to temporal clustering, functional clustering, and PK/PD modeling.
The use of a rich time series of expression microarrays as a high-throughput method of data collection provides a means for obtaining the patterns of differential expression necessary for developing PK/PD models for complex phenomena, such as steroid-induced insulin resistance or muscle wasting. The initial problem presented by this approach is the necessity to focus attention on a small percentage of regulated genes out of the thousands measured by gene arrays. Probes that fit this category should meet minimal requirements, such as being expressed in the tissue and deviating from baseline for a period of time. They should also meet certain data quality criteria. The series of filters applied to the present data set eliminated > 92% of the probe sets in a simple, straightforward manner. It should be pointed out that this filtration approach takes advantage of the richness of the time series. As this entire data set is available online in a single gene query format [27], the present report makes the subset of probes that warrant further consideration generally available, along with their criteria of selection.
Outlook
In the future, the focus in pharmacogenomics will increasingly shift away from simply identifying genes whose expression is altered by a particular drug toward modeling the dynamic relationship between the elements in the cascade of events in the complex biological system. In the case of skeletal muscle and the response to corticosteroids, such models will allow us to begin to address questions such as dosing regimen and the development of polygenic adverse effects, including insulin resistance and atrophy. These transcriptional models will also provide the scaffolding onto which translational and post-translational data can be placed.
Acknowledgments
This work was supported by grants GM 24211 and 1 P20 GM67650 from the National Institute of General Medical Sciences, NIH. This data set was developed under the auspices of a grant from the National Heart, Lung, and Blood Institute (NHLBI)/NIH Programs in Genomic Applications U01 HL66614.
Bibliography
Papers of special note have been highlighted as either of interest (•) or of considerable interest (••) to readers.
- 1.Almon RR, DuBois DC. Fiber-type discrimination in disuse and glucocorticoid-induced atrophy. Med Sci Sports Exerc. 1990;22:304–311. [PubMed] [Google Scholar]
- 2.McKay LI, DuBois DC, Sun YN, Almon RR, Jusko WJ. Corticosteroid effects in skeletal muscle: gene induction/receptor autoregulation. Muscle Nerve. 1997;20:1318–1320. doi: 10.1002/(sici)1097-4598(199710)20:10<1318::aid-mus17>3.0.co;2-z. [DOI] [PubMed] [Google Scholar]
- 3.Sun YN, McKay LI, DuBois DC, Jusko WJ, Almon RR. Pharmacokinetic/pharmacodynamic models for corticosteroid receptor down-regulation and glutamine synthetase induction in rat skeletal muscle by a receptor/gene-mediated mechanism. J Pharmacol Exp Ther. 1999;288:720–728. [PubMed] [Google Scholar]; •• Provides receptor dynamics and drug kinetics for this data set, as well as PK/PD models of selected genes in skeletal muscle.
- 4.Reynolds RM, Walker BR. Human insulin resistance: the role of glucocorticoids. Diabetes Obes Metab. 2003;5:5–12. doi: 10.1046/j.1463-1326.2003.00221.x. [DOI] [PubMed] [Google Scholar]
- 5.Selyatitskaya VG, Kuzminova OI, Odintsov SV. Development of insulin resistance in experimental animals during long-term glucocorticoid treatment. Bull Exp Biol Med. 2002;133:339–341. doi: 10.1023/a:1016281501423. [DOI] [PubMed] [Google Scholar]
- 6.Wald JA, Farr RS. Abnormal liver-function tests associated with long-term systemic corticosteroid use in subjects with asthma. J Allergy Clin Immunol. 1991;88:277–278. doi: 10.1016/0091-6749(91)90340-t. [DOI] [PubMed] [Google Scholar]
- 7.Eisenstein A. Effects of adrenal cortical hormones on carbohydrate, protein, and fat metabolism. Am J Clin Nutr. 1973;26:113–120. doi: 10.1093/ajcn/26.1.113. [DOI] [PubMed] [Google Scholar]
- 8.Tomono S, Ohyama Y, Uchiyama T. Insulin resistance induced by drugs, inflammation and stress. Jpn J Clin Med. 2002;60:632–636. [PubMed] [Google Scholar]
- 9.Bialas MC, Routledge PA. Adverse effects of corticosteroids. Adverse Drug React Toxicol Rev. 1998;17:227–235. [PubMed] [Google Scholar]
- 10.Sun YN, DuBois DC, Almon RR, Jusko WJ. Fourth-generation model for corticosteroid pharmacodynamics: a model for methylprednisolone effects on receptor/gene-mediated glucocorticoid receptor down-regulation and tyrosine aminotransferase induction in rat liver. J Pharmacokinet Biopharm. 1998;26:289–317. doi: 10.1023/a:1023233409550. [DOI] [PubMed] [Google Scholar]; • A more detailed description of the animals used in this study, as well as PK/PD models of selected genes in liver.
- 11.Almon RR, DuBois DC, Brandenburg EH, et al. Pharmacodynamics and pharmacogenomics of diverse receptor-mediated effects of methylprednisolone in rats using microarray analysis. J Pharmacokinet Pharmacodyn. 2002;29:103–129. doi: 10.1023/a:1019762323576. [DOI] [PubMed] [Google Scholar]
- 12.Barbera M, Fierabracci V, Novelli M, et al. Dexamethasone-induced insulin resistance and pancreatic adaptive response in aging rats are not modified by oral vanadyl sulfate treatment. Eur J Endo. 2001;145:799–806. doi: 10.1530/eje.0.1450799. [DOI] [PubMed] [Google Scholar]
- 13.Jin JY, DuBois DC, Jusko WJ, Almon RR. Modeling of corticosteroid pharmacogenomics in rat liver using gene microarrays. J Pharmacol Exp Ther. 2003;307:93–109. doi: 10.1124/jpet.103.053256. [DOI] [PubMed] [Google Scholar]; •• Provides our initial clustering approach applied to a liver data set developed from the same animals, and pharmacogenomic modeling of selected genes from that data set.
- 14.Klaassen CD. Induction of metallothionein by adrenocortical steroids. Toxicology. 1981;20:275–279. doi: 10.1016/0300-483x(81)90034-2. [DOI] [PubMed] [Google Scholar]
- 15.Ramakrishnan R, DuBois DC, Almon RR, Pyszczynski NA, Jusko WJ. Fifth-generation model for corticosteroid pharmacodynamics: application to steady-state receptor down-regulation and enzyme induction patterns during seven-day continuous infusion of methylprednisolone in rats. J Pharmacokinet Pharmacodyn. 2002;29:1–24. doi: 10.1023/a:1015765201129. [DOI] [PMC free article] [PubMed] [Google Scholar]
- 16.Ramakrishnan R, DuBois DC, Almon RR, Pyszczynski NA, Jusko WJ. Pharmacodynamics and pharmacogenomics of methylprednisolone during 7-day infusions in rats. J Pharmacol Exp Ther. 2002;300:245–256. doi: 10.1124/jpet.300.1.245. [DOI] [PubMed] [Google Scholar]
- 17.Sun YN, DuBois DC, Almon RR, Pyszczynski NA, Jusko WJ. Dose-dependence and repeated-dose studies for receptor/gene-mediated pharmacodynamics of methylprednisolone on glucocorticoid receptor down-regulation and tyrosine aminotransferase induction in rat liver. J Pharmacokinet Biopharm. 1998;26:619–648. doi: 10.1023/a:1020746822634. [DOI] [PubMed] [Google Scholar]
- 18.Garlatti M, Aggerbeck M, Bouguet J, Barouki R. Contribution of a nuclear factor 1 binding site to the glucocorticoid regulation of the cytosolic aspartate aminotransferase gene promoter. J Biol Chem. 1996;271:32629–32634. doi: 10.1074/jbc.271.51.32629. [DOI] [PubMed] [Google Scholar]
- 19.Long W, Wei L, Barrett EJ. Dexamethasone inhibits the stimulation of muscle protein synthesis and PHAS-I and p70 S6-kinase phosphorylation. Am J Physiol Endocrinol Metab. 2001;280:E570–E575. doi: 10.1152/ajpendo.2001.280.4.E570. [DOI] [PubMed] [Google Scholar]
- 20.Makkinje A, Quinn DA, Chen A, et al. Gene 33/Mig-6, a transcriptionally inducible adapter protein that binds GTP-Cdc42 and activates SAPK/JNK. A potential marker transcript for chronic pathologic conditions, such as diabetic nephropathy Possible role in the response to persistent stress. J Biol Chem. 2000;275:17838–17847. doi: 10.1074/jbc.M909735199. [DOI] [PMC free article] [PubMed] [Google Scholar]
- 21.Masters JN, Cotman SL, Osterburg HH, Nichols NR, Finch CE. Modulation of a novel RNA in brain neurons by glucocorticoid and mineralocorticoid receptors. Neuroendocrinology. 1996;63:28–38. doi: 10.1159/000126932. [DOI] [PubMed] [Google Scholar]
- 22.Takiguchi M, Mori M. Transcriptional regulation of genes for ornithine cycle enzymes. Biochem J. 1985;312:649–659. doi: 10.1042/bj3120649. [DOI] [PMC free article] [PubMed] [Google Scholar]
- 23.Bodine SC, Latres E, Baumhueter S, et al. Identification of ubiquitin ligases required for skeletal muscle atrophy. Science. 2001;294:1704–1708. doi: 10.1126/science.1065874. [DOI] [PubMed] [Google Scholar]
- 24.Son C, Hosoda K, Matsuda J, et al. Up-regulation of uncoupling protein 3 gene expression by fatty acids and agonists for PPARs in L6 myotubes. Endocrinology. 2001;142:4189–4194. doi: 10.1210/endo.142.10.8446. [DOI] [PubMed] [Google Scholar]
- 25.Sugden MC, Orfali KA, Holness MJ. The pyruvate dehydrogenase complex: nutrient control and the pathogenesis of insulin resistance. J Nutr. 1995;125:1746S–1752S. doi: 10.1093/jn/125.suppl_6.1746S. [DOI] [PubMed] [Google Scholar]
- 26.Sugden MC, Holness MJ. Therapeutic potential of the mammalian pyruvate dehydrogenase kinases in the prevention of hyperglycaemia. Curr Drug Targets Immune Endocr Metab Disord. 2002;2:151–165. [PubMed] [Google Scholar]
- 27.Almon RR, Chen J, Snyder G, DuBois DC, Jusko WJ, Hoffman EP. In vivo multi-tissue corticosteroid microarray time series available online at Public Expression Profile Resource (PEPR) Pharmacogenomics. 2003;4:791–799. doi: 10.1517/phgs.4.6.791.22816. [DOI] [PubMed] [Google Scholar]; •• Description of and online access to this dataset.
- 28.Cojocaru G, Friedman N, Krupsky M, et al. Transcriptional profiling of non-small cell lung cancer using oligonucleotide microarrays. Chest. 2002;121:44S. doi: 10.1378/chest.121.3_suppl.44s. [DOI] [PubMed] [Google Scholar]
- 29.Friedman N, Kaminski N. Statistical methods for analyzing gene expression data for cancer research. Ernst Schering Res. Found. Workshop; 2002. pp. 109–131. [DOI] [PubMed] [Google Scholar]
- 30.Kaminski N. Microarray analysis of idiopathic pulmonary fibrosis. Am J Respir Cell Mol Biol. 2003;29:S32–S36. [PubMed] [Google Scholar]
- 31.Lock C, Hermans G, Pedotti R, et al. Gene-microarray analysis of multiple sclerosis lesions yields new targets validated in autoimmune encephalomyelitis. Nat Med. 2002;8:500–508. doi: 10.1038/nm0502-500. [DOI] [PubMed] [Google Scholar]
- 32.Morgan KT, Ni H, Brown HR, et al. Application of cDNA microarray technology to in vitro toxicology and the selection of genes for a real-time RT-PCR-based screen for oxidative stress in Hep-G2 cells. Toxicol Pathol. 2002;30:435–451. doi: 10.1080/01926230290105613. [DOI] [PubMed] [Google Scholar]
- 33.Rhodes DR, Barrette TR, Rubin MA, Ghosh D, Chinnaiyan AM. Meta-analysis of microarrays: interstudy validation of gene expression profiles reveals pathway dysregulation in prostate cancer. Cancer Res. 2002;62:4427–4433. [PubMed] [Google Scholar]
- 34.Tumour Analysis Best Practices Working Group. Expression profiling – best practices for data generation and interpretation in clinical trials. Nat Rev Genet. 2004;5:229–237. doi: 10.1038/nrg1297. [DOI] [PubMed] [Google Scholar]; • Provides a discussion of various probe set algorithms.
- 35.Seo J, Bakay M, Chen Y, Himler S, Shneiderman B, Hoffman E. Optimizing signal/noise ratios in expression profiling, project-specific algorithm selection and detection p value weighting in affymetrix microarrays. Bioinformatics. 2004 doi: 10.1093/bioinformatics/bth280. In Press. [DOI] [PubMed] [Google Scholar]; •• A discussion of the utility of MAS 5.0 probe set algorithm.
- 36.Eisen MB, Spellman PT, Brown PO, Botstein D. Cluster analysis and display of genome-wide expression patterns. Proc Natl Acad Sci USA. 1998;95:14863–14868. doi: 10.1073/pnas.95.25.14863. [DOI] [PMC free article] [PubMed] [Google Scholar]; •• Original description of the gene tree approach for clustering.
Website
- 101.http://microarray.cnmcresearch.org/pgadatatable.asp Microarray Center Homepage.