

Abstract
The consolidation of long-lasting sensory memories requires the activation of gene expression programs in the brain. Despite considerable knowledge about the early components of this response, little is known about late components (i.e., genes regulated 2–6 h after stimulation) and the relationship between early and late genes. Birdsong represents one of the best natural behaviors to study sensory-induced gene expression in awake, freely behaving animals. Here we show that the expression of several isoforms of synapsins, a group of phosphoproteins thought to regulate the dynamics of synaptic vesicle storage and release, is induced by auditory stimulation with birdsong in the caudomedial nidopallium (NCM) of the zebra finch (Taeniopygia guttata) brain. This induction occurs mainly in excitatory (non-GABAergic) neurons and is modulated (suppressed) by early song-inducible proteins. We also show that ZENK, an early song-inducible transcription factor, interacts with the syn3 promoter in vivo, consistent with a direct regulatory effect and an emerging novel view of ZENK action. These results demonstrate that synapsins are a late component of the genomic response to neuronal activation and that their expression depends on a complex set of regulatory interactions between early and late regulated genes.
Keywords: immediate early genes, zenk, egr-1, zif268, ngfi-a, krox-24, neuronal plasticity, memory, auditory, synapse, cycloheximide, learning, zebra finch, songbird
Introduction
Brain activation triggers rapid transcriptional events thought to lead to long-lasting neuronal changes underlying long-term memories. This response comprises direct effectors that exert cellular actions independent of additional RNA/protein synthesis and inducible transcription factors (ITFs) that regulate late target genes (Curran and Morgan, 1985; Sheng and Greenberg, 1990; Nedivi et al., 1993; Lanahan and Worley, 1998; Clayton, 2000; Velho and Mello, 2007). Whereas early gene mapping has been instrumental to the analysis of brain activation by specific stimuli and behaviors (Chaudhuri, 1997; Mello, 2002), late effectors or targets are mostly unknown.
Synapsins are phosphoproteins associated with the synaptic vesicle membrane and thought to modulate different aspects of synaptic transmission (Greengard et al., 1993; Hilfiker et al., 1999). They are encoded by three genes (syn1–syn3) with multiple transcripts (Kao et al., 1999) that have been linked to schizophrenia and sporadic seizures (Chen et al., 2004; Lachman et al., 2005; Cavalleri et al., 2007), and their deletion leads to increased incidence of seizures (Gitler et al., 2004). Changes in syn1 expression occur in the retina after prolonged exposure to an enriched environment (Pinaud et al., 2002) and in the hippocampus during the induction of long-term potentiation or prolonged exposure to stressors (Morimoto et al., 1998a,b; Alfonso et al., 2006; Iwata et al., 2006). Importantly, syn1–syn2 promoters respond to EGR-1 (an ITF, also known as ZENK) in cultured neuronal-like cells (Thiel et al., 1994; Petersohn et al., 1995). Thus, synapsins are candidate ITF targets, but their in vivo regulation in a manner dependent on early protein synthesis has not been shown.
Brain gene regulation by natural stimuli is well documented in songbirds. Stimulation with song, a learned vocal communication signal, induces ITFs (zenk, c-fos, and c-jun) in high-order auditory areas (Mello et al., 1992; Mello and Clayton, 1994; Nastiuk et al., 1994; Bolhuis et al., 2000; Velho et al., 2005), particularly the caudomedial nidopallium (NCM). ITF induction reflects the acoustic properties and novelty of the stimulus and is modulated by attention/arousal, age, and experience (Clayton, 2000; Mello, 2002; Mello et al., 2004; Velho and Mello, 2007). Repeated stimulation habituates the electrophysiological responses of NCM, an effect whose long-term maintenance depends on RNA and protein synthesis during distinct periods after song exposure (Chew et al., 1995). Moreover, mitogen-activated protein (MAP) kinase signaling in NCM is required for ITF expression (Cheng and Clayton, 2004; Velho et al., 2005) and the auditory memorization of tutor song (London and Clayton, 2008). Thus, song-induced gene expression is required for long-lasting neuronal changes and song auditory memories.
We hypothesized that synapsins might be late song-regulated genes. In support, we found that the expression of synapsins in zebra finch NCM increases during song stimulation with a protracted time course compared with early genes. This effect occurs primarily in excitatory neurons and is under a suppressive action by early song-induced proteins. We also show that ZENK protein binds in vivo to the syn3 promoter. Thus, synapsins are an integral late component of the response of the brain to stimulation and a likely late effector of long-lasting changes in responsive neurons.
Materials and Methods
Identification of zebra finch synapsins.
PCR primers (forward, 5′ccgcacaccgactgggccaa3′; reverse, 5′gtcctcatgtargccttgtagt3′) were designed based on a conserved domain within synapsin 2 (syn2) mRNA sequences from several species in GenBank. Standard touchdown PCR reaction was performed with DNA from a zebra finch cDNA library (Holzenberger et al., 1997; Denisenko-Nehrbass et al., 2000) with annealing temperatures starting at 63°C minus 1° per cycle for eight cycles and 22 additional cycles at 55°C. The amplified product was excised from an agarose gel, eluted using Qiagen Gel Extraction kit, inserted into pPCRScript (Stratagene), and used to transform bacterial cells following standard procedures. Insert identity was confirmed by sequencing and analysis using DNAStar software. This amplified cDNA (GenBank accession number AY494948) (Fig. 1A) does not discriminate between the two syn2 isoforms. We also identified a set of expressed sequence tags (ESTs) representing syn2 from an EST collection derived from a normalized zebra finch brain cDNA library [ESTIMA collaborative consortium; see http://titan.biotec.uiuc.edu/songbird and Replogle et al. (2008)]. These ESTs comprised a contig (PTA_05.6657.C1.Contig7234) encompassing most of the shared sequences of syn2a and syn2b.
Figure 1.

The syn2 and syn3 zebra finch homologs. A, Top, Structure of the syn2 gene in the zebra finch; middle, syn2a and 2b transcripts. B, Top, Structure of the syn3 gene in the zebra finch; middle, syn3 transcript. In A and B, numbers denote exons in the gene, and the introns are not to scale. The lines underneath the transcripts indicate the various ESTs, contigs, and PCR products used to derive the gene structure, as detailed in Materials and Methods (with their corresponding GenBank and ESTIMA accession numbers), and the bottom lines represent scales in kilobases. UTR indicates the 5′ and 3′ untranslated regions. Notice the nested timp genes between exons 5 and 6 in both genes. The clones used for generating riboprobes for expression analysis are indicated by the gray bars above the syn2 and syn3 transcripts. The ESTIMA contig SB.929.C1.Contig 1194 comprises GenBank clones CK234869, DV578985, DV578986, EE052418, and FE720186, and the contig PTA_05.6657.C1.Contig7234 comprises GenBank clones CK301417, DV575423, DV578986, DV579637, DV582237, DV582235, DV584065, DV584055, DV584061, DV584057, DV584063, and DV584062. C, D, Northern blots of total zebra finch brain RNA hybridized with 33P-labeled syn2, syn2a/syn2b (C), and syn3 (D) antisense riboprobes. Molecular sizes of RNA markers are indicated on the left; arrows point to synapsin transcripts.
A partial cDNA representing the zebra finch synapsin 2a isoform (Fig. 1A, syn2a) was PCR amplified from the same cDNA library using a forward primer (5′gccggcatccccagcgtcaact3′) based on exon 4 sequence from the previously obtained syn2 clone (GenBank accession number AY494948) and a reverse primer (5′tgaaagctgtgggtgcgactgagg3′) based on a conserved domain within exon 13 from sequences of several species. The resulting amplification product was cloned and analyzed as above (GenBank accession number FJ004640). Additional syn2a clones obtained from ESTIMA comprise a contig (SB.929.C1.Contig 1194). One of the ESTs (GenBank accession number CK234869) within this contig contains a poly(A) tail, indicating we have identified the complete 3′ untranslated region (UTR) of this isoform. Partial ESTIMA cDNAs representing the zebra finch synapsin 2b (Fig. 1A, syn2b) isoform (GenBank accession numbers CK301417 and CK303619) were also identified. The EST CK303619 contains a poly(A) tail, indicating we have identified the complete syn2b 3′ UTR.
PCR primers for syn3 (Fig. 1B) were designed based on conserved domains within syn3 mRNA sequences from several species available in GenBank for exons 2 and 13 (forward 330, 5′ccaggggaagaaggtgaatg3′; reverse 1728, 5′cagaaaacaggctagcaaatgat3′). PCR amplification and cloning of the resulting fragment (GenBank accession number FJ004639) were performed as described above for syn2. Three additional cDNA clones representing mostly the 5′UTR and 3′UTR regions of the zebra finch syn3 homolog (GenBank accession numbers DV949224, CK305874, and CK305733) were also identified in ESTIMA. Importantly, clone CK305733 had a poly(A) tail, confirming this region as the likely 3′ end of the transcript.
We used the sequences derived from the PCR-amplified clones and from ESTIMA clones to assemble full-length transcript sequences for all three synapsin isoforms. These sequences were then used for Blast (basic local alignment search tool) searches of the zebra finch genomic trace archives, which were then assembled to reconstruct the complete syn2 and syn3 genes (the trace archive data were produced at the Genome Sequencing Center at Washington University School of Medicine, St. Louis). We also amplified a syn2a-specific fragment (Fig. 1A, syn2a, gray bar over exons 12 and 13) using a forward primer based on the 3′ end of the shared region of syn2a and syn2b (Fig. 1A, syn2 gene, gray portion of exon 11) (5′agccaaacaaaatcccacctcag3′) and a reverse primer based on exon 13 (5′ggactgcgacttgaaagctgtg3′), which is present in the syn2a isoform only. Sequence from one EST (GenBank accession number CK301417) was used to PCR amplify a 200 bp syn2b-specific fragment (Fig. 1A, syn2b, gray bar over exon 11). These isoform-specific fragments were cloned into PCRScript and used to generate isoform-specific riboprobes for Northern and in situ hybridization (ISH). GenBank clone AY494948 was used to generate a nondiscriminating syn2 probe. For syn3, we used riboprobes derived from GenBank clone DV949224 for Northern analysis and from clones DV949224 and FJ004639 for in situ hybridizations (Fig. 1B, syn3, gray bars); probes from both clones gave essentially the same results. We note that both clones are very distant from the 3′ UTR end of clone CK305733, which has a partial overlap with Fbox7; thus, our syn3 riboprobes did not overlap with Fbox7.
Probe labeling.
Riboprobes were used for in situ hybridization and Northern blot analyses. Plasmid DNA was isolated using Qiagen Miniprep kit, linearized with the appropriate restriction enzymes, and purified with Qiagen PCR Purification kit. Sense and antisense 33P-labeled riboprobes for all genes analyzed in this study were synthesized as described previously (Mello et al., 1997). The hat2 probe was derived from the previously described canary homolog (George and Clayton, 1992). For digoxigenin-(DIG)-labeled riboprobes, we added 1.0 μl of DIG labeling mix (Roche Diagnostics) to a 10 μl reaction containing 1 μg of linear plasmid DNA, 10 μg of BSA, 10 mm DTT, 20 U of RNase inhibitor, 8–10 U of RNA polymerase, and 2.0 μl of a transcription buffer consisting of 50 mm DTT, 250 mm Tris-HCl, pH 7.4, 30 mm MgCl2, 50 mm NaCl, and 10 mm spermidine in DEPC-treated water; otherwise, we followed the procedure of Mello et al. (1997). All riboprobes were purified in Sephadex G-50 columns and analyzed using a liquid scintillation counter or by visual inspection of a denaturing formaldehyde–agarose gel.
Northern blot analysis.
Total RNA from adult zebra finch brain was extracted using the Trizol method (Invitrogen) and quantified by spectrophotometry. Ten micrograms of total RNA were separated by electrophoresis in 1% 3-(N-morpholino)-propanesulfonic acid/formaldehyde agarose gel and transferred with 10× SCC to nylon membranes (Hybond-N+; GE Healthcare) as described in detail previously (Mello et al., 1997). The membranes were incubated overnight in hybridization solution containing 33P-labeled antisense riboprobes for syn2, syn2a, syn2b, or syn3 (106 cpm/ml), followed by washes at 65°C and exposure to a KODAK storage phosphorscreen (Molecular Dynamics), which was read by a PhosphorImager (Typhoon 8600; Molecular Dynamics).
Birds and song stimulation.
All birds in this study were adult zebra finches (Taeniopygia guttata) from our own breeding colony or obtained from local breeders. For song stimulation, females were first isolated overnight (16–20 h) in sound-attenuated chambers (∼76 × 31 × 28 cm) under a 12 h light/dark cycle (same as the aviary; lights on at 7:00 A.M.). On the following day, birds were exposed to a playback of a recorded stimulus consisting of a medley of three representative nonfamiliar conspecific songs presented in blocks of 15 s followed by a 45 s silent interval. For ISH (see below), birds were either exposed to this stimulus for 30 min and killed after varying survival intervals (see Fig. 3A) or exposed to different stimulus durations and were immediately killed (see Fig. 4A). For Western blots, birds were stimulated for 30 min and killed at 6 h after stimulus onset. For chromatin immunoprecipitation (ChIP) assays, birds were stimulated for 30 min and killed 2 h after stimulus onset. All stimuli were presented at comparable intensities (average of 70 dB, mean sound pressure level at 35 cm from the speaker). Females were used in all quantitative song stimulation experiments to avoid the confound of singing behavior in males; controls consisted of birds that were not stimulated. We also analyzed the general brain expression of synapsins in a separate set of adult males (n = 3). All procedures involving birds were approved by Institutional Animal Care Use Committee of Oregon Health and Science University and are in accordance with National Institutes of Health guidelines.
Figure 3.
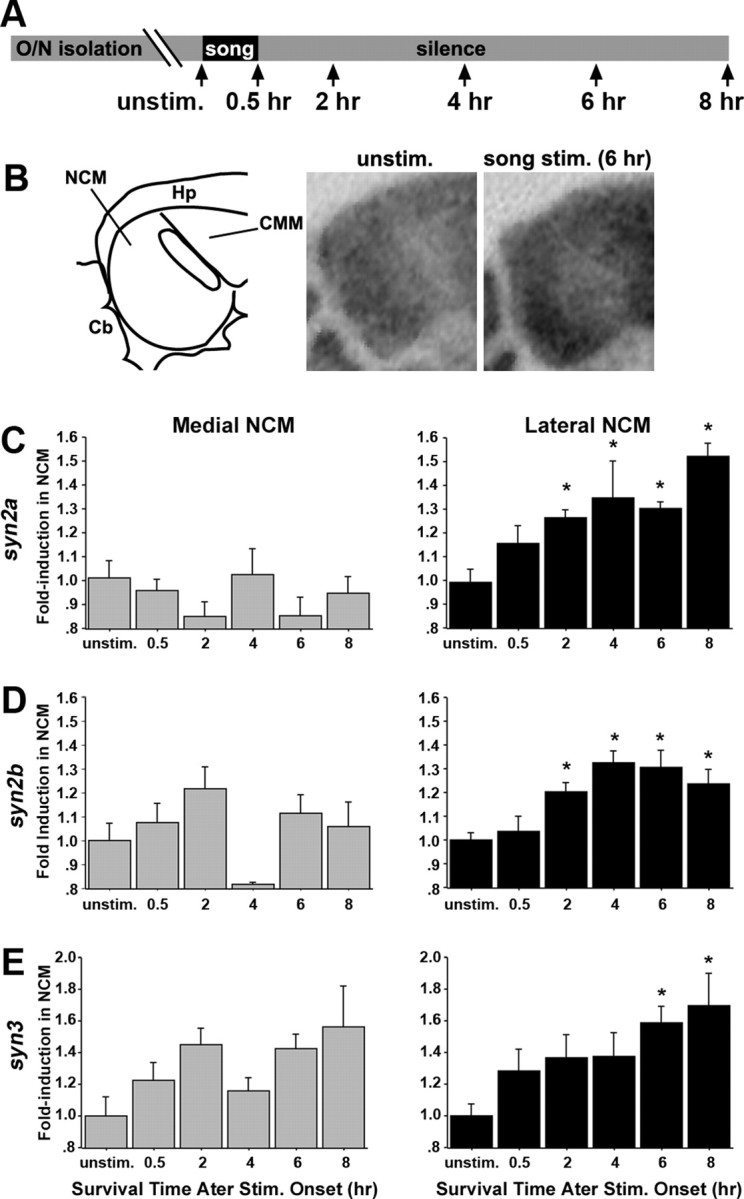
Song regulation of the expression of synapsins in NCM. A, Schematic representation of the experimental design; arrows indicate time the animals were killed. B, Left, Camera lucida drawing of caudal portion of a parasagittal brain section at the level of NCM (∼800 μm from the midline); right, x-ray film autoradiograms of in situ hybridization at the level shown in the left drawing, depicting syn2a induction at 6 h after the onset of song stimulation. C–E, Fold induction values of syn2a (C), syn2b (D), and syn3 (E) in the NCM of birds stimulated for 30 min and killed at various time points after stimulus onset compared with unstimulated controls. Optical density measurements were normalized against values from the NCM from unstimulated controls; n = 3–6 birds per group. Plotted are means ± SEM from adult females. Medial and lateral NCM correspond to ∼400 and 800 μm from the midline respectively. Cb, Cerebellum; CMM, caudomedial mesopallium; Hp, hippocampus; O/N, overnight; unstim., unstimulated controls. Asterisks indicate statistically significant differences; for values, see Results.
Figure 4.

Expression of synapsins in birds exposed to increasing periods of stimulation. A, Schematic representation of the experimental design; arrows indicate time the animals were killed. B–D, Fold induction values of syn2a (B), syn2b (C), and syn3 (D) in the NCM of birds stimulated for various stimulus durations and killed immediately thereafter. Optical density measurements were normalized against values from the NCM of unstimulated controls; n = 3–6 birds per group. Measurements for the 2 h time point at medial levels for syn2a (B) and syn3 (D) are not included because of accidental loss of material. Plotted are means ± SEM from adult females. Medial and lateral NCM correspond to ∼400 and 800 μm from the midline, respectively. O/N, Overnight; unstim., unstimulated controls. Asterisks indicate statistically significant differences; for values, see Results.
Stereotaxic microinjections of cycloheximide.
We performed intracerebral injections in awake restrained birds essentially as described by Velho et al. (2005), with some modifications. Briefly, the birds were first anesthetized with 50 μg/g sodium pentobarbital and placed in a stereotaxic apparatus containing a bird skull pin slide adapter (MyNeuroLab). A metal fixation pin was affixed to the skull using Tylok-Plus dental cement (Dentsply International), and a window was partially opened by removal of the superficial layer of bone over NCM. Birds were allowed to recover for at least 48 h. The birds were then restrained within a plastic tube and fixed to the stereotaxic apparatus by inserting the implanted metal pin into the pin adapter. The remaining layer of bone was removed, a glass pipette was lowered into NCM (anteroposterior, 0.5 mm; mediolateral, 0.65 mm; dorsoventral, 1.2 and 1.6 mm), and 2 μg/μl cycloheximide (CYC), a dose previously proven to effectively block protein expression in NCM (Chew et al., 1995), was injected (50 nl/site over 2 min) into one hemisphere and vehicle (VEH) in the contralateral hemisphere, using a microinjector (Narishige International). To facilitate the identification of the injection site, the pipettes were coated with fluorescent latex beads (Lumafluor).
Injected birds were divided into two sets: song stimulated and unstimulated controls. Song-stimulated birds were injected with CYC into one hemisphere and VEH into the other, then stimulated with song, and killed at 6 h after stimulation onset. Unstimulated controls were also injected CYC and VEH into the NCMs but did not receive any auditory stimulation. The drugs assigned to each hemisphere were alternated across birds.
Acclimation sessions.
To minimize procedural induction of activity-dependent genes in the brain for the brain microinjections, the birds were subjected to several acclimation sessions after recovering from the pin implant surgery for at least 24 h. Each session consisted of gently restraining a bird, fixing it through the attached pin to the adapter in the stereotaxic apparatus, maintaining it in the apparatus for 10 min (in the presence of a researcher), and returning it to the isolation box. Typically, we performed four such sessions (once every 2 h) on the day preceding the brain microinjections and one last session on the day of the injections. In addition, the birds were kept in acoustic attenuation boxes at all times after the pin implants, except during the acclimation sessions and during microinjections. Both the acclimation and microinjections were performed in a sound-attenuated room with minimal sound exposure.
Tissue preparation.
For in situ hybridization and Western blots, birds were killed by decapitation. Their brains were quickly dissected from the skull, frozen in Tissue-Tek (Sakura Finetek in a dry ice/isopropanol bath, and stored at −80°C. Parasagittal 10 μm brain sections were cut on a cryostat, thaw-mounted onto slides, and stored at −80°C until use. For ChIP assays, sound-stimulated birds (n = 3) were killed with an overdose of Nembutal and perfused transcardially with freshly prepared 1% paraformaldehyde in 0.1 m phosphate buffer, pH 7.4. The brains were then removed from the skull, and the caudomedial telencephalic auditory lobules [including the NCM and caudomedial mesopallium (CMM) and medial field L2a] were dissected and frozen.
Radioactive ISH.
ISH was performed using 33P-labeled sense and antisense riboprobes followed by exposure to a KODAK PhosphorImager screen, autoradiography with x-ray film (BioMax MS; Eastman Kodak), or emulsion autoradiography and Nissl counterstaining. The hybridizations and washes for all probes analyzed were performed at 65°C, using essentially the same procedure as described previously (Mello et al., 1997). Syn3 ISH sections were treated with RNase A (1 μg/ml) as described previously (Mello et al., 1997).
Double ISH and fluorescent in situ hybridization.
We used a double-labeling procedure combining ISH (for syn2a) and fluorescent ISH (FISH) (for syn2b or for the GABAergic marker gad65), followed by nuclear counterstaining (Hoechst). We followed the double-labeling procedures described by Velho et al. (2005) and Jeong et al. (2005).
Densitometry.
PhosphorImager files were quantified using NIH Image software. The slide background was subtracted from optical density measurements taken over specific brain regions, and the resulting values were averaged for two adjacent sections. For normalization, all densitometric values were divided by the average values from unstimulated controls. To examine the effect of poststimulation survival time, stimulus duration, and drug treatment, we used ANOVA followed by Fisher's protected least significant difference (PLSD) post hoc tests for pairwise comparisons and a probability level of <0.05 for significance.
Cell counts.
For quantitative analysis of our double ISH and FISH experiment, we used Neurolucida software (MicroBrightField) and estimated the number of labeled cells in specific areas of brain sections through lateral NCM (∼800 μm from the midline) of song-stimulated birds and unstimulated controls (n = 3–6 per group). We first placed a counting square of 200 × 200 μm over dorsal or ventral NCM, equidistant from the rostral and the caudal boundaries of NCM (L2a and the ventricle, respectively), or over the hippocampus. We then centered a counting circle (12 μm diameter) over each cell nucleus, identified based on the nuclear (Hoechst) counterstaining and excluding cells with clearly non-neuronal staining (small, homogeneously and strongly labeled nuclei). We next counted the number of emulsion autoradiography grains per labeled cell. We note that the typical nuclear diameter of most cells counted was in the 6–10 μm range and that the diameter of the counting circle was determined to be inclusive of the majority of grains associated with the cells. Cells with grain counts of at least 2 SDs above background levels (measured over the glass or over the neuropil between labeled somata) (see Fig. 4) were considered syn2a positive. Finally, we examined the mapped field under the appropriate fluorescence filter to determine how many syn2a-positive (emulsion autoradiography signal) cells were also labeled for syn2b or gad65 (fluorescence signal). We did not observe evidence of regional differences in the number of cells in NCM; thus, dorsal and ventral measurements were averaged.
Western blots.
The auditory lobules of song-stimulated or unstimulated control birds (two adult females per group) were separately homogenized in lysis buffer (25 mm Tris-HCl, pH 7.5, 1 mm EDTA, 10 mm DTT, and 0.5% Triton X-100) plus 1× proteinase inhibitor (Calbiochem), and 30 μg of protein per sample were separated by SDS-PAGE and transferred to nylon membranes (Novax). The membranes were then incubated for 1 h in blocking buffer (BB) [consisting of 5% dry milk in TBST (25 mm Tris, pH 7.4, 3.0 mm KCl, 140 mm NaCl, and 0.05% Tween 20)], incubated overnight at 4°C with a mouse anti-synapsin 2 antibody raised against amino acid 348–449 of the human Syn2 (1:500 dilution in BB; Novus Biologicals) or a mouse anti-actin antibody (1:500 dilution; Millipore Bioscience Research Reagents), washed three times for 10 min in TBST buffer, incubated for 2 h with a peroxidase conjugated goat anti-mouse IgG antibody (1:10,000 dilution in BB; Kirkegaard and Perry Laboratories), and washed three times for 10 min in TBST buffer. Incubations and washes were all performed at room temperature. Protein expression was detected by chemiluminescence (Pierce) autoradiography. The resulting autoradiograms were analyzed by densitometry (integrated optical density measurements using NIH ImageJ), and results were expressed as ratios of values obtained for individual bands from song-stimulated birds divided by values obtained from unstimulated controls.
Promoter analysis.
The syn3 promoter was assembled by sequentially retrieving and assembling sequences from the zebra finch genomic trace archives (National Center for Biotechnology Information, Genomic Biology, Bethesda, MD) using Seqman software (DNAStar). We reconstructed a genomic region of ∼2.0 kb corresponding to the 5′ end of the syn3 transcript and the upstream promoter region. The presence of putative transcription factor binding sites was examined based on matrix analysis (Transfac 8.0) using MatInspector software (Genomatix). A comparable region could not be retrieved from the trace archives for the syn2 gene.
ChIP assay.
The microdissected auditory lobules (n = 3 song-stimulated adult females) were processed using a commercial ChIP kit (Upstate), following the instructions of the manufacturer. Briefly, the tissue samples (typically 20 mg wet weight per bird) were homogenized in SDS lysis buffer (at a 10-to-1 buffer-to-tissue volume ratio) containing a protease inhibitor mix (Complete Mini mix at 1× concentration; Roche Diagnostics) with a microtube pestle and incubated on ice for 10 min. Chromatin shearing was then performed by sonicating the samples in bursts (six times for 15 s) at 35% power, a protocol we determined previously to result in ∼1–2 kb average DNA size in our samples. The homogenates were spun at 17,000 × g for 10 min, and the supernatants were separated, diluted further, and precleared by agitation for 30 min with the protein A/agarose/salmon sperm DNA slurry. The samples were then immunoprecipitated overnight with 10 μg of goat anti-Egr-1 (ZENK) sc-189 or mouse anti-parvalbumin antibodies (Santa Cruz Biotechnology), followed by incubation for 1 h with the protein A/agarose/salmon sperm DNA slurry. After washes, the immunoprecipitated chromatin was eluted, de-cross-linked by incubation in 0.2 m NaCl for 4 h, and treated with proteinase K for 1 h at 45°C. The resulting DNA samples were then isolated using the Qiagen PCR purification kit. All steps up to the elution were performed at 4°C; additional details were performed according to the recommendations of the manufacturer. The immunoprecipitation was verified by spectrophotometric analysis of the resulting DNA product. Additional analysis was performed by performing PCR amplification with primers for the promoter regions of syn3 (forward, 5′ggaggaagggcagaaaagtgtcat3′; reverse, 5′gtgggaagagaatcaaagaaat3′, corresponding to a 523 bp fragment between positions −508 and +15 of the promoter sequence relative to the putative transcription start site) and eno2 (forward, 5′ggtctccctcccctgctgtctgt3′; reverse, 5′ttcccctttcactgccctcttctg3′, corresponding to a 498 fragment within the promoter region). ChIP specificity was determined by comparing the products of DNA precipitated with the different antibodies used.
Results
Identification of zebra finch synapsins
The zebra finch syn2 homolog contains 13 exons and a timp4 gene nested between exons 5 and 6 (Fig. 1A), thus resembling closely the structure of its mammalian counterparts. We identified transcripts corresponding to two isoforms, syn2a and syn2b (Fig. 1A). Similar to mammals, these transcripts are likely derived through a combination of alternative termination and differential splicing from a common gene. The syn2a mRNA includes all 13 exons, whereas syn2b contains a longer exon 11 but lacks exons 12 and 13 (Fig. 1A). Despite the longer coding sequence of syn2a, the 3′ UTR is much shorter in syn2a than in syn2b. Thus, the predicted sizes of these transcripts are ∼2.9 and 3.9 kb, respectively. The predicted amino acid residue composition compared with chicken, human, and rat homologs, respectively, shows 92.7, 76.1, and 75.1% identity for syn2a (supplemental Fig. S1A, available at www.jneurosci.org as supplemental material) and 97.1, 83, and 81.5% identity for syn2b (supplemental Fig. S1A,B, available at www.jneurosci.org as supplemental material). Interestingly, syn2a shows low conservation in the proline-rich domain (between residues 464 and 526 in supplemental Fig. S1A, available at www.jneurosci.org as supplemental material).
The zebra finch syn3 gene also had a conserved organization compared with mammals, consisting of 13 exons and including a timp3 gene nested between exons 5 and 6 (Fig. 1B). This gene encodes a long transcript (predicted at ∼8.8 kb) with a very long (∼6 kb) 3′ UTR (Fig. 1B). Interestingly, ESTs representing Fbox7, a gene located in the opposite orientation in the genomic sequence of both zebra finch and chicken, show partial overlap with the 3′ end of clone GenBank CK305733, suggesting that a small domain may be shared between these two transcripts (data not shown). The predicted Syn3a protein shows 93.1, 78.6, and 77.9% identity with the chicken (based on genomic sequence), human, and rat homologs, respectively (supplemental Fig. S2, available at www.jneurosci.org as supplemental material).
Northern blot analysis using a riboprobe that targets the common region of the syn2a and syn2b isoforms (GenBank clone AY494948) revealed two transcripts (of ∼2.6 and ∼3.6 kb), with higher expression of the longer one (Fig. 1C). The syn2a- and syn2b-specific probes, however, recognized, respectively, the shorter and longer transcripts, consistent with the sizes predicted from their sequences (Fig. 1A). Northern blot analysis for syn3 revealed a single transcript of ∼8.8 kb (Fig. 1D), consistent with the prediction of a single large transcript.
Comparative analysis between avian (zebra finch and chicken) and mammalian genomic sequences revealed high conservation in the regions adjacent to syn2 and syn3, including large sinteny groups for both genes (data not shown), supporting the conclusion that we have identified their true homologs. In contrast, despite extensive searches of chicken and zebra finch genomic sequences with coding and noncoding sequences from several species, we did not obtain any significant hits for syn1, strongly suggesting that birds may lack this gene (our unpublished observation). In support of this possibility, the syn1 gene is typically ∼40–50 kb in other species, and it seems highly unlikely that such a large fragment is missing from the completed genomic sequences of two different organisms. Furthermore, a group of genes adjacent to the syn1 locus and comprising a synteny group in mammals and lizards also appear to be missing in avian genomes. For example, searches for the timp1 and a-raf1 genes, which are, respectively, nested within and in close proximity to the syn1 locus in all other vertebrates studied to date, had no hits in both avian genomes available.
Expression of synapsins in the zebra finch brain
We next examined the regional and cellular expression of synapsins in the brain of adult zebra finches, the first such analysis in an avian species. We observed broad distributions for syn2a and syn2b (Fig. 2B,C, respectively), including pallial areas (nidopallium, mesopallium, and hyperpallium) and granule cell layer of the cerebellum, but much lower expression in the striatum and arcopallium, as well as in the auditory thalamo-recipient zone field L2a and the magnocellular nucleus of the lateral nidopallium compared with the surrounds (Fig. 2B,C, bottom panels). The two isoforms had similar distributions, but syn2b expression was higher than syn2a, consistent with the Northern blot analysis. The syn3 transcript had lower expression than syn2 and also had a broad but primarily uniform distribution (Fig. 2). Sense probes for all transcripts did not yield detectable hybridization.
Figure 2.

Expression of synapsins in the zebra finch brain. A, Camera lucida drawings of parasagittal brain sections at the level of NCM (top; ∼800 μm from the midline) and at the level of the song control system (bottom; ∼1800 μm from the midline). B–D, x-Ray film autoradiograms depicting the expression of syn2a, syn2b, and syn3, respectively. E–G, High-magnification bright-field view of emulsion autoradiography depicting cellular expression of syn2a and syn2b in NCM and the lack of syn2b expression in the ventricle wall, respectively. H, High-magnification view of double in situ hybridization for syn2a (emulsion grains) and syn2b (red fluorescence); white arrows point to double-labeled cells, and red arrow indicates a single-labeled syn2b-positive cell. I, Emulsion autoradiography showing cellular expression of syn3 in NCM. Small arrows indicate syn3-positive neurons, large arrows indicate syn3-negative neurons, and arrowheads indicate non-neuronal cells. A, Arcopallium; Bas, nucleus basorostralis; Cb, cerebellum; DLM, medial part of the dorsolateral thalamic nucleus; GP, globus pallidus; H, hyperpallium; HVC, nucleus HVC of the nidopallium; L2a, subfield L2a of field L; LMAN, lateral magnocellular nucleus of the anterior nidopallium; M, mesopallium; N, nidopallium; NCM, caudomedial nidopallium; NM nucleus magnocellularis; OT, optic tract; Ov, nucleus ovoidalis; RA, robust nucleus of the arcopallium; Rt, nucleus rotundus; St, striatum; X, area X of the medial striatum. Scale bars, 10 μm.
Cellular analysis in NCM demonstrated syn2a and syn2b expression in cells with neuronal-like features, such as large nucleus, clear nucleolus, and Nissl substance (Fig. 2E–G, arrows), whereas smaller cells with dark, homogeneously staining nuclei that represent glial and blood cells were clearly negative (Fig. 2E, arrowheads), as were also the cells in the ventricular ependyma and in the subventricular zone (Fig. 2G, arrowheads). Double-labeling ISH revealed that the majority of cells (∼67%; n = 3 females) coexpress syn2a and syn2b (Fig. 2H, white arrows), but single-labeled cells could also be seen (Fig. 2H, red arrow). For syn3, we also observed both positive and negative neuronal cells (Fig. 2I, small and large arrows, respectively), whereas glial-like cells were clearly negative (Fig. 2I, arrowheads).
Song stimulation increases synapsin expression in NCM
To determine whether synapsins are regulated by song, we examined their expression in parasagittal sections through medial and lateral NCM (∼0.4 and 0.8 mm from the midline) from birds stimulated for 30 min and killed at different poststimulation times (Fig. 3A), using isoform-specific probes. Birds stimulated with conspecific song showed higher expression of synapsins when compared with unstimulated controls (Fig. 3B, representative example of syn2a in lateral NCM). Quantitative autoradiography showed that syn2a is significantly induced in lateral NCM (ANOVA, p < 0.01; n = 4–6 per group) at 2, 4, 6, and 8 h after the start of a 30 min song stimulation period compared with unstimulated controls (Fisher's PLSD, p < 0.05, p < 0.01, p < 0.01, and p ≤ 0.001, respectively) (Fig. 3C, right). In contrast, we observed considerable variability that did not reach significance in medial NCM (ANOVA, p = 0.50) (Fig. 3C, left). Similarly, syn2b was significantly induced in lateral NCM (ANOVA, p < 0.01) at 2, 4, 6, and 8 h after the start of the song stimulation compared with controls (Fisher's PLSD, p < 0.01, p ≤ 0.05, p < 0.001, and p ≤ 0.05, respectively) (Fig. 3D, right) but not in medial NCM (ANOVA, p = 0.11) (Fig. 3D, left). The expression of syn3 also increased in lateral NCM (ANOVA, p < 0.05) (Fig. 3E, right) but was significantly higher than controls only at 6 and 8 h after stimulation onset (Fisher's PLSD, p < 0.05 and p ≤ 001, respectively); a similar trend in medial NCM did not reach significance (ANOVA, p = 0.06) (Fig. 3E, left). In summary, song induces the expression of synapsins primarily in lateral NCM, with a protracted time course compared with early inducible genes.
We also examined birds killed immediately after hearing song for various time durations compared with unstimulated controls (Fig. 4A). We observed significant increases in syn2a expression in lateral NCM (ANOVA, p < 0.01; n = 4–6 per group) (Fig. 4B, right) after stimulation for 0.5, 2, 4, 6, and 8 h (Fisher's PSLD, p < 0.05, p < 0.05, p < 0.05, p < 0.001, and p < 0.018, respectively) but again not in medial NCM (ANOVA, p = 0.76) (Fig. 4B, left). These results resembled closely those of the previous experiment in which all birds were stimulated for the same duration (0.5 h) (Fig. 3C), suggesting that stimulus duration has little or no effect on syn2a expression levels. Indeed, we detected no significant effect of stimulation protocol (fixed vs variable stimulus duration) when the data from both experiments were analyzed together (ANOVA, p = 0.63). Thus, syn2a expression levels in lateral NCM are primarily determined by the first 30 min of song stimulation. In contrast, analysis of these birds showed no significant induction of syn2b mRNA in either medial or lateral NCM (Fig. 4C) (ANOVA, p = 0.65 and p = 0.15, respectively), although a trend to higher levels could be observed in lateral NCM of birds that heard song for 4 h. Finally, syn3 expression did not significantly increase or show such a trend after prolonged stimulation periods when compared with unstimulated controls in either medial or lateral NCM (ANOVA, p = 0.76 and p = 0.79, respectively) (Fig. 4D). This observation indicated a difference in syn3 regulation related to the stimulation protocol. Indeed, we observed an effect of stimulation protocol (fixed vs variable stimulus duration) when the syn3 data for lateral NCM from both experiments (compare Figs. 3E, right and 4D, right) were analyzed together (ANOVA, p < 0.05). Thus, although syn3 is clearly induced with a protracted time course by a short (30 min) stimulation period, additional stimulation appears to suppress the initial inductive effect of song. Finally, in accordance with the known lack of hat2 induction by song, we observed no evidence of regulation of that transcript in either the time course or differential duration experiments (data not shown).
Song induces synapsin changes in a specific cell population
To examine the neurochemical identity of the cells in which synapsins are induced, we performed double ISH for syn2a and the GABAergic marker gad65 in sections from birds killed at different times after the start of a 30 min stimulation period (n = 4–6 per group). We first determined that there was a significant effect of song stimulation on the number of syn2a-positive cells in NCM (ANOVA, p < 0.05). We then found that the number of syn2a-positive cells that were also gad65 positive (presumably GABAergic neurons) did not change significantly with stimulation (ANOVA, p = 0.53) (Fig. 5B). In contrast, the number of syn2a-positive cells that were gad65 negative increased significantly in song-stimulated birds compared with unstimulated controls (ANOVA, p < 0.01) (Fig. 5A) at 6 h (Fisher's PLSD, p < 0.01); we have repeated this analysis (double in situ hybridization followed by cell counts of emulsion autoradiography sections) three times and obtained essentially the same results. Thus, the increased synapsin expression in NCM appears to occur predominantly in gad65-negative cells. A molecular probe for excitatory neurons is currently unavailable in songbirds. We note, however, that gad65-positive cells likely account for the majority of GABAergic cells in NCM (Pinaud et al., 2004, 2006, 2008b) and that gad67, the other major GABAergic cell marker, usually represents a small population that primarily overlaps with gad65 expression. In addition, glycinergic transmission might occur in NCM, but the most likely source of this transmitter is in the brainstem, as occurs in other vertebrates. Thus, we consider it reasonable to assume that the gad65-negative cell population showing increased synapsin expression is composed primarily of excitatory (glutamatergic) neurons. The number of syn2a-expressing neurons, regardless of their neurochemical identity, did not change in the adjacent hippocampus (ANOVA, p = 0.89 and p = 0.21, respectively) (Fig. 5C,D), indicating a regional specificity for the effect observed in NCM.
Figure 5.

Changes in syn2a-expressing cells after song stimulation. A, B, The number of syn2a-expressing NCM cells that were gad65 negative (A) or positive (B) counted in birds killed after several intervals after the onset of a 30 min song stimulation period. C, D, The same cells were counted in the hippocampus (C and D, respectively). Plotted are means ± SEM from adult females. Asterisks indicate statistically significant differences; for values, see Results.
Synapsin proteins are induced by song
To investigate whether synapsin proteins are regulated by song stimulation, we examined Syn2 expression on a Western blot of microdissected auditory lobules with an anti-synapsin 2 antibody. We detected two bands (∼70 and ∼58 kDa), likely representing the polypeptides encoded by syn2a and syn2b, respectively. A comparison of unstimulated and song-stimulated birds showed an apparent increase in both isoforms in the samples from song-stimulated birds, indicating an increase in synapsin proteins (Fig. 6A) and consistent with our findings at the mRNA level. Such a marked effect was not apparent for actin on the same blots (Fig. 6B), arguing against a systematic difference in gel loading. A densitometric analysis of our duplicate samples revealed an average 1.98-fold difference for Syn2a and 1.55-fold difference for Syn2b between samples from song-stimulated birds over unstimulated controls, whereas there was only a 1.18-fold group difference for actin, providing support for our qualitative observations. We note that a recent study using a proteomics approach (Pinaud et al., 2008a) also found evidence of song regulation of one synapsin peptide, which we interpret to have been Syn2a, based on molecular weight.
Figure 6.

Song-induced changes in Syn2 proteins. Western blot of protein extracts from dissected auditory lobules from unstimulated controls and birds stimulated for 30 min and killed 6 h after stimulus onset, immunostained using anti-synapsin (A) and anti-actin (B) antibodies. Molecular sizes of protein markers are indicated on the left. Arrows indicate Syn2a (top arrow) and Syn2b (bottom arrow) proteins.
Synapsins expression in NCM is regulated by early song-induced gene expression
The song-induced regulation of synapsins is delayed compared with the expression kinetics of known early song-induced transcription factors (which peak 30 min after stimulus onset) (Mello and Clayton, 1994; Velho et al., 2005), consistent with the hypothesis that the expression of synapsins in NCM might be under the regulatory control of early song-induced genes. To test this hypothesis, we examined whether the protein synthesis inhibitor CYC injected locally into NCM before a 30 min song stimulation period would affect song-induced synapsin expression in birds killed 6 h after the start of the stimulation (Fig. 7A). We targeted the injections to medial NCM (∼500 μm from the midline) because this region shows a very robust expression of early song-inducible genes. We observed significant effects of drug treatment (higher expression in CYC- than VEH-injected hemispheres) for both syn2a and syn3 in song-stimulated birds (ANOVA, p < 0.05, and paired t test, p < 0.01; n = 5 birds per group) (Fig. 7B,C, right columns) but not in unstimulated controls (ANOVA; p = 0.36) (Fig. 7B,C, left columns). Consistent with the previous data (Fig. 3D, left), we did not observe an effect on syn3 expression at a very medial NCM level (∼200 μm from the midline) (Fig. 7D), arguing for the regional specificity of the CYC effect (Fig. 7C). Importantly, the early song-responsive gene Arc was induced in NCM of both cycloheximide- and vehicle-injected hemispheres (ANOVA, p = 0.01 and p = 0.03, respectively) (Fig. 7E), indicating that the early mRNA induction response to song was undisturbed by the local CYC injection and suggesting that the observed effects were specific for late song-regulated genes. In summary, the early genomic response to song appears to have a suppressive effect on the song-induced expression of synapsins in NCM.
Figure 7.

The regulation of synapsins by song is protein synthesis dependent. A, Schematic representation of the experimental design; left arrow indicates time of NCM injections, and right arrow points to time the animals were killed. B–E, Fold induction values of syn2a (B), syn3 (C, D), and Arc (E) in vehicle- and cycloheximide-injected hemispheres from unstimulated controls and from birds stimulated with song for 30 min and killed at 6 h after stimulus onset. D depicts expression levels away (medially) from the injection sites. Plotted are means ± SEM from adult females. Asterisks indicate statistically significant differences; for values, see Results.
ZENK binds to the synapsin 3 promoter
To further investigate the regulation of synapsins, we examined the promoter region of syn3 (the promoter sequence for syn2 is currently unavailable) for the presence of conserved binding sites for known transcription factors using a matrix-based analysis (MatInspector; Genomatix). Based on the 5′-most zebra finch mRNA sequence available (GenBank clone DV949224 in Fig. 1B) and comparisons with sequences from chicken and mammals, we identified a putative transcription start site (TSS) (Fig. 8A, position 0). We did not find a canonical TATA element but found a CAAT box and a CEBP (CAAT/enhancing binding protein) upstream of the TSS. We noted that the promoter region is decorated with multiple occurrences of the consensus binding sites for various factors, including general ones (e.g., SMARCA3, EVI1, Oct1, and ETS1) as well as tissue-specific ones (e.g., HOXF/CRX, TAL1, and LEF1). We also found that syn3 contains two binding sites for ZENK at positions +276 and +444 and two for AP-1 (c-Fos/c-Jun complex) at positions −39 and −790 relative to the TSS (Fig. 8A; one ZENK site coincides with the translation start site). We also noticed several occurrences of the binding site for E4BP4, a member of the cAMP response element-binding protein (CREB) family that is generally considered to have an inhibitory effect on transcription, and the presence of neural-restrictive silencer elements (NRSE and NRSF) within the first exon.
Figure 8.

Structure and in vivo interactions of the syn3 promoter in the zebra finch. A, Schematic drawing of the syn3 promoter region depicting the location of selected consensus motifs. Small arrow at 0 bp indicates putative transcription start site. B, ChIP from the auditory lobule of adult females (n = 3) killed 2 h after the onset of a 30 min song stimulation period; shown are the results of the triplicate independent samples immunoprecipitated for ZENK. Before ChIP, fragments representing portions of the syn3 (523 bp; indicated by arrows in A) and eno2 (498 bp) promoter regions could be amplified from total cross-linked chromatin (Inp samples). After ChIP, the syn3 but not the eno2 promoter fragment could be amplified from samples immunoprecipitated for ZENK (Z-IP), and the syn3 fragment could not be amplified from the sample immunoprecipitated for parvalbumin (P-IP). AP1, Activator protein 1; CAAT, avian C-type LTR CCAAT box; CEPB, CCAAT/enhancer binding protein; E4BP4, E4BP4, bZIP domain transcriptional repressor, CREB-related; ZENK, early growth response 1; for other factors, see text.
To determine whether ZENK actually binds to its putative sites in the syn3 promoter in vivo, we performed ChIP with an anti-ZENK antibody on dissected auditory lobules from song-stimulated birds (n = 3) perfused 2 h after the start of a 30 min stimulation with conspecific song. This time corresponds to the peak of ZENK protein induction by song (Mello and Ribeiro, 1998). We then PCR amplified the immunoprecipitated DNA with syn3-specific primers and obtained a fragment of the predicted size within the syn3 promoter region in all birds examined (Fig. 8B, left panel, syn3/Z-IP lanes). In contrast, these primers yielded no product when used to PCR amplify DNA immunoprecipitated using an anti-parvalbumin antibody (Fig. 8B, right panel, syn3/P-IP lane), establishing the specificity of the immunoprecipitation with the anti-ZENK antibody. In both cases, the same fragment could be amplified from the input samples isolated before the immunoprecipitation (Fig. 8B, Inp lanes). To further determine the specificity of the immunoprecipitation with the anti-ZENK antibody, we designed primers targeting the reconstructed promoter region of the neuronal specific enolase gene (eno2), which we determined to lack conserved ZENK binding sites (data not shown). PCR amplification using the eno2-specific primers resulted in no amplification product from the DNA immunoprecipitated with the anti-ZENK antibody but robust amplification from the input sample (Fig. 8B, left panel, eno2 lanes).
Discussion
We have shown that the genes encoding synapsins, a family of phosphoproteins associated with synaptic vesicles and thought to regulate their availability for synaptic release, are induced by song stimulation in a higher-order auditory brain area of songbirds. This induction is protracted relative to early song-inducible genes, occurs primarily in excitatory cells, and is under a suppressive action of early song-induced proteins. Our results support the hypothesis that synapsins are an integral part of the genomic response to sensory stimulation. More generally, synapsins appear to represent late effectors that could mediate the long-term effects of sensory experience on the regulation of neuronal properties.
Regulation of synapsins
The expression of synapsins increases in brain tissue after tetanic electrical stimulation or prolonged sensory stimulation and behavioral training (Morimoto et al., 1998a; Gomez-Pinilla et al., 2001; Pinaud et al., 2002). It is unclear, however, whether such changes are directly associated with the sensory activation of responsive neurons, or secondary to the chronic stimulation or overtraining. In our paradigm, synapsins were induced after a brief auditory stimulation with birdsong, a natural learned vocal communication signal. Song processing and memorization is essential for songbirds to learn their own song and to identify other individuals during territorial defense and courtship (Kroodsma and Miller, 1996). Thus, our data show that synapsins can be transcriptionally regulated in the brain of freely behaving animals, by a stimulus of established behavioral relevance.
Our data also imply that synapsins can be regulated by activation of cortical-like circuitry. NCM, a telencephalic region, receives input from the primary thalamo-recipient field L and is interconnected with other auditory areas (Vates et al., 1996), its position in the auditory pathways being analogous to supragranular layers of the auditory cortex. NCM is part of the avian pallium, considered homologous to the mammalian neocortex and parts of the amygdala and claustrum (Reiner et al., 2004; Jarvis et al., 2005). Electrophysiological, gene expression, and lesion studies indicate that NCM plays central roles in song perceptual processing and memorization (Mello et al., 1992, 1995; Velho et al., 2005; Phan et al., 2006; Gobes and Bolhuis, 2007; London and Clayton, 2008), akin to postulated roles of the mammalian auditory cortex (Ghazanfar and Hauser, 2001). We predict that synapsins may also be regulated by complex, behaviorally relevant stimuli in the auditory cortex and/or by other sensory modalities in the corresponding cortical areas.
Synapsins are late song-induced genes
We found that synapsins are constitutively expressed at high levels and significantly induced only hours after the onset of song stimulation. This contrasts with the early song ITFs zenk, c-fos, and c-jun, and the early effector Arc, which have low basal expression and an early induction peak at 30 min after stimulus onset (Mello and Clayton, 1994; Nastiuk et al., 1994; Mello and Ribeiro, 1998; Velho et al., 2005) and singing-induced genes (Poopatanapong et al., 2006; Wada et al., 2006). Thus, syn2 and syn3 are late song-induced genes, regulated by both constitutive and modulatory components.
The induction of synapsins by song occurred primarily in lateral NCM, in contrast to ITFs, whose induction is most pronounced medially. This suggested that synapsin induction does not simply reflect the up-regulation of early genes. Indeed, the evidence from CYC injections indicates that (1) song stimulation exerts a positive effect on synapsin expression that is independent of early song-induced proteins, and (2) early song-induced proteins appear to have a suppressive effect over the song-induced synapsin expression. Importantly, the lack of CYC effects on synapsin expression in unstimulated birds indicates that the suppressive effect in song-stimulated birds is over the song-regulated component rather than on the constitutive expression of synapsins. In summary, song appears to exert a direct, positive action on synapsin expression and an indirect, suppressive action through early-inducible genes (Fig. 9). Our evidence also adds to an increased awareness of anatomical and functional NCM subdomains (Terpstra et al., 2004; Pinaud et al., 2006).
Figure 9.

Cellular model of song-regulated synapsin expression in NCM, depicting direct and indirect pathways of synapsin regulation. The activation of song-responsive auditory neurons in NCM triggers the activation of intracellular signaling cascades (arrows) that upregulate the expression of the syn2 and syn3 genes (direct pathway) and of genes encoding ITFs (indirect pathway, indicated by dashed arrows). Song-induced ITFs (possibly including ZENK and AP-1, the latter formed by c-Fos and c-Jun combined) act by negatively regulating the expression of syn genes. The blockade of synthesis of song-induced proteins by CYC relieves the suppressive effects of ITFs on syn expression.
Several syn3 promoter elements may relate to its regulated expression, in particular the binding motifs for the early ITFs ZENK/EGR-1 and AP1. We show that ZENK protein binds to this promoter in song-stimulated birds, consistent with a direct regulatory action. This is important given that the presence of binding sites does not guarantee that a given transcription factor binds to a promoter in vivo (Cha-Molstad et al., 2004; Impey et al., 2004). Indeed, we observed no evidence of song-induced regulation of other candidate late genes such as NF-M and Kv3.1 (data not shown), whose promoters contain ITF binding sites (Velho et al., 2007). We also note that mammalian syn1 and syn2 promoters contain ZENK/EGR-1 binding sites and are responsive to ZENK/EGR1 overexpression in PC12 cells (Thiel et al., 1994; Petersohn et al., 1995). However, whereas syn1 and syn2 are upregulated based on a gene reporter assay (Petersohn et al., 1995), the native syn2 gene is downregulated by ∼30% in a similar paradigm based on microarray analysis (James et al., 2006). This suggests that the construct used in the reporter assay did not include all regulatory elements and that ZENK actually exerts a suppressive effect on synapsin promoters in a normal cell context. Our finding that song-induced synapsin expression is least apparent where ZENK induction is most robust (i.e., medial NCM), and vice versa, is consistent with this emerging view of ZENK action.
Other ITFs, such as AP-1, may also modulate the induced expression of synapsins. In contrast, constitutive factors, such as the activity-regulated Elk-family factor ETS1, are more likely to mediate the positive effect of song on synapsin expression, because the latter persists under CYC. Finally, the suppressive effect of prolonged stimulation on syn3 but not on syn2a suggests different promoter organizations, a possibility that awaits the syn2 promoter sequence. In summary, the induced expression of synapsins is under complex regulation, including transcriptional activators and suppressors; ZENK is most likely among the latter.
Potential roles for synapsin regulation
The time course of synapsin upregulation overlaps with the late phase (5–7 h after song) of the long-term habituation dependence by NCM on song-induced gene expression (Chew et al., 1995). This contrasts with the early dependence phase, which primarily coincides with the induction of early ITFs, such as zenk and c-fos (Mello et al., 1992; Velho et al., 2005). Thus, synapsins could be a late component of the gene expression program associated with long-lasting habituation. However, based on the apparent suppressive effect of early song-inducible proteins, it seems unlikely that synapsins simply mediate the effect of early ITFs on long-term habituation.
Synapsins are associated with the synaptic vesicle membrane and thus locate to presynaptic terminals. Their overexpression leads to an increase in the frequency of synaptic contacts (Han et al., 1991; Zhong et al., 1999), whereas their knock-out decreases the number of synaptic vesicles (Gitler et al., 2004; Gaffield and Betz, 2007), suggesting that synapsins are important determinants of synapse formation and/or maintenance. By inference, synapsin upregulation by song may increase the number of synaptic contacts and/or vesicles in song-responsive neurons, thus potentially modifying the synaptic interactions of these neurons. Both GABAergic and non-GABAergic NCM neurons are song responsive (Pinaud et al., 2004), but the present data indicate that the induced synapsin expression occurs primarily in non-GABAergic (presumably excitatory) cells. We thus predict that the effects of synapsin upregulation will be associated mainly with excitatory cells. These could include local interneurons or projection neurons, resulting in predicted modulation of excitatory synapses locally or at NCM projection targets, such as CMM. A combined approach with tract tracing will be required to settle this issue.
Current evidence indicates that synapsins modulate different aspects of synaptic transmission, such as the recruitment of synaptic vesicles to a reserve pool, the modulation of the kinetics of membrane fusion, the stabilization of synaptic vesicles, and/or the regulation of the late steps of endocytosis (Li et al., 1995; Rosahl et al., 1995; Hilfiker et al., 1999; Humeau et al., 2001; Bloom et al., 2003). Thus, although increased synapsin proteins will likely accumulate in presynaptic terminals of activated neurons, it is difficult to predict the exact consequences to synaptic physiology in vivo. Interestingly, injections of synapsin proteins to goldfish Mauthner axons result in reduced quantal release (Hackett et al., 1990), suggesting that synapsin overexpression might actually downregulate synaptic efficacy. Such an effect, if occurring in interneurons, would be consistent with a role of synapsins in the habituation of the response by NCM to song.
The consolidation of experience-dependent changes underlying long-term memory requires the activation of gene expression programs in different models and organisms (Goelet et al., 1986; Bailey et al., 1996). In songbirds, recent evidence implicates MAP kinase signaling in NCM and adjacent areas in the acquisition of tutor song memory during song learning (London and Clayton, 2008). Because the expression of early song-induced genes depends on MAP kinase activation (Cheng and Clayton, 2004; Velho et al., 2005), song-inducible genes in NCM may be involved in the memorization of tutor song. Our current data establish that synapsins are an integral part of the genomic response by NCM to song, suggesting that they could also participate in the formation and/or consolidation of song-related memories, a hypothesis requiring future tests.
Footnotes
This work was supported by National Institutes of Health Grant NIDCD02853. We thank Maria Manczak for technical assistance with the protein blots and Anne Cherry for helping with the neuronal cell counts.
References
- Alfonso J, Frick LR, Silberman DM, Palumbo ML, Genaro AM, Frasch AC. Regulation of hippocampal gene expression is conserved in two species subjected to different stressors and antidepressant treatments. Biol Psychiatry. 2006;59:244–251. doi: 10.1016/j.biopsych.2005.06.036. [DOI] [PubMed] [Google Scholar]
- Bailey CH, Bartsch D, Kandel ER. Toward a molecular definition of long-term memory storage. Proc Natl Acad Sci U S A. 1996;93:13445–13452. doi: 10.1073/pnas.93.24.13445. [DOI] [PMC free article] [PubMed] [Google Scholar]
- Bloom O, Evergren E, Tomilin N, Kjaerulff O, Löw P, Brodin L, Pieribone VA, Greengard P, Shupliakov O. Colocalization of synapsin and actin during synaptic vesicle recycling. J Cell Biol. 2003;161:737–747. doi: 10.1083/jcb.200212140. [DOI] [PMC free article] [PubMed] [Google Scholar]
- Bolhuis JJ, Zijlstra GG, den Boer-Visser AM, Van Der Zee EA. Localized neuronal activation in the zebra finch brain is related to the strength of song learning. Proc Natl Acad Sci U S A. 2000;97:2282–2285. doi: 10.1073/pnas.030539097. [DOI] [PMC free article] [PubMed] [Google Scholar]
- Cavalleri GL, Weale ME, Shianna KV, Singh R, Lynch JM, Grinton B, Szoeke C, Murphy K, Kinirons P, O'Rourke D, Ge D, Depondt C, Claeys KG, Pandolfo M, Gumbs C, Walley N, McNamara J, Mulley JC, Linney KN, Sheffield LJ, et al. Multicentre search for genetic susceptibility loci in sporadic epilepsy syndrome and seizure types: a case-control study. Lancet Neurol. 2007;6:970–980. doi: 10.1016/S1474-4422(07)70247-8. [DOI] [PubMed] [Google Scholar]
- Cha-Molstad H, Keller DM, Yochum GS, Impey S, Goodman RH. Cell-type-specific binding of the transcription factor CREB to the cAMP-response element. Proc Natl Acad Sci U S A. 2004;101:13572–13577. doi: 10.1073/pnas.0405587101. [DOI] [PMC free article] [PubMed] [Google Scholar]
- Chaudhuri A. Neural activity mapping with inducible transcription factors. Neuroreport. 1997;8:v–ix. [PubMed] [Google Scholar]
- Chen Q, He G, Qin W, Chen QY, Zhao XZ, Duan SW, Liu XM, Feng GY, Xu YF, St Clair D, Li M, Wang JH, Xing YL, Shi JG, He L. Family-based association study of synapsin II and schizophrenia. Am J Hum Genet. 2004;75:873–877. doi: 10.1086/425588. [DOI] [PMC free article] [PubMed] [Google Scholar]
- Cheng HY, Clayton DF. Activation and habituation of extracellular signal-regulated kinase phosphorylation in zebra finch auditory forebrain during song presentation. J Neurosci. 2004;24:7503–7513. doi: 10.1523/JNEUROSCI.1405-04.2004. [DOI] [PMC free article] [PubMed] [Google Scholar]
- Chew SJ, Mello C, Nottebohm F, Jarvis E, Vicario DS. Decrements in auditory responses to a repeated conspecific song are long-lasting and require two periods of protein synthesis in the songbird forebrain. Proc Natl Acad Sci USA. 1995;92:3406–3410. doi: 10.1073/pnas.92.8.3406. [DOI] [PMC free article] [PubMed] [Google Scholar]
- Clayton DF. The genomic action potential. Neurobiol Learn Mem. 2000;74:185–216. doi: 10.1006/nlme.2000.3967. [DOI] [PubMed] [Google Scholar]
- Curran T, Morgan JI. Superinduction of c-fos by nerve growth factor in the presence of peripherally active benzodiazepines. Science. 1985;229:1265–1268. doi: 10.1126/science.4035354. [DOI] [PubMed] [Google Scholar]
- Denisenko-Nehrbass NI, Jarvis E, Scharff C, Nottebohm F, Mello CV. Site-specific retinoic acid production in the brain of adult songbirds. Neuron. 2000;27:359–370. doi: 10.1016/s0896-6273(00)00043-x. [DOI] [PubMed] [Google Scholar]
- Gaffield MA, Betz WJ. Synaptic vesicle mobility in mouse motor nerve terminals with and without synapsin. J Neurosci. 2007;27:13691–13700. doi: 10.1523/JNEUROSCI.3910-07.2007. [DOI] [PMC free article] [PubMed] [Google Scholar]
- George JM, Clayton DF. Differential regulation in the avian song control circuit of an mRNA predicting a highly conserved protein related to protein kinase C and the bcr oncogene. Mol Brain Res. 1992;12:323–329. doi: 10.1016/0169-328x(92)90134-w. [DOI] [PubMed] [Google Scholar]
- Ghazanfar AA, Hauser MD. The auditory behaviour of primates: a neuroethological perspective. Curr Opin Neurobiol. 2001;11:712–720. doi: 10.1016/s0959-4388(01)00274-4. [DOI] [PubMed] [Google Scholar]
- Gitler D, Takagishi Y, Feng J, Ren Y, Rodriguiz RM, Wetsel WC, Greengard P, Augustine GJ. Different presynaptic roles of synapsins at excitatory and inhibitory synapses. J Neurosci. 2004;24:11368–11380. doi: 10.1523/JNEUROSCI.3795-04.2004. [DOI] [PMC free article] [PubMed] [Google Scholar]
- Gobes SM, Bolhuis JJ. Birdsong memory: a neural dissociation between song recognition and production. Curr Biol. 2007;17:789–793. doi: 10.1016/j.cub.2007.03.059. [DOI] [PubMed] [Google Scholar]
- Goelet P, Castellucci VF, Schacher S, Kandel ER. The long and the short of long-term memory—a molecular framework. Nature. 1986;322:419–422. doi: 10.1038/322419a0. [DOI] [PubMed] [Google Scholar]
- Gómez-Pinilla F, So V, Kesslak JP. Spatial learning induces neurotrophin receptor and synapsin I in the hippocampus. Brain Res. 2001;904:13–19. doi: 10.1016/s0006-8993(01)02394-0. [DOI] [PubMed] [Google Scholar]
- Greengard P, Valtorta F, Czernik AJ, Benfenati F. Synaptic vesicle phosphoproteins and regulation of synaptic function. Science. 1993;259:780–785. doi: 10.1126/science.8430330. [DOI] [PubMed] [Google Scholar]
- Hackett JT, Cochran SL, Greenfield LJ, Jr, Brosius DC, Ueda T. Synapsin I injected presynaptically into goldfish mauthner axons reduces quantal synaptic transmission. J Neurophysiol. 1990;63:701–706. doi: 10.1152/jn.1990.63.4.701. [DOI] [PubMed] [Google Scholar]
- Han HQ, Nichols RA, Rubin MR, Bähler M, Greengard P. Induction of formation of presynaptic terminals in neuroblastoma cells by synapsin IIb. Nature. 1991;349:697–700. doi: 10.1038/349697a0. [DOI] [PubMed] [Google Scholar]
- Hilfiker S, Pieribone VA, Czernik AJ, Kao HT, Augustine GJ, Greengard P. Synapsins as regulators of neurotransmitter release. Philos Trans R Soc Lond B Biol Sci. 1999;354:269–279. doi: 10.1098/rstb.1999.0378. [DOI] [PMC free article] [PubMed] [Google Scholar]
- Holzenberger M, Jarvis ED, Chong C, Grossman M, Nottebohm F, Scharff C. Selective expression of insulin-like growth factor II in the songbird brain. J Neurosci. 1997;17:6974–6987. doi: 10.1523/JNEUROSCI.17-18-06974.1997. [DOI] [PMC free article] [PubMed] [Google Scholar]
- Humeau Y, Doussau F, Vitiello F, Greengard P, Benfenati F, Poulain B. Synapsin controls both reserve and releasable synaptic vesicle pools during neuronal activity and short-term plasticity in Aplysia. J Neurosci. 2001;21:4195–4206. doi: 10.1523/JNEUROSCI.21-12-04195.2001. [DOI] [PMC free article] [PubMed] [Google Scholar]
- Impey S, McCorkle SR, Cha-Molstad H, Dwyer JM, Yochum GS, Boss JM, McWeeney S, Dunn JJ, Mandel G, Goodman RH. Defining the CREB regulon: a genome-wide analysis of transcription factor regulatory regions. Cell. 2004;119:1041–1054. doi: 10.1016/j.cell.2004.10.032. [DOI] [PubMed] [Google Scholar]
- Iwata M, Shirayama Y, Ishida H, Kawahara R. Hippocampal synapsin I, growth-associated protein-43, and microtubule-associated protein-2 immunoreactivity in learned helplessness rats and antidepressant-treated rats. Neuroscience. 2006;141:1301–1313. doi: 10.1016/j.neuroscience.2006.04.060. [DOI] [PubMed] [Google Scholar]
- James AB, Conway AM, Morris BJ. Regulation of the neuronal proteasome by Zif268 (Egr1) J Neurosci. 2006;26:1624–1634. doi: 10.1523/JNEUROSCI.4199-05.2006. [DOI] [PMC free article] [PubMed] [Google Scholar]
- Jarvis ED, Güntürkün O, Bruce L, Csillag A, Karten H, Kuenzel W, Medina L, Paxinos G, Perkel DJ, Shimizu T, Striedter G, Wild JM, Ball GF, Dugas-Ford J, Durand SE, Hough GE, Husband S, Kubikova L, Lee DW, Mello CV, et al. Avian brains and a new understanding of vertebrate brain evolution. Nat Rev Neurosci. 2005;6:151–159. doi: 10.1038/nrn1606. [DOI] [PMC free article] [PubMed] [Google Scholar]
- Jeong JK, Velho TA, Mello CV. Cloning and expression analysis of retinoic acid receptors in the zebra finch brain. J Comp Neurol. 2005;489:23–41. doi: 10.1002/cne.20605. [DOI] [PubMed] [Google Scholar]
- Kao HT, Porton B, Hilfiker S, Stefani G, Pieribone VA, DeSalle R, Greengard P. Molecular evolution of the synapsin gene family. J Exp Zool. 1999;285:360–377. [PubMed] [Google Scholar]
- Kroodsma DE, Miller EH. Ecology and evolution of acoustic communication in birds. Ithaca, NY: Cornell UP; 1996. [Google Scholar]
- Lachman HM, Stopkova P, Rafael MA, Saito T. Association of schizophrenia in African Americans to polymorphism in synapsin III gene. Psychiatr Genet. 2005;15:127–132. doi: 10.1097/00041444-200506000-00009. [DOI] [PubMed] [Google Scholar]
- Lanahan A, Worley P. Immediate-early genes and synaptic function. Neurobiol Learn Mem. 1998;70:37–43. doi: 10.1006/nlme.1998.3836. [DOI] [PubMed] [Google Scholar]
- Li L, Chin LS, Shupliakov O, Brodin L, Sihra TS, Hvalby O, Jensen V, Zheng D, McNamara JO, Greengard P, Andersen P. Impairment of synaptic vesicle clustering and of synaptic transmission, and increased seizure propensity, in synapsin I-deficient mice. Proc Natl Acad Sci U S A. 1995;92:9235–9239. doi: 10.1073/pnas.92.20.9235. [DOI] [PMC free article] [PubMed] [Google Scholar]
- London SE, Clayton DF. Functional identification of sensory mechanisms required for developmental song learning. Nat Neurosci. 2008;11:579–586. doi: 10.1038/nn.2103. [DOI] [PMC free article] [PubMed] [Google Scholar]
- Mello C, Nottebohm F, Clayton D. Repeated exposure to one song leads to a rapid and persistent decline in an immediate early gene's response to that song in zebra finch telencephalon. J Neurosci. 1995;15:6919–6925. doi: 10.1523/JNEUROSCI.15-10-06919.1995. [DOI] [PMC free article] [PubMed] [Google Scholar]
- Mello CV. Mapping vocal communication pathways in birds with inducible gene expression. J Comp Physiol A Neuroethol Sens Neural Behav Physiol. 2002;188:943–959. doi: 10.1007/s00359-002-0347-1. [DOI] [PubMed] [Google Scholar]
- Mello CV, Clayton DF. Song-induced ZENK gene expression in auditory pathways of songbird brain and its relation to the song control system. J Neurosci. 1994;14:6652–6666. doi: 10.1523/JNEUROSCI.14-11-06652.1994. [DOI] [PMC free article] [PubMed] [Google Scholar]
- Mello CV, Ribeiro S. ZENK protein regulation by song in the brain of songbirds. J Comp Neurol. 1998;393:426–438. doi: 10.1002/(sici)1096-9861(19980420)393:4<426::aid-cne3>3.0.co;2-2. [DOI] [PubMed] [Google Scholar]
- Mello CV, Vicario DS, Clayton DF. Song presentation induces gene expression in the songbird forebrain. Proc Natl Acad Sci U S A. 1992;89:6818–6822. doi: 10.1073/pnas.89.15.6818. [DOI] [PMC free article] [PubMed] [Google Scholar]
- Mello CV, Jarvis ED, Denisenko N, Rivas M. Isolation of song-regulated genes in the brain of songbirds. Methods Mol Biol. 1997;85:205–217. doi: 10.1385/0-89603-489-5:205. [DOI] [PubMed] [Google Scholar]
- Mello CV, Velho TA, Pinaud R. Song-induced gene expression: a window on song auditory processing and perception. Ann N Y Acad Sci. 2004;1016:263–281. doi: 10.1196/annals.1298.021. [DOI] [PubMed] [Google Scholar]
- Morimoto K, Sato K, Sato S, Yamada N, Hayabara T. Time-dependent changes in rat hippocampal synapsin I mRNA expression during long-term potentiation. Brain Res. 1998a;783:57–62. doi: 10.1016/s0006-8993(97)01154-2. [DOI] [PubMed] [Google Scholar]
- Morimoto K, Sato K, Sato S, Suemaru S, Sato T, Yamada N, Hayabara T. Increases in mRNA levels for synapsin I but not synapsin II in the hippocampus of the rat kindling model of epilepsy. Seizure. 1998b;7:229–235. doi: 10.1016/s1059-1311(98)80041-1. [DOI] [PubMed] [Google Scholar]
- Nastiuk KL, Mello CV, George JM, Clayton DF. Immediate-early gene responses in the avian song control system: cloning and expression analysis of the canary c-jun cDNA. Brain Res Mol Brain Res. 1994;27:299–309. doi: 10.1016/0169-328x(94)90013-2. [DOI] [PubMed] [Google Scholar]
- Nedivi E, Hevroni D, Naot D, Israeli D, Citri Y. Numerous candidate plasticity-related genes revealed by differential cDNA cloning. Nature. 1993;363:718–722. doi: 10.1038/363718a0. [DOI] [PubMed] [Google Scholar]
- Petersohn D, Schoch S, Brinkmann DR, Thiel G. The human synapsin II gene promoter. Possible role for the transcription factor zif268/egr-1, polyoma enhancer activator 3, and AP2. J Biol Chem. 1995;270:24361–24369. doi: 10.1074/jbc.270.41.24361. [DOI] [PubMed] [Google Scholar]
- Phan ML, Pytte CL, Vicario DS. Early auditory experience generates long-lasting memories that may subserve vocal learning in songbirds. Proc Natl Acad Sci USA. 2006;103:1088–1093. doi: 10.1073/pnas.0510136103. [DOI] [PMC free article] [PubMed] [Google Scholar]
- Pinaud R, Tremere LA, Penner MR, Hess FF, Barnes S, Robertson HA, Currie RW. Plasticity-driven gene expression in the rat retina. Brain Res Mol Brain Res. 2002;98:93–101. doi: 10.1016/s0169-328x(01)00328-x. [DOI] [PubMed] [Google Scholar]
- Pinaud R, Velho TA, Jeong JK, Tremere LA, Leão RM, von Gersdorff H, Mello CV. GABAergic neurons participate in the brain's response to birdsong auditory stimulation. Eur J Neurosci. 2004;20:1318–1330. doi: 10.1111/j.1460-9568.2004.03585.x. [DOI] [PubMed] [Google Scholar]
- Pinaud R, Fortes AF, Lovell P, Mello CV. Calbindin-positive neurons reveal a sexual dimorphism within the songbird analogue of the mammalian auditory cortex. J Neurobiol. 2006;66:182–195. doi: 10.1002/neu.20211. [DOI] [PubMed] [Google Scholar]
- Pinaud R, Osorio C, Alzate O, Jarvis ED. Profiling of experience-regulated proteins in the songbird auditory forebrain using quantitative proteomics. Eur J Neurosci. 2008a;27:1409–1422. doi: 10.1111/j.1460-9568.2008.06102.x. [DOI] [PMC free article] [PubMed] [Google Scholar]
- Pinaud R, Terleph TA, Tremere LA, Phan ML, Dagostin AA, Leão RM, Mello CV, Vicario DS. Inhibitory network interactions shape the auditory processing of natural communication signals in the songbird auditory forebrain. J Neurophysiol. 2008b;100:441–455. doi: 10.1152/jn.01239.2007. [DOI] [PMC free article] [PubMed] [Google Scholar]
- Poopatanapong A, Teramitsu I, Byun JS, Vician LJ, Herschman HR, White SA. Singing, but not seizure, induces synaptotagmin IV in zebra finch song circuit nuclei. J Neurobiol. 2006;66:1613–1629. doi: 10.1002/neu.20329. [DOI] [PMC free article] [PubMed] [Google Scholar]
- Reiner A, Perkel DJ, Bruce LL, Butler AB, Csillag A, Kuenzel W, Medina L, Paxinos G, Shimizu T, Striedter G, Wild M, Ball GF, Durand S, Gunturkun O, Lee DW, Mello CV, Powers A, White SA, Hough G, Kubikova L, et al. Revised nomenclature for avian telencephalon and some related brainstem nuclei. J Comp Neurol. 2004;473:377–414. doi: 10.1002/cne.20118. [DOI] [PMC free article] [PubMed] [Google Scholar]
- Replogle K, Arnold AP, Ball GF, Band M, Bensch S, Brenowitz EA, Dong S, Drnevich J, Ferris M, George JM, Gong G, Hasselquist D, Hernandez AG, Kim R, Lewin HA, Liu L, Lovell PV, Mello CV, Naurin S, Rodriquez-Zas S, et al. The songbird neurogenomics (SoNG) initiative: community-based tools and strategies for study of brain gene function and evolution. BMC Genomics. 2008;9:131. doi: 10.1186/1471-2164-9-131. [DOI] [PMC free article] [PubMed] [Google Scholar]
- Rosahl TW, Spillane D, Missler M, Herz J, Selig DK, Wolff JR, Hammer RE, Malenka RC, Südhof TC. Essential functions of synapsins I and II in synaptic vesicle regulation. Nature. 1995;375:488–493. doi: 10.1038/375488a0. [DOI] [PubMed] [Google Scholar]
- Sheng M, Greenberg ME. The regulation and function of c-fos and other immediate early genes in the nervous system. Neuron. 1990;4:477–485. doi: 10.1016/0896-6273(90)90106-p. [DOI] [PubMed] [Google Scholar]
- Terpstra NJ, Bolhuis JJ, den Boer-Visser AM. An analysis of the neural representation of birdsong memory. J Neurosci. 2004;24:4971–4977. doi: 10.1523/JNEUROSCI.0570-04.2004. [DOI] [PMC free article] [PubMed] [Google Scholar]
- Thiel G, Schoch S, Petersohn D. Regulation of synapsin I gene expression by the zinc finger transcription factor zif268/egr-1. J Biol Chem. 1994;269:15294–15301. [PubMed] [Google Scholar]
- Vates GE, Broome BM, Mello CV, Nottebohm F. Auditory pathways of caudal telencephalon and their relation to the song system of adult male zebra finches. J Comp Neurol. 1996;366:613–642. doi: 10.1002/(SICI)1096-9861(19960318)366:4<613::AID-CNE5>3.0.CO;2-7. [DOI] [PubMed] [Google Scholar]
- Velho TA, Pinaud R, Rodrigues PV, Mello CV. Co-induction of activity-dependent genes in songbirds. Eur J Neurosci. 2005;22:1667–1678. doi: 10.1111/j.1460-9568.2005.04369.x. [DOI] [PubMed] [Google Scholar]
- Velho TA, Lovell P, Mello CV. Enriched expression and developmental regulation of the middle-weight neurofilament (NF-M) gene in song control nuclei of the zebra finch. J Comp Neurol. 2007;500:477–497. doi: 10.1002/cne.21180. [DOI] [PMC free article] [PubMed] [Google Scholar]
- Velho TAF, Mello CV. Transcriptional regulation of activity-dependent genes by birdsong. In: Dudek S, editor. Transcriptional regulation by neuronal activity. Ed 1. New York: Springer; 2007. pp. 3–26. [Google Scholar]
- Wada K, Howard JT, McConnell P, Whitney O, Lints T, Rivas MV, Horita H, Patterson MA, White SA, Scharff C, Haesler S, Zhao S, Sakaguchi H, Hagiwara M, Shiraki T, Hirozane-Kishikawa T, Skene P, Hayashizaki Y, Carninci P, Jarvis ED. A molecular neuroethological approach for identifying and characterizing a cascade of behaviorally regulated genes. Proc Natl Acad Sci U S A. 2006;103:15212–15217. doi: 10.1073/pnas.0607098103. [DOI] [PMC free article] [PubMed] [Google Scholar]
- Zhong ZG, Noda M, Takahashi H, Higashida H. Overexpression of rat synapsins in NG108–15 neuronal cells enhances functional synapse formation with myotubes. Neurosci Lett. 1999;260:93–96. doi: 10.1016/s0304-3940(98)00969-0. [DOI] [PubMed] [Google Scholar]