

Abstract
High-frequency cortical activity in humans and animals has been linked to a wide variety of higher cognitive processes. This research suggests that specific changes in neuronal synchrony occur during cognitive processing, distinguished by emergence of fast oscillations in the gamma frequency range. To determine whether the development of high-frequency brain oscillations can be related to the development of cognitive abilities, we studied the power spectra of resting EEG in children 16, 24 and 36 months of age. Individual differences in the distribution of frontal gamma power during rest were highly correlated with concurrent language and cognitive skills at all ages. Gamma power was also associated with attention measures; children who were observed as having better inhibitory control and more mature attention shifting abilities had higher gamma power density functions. We included a group of children with a family history of language impairment (FH+) and thus at higher risk for language disorders. FH+ children, as a group, showed consistently lower gamma over frontal regions than the well-matched FH- controls with no such family history (FH-). We suggest that the emergence of high frequency neural synchrony may be critical for cognitive and linguistic development, and that children at risk for language impairments may lag in this process.
Keywords: language, cognitive development, resting EEG, gamma power, attention
1. Introduction and Literature Review
Cortical activity in the gamma frequency range (∼30-80 Hz) has been linked in humans and animals to a wide variety of higher cognitive processes including attention [1,26,36,38], perception [1,21,30,38,39] memory [1,16,18,21,31] and language [13,35]. It has been hypothesized that correlations between the occurrence of higher activity in the gamma frequency range and cognitive performance (as observed in human subjects using EEG and MEG recordings) reflects increased synchronization of neural ensembles important for cognitive processing [37,38,39]. Specifically, synchronization of neuronal firing, often associated with gamma-frequency oscillations [12,46], appears to be critically involved. Also consistent with a functional role for synchronized oscillations, is the observation that increases in gamma power are closely related to arousal and attention [14,20,39]. In addition, gamma oscillation seems to be developmentally regulated. EEG studies in 3- to 12-year-old children that examined fronto-polar, central, and occipital scalp locations showed that gamma power increased significantly across age, most strikingly over frontal regions [42]. As a child matures, activity in the lower frequency bands decreases and faster waveform activity increases [9]. Importantly, EEG power indices of children that significantly deviate from this pattern seem to reflect distinct differences in the maturational time course of brain development [26].
In humans, cognitive and linguistic abilities show a dramatic developmental burst at around 16 through 24 months that is hypothesized to correlate with a steep increase in synaptic density in relevant cortical regions [8,24,34]. Across this time period, young children demonstrate striking increases in language, cognitive and motor skills [2,17]. This developmental stage is also characterized by major changes in forebrain organization including continuing maturation and myelination of temporal and frontal areas and elaboration of the extensive cortical and subcortical circuits that may subserve coordinated high-frequency activity [33,34]. However, the substrates of gamma activity in the developing brain and the potential role of gamma bursts in infants are just beginning to be studied [10,29,49]. In adults, recurrent thalamocortical and corticothalamic activity is thought to underlie organization and maintenance of gamma band activity [37], and in particular seems to provide for precise timing and integration of neural activation and binding of basic sensory input [28]. Such activity appears to have a role in synchronizing sub-processes in neural networks [27,28]. Even in adults, very few studies have examined resting EEG and gamma band power. There is evidence, however, that in adults diagnosed with Alzheimer's Disease [22,25] or Parkinson's Disease [6,41], decreased gamma power correlates with poorer cognitive performance. Thus the defining temporal and power density characteristics of the EEG, that reflects these underlying neural synchronies, are increasingly of interest, but again have been rarely studied in infants [14,36,39]. Such information is of particular relevance given recent findings that strongly suggest that temporally precise processing abilities in young infants are crucial for normal language development and that deficits in such abilities are a reliable marker for later language disorders [4,5,7].
Several previous studies have examined EEG power in the gamma band in infants, but these studies have focused on the appearance of task-induced oscillations [10,29,40]. For example, Csibra et al. [10] have shown that illusory contours (Kanizsa squares) induced gamma-band (∼40Hz) oscillations in 8 month-olds. While the infant brain is capable of producing task-induced gamma, to our knowledge, no study to date has evaluated the maturation of gamma power during resting EEG in infants under the age of 3 years, or its relation to cognitive development.
Thus, the present study examined individual differences in the distribution of power spectra across the scalp during dense array EEG collected during spontaneous (resting) EEG epochs, in relation to cognitive ability. Such data begin to address the question of whether there is an association among power in the various frequency bands (and in particular for the gamma range), age of child, and cognitive and linguistic performance. As we were also interested in the possibility of group differences in the distribution and strength of power spectra as a function of infant risk status, two groups of participants were included: infants at greater risk for language-based learning impairment (LLI) as a function of a family history of LLI and well-matched control children with no such familial history. All were comparably healthy, full-term infants, with the exception that the FH+ children had a documented family history of LLI. All children were also assessed at 16, 24 and 36 months of age with a battery of behavioural, cognitive and linguistic measures.
2. Materials and Methods
The studies described here have been reviewed and approved by the Institutional Review Board of our University and have therefore been performed in accordance with the ethical standards laid down in the 1964 Declaration of Helsinki. Informed consent was obtained from all parents prior to their child's inclusion in the reported studies.
2.1. Subjects
Participants included a total of 63 children comprised of two groups based on parental report of family history of specific learning impairment (SLI): family history positive (FH+) and matched control children (FH-). The FH+ group consisted of 22 normal birth-weight infants (Males= 12) with at least one nuclear family member (either an older sibling or a parent) diagnosed with language-based learning impairment (LLI). Families were recruited from Newark, and surrounding New Jersey suburbs. All were healthy, full-term, infants, with the exception that they had a documented family history of LLI (questionnaire and/or interview data) in a first-degree family member [4, 7]. The FH- group consisted of 41 infants (Males = 19) with no reported family history of SLI or of dyslexia, attention deficit disorder, pervasive developmental disorder, or autism. (See [4, 7] for further descriptive data on sample characteristics).
2.2. Socioeconomic Status
Parental socioeconomic status (SES) was determined using the Hollingshead Four Factor Index [23]. Analyses revealed that 85% of the families reported being in the highest social strata (e.g. medical professionals, lawyers and upper level managers) while the remaining 15% were from the middle social strata (e.g. mid-level managers, small business owners) The children included in the present study were participating in a larger longitudinal study examining the association between early processing of auditory information and language development [4, 7]. For the present study, EEG was recorded for 22 children at 16 months, 23 children at 24 months and 18 children at 36 months. All children also received an age-appropriate battery of behavioural, cognitive and linguistic measures. The measures used are described below.
2.3. Measures
2.3.1. Behavioral Assessments
Language abilities were assessed using the Preschool Language Scale-3 (PLS-3) [48]. The PLS-3 provides age-normed language scores for children from birth to 7 years of age and was administered in the laboratory at 16 and 24 months of age. The PLS-3 assesses receptive (Auditory Comprehension) and expressive (Expressive Communication) skills. The measure yields standard scores (Mean=100, SD=15) for the subscales as well as a Total Language Score. In the analyses that follow the Auditory Comprehension and Expressive Communication subscale scores were used.
Cognitive outcomes were assessed with the Bayley Scales of Infant Development – Mental Development Index (MDI) [3] at 16 and 24 months. The MDI consists of a range of items, administered according to age, assessing various cognitive abilities such as search, social interaction, imitation, vocalization, and puzzle completion. The scale provides a standardized score with a mean of 100 and a standard deviation of 16 points.
At 36 months the children were assessed with the Stanford-Binet Intelligence Scale, Fourth Edition [44]. The following subtests were administered: Verbal Reasoning, Abstract/Visual Reasoning, Quantitative Reasoning, and Short-Term Memory. Scores are reported as subtest standard age scores (SAS: mean = 50, SD = 8) and composite standard scores (Area SAS: mean = 100, SD = 16).
Toddler temperament was assessed using a 144-item parent report measure (Toddler Behavior Assessment Questionnaire, TBAQ) [19]. The TBAQ measures the following dimensions of temperament: activity level, pleasure, social fearfulness, anger proneness, interest/persistence, inhibitory control and attention shifting.
Mother-infant interaction at 16 and 24 months was coded from a 15-minute play session using the Parent/Caregiver Involvement Scale, P/CIS [15]. Dyads were coded along three parenting dimensions: amount of involvement, quality of interactions and the developmental appropriateness of interactions for each of 11 parenting behaviors: physical involvement, verbal involvement, responsiveness, play interaction, teaching, control of child's activities, directiveness, relationship among activities, positive and negative emotions, and goal setting.
2.3.2. EEG Assessment
Data were collected at 16, 24, and 36 months of age for the two subject groups: FH+ and FH-. EEG was recorded from 62 scalp sites using the Geodesic Sensor Net (Electrical Geodesics Inc., Eugene, OR) in order to examine spontaneous changes in each child's brain electrical activity. Following the placement of EEG electrodes on the scalp, the children participated in a passive auditory oddball procedure containing two blocked stimulus conditions separated by a three-minute epoch of resting EEG. At the break between the first two stimulus blocks, when no stimuli were being presented, a three-minute block of EEG was collected while the child quietly played on the parent's lap. The 3-minute resting EEG was taken for analyses for the present study. The entire EEG session lasted about 50 minutes.
The raw EEG data were sampled at 250 Hz and filtered offline at 1.5 - 57 Hz. Artifacts including eye blinks and muscle movements were identified by visual inspection and Independent Component Analysis (ICA) and removed from the EEG data. During the data processing and analyses described here, there was no way to tell which individual subject was from which group. After processing the data were separated by group (FH- controls and FH+). When examined post hoc, there were no differences between groups in the number and type of artifacts removed. The data were re-referenced by whole head average algorithm. The artifact-free epochs were submitted to power spectral analysis using Fast Fourier Transform (FFT). The log transform for absolute power was: 10log10(×). The frequency distribution of power spectra across the scalp as well as spectra ratios, were computed (e.g. of gamma to theta). Our analyses were of absolute power, but relative power gives congruent results as the lower frequency bands do not differ across children.
3. Results
3.1. Gamma Power Differences According to Family History
Inspection of individual power density plots, representing scalp distributions of power in 9 bins from 5 to 50 Hz for each child (i.e. 5-10Hz, 11-15Hz, 16-20Hz, 21-25 Hz, 26-30Hz, 31-35Hz, 36-40Hz, 41-45Hz, 46-50Hz), labelled by group after the data processing described, revealed significant variability among subjects in both FH+ and FH- groups, specifically over frontal and prefrontal areas. Power density appeared to be lower for a subset of these children, primarily over frontal regions, beginning at about 31-35 Hz. On closer examination, approximately two-thirds of the FH+ group appeared to show lower frontal/prefrontal power with only about 10% of FH- control children showing a similar power distribution. Focused analyses were then performed only on prefrontal and frontal channels (See Figure 1 for channels analyzed).
Figure 1.
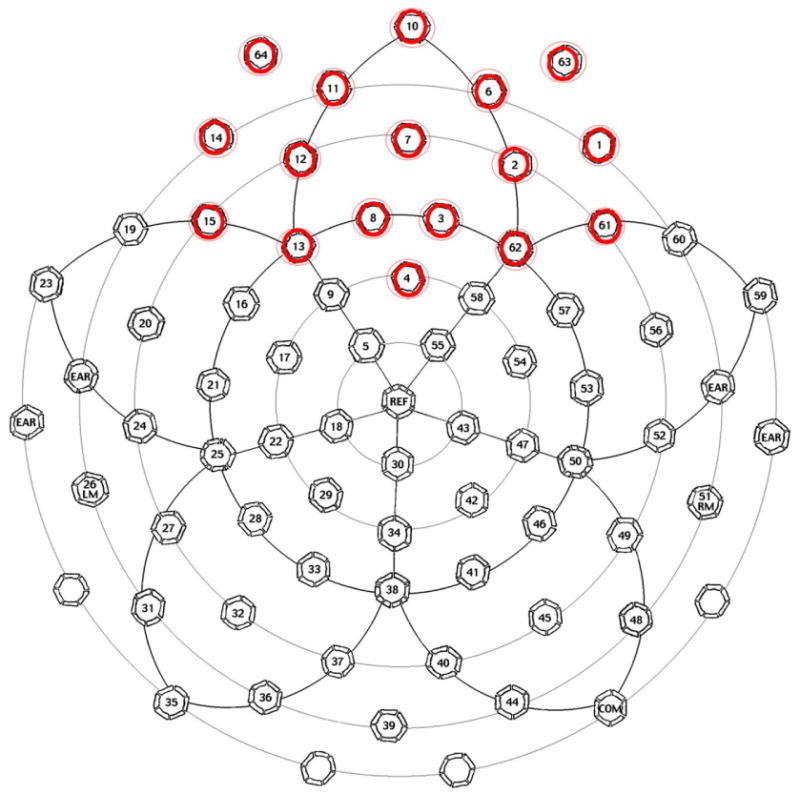
Electrical Geodesics Inc. 64 Channel Geodesic Sensor Net Map. The red-circled channels were used for our EEG analysis.
A continuous power density function (averaged across all the prefrontal and frontal electrodes shown in Fig. 1) was generated for each child. As seen in Fig. 2, where red lines represent FH+ subjects and blue lines indicate FH- control children, the power density functions show clear group differences across power spectra that increase across age. To statistically evaluate differences in band power in frontal and prefrontal areas, Group (FH+ vs. FH-) by Frequency band (5-30 Hz, 31-50 Hz) analyses of variance (ANOVA) were calculated using the Kruskal-Wallis test; the 31-50 Hz band was considered representative of the gamma range. The two groups significantly differed for frequencies within the gamma range at both 24 and 36 months; however, the data only approached significance at 16 months (at 31-50 Hz, p = 0.08). No group differences were seen at the lower frequencies (5-30 Hz) at any of the three ages. Figs. 3A and B illustrate the sample characteristics and summarize the ANOVA results at 24 and 36 months.
Figure 2A and 2B.
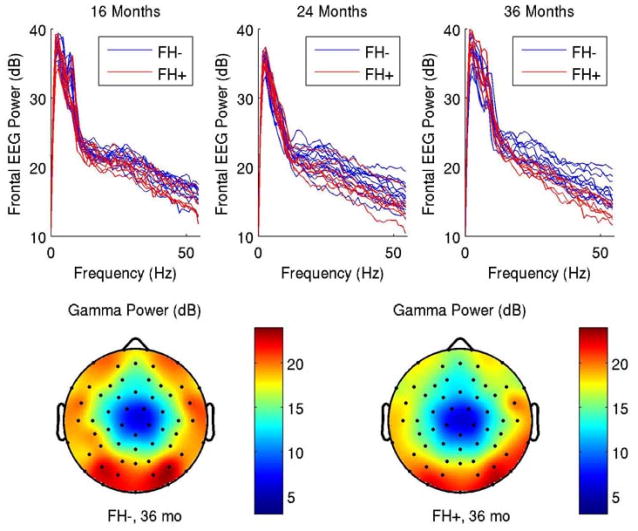
(A) Frontal EEG power spectra (averaged across the frontal and prefrontal electrodes indicated in Fig. 1) for control children and children with a family history of language impairment. At 16 months, the two populations largely overlap; by 36 months a clear distinction is seen with the family history group showing reduced power at 31Hz and above. (B) Scalp distribution of mean gamma power for each group at 36 months. The difference between the two is primarily seen in the frontal lateral region.
Figures 3A and 3B.


ANOVAs at 5-30Hz and 31-50Hz band power for 24 (A) and 36 months (B). The lower and upper lines of the “box” are the 25th and 75th percentiles of the sample. The “whiskers” show the extent of the rest of the sample. The plus sign is an indication of an outlier in the data. For 5-30Hz band, the null hypothesis is true, p = 0.6985 at 24 months and p = 0.9326 at 36 months. For 31-50Hz, the null hypothesis is rejected for both 24 and 36 months p = 0.0454 and p = 0.0088 and the two groups are shown to significantly differ in the amount of frontal power within the broad gamma range (31-50Hz). (See full-size graphs in supporting on-line materials.)
3.2. Correlations between Mean Gamma Power and Behavior
To examine whether these differences in EEG power correlated with cognitive abilities, Pearson product moment correlations were then computed between mean power in both frequency bands, and performance on a series of behavioral tasks (see Figure 4A-C). These included scores for general cognitive measures as well as measures of receptive and expressive language. Positive associations were found between mean power at 31-50Hz and individual performance on standardized language and cognitive measures (range of Rs: rs= 0.52 to 0.75, ps = 0.001 to p = 0.0001). The findings at 24 months, when there is still a large amount of variability in spoken language, include correlations with expressive as well as receptive language; by 36 months, when most children have completed their expressive language burst and there is less variance in spoken language, the correlations are exclusively with language comprehension.
Figures 4A, 4B and 4C.
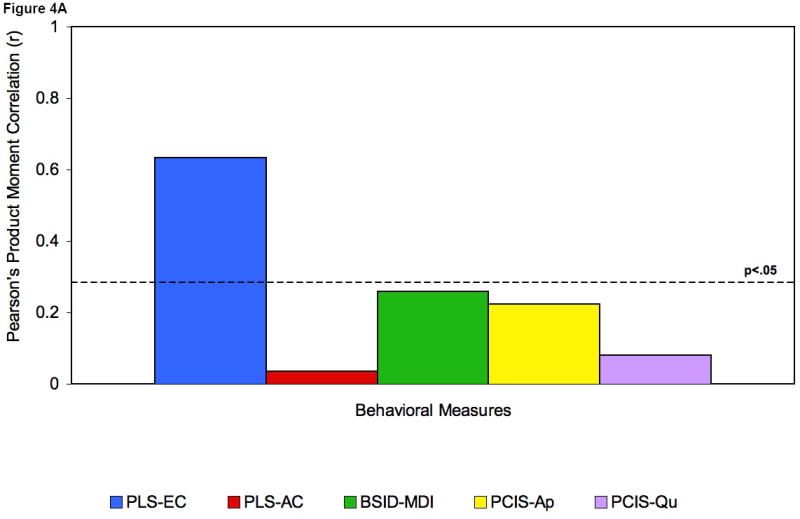
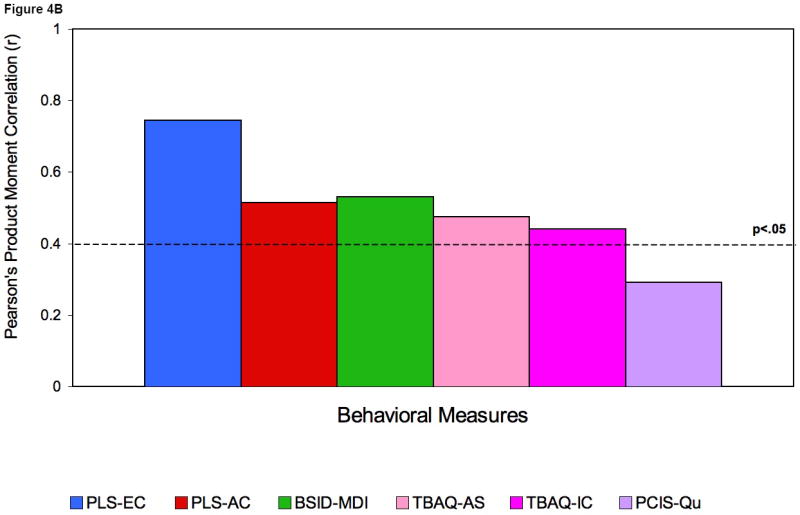
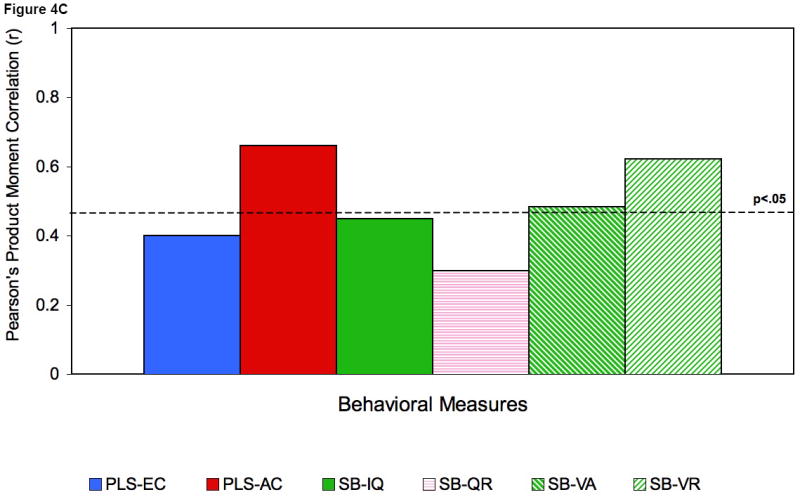
Correlations at 16 (A) and 24 (B) and 36 (C) months with mean gamma power.
Legend: PLS expressive language score (PLS-EC); PLS Auditory Comprehension (PLS-AC); Bayley-Mental development index (BSID-MDI); Temperament (TBAQ): attention shifting (TBAQ-AS); inhibitory control (TBAQ-IC); Parent-Child interaction (PCIS): appropriateness (PCIS-Ap), quality (PCIS-Qu); Stanford-Binet (SB): - total composite IQ (SB-IQ), quantitative (SB-QR), verbal absurdities (SB-VA), verbal reasoning (SB-VR).
Gamma power was also associated with attention measures as assessed by the TBAQ [19] at 24 months. Children who were observed as having better inhibitory control (i.e. the ability to stop, moderate or refrain from a behaviour when instructed), and more mature attention shifting abilities (i.e. more proficient at transferring attention from one task to another when required) had higher gamma power at 24 months: r = 0.44, p= 0.045 and r = 0.48, p = 0.029 respectively.
Fig. 4 shows a subset of the correlation coefficients between concurrent mean gamma power and behavioral test scores at 16 months (4A), 24 months (4B), and 36 months (4C). The scatter plots in Fig. 5 A-C provide a more detailed look at the robust relations seen for 24-month mean gamma power with expressive (5A) and receptive (5B) language ability and between 36-month receptive (5C) language ability and resting frontal gamma. Gamma power was not associated with gender, fine motor abilities, non-attention related temperament characteristics, maternal behaviour, parental socioeconomic status (SES) or maternal education. No correlations were significant for mean power from 5 to 30 Hz. We note that the two groups did not differ significantly in SES, parental education levels, parental age, or maternal interaction. Further, examination of the potential effects of differences in arousal levels during the EEG recording suggested that EEG power and infant state were not significantly related.1
Figure 5A-C.
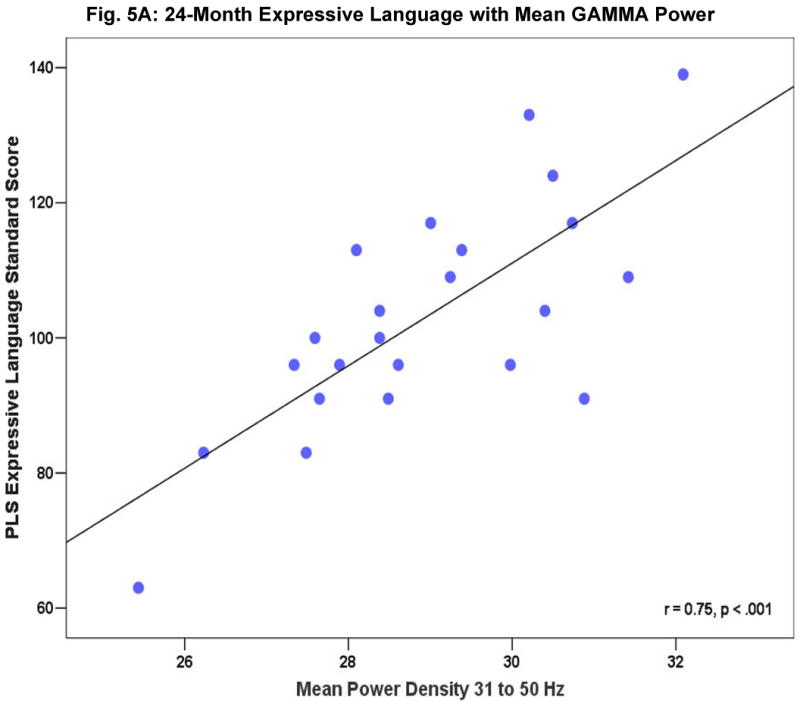
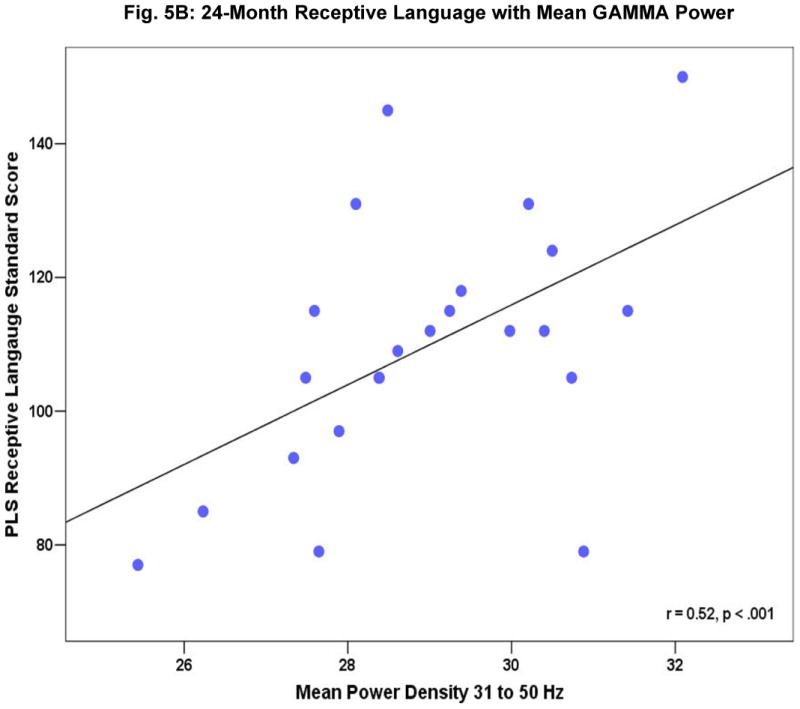
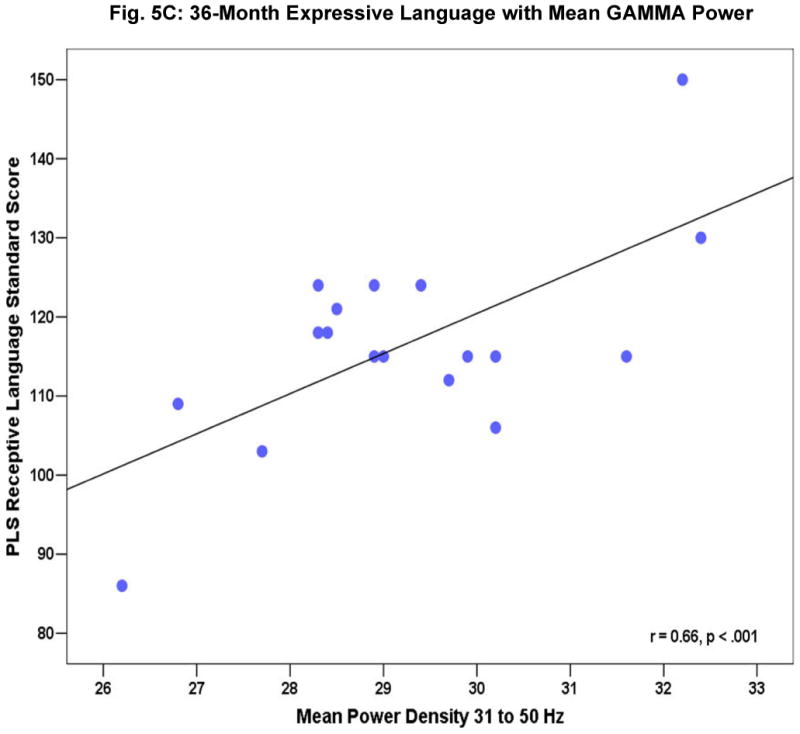
Relationship of resting frontal gamma EEG power to 24 month expressive (A) and receptive (B) language ability as measured by the Preschool Language Score [PLS], (C) PLS receptive language ability in 36-month old children.
A series of additional analyses were computed on those behavioral measures that were most robustly correlated with resting frontal gamma-band (31-50Hz) power: PLS expressive language at 16 months; PLS receptive, PLS expressive language and Bayley MDI at 24 months; and 36 month PLS receptive language as well as Stanford-Binet total composite IQ score. At 16 months, only expressive language ability showed a correlation with resting frontal gamma (p < 0.001). At 24 months both expressive and receptive language were significantly correlated (p < 0.001), and at 36 months, only receptive language was significantly correlated (p < 0.001), general cognitive ability as measured by the Stanford-Binet at 36 months only approached significance (p < 0.06).
3.3. Confirmatory Bootstrap Procedure
Since we had a relatively small number of children, convergent confirmation of the general conclusions presented here was computed using a bootstrap procedure. The bootstrap procedure [11] involves choosing random samples with replacement from a data set and analyzing each sample in the same way as our original data. The range of sample estimates obtained allows us to establish the certainty of the quantity we are estimating. Thus, the bootstrap procedure was calculated on two pairs of vectors, power-PLS-3 expressive scores and power-Bayley-MDI scores, with 1000 times resampling. The histogram of these results is shown in Figure 6A-B. These findings provide additional support for the reliability of our findings.
Figure 6 A-B.

Bootstrap method is shown on two pairs of vectors, power-PLS-3 Expressive scores (A) and Power-Bayley-MDI (B), with 1000 times resampling.
3.4. Post hoc Analysis of Electrode-by-Electrode Scalp Correlations
As we had focused on Frontal and Prefrontal regions based on a qualitative measure (i.e. examination of power topograms), we performed post hoc electrode-by-electrode analyses for all 62 scalp sites to examine which areas were most highly correlated with the behavioral outcomes of interest. The behavioral measures selected for additional analysis were those that were most robustly correlated with resting frontal gamma-band (31-50Hz) power (see Figure 4A-C). To illustrate the scalp regions where mean gamma power correlates with language and cognitive ability, Figure 7A-D shows a map of the electrode-by-electrode regression coefficients at 24 months for PLS expressive, PLS receptive language and Bayley MDI (Fig. 7A-B), indicating that the correlations are predominately in frontal, and to a lesser extent, temporal regions. Please note that the Bayley MDI [3] includes a large language component at 24 months and this may explain the stronger correlations seen in the left hemisphere here (Fig.7B) and for PLS Expressive language (Fig.7A). Electrode-by-electrode analysis at 36 months again revealed a frontal location for these correlations, with an apparent left-hemisphere bias for PLS receptive language (Fig. 7D).
Figure 7A-D.
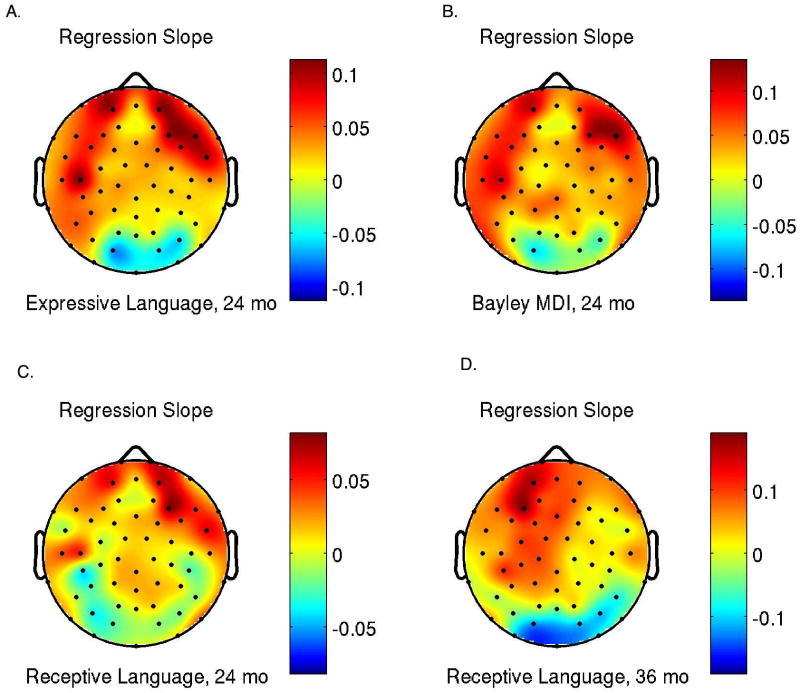
(A) Correlation topogram showing a map of the electrode-by-electrode regression slopes for PLS expressive language at 24 months. Correlations are broadly positive over most of the head, showing the strongest relationship frontally, with a lateral bias. (B) Correlation topogram showing a map of the electrode-by-electrode regression slopes for Bayley MDI at 24 months. Note again the left hemisphere bias in this cognitive measure with a heavy language loading. (C). Correlation topogram showing a map of the electrode-by-electrode regression slopes for PLS receptive language at 24 months. (D) Similar plot for PLS receptive language ability at 36 months. Again, highest correlations are seen in the frontal regions and there appears to be a left lateral bias.
Given the multiple electrode sites and behavioural variables, such post hoc analyses must be interpreted with caution since there is an unsolved multiple comparisons issue. However, when viewed as descriptive data these results allow insight into the pattern of correlations seen over the entire head as compared to targeted analysis of the frontal and prefrontal sensors illustrated in Figure 1.
4. Discussion
In summary, resting EEG gamma power was shown to be strongly associated with concurrent language and cognitive skills for all children. Significant correlations with behavior were observed over frontal and pre-frontal areas at ages 16, 24 and 36 months. Further, differences between the FH + cohort and the FH-controls groups in mean gamma power were apparent, with significantly lower mean power density across all ages in the FH+ group.
Recurrent thalamocortical and corticothalamic activity is thought to underlie organization and maintenance of gamma oscillations [37] with spontaneous generation of such high frequency oscillations involving excitatory pyramidal cells and inhibitory gamma-aminobutyric acid (GABA)-ergic interneurons [47]. Identification of the underlying EEG neural generators that support such activity is difficult, however maturation of thalamocortical and corticocortical circuits may well underlie the emergence of such oscillatory activity across development. Further, in older children (3 to 12 years), gamma power increases in tandem with maturation of information processing and cognitive function, with a peak shown at 4-5 years of age, especially over frontal regions [42]. We posit that development of cognitive abilities may occur simultaneously with the brain maturation necessary for high frequency oscillations.
The age range studied (16 through 36 months) is a particularly significant time developmentally. During this period there is a dramatic burst in linguistic and cognitive growth as well as in coordinated motor development. The average number of words understood increases from a mean of 170 words at 16 months, to approximately 500-700 words at 24 months, to about 1000 words at 36 months [2, 17]. In the midst of this “language burst” (between about 16 and 23 months), children typically acquire one or two words per day. Across this developmental period, children are also achieving important concepts like object permanence, engaging in symbolic reasoning (i.e. pretend play and discovering that words can stand for objects) and are beginning to think in increasingly complex ways, such as recalling events that occurred days earlier and understanding cause and effect.
Major changes in frontal and pre-frontal cortex are thought to accompany these striking changes in development, specifically steep increases in synaptic density and myelination in relevant cortical regions [24,33,34]. This developmental stage during which language is still an “emergent” skill, is also characterized by major reorganization of forebrain including maturation of language-related temporofrontal regions as well as thalamo-cortical and cortico-thalamic circuits that may subserve coordinated high-frequency [34,35,37].
Our findings are firmly based within this area of greatest change and reorganization. The results at 24 months, when there is still a large amount of variability in spoken language, include correlations with expressive as well as receptive language. By 36 months, when most children have completed this language burst and there is less variance in spoken language, the correlations are exclusively with language comprehension. Further, significant reductions in mean power density in the gamma range (30-50Hz) were seen as a function of higher risk for language-based learning disorders. Specifically lower power densities in frontal and prefrontal areas suggest delayed maturation and/or differing recruitment of brain areas. Thus a subset of the children who are at higher risk for language learning impairments (FH+) may lag in the emergence of these neural synchronies critical for cognitive and linguistic development.
The correlations we observed between some aspects of attention as measured by the TBAQ and gamma power were also quite interesting given the accumulating literature that supports attentional modulation of gamma activity [e.g. 1, 32, 43, 45] and findings that increases in gamma power can be seen as a function of arousal and orienting [14, 20, 36, 39]. For example, Fan et al. [14] analyzed EEG/ERP data collected during an attention network task involving various cuing conditions as to when a visual target would occur. The authors suggest that enhancement in the gamma band arises as a function of activation of the orienting network and emphasize the importance of examining power spectra in addition to ERPs to better understand the temporal characteristics of such attentional networks [14].
Another recent paper, reporting on findings from subdural electrocorticographic (ECoG) recordings of activity while human subjects performed a selective attention task, concludes that high gamma activity may serve as “an electrophysiological signature of selective attention” [36]. Our findings that 24 month children with higher gamma power in resting EEG also had better inhibitory control and more mature attention shifting seems likely to be more related to alertness-related modulation and orienting, as the children were not performing a specific task. We attempted to rule out differences in the children's arousal levels (see Footnote 1), but more subtle aspects of arousal that are not easily assessed might well play a part in these findings. Potential differences in modulation of attentional networks and the ability to facilitate selective attention are of intense interest in the study of children at high risk for language-based learning disorders. As we are following these children longitudinally, we hope to study further the links between attention, EEG power bands and later outcomes.
Importantly, our results demonstrate that infant cognitive ability correlates with power density functions even in an “idling” brain, suggesting that variation in maturational change in brain structure and connectivity might modulate the emergence of high-frequency oscillatory activity, which in turn might be a necessary condition for optimal progress in cognitive and linguistic function. Examination of EEG power spectra during the first three years of life may thus provide a window into the time course of early brain maturation, and serve as an early converging marker of risk for language learning and perhaps other cognitive disorders.
Acknowledgments
This research was supported by grants from NICHD (RO1-HD29419) to AAB, NSF #SBE-0542013 to the “Temporal Dynamics Of Learning Center”, by a Rutgers University Board of Trustees Excellence in Research Award to AAB, with additional funding from the Elizabeth H. Solomon Center for Neurodevelopmental Research.
Footnotes
One potentially confounding variable was the child's state of arousal during the EEG recording session. In order to ascertain whether the power estimates obtained were correlated to the child's arousal level we examined the routine scoring records collected during the EEG procedure. During the EEG session, child state was noted based on a standard 5-level score ranging from Calm to Restless. Pearson correlation coefficients were calculated between EEG power and the 5-point score. The correlation coefficient of r = 0.21, p > 0.05 suggests that EEG power and infant state during the EEG session are not significantly related.
Author contributions: A.A.B conceived and designed research; A.A.B. and N.C. performed research and data collection; Z.G. analyzed data; K.D.H performed confirmatory analyses. The paper was written by A.A.B. with help from N.C., Z.G. and K.D. H. All authors discussed the results and edited the manuscript.
Publisher's Disclaimer: This is a PDF file of an unedited manuscript that has been accepted for publication. As a service to our customers we are providing this early version of the manuscript. The manuscript will undergo copyediting, typesetting, and review of the resulting proof before it is published in its final citable form. Please note that during the production process errors may be discovered which could affect the content, and all legal disclaimers that apply to the journal pertain.
References and Notes
- 1.Basar E, Basar-Eroglu C, Karakas S, Schürmann M. Brain oscillations in perception and memory. Int J Psychophysiol. 2000;124:95–124. doi: 10.1016/s0167-8760(99)00047-1. [DOI] [PubMed] [Google Scholar]
- 2.Bates EA, Thal D, Janowsky JS. Early language development and its neural correlates. In: Rapin I, Segalowitz S, editors. Handbook of Neuropsychology. Vol. 7. Amsterdam: Elsevier; 1992. pp. 69–110. [Google Scholar]
- 3.Bayley N. The Bayley Scales of Infant Development. 2. New York, NY: Psychological Corporation; 1993. [Google Scholar]
- 4.Benasich AA, Choudhury N, Friedman JT, Realpe Bonilla T, Chojnowska C, Gou Z. Infants as a prelinguistic model for language learning impairments: Predicting from event-related potentials to behavior. Neuropsychologia. 2006;44:396–411. doi: 10.1016/j.neuropsychologia.2005.06.004. [DOI] [PMC free article] [PubMed] [Google Scholar]
- 5.Benasich AA, Tallal P. Infant discrimination of rapid auditory cues predicts later language impairment. Behav Brain Res. 2002;136:31–49. doi: 10.1016/s0166-4328(02)00098-0. [DOI] [PubMed] [Google Scholar]
- 6.Bosboom JL, Stoffers D, Stam CJ, van Dijk BW, Verbunt J, Berendse HW, Wolters ECh. Resting state oscillatory brain dynamics in Parkinson's disease: an MEG study. Clin Neurophysiol. 2006;117(11):2521–31. doi: 10.1016/j.clinph.2006.06.720. [DOI] [PubMed] [Google Scholar]
- 7.Choudhury N, Benasich AA. Familial aggregation in a sample of infants born into families with a history of language-based learning impairments. J Speech Lang Hear Res. 2003;46:261–272. doi: 10.1044/1092-4388(2003/021). [DOI] [PMC free article] [PubMed] [Google Scholar]
- 8.Chugani HT, Phelps ME, Mazziotta JC. Positron emission tomography study of human brain functional development. Ann Neurol. 1987;22:487–843. doi: 10.1002/ana.410220408. [DOI] [PubMed] [Google Scholar]
- 9.Clarke AR, Barry RJ, McCarthy R, Selikowitz M. Age and sex effects in the EEG: development of the normal child. Clin Neurophysiol. 2001;112(5):806–14. doi: 10.1016/s1388-2457(01)00488-6. [DOI] [PubMed] [Google Scholar]
- 10.Csibra G, Davis G, Spratling MW, Johnson MH. Gamma Oscillations and Object Processing in the Infant Brain. Science. 2000;290:1582–1585. doi: 10.1126/science.290.5496.1582. [DOI] [PubMed] [Google Scholar]
- 11.Efron B, Tibshirani RJ. An Introduction to the Bootstrap. New York: Chapman and Hall; 1994. p. 456. [Google Scholar]
- 12.Engel AK, Fries P, Singer W. Dynamic predictions: Oscillations and synchrony in top-down processing. Nat Rev Neurosci. 2001;2:704–716. doi: 10.1038/35094565. [DOI] [PubMed] [Google Scholar]
- 13.Eulitz C, Maess B, Pantev C, Friederici AD, Feige B, Elbert T. Oscillatory neuromagnetic activity induced by language and non-language stimuli. Cog Brain Res. 1996;4:121–132. [PubMed] [Google Scholar]
- 14.Fan J, Byrne J, Worden MS, Guise KG, McCandliss BD, Fossella J, Posner MI. The relation of brain oscillations to attentional networks. J Neurosci. 2007;27:6197–6206. doi: 10.1523/JNEUROSCI.1833-07.2007. [DOI] [PMC free article] [PubMed] [Google Scholar]
- 15.Farran DC, Kasari K, Comfort M, Jay S. Parent/Caregiver Involvement Scale Workbook. Nashville, TN: Peabody College, Vanderbilt Univ; 1986. [Google Scholar]
- 16.Fell J, Klaver P, Lehnertz K, Grunwald T, Schaller C, Elger C, Fernandez G. Human memory formation is accompanied by rhinal-hippocampal coupling and decoupling. Nat Neurosci. 2001;4:1259–1264. doi: 10.1038/nn759. [DOI] [PubMed] [Google Scholar]
- 17.Fenson LS, Dale PS, Reznick JS, Thal D, Bates E, Hartung JP, Pethick S, Reilly JS. Mac Arthur Communicative Development Inventories. User's Guide and Technical Manual. San Diego, CA: Singular; 1993. [Google Scholar]
- 18.Fries P, Fernandez G, Jensen O. When neurons form memories. Trends Neurosci. 2003;26:123–124. doi: 10.1016/S0166-2236(03)00023-7. [DOI] [PubMed] [Google Scholar]
- 19.Goldsmith HH. Studying temperament via construction of the Toddler Behavior Assessment Questionnaire. Child Dev. 1996;67:218–235. [PubMed] [Google Scholar]
- 20.Gonzalez Andino SL, Michel CM, Thut G, Landis T, Grave de Peralta R. Prediction of response speed by anticipatory high-frequency (gamma band) oscillations in the human brain. Hum Brain Mapp. 2005;24(1):50–8. doi: 10.1002/hbm.20056. [DOI] [PMC free article] [PubMed] [Google Scholar]
- 21.Gruber T, Müller MM, Keil A. Modulation of induced gamma band responses in a perceptual learning task in the human EEG. J Cog Neurosci. 2002;14:732–744. doi: 10.1162/08989290260138636. [DOI] [PubMed] [Google Scholar]
- 22.Huang C, Wahlund L, Dierks T, Julin P, Winblad B, Jelic V. Discrimination of Alzheimer's disease and mild cognitive impairment by equivalent EEG sources: a cross-sectional and longitudinal study. Clin Neurophysiol. 2000;111:1961–1967. doi: 10.1016/s1388-2457(00)00454-5. [DOI] [PubMed] [Google Scholar]
- 23.Hollingshead AB. The Four-Factor Index of Social Status. New Haven, CT: Department of Sociology, Yale Univ; 1975. [Google Scholar]
- 24.Huttenlocher PR. Morphometric study of human cerebral cortex development. Neuropsychologia. 1990;28:517–527. doi: 10.1016/0028-3932(90)90031-i. [DOI] [PubMed] [Google Scholar]
- 25.Jeong J. EEG dynamics in patients with Alzheimer's disease. Clin Neurophysiol. 2004;115(7):1490–1505. doi: 10.1016/j.clinph.2004.01.001. [DOI] [PubMed] [Google Scholar]
- 26.John ER, Ahn H, Pricep L, Trepetin M, Brown D, Kaye H. Developmental equations for the electroencephalogram. Science. 1980;210:1255–1258. doi: 10.1126/science.7434026. [DOI] [PubMed] [Google Scholar]
- 27.Kaiser J, Lutzenberger W. Induced gamma-band activity and human brain function. Neuroscientist. 2003;9(6):475–484. doi: 10.1177/1073858403259137. [DOI] [PubMed] [Google Scholar]
- 28.Kaiser J, Lutzenberger W. Human gamma-band activity: A window to cognitive processing. NeuroReport. 2005;16:207–211. doi: 10.1097/00001756-200502280-00001. [DOI] [PubMed] [Google Scholar]
- 29.Kaufman J, Csibra G, Johnson MH. Oscillatory activity in the infant brain reflects object maintenance. Proc Natl Acad Sci USA. 2005;102:15271–15274. doi: 10.1073/pnas.0507626102. [DOI] [PMC free article] [PubMed] [Google Scholar]
- 30.Lisman JE, Idiart MAP. Storage of 7 +/- 2 short-term memories in oscillatory subcycles. Science. 1995;267:1512–1515. doi: 10.1126/science.7878473. [DOI] [PubMed] [Google Scholar]
- 31.Miltner WH, Braun C, Arnold M, Witte H, Taub E. Coherence of gamma-band EEG activity as a basis for associative learning. Nature. 1999;397:434–436. doi: 10.1038/17126. [DOI] [PubMed] [Google Scholar]
- 32.Pantev C, Makeig S, Hoke M, Galambos R, Hampson S, Gallen C. Human auditory evoked gamma-band magnetic fields. Proc Natl Acad Sci USA. 1991;88:8996–9000. doi: 10.1073/pnas.88.20.8996. [DOI] [PMC free article] [PubMed] [Google Scholar]
- 33.Paus T, Collins DL, Evans AC, Leonard G, Pike B, Zijdenbos A. Maturation of white matter in the human brain: A review of magnetic resonance studies. Brain Res Bull. 2001;54:255–266. doi: 10.1016/s0361-9230(00)00434-2. [DOI] [PubMed] [Google Scholar]
- 34.Pujol J, Soriano-Mas C, Ortiz H, Sebastián-Gallés N, Losilla JM, Deus J. Myelination of language-related areas in the developing brain. Neurology. 2006;66:339–343. doi: 10.1212/01.wnl.0000201049.66073.8d. [DOI] [PubMed] [Google Scholar]
- 35.Pulvermüller F, Eulitz C, Pantev C, Mohr B, Feige B, Lutzenberger W, Elbert T, Birbaumer N. High-frequency cortical responses reflect lexical processing: an MEG study. Electroencephalogr Clin Neurophysiol. 1996;98:76–85. doi: 10.1016/0013-4694(95)00191-3. [DOI] [PubMed] [Google Scholar]
- 36.Ray S, Niebur E, Hsiao SS, Sinai A, Crone NE. High-frequency gamma activity (80-150Hz) is increased in human cortex during selective attention. Clin Neurophysiol. 2008;119(1):116–133. doi: 10.1016/j.clinph.2007.09.136. [DOI] [PMC free article] [PubMed] [Google Scholar]
- 37.Ribary U, Ioannides AA, Singh KD, Hasson R, Bolton JPR, Lado F, Mogilner A, Llinas R. Magnetic field tomography of coherent thalamocortical 40-Hz oscillations in humans. Proc Natl Acad Sci, USA. 1991;88:11037–11041. doi: 10.1073/pnas.88.24.11037. [DOI] [PMC free article] [PubMed] [Google Scholar]
- 38.Rodriguez E, George N, Lachaux JP, Martinerie J, Renault B, Varela FJ. Perception's shadow: Long-distance synchronization of human brain activity. Nature. 1999;397:430–433. doi: 10.1038/17120. [DOI] [PubMed] [Google Scholar]
- 39.Singer W. Neuronal synchrony: a versatile code for the definition of relations? Neuron. 1999;24:49–65. doi: 10.1016/s0896-6273(00)80821-1. [DOI] [PubMed] [Google Scholar]
- 40.Southgate V, Csibra G, Kaufman J, Johnson MH. Distinct processing of objects and faces in the infant brain. J Cogn Neurosci. 2008;20:741–749. doi: 10.1162/jocn.2008.20052. [DOI] [PubMed] [Google Scholar]
- 41.Stoffers D, Bosboom JL, Deijen JB, Wolters EC, Berendse HW, Stam CJ. Slowing of oscillatory brain activity is a stable characteristic of Parkinson's disease without dementia. Brain. 2007;130(Pt 7):1847–60. doi: 10.1093/brain/awm034. [DOI] [PubMed] [Google Scholar]
- 42.Takano T, Ogawa T. Characterization of developmental changes in EEG gamma-band activity during childhood using the autoregressive model. Acta Paediatr Jpn. 1998;40:446–452. doi: 10.1111/j.1442-200x.1998.tb01966.x. [DOI] [PubMed] [Google Scholar]
- 43.Tallon-Baudry C, Bertrand O. Oscillatory gamma activity in humans and its role in object representation. Trends Cogn Sci. 1999;3:151–162. doi: 10.1016/s1364-6613(99)01299-1. [DOI] [PubMed] [Google Scholar]
- 44.Thorndike RL, Hagen EP, Sattler JM. The Stanford Binet Intelligence Scale: Fourth Edition. Chicago, IL: Riverside Publishing Company; 1986. [Google Scholar]
- 45.Tiitinen H, Sinkkonen J, Reinikainen K, Alho K, Lavikainen J, Näätänen R. Selective attention enhances the auditory 40-Hz transient response in humans. Nature. 1993;364:59–60. doi: 10.1038/364059a0. [DOI] [PubMed] [Google Scholar]
- 46.Varela F, Lachaux JP, Rodriguez E, Martinerie J. The brain web: Phase synchronization and large-scale integration. Nat Rev Neurosci. 2001;2:229–239. doi: 10.1038/35067550. [DOI] [PubMed] [Google Scholar]
- 47.Whittington MA, Traub RD, Kopell N, Ermentrout B, Buhl EH. Inhibition-based rhythms: experimental and mathematical observations on network dynamics. Int J Psychophysiol. 2000;38:315–336. doi: 10.1016/s0167-8760(00)00173-2. [DOI] [PubMed] [Google Scholar]
- 48.Zimmerman IL, Steiner VG, Pond RE. Preschool Language Scale-3. San Antonio, TX: The Psychological Corporation; 1992. [Google Scholar]